Article

Facile Synthesis of Hafnium Oxide Nanoparticle Decorated on Graphene Nanosheet and Its Photocatalytic Degradation of Organic Pollutants under UV-Light Irradiation

by
Venkatachalam Jayaraman
1,2,†,
Shanmugam Mahalingam
1,†,
Shanmugavel Chinnathambi
3,*,
Ganesh N. Pandian
3,
Aruna Prakasarao
4,
Singaravelu Ganesan
4,
Jayavel Ramasamy
5,
Sivasankaran Ayyaru
1,* and
Young-Ho Ahn
1,*
1
Department of Civil Engineering, Yeungnam University, Gyeongsan 38541, Korea
2
Institute of Leather Technology, Tharamani, Chennai 600113, India
3
Institute for Integrated Cell-Material Sciences, Institute for Advanced Study, Kyoto University, Kyoto 606-8501, Japan
4
Department of Medical Physics, Anna University, Chennai 600025, India
5
Centre for Nanoscience and Technology, Anna University, Chennai 600025, India
*
Authors to whom correspondence should be addressed.
These authors contributed equally to this work.
Appl. Sci. 2022, 12(21), 11222; https://doi.org/10.3390/app122111222
Submission received: 16 October 2022 / Revised: 3 November 2022 / Accepted: 3 November 2022 / Published: 5 November 2022
(This article belongs to the Special Issue Next Steps for the Production of Nanoparticles for Nanomedicine)

Abstract

:
The HfO2 nanoparticles and the nanocomposites of HfO2-graphene (10, 30, and 50 wt%) were prepared via precipitation and simple mixing method. The XRD pattern confirmed the presence of monoclinic HfO2 and hexagonal graphene in the nanocomposite. Raman spectroscopy studies revealed the formation of HfO2-graphene nanocomposite. According to SEM and TEM images the HfO2, NPs are spherical, and their size is less than 10 nm, anchored on the surface of the graphene sheets. The EDX spectrum shows carbon, oxygen, and HfO2 and reveals the formation of the HfO2-graphene nanocomposite. The UV-vis absorption spectra show the optical properties of synthesized HfO2-graphene nanocomposite. The study examines the influence of different ratios of the addition of graphene on the photocatalytic activity of HfO2-graphene. It was found that the HfO2-graphene (50 wt%) 40 mg nanocomposite exhibits enhanced photocatalytic activity than the bare HfO2 towards the methylene blue photodegradation, an aromatic pollutant in water under UV light irradiation, which can be applied optimally for individually wastewater management system. The HfO2-graphene (50 wt%) photocatalyst degrades 81 ± 2% of tetracycline in 180 min, implying that tetracycline can be degraded more efficiently under UV light. The enhancement in photocatalytic activity under UV light illumination can be attributed to the effective separation of photogenerated electrons, inhibiting recombination in the HfO2-graphene composite.

1. Introduction

Accumulate persistent organic pollutants (POPs) in the food chain adversely affect human health and the environment. Industrial chemicals (e.g., textile dyes), pesticides, solvents, and pharmaceuticals (such as tetracycline) are the different types of POPs [1,2]. A prominent POP in this group is tetracycline, which is used extensively as an antibiotic in veterinary medicine and aquaculture [3,4]. Therefore, it is essential to find practical solutions to remove such POPs from the environmental [5,6]. Photocatalysis has gained recognition as an environmentally friendly technology at ambient temperature for efficiently mineralizing POPs [7,8,9].
This study uses methylene blue and tetracycline as a model of organic pollutants. It endangers aquatic biodiversity when used as a dye or a decontaminant, besides removing organic pollutants from organic solutions and releasing toxic compounds due to chemical and biological reaction processes [10,11]. When irradiated using an appropriate catalyst, methylene blue has been noted as photobleached, photodegraded, and demethylated [12,13]. With its ability to decimate toxic environmental contaminants, photocatalysis has been given considerable attention. In ecological and biomedical applications, semiconducting metal oxide heterogeneous photocatalysts are exclusively used [14,15,16,17]. Owing to their similar bandgap, TiO2 and ZnO semiconductors have been widely studied as effective photocatalysts for the photodegradation of organic pollutants [18,19,20]. MB also causes the depletion of the dissolved oxygen in water bodies. Different procedures have evolved over the years to enhance the photocatalytic performance of the semiconductor photocatalysts, such as noble metal loading and semiconductor composites and textural design [21]. The specific property of hollow nanostructures of the TiO2 nanocrystals with internal pores is instrumental for their augmented photocatalytic activity compared to TiO2 solid nanocrystals [22]. The higher charge carrier mobility of the anatase phase TiO2 enables it to exhibit higher photocatalytic activity than the rutile phase [23,24]. Sangpour et al. demonstrated that noble metals, such as Cu, Au, and Ag, could increase the efficiency of photocatalysis [25]. Of late, graphene has emerged to hold a pivotal position in the environment and in energy [26,27]. Graphene, with the structure of a two-dimensional macromolecular sheet of carbon atoms, is an excellent electrical conductor with unique mechanical properties and has proved to be an efficient electron–transport material for photocatalytic processes, and it is better than the graphite-like Carbon, C60, polyaniline [28,29,30].
Graphene, due to its high surface area and excellent electrical and mechanical properties, is much sought after as a novel substrate for creating hybrid nanostructures in a combination of a variety of nanomaterials by incorporating graphene with metals, metal oxides, and polymers; new applications have been developed in recent times [31,32,33,34]. In the degradation of rhodamine B, the graphene/TiO2 nanocrystal hybrid material exhibits excellent photocatalytic activity, unlike the other forms of TiO2 [35]. The enhanced photocatalytic activity is more shown in the catalytic degradation of MB under UV light irradiation by the P25-graphene photocatalyst than by the bare P25 [36]. Similarly, rather than the pure SnO2 nanoparticles, graphene-embedded SnO2 nanoparticles exhibited an improved photocatalytic degradation activity with the MB under sunlight [37]. The graphene sheets/ZnO nanocomposites, which show photocatalytic activity, are eminently suitable for various applications in environmental protection [38].
The distinct physical and chemical properties of hafnium oxide (HfO2) have made it considerably investigated as an essential dielectric material for a wide range of applications such as dosimeters, biosensors, radiosensitizers, and biomaterials [39,40,41,42]. It is common knowledge that TiO2 and ZnO are conventional semiconductor photocatalysts. In group IV of the periodic table, hafnium has been included as the metal oxide along with titanium and zirconium. Enhanced photocatalytic activity is induced by hafnium-doped ZnO under sunlight irradiation for MB degradation, and it does so more effectively than the pure ZnO [43]. Cho et al. (2013) have reported that ZrO2-Graphene (50 wt%) nanocomposites photodegrade the MB under ultra-violet irradiation [44]. Hence, HfO2, belonging to the same category of ZrO2, can also exhibit similar properties to ZrO2. As such, motivating research towards the HfO2-graphene nanocomposite enhances the photodegrade of MB dye under ultraviolet irradiation. It is well known that able intrinsic oxygen vacancies, with various defect levels in HfO2, are used to utilize the electron-hole pairs more effectively [45,46].
There seems to be earlier studies on the synthesis, characterization, and photocatalytic activity of the HfO2-graphene composite. By precipitation and chemical methods, HfO2 nanoparticles and graphene were synthesized by the solution mixing method, and HfO2-graphene composites that were prepared with different amounts of graphene (10, 30, and 50 wt%) were loaded on the surface of catalyst particles (HfO2) to form HfO2-graphene nanocomposites, and their photocatalytic activity was studied and evaluated.

2. Materials and Methods

2.1. Materials

Hafnium tetrachloride (HfCl4, 98%) and NaOH (sodium hydroxide, 97%) were purchased from Sigma-Aldrich, USA. Natural graphite powder (99.99%) was obtained from Alfa-Aesar. All the chemicals parched in the analytical grade were used without further purification. Hydrazine hydrate (H6N2O, 80%) was procured by Merck. Methylene blue (MB) was used as the model dye for photocatalytic studies.

2.2. Preparation of Hafnium Oxide Nanoparticle

The HfO2 NPs were synthesized by the precipitation method (see Equations (1) and (2)) [47]. In brief, 0.4 M solution of NaOH was slowly added dropwise into 0.1 M solutions (HfCl4) (that is, 100 mL of NaOH and HfCl4 with a 4:1 volume ratio of each solution allowed for vigorous stirring for 8 h). Finally, the white-colored precipitate was obtained as a hafnium hydroxide. Then, we used deionized water to wash white precipitate and centrifuged at 4000 rpm. The product was dried at 100 °C for 3 h, then calcined at 500 °C for 2 h to get HfO2 NPs.
Hf Cl 4   +   4 NaOH HfO OH 2   +   4 NaCl + H 2 O
HfO OH 2 HfO 2   +   H 2 O

2.3. Preparation of Graphene

The typical GO synthesis was followed by the modified Hummer’s method [48]. The prepared GO was reduced to graphene by successive chemical reduction methods [49]. The synthesized GO (200 mg) was dispersed in 100 mL of DI, and the solution was ultra-sonicated for 1 h. We used a 100 °C oil bath to heat the GO solution. Later, 3 mL of hydrazine hydrate was added at constant stirring. The solid-state product was obtained by centrifugation and washed several times with DI and ethanol. At last, we used vacuum oven for 24 h at 60 °C to obtain the dried graphene.

2.4. Synthesis of HfO2-Graphene Nanocomposite

To synthesize the HfO2-graphene nanocomposites with different wt%, a solution mixing method was performed using DI as a solvent. Initially, 90 mg of HfO2 and 10 mg of graphene were sonicated separately in 50 mL of DI for 90 min. Afterward, the graphene solution was mixed dropwise into the HfO2 solution and allowed constant stirring for 30 min. Then, the mixing solution was aged with constant stirring for 3 h to form a homogeneous suspension. The obtained suspension was then dried in the oven at 80 °C for 12 h. The same strategy was used to synthesize the remaining composites by changing the graphene content.

2.5. Characterization Methods

The X-ray diffraction (XRD) patterns were analyzed to identify the nanocomposites’ crystalline phase with Rigakumultiflex using Cu kα (λ = 1.54 Å) radiation. Raman spectra were recorded using Lab Ram HR 800 Micro Raman spectrometer (Horibo Jobin-Yvon, Longjumeau, France), with Ar-ion Laser having an excitation wavelength of 514 nm. The particle size and surface morphology of HfO2 NPs were evaluated by a scanning electron microscope (VEGA3 TESCAN, Germany), and the HR-TEM operated with an acceleration voltage of 120 kV (Hitachi H-7650, Singapore). The UV spectra of HfO2 NPs were studied using a UV-Vis spectrometer (Lamda35, Perkin-Elmer, Waltham, MA, USA). The photocatalytic activity of the prepared catalysts was measured by the degradation of MB and tetracycline under UV light.

2.6. Photocatalytic Experiments

The methylene blue (MB) photodegradation was captured under UV light based on the absorption spectroscopic technique. For this analysis, 0.1 mmole of the MB dye was dispersed in 500 mL of the aqueous solution with the addition of 15 mg of HfO2-graphene composite. Before illumination, the prepared solution was homogenized under stirring for 30 min in a dark room to achieve adsorption-desorption equilibrium between the catalyst and dye. We used a 4 W UV lamp (Philips, TUV4 W/G4 T5) with 365 nm wavelength for the irradiation experiment. Later, we collected 3 mL of the sample with a particular time interval of UV illumination. Then, the sample was centrifuged at 3000 rpm for 5 min. The final sample absorption spectra were measured using a UV-Vis spectrophotometer.
For the tetracycline experiment, a 250 mL glass reactor was filled with 20 ppm aqueous tetracycline solution mixed with 15 mg of HfO2-graphene (50 wt%) as a photocatalyst. Subsequently, the reaction mixture was stirred for 2 h in the dark to reach a complete equilibrium between adsorption and desorption. The solutions were then exposed to UV light irradiation while being stirred continuously over 180 min. At 30-min intervals, 3 mL of the suspension was taken to measure the degradation of tetracycline. Before examining UV-visible absorption, the suspension of the tetracycline solution was centrifuged to remove the catalyst. A control experiment without the photocatalyst was also conducted.

3. Results and Discussion

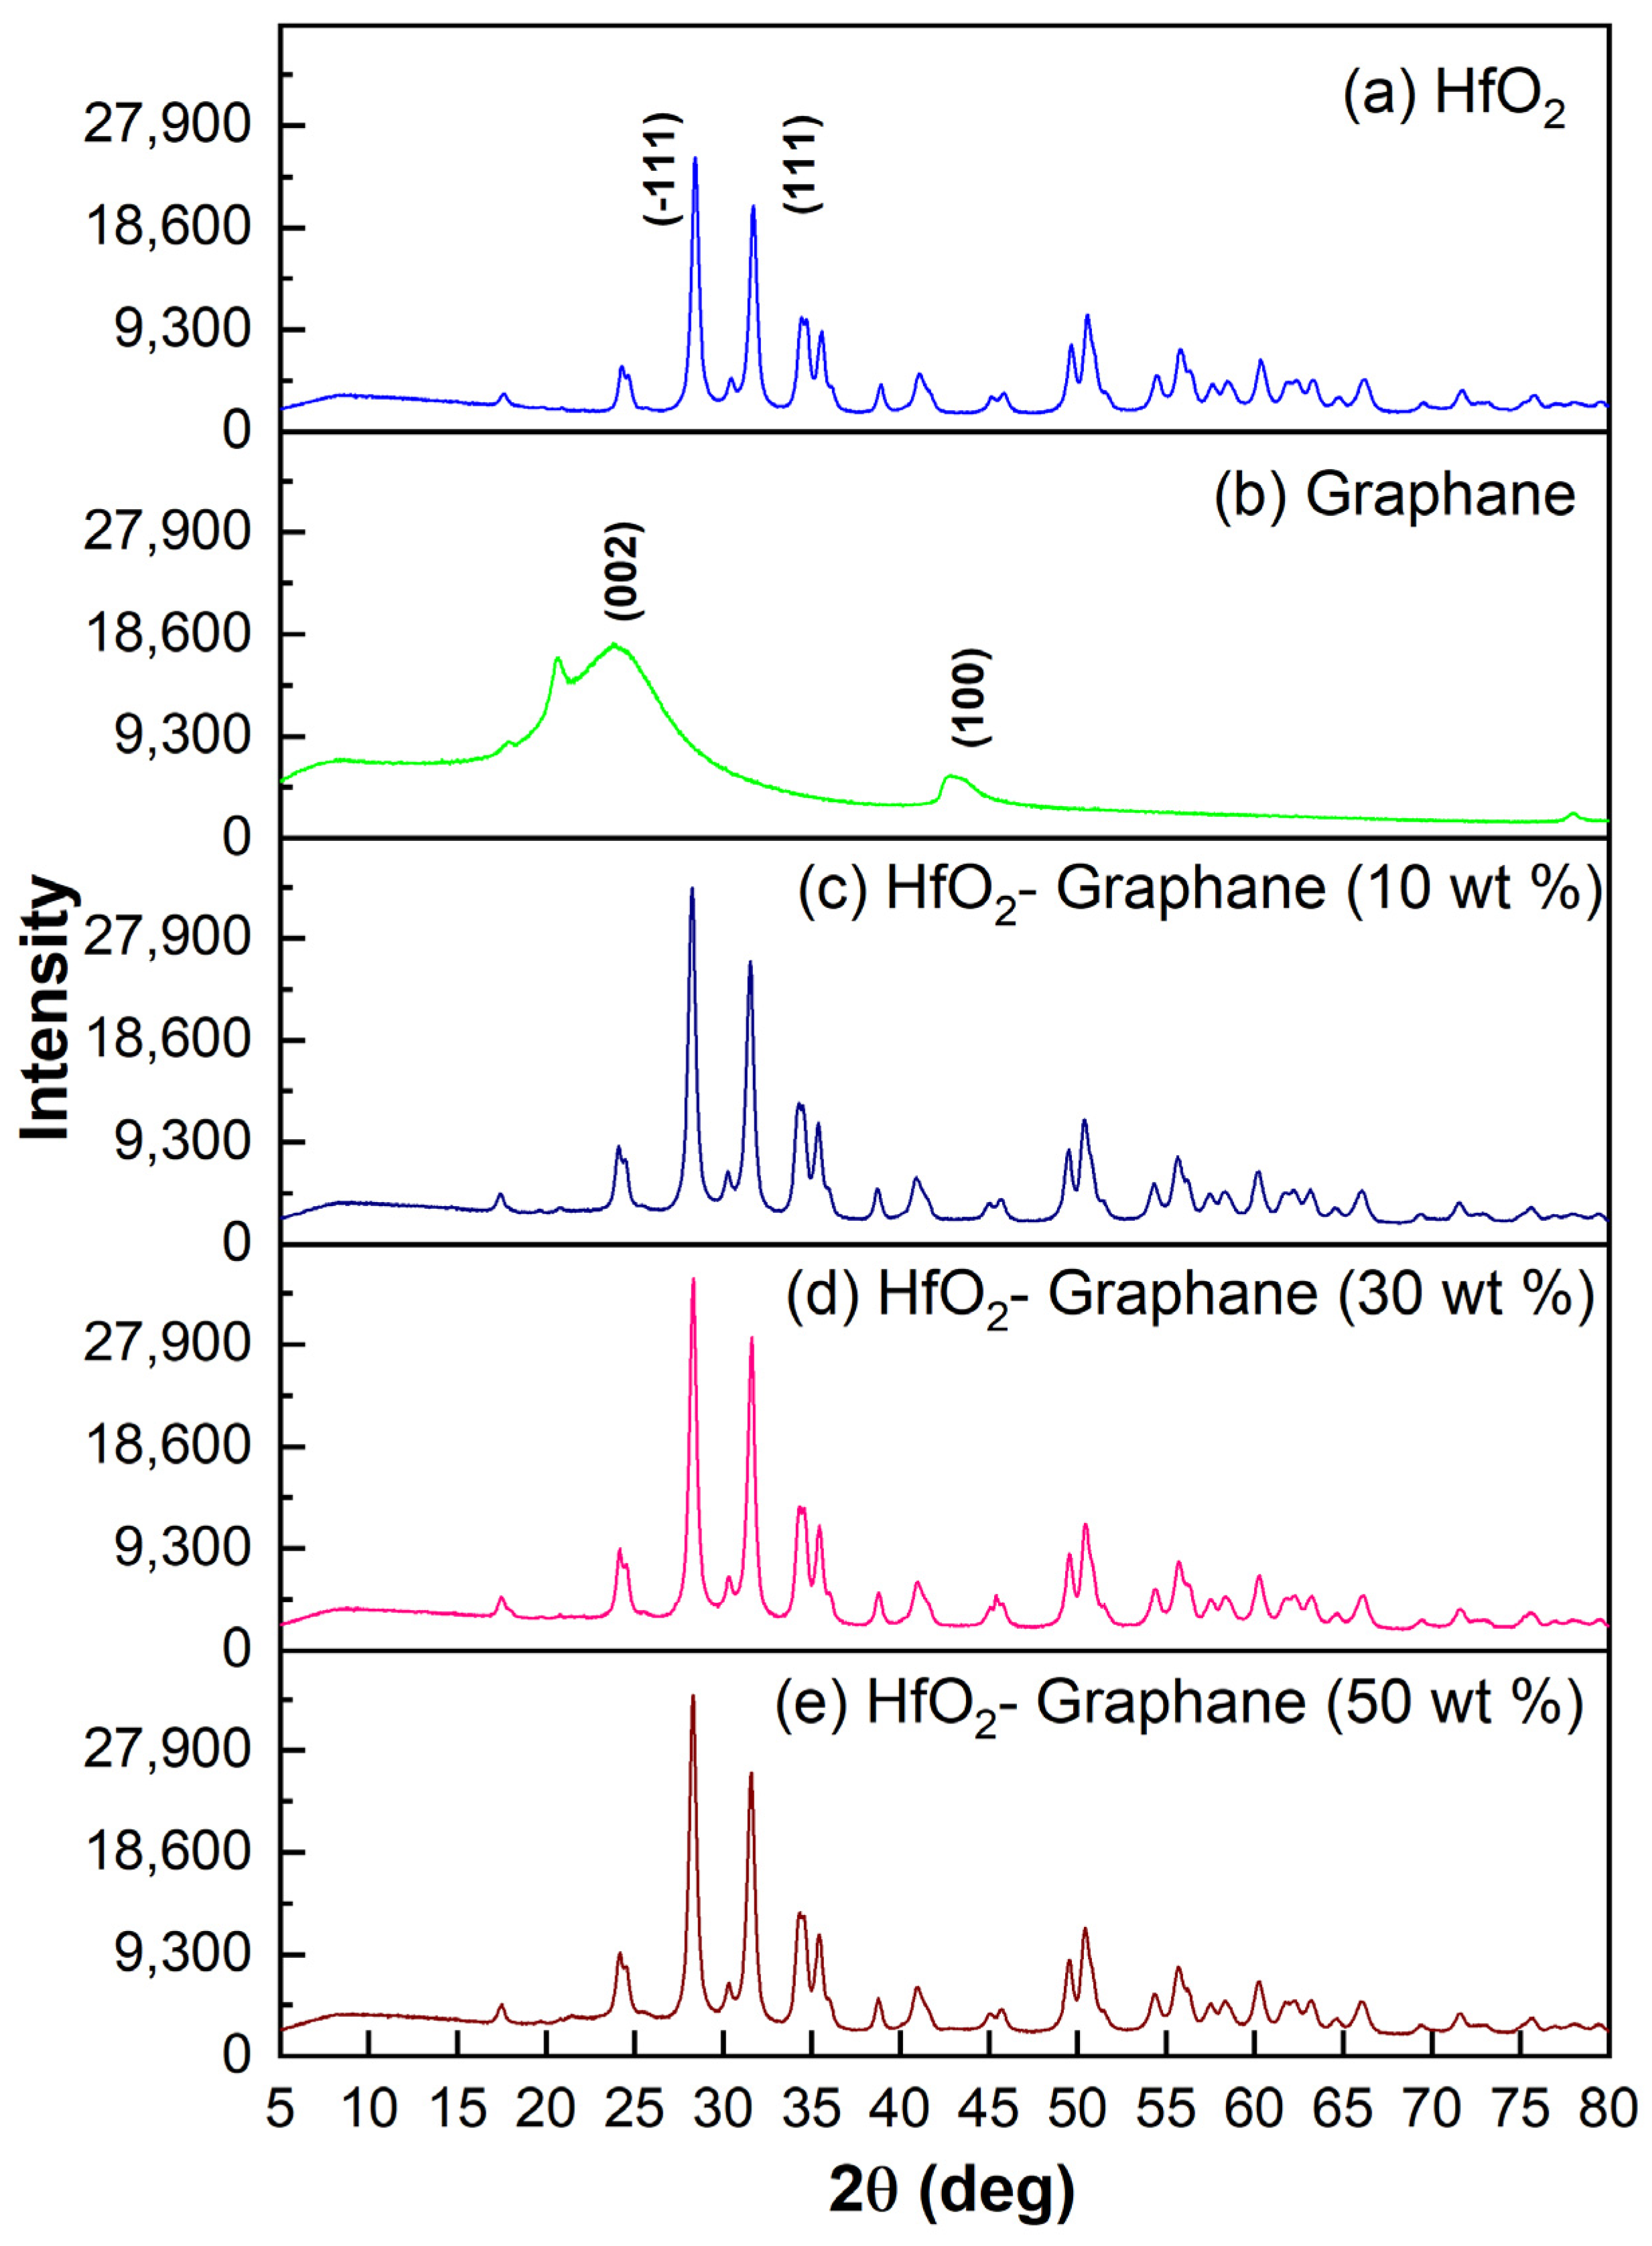
3.1. X-ray Diffraction

The prepared catalysts’ crystallinity, purity, and particle size were characterized by powder X-ray diffraction. Figure 1 shows the XRD patterns of HfO2, graphene, and HfO2-graphene composites. The XRD pattern of pure HfO2 (Figure 1) exhibited the monoclinic phase with a preferential orientation of the (111) plane. Debye Scherer’s formula estimates the particle size (7 nm) of the HfO2.
D   =   k λ / β cos θ
where k = dimensionless constant (0.94). λ indicates X-ray wavelength, β peak full width half maximum, and θ represents Braggs angle.
The observed XRD pattern and its peaks are matched with the monoclinic HfO2 phase (JCPDS card No: 06-0318). We don’t find any other diffraction peaks, indicating the catalysts’ successful preparation. A broad and robust peak appeared at a 20 value of 24 °C, which corresponded to the (002) plane of graphene (Figure 1b) [50].
In the XRD pattern of the graphene-HfO2 nanocomposites (Figure 1c–e), it is observed that the Graphene-HfO2 nanocomposites with different weight addition ratios (10, 30, and 50 wt%) of graphene exhibit similar XRD patterns. Notably, the peaks corresponding to graphene disappeared in the graphene-HfO2 nanocomposites. The reason is that the main characteristic peak of graphene, that corresponds to (002) plane, might be shielded by the main peak of the monoclinic HfO2 that belongs to the (-111) plane [51,52].

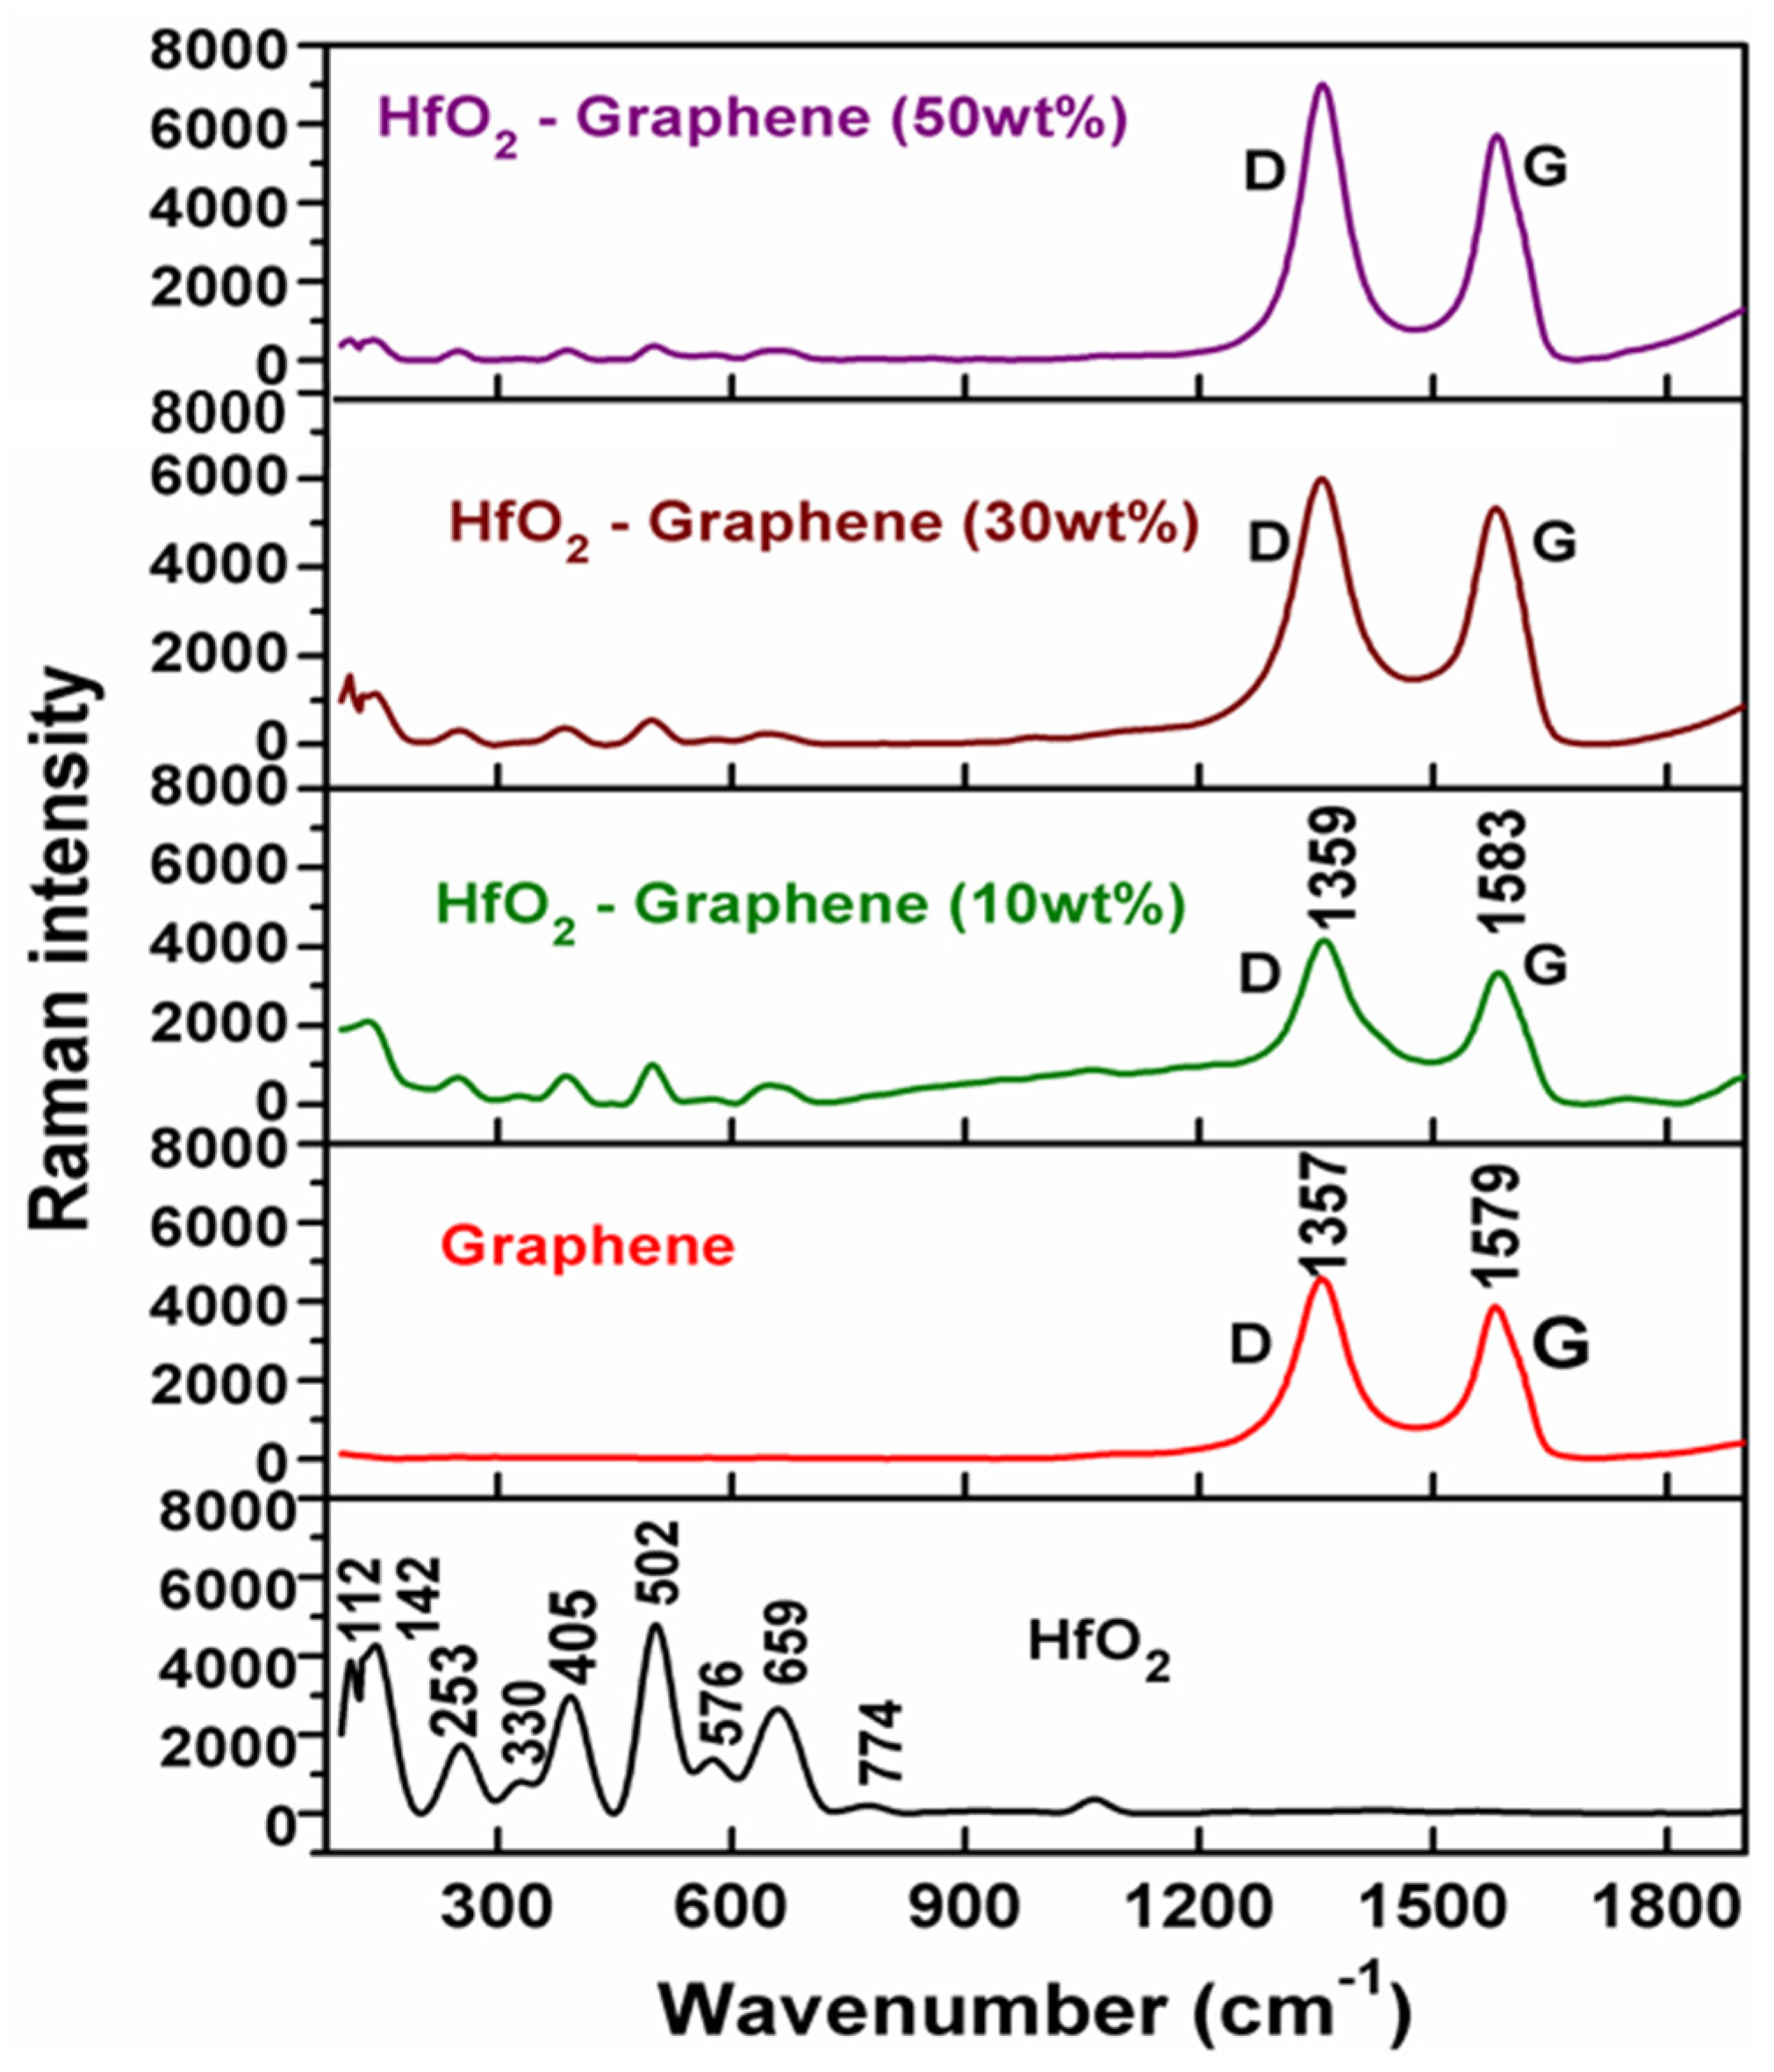
3.2. Raman Spectroscopy

Raman spectroscopic analyses were carried out to ratify the composite confirmation. Figure 2 compares the Raman spectra of HfO2, graphene and graphene-HfO2 nanocomposites. In Figure 2, the Raman peaks at 112, 142, 258, 502, and 576 cm−1 could be attributed to the Ag modes of HfO2, whereas the peaks at 330, 405,659, and 774 cm-1 are assigned to Bg modes of the HfO2 monoclinic. These peaks are similar to reported values for monoclinic HfO2 [53]. The unique peaks of graphene (Figure 2) can be found at 1357 and 1583 cm−1, corresponding to D (where the D peak is a defect peak owing to intervallic scattering) and G (G refers to the graphene G peak) peaks [54]. In the Raman spectra of HfO2-graphene nanocomposite, it is worth noting that the typical graphene peaks were also observed in addition to the monoclinic of HfO2 peaks (Figure 2). The appearance of the D & G bands corresponds to graphene. Since the wt% of graphene increases, the corresponding D & G bands also increased. The calculated relative amplitude ratios of the “D” and “G” bands were similar, and the values of graphene and graphene–HfO2 (10, 30, 50 wt%) were 0.86 and 0.85, respectively. These results reveal the successive decoration of the HfO2 nanoparticles on the graphene sheets.

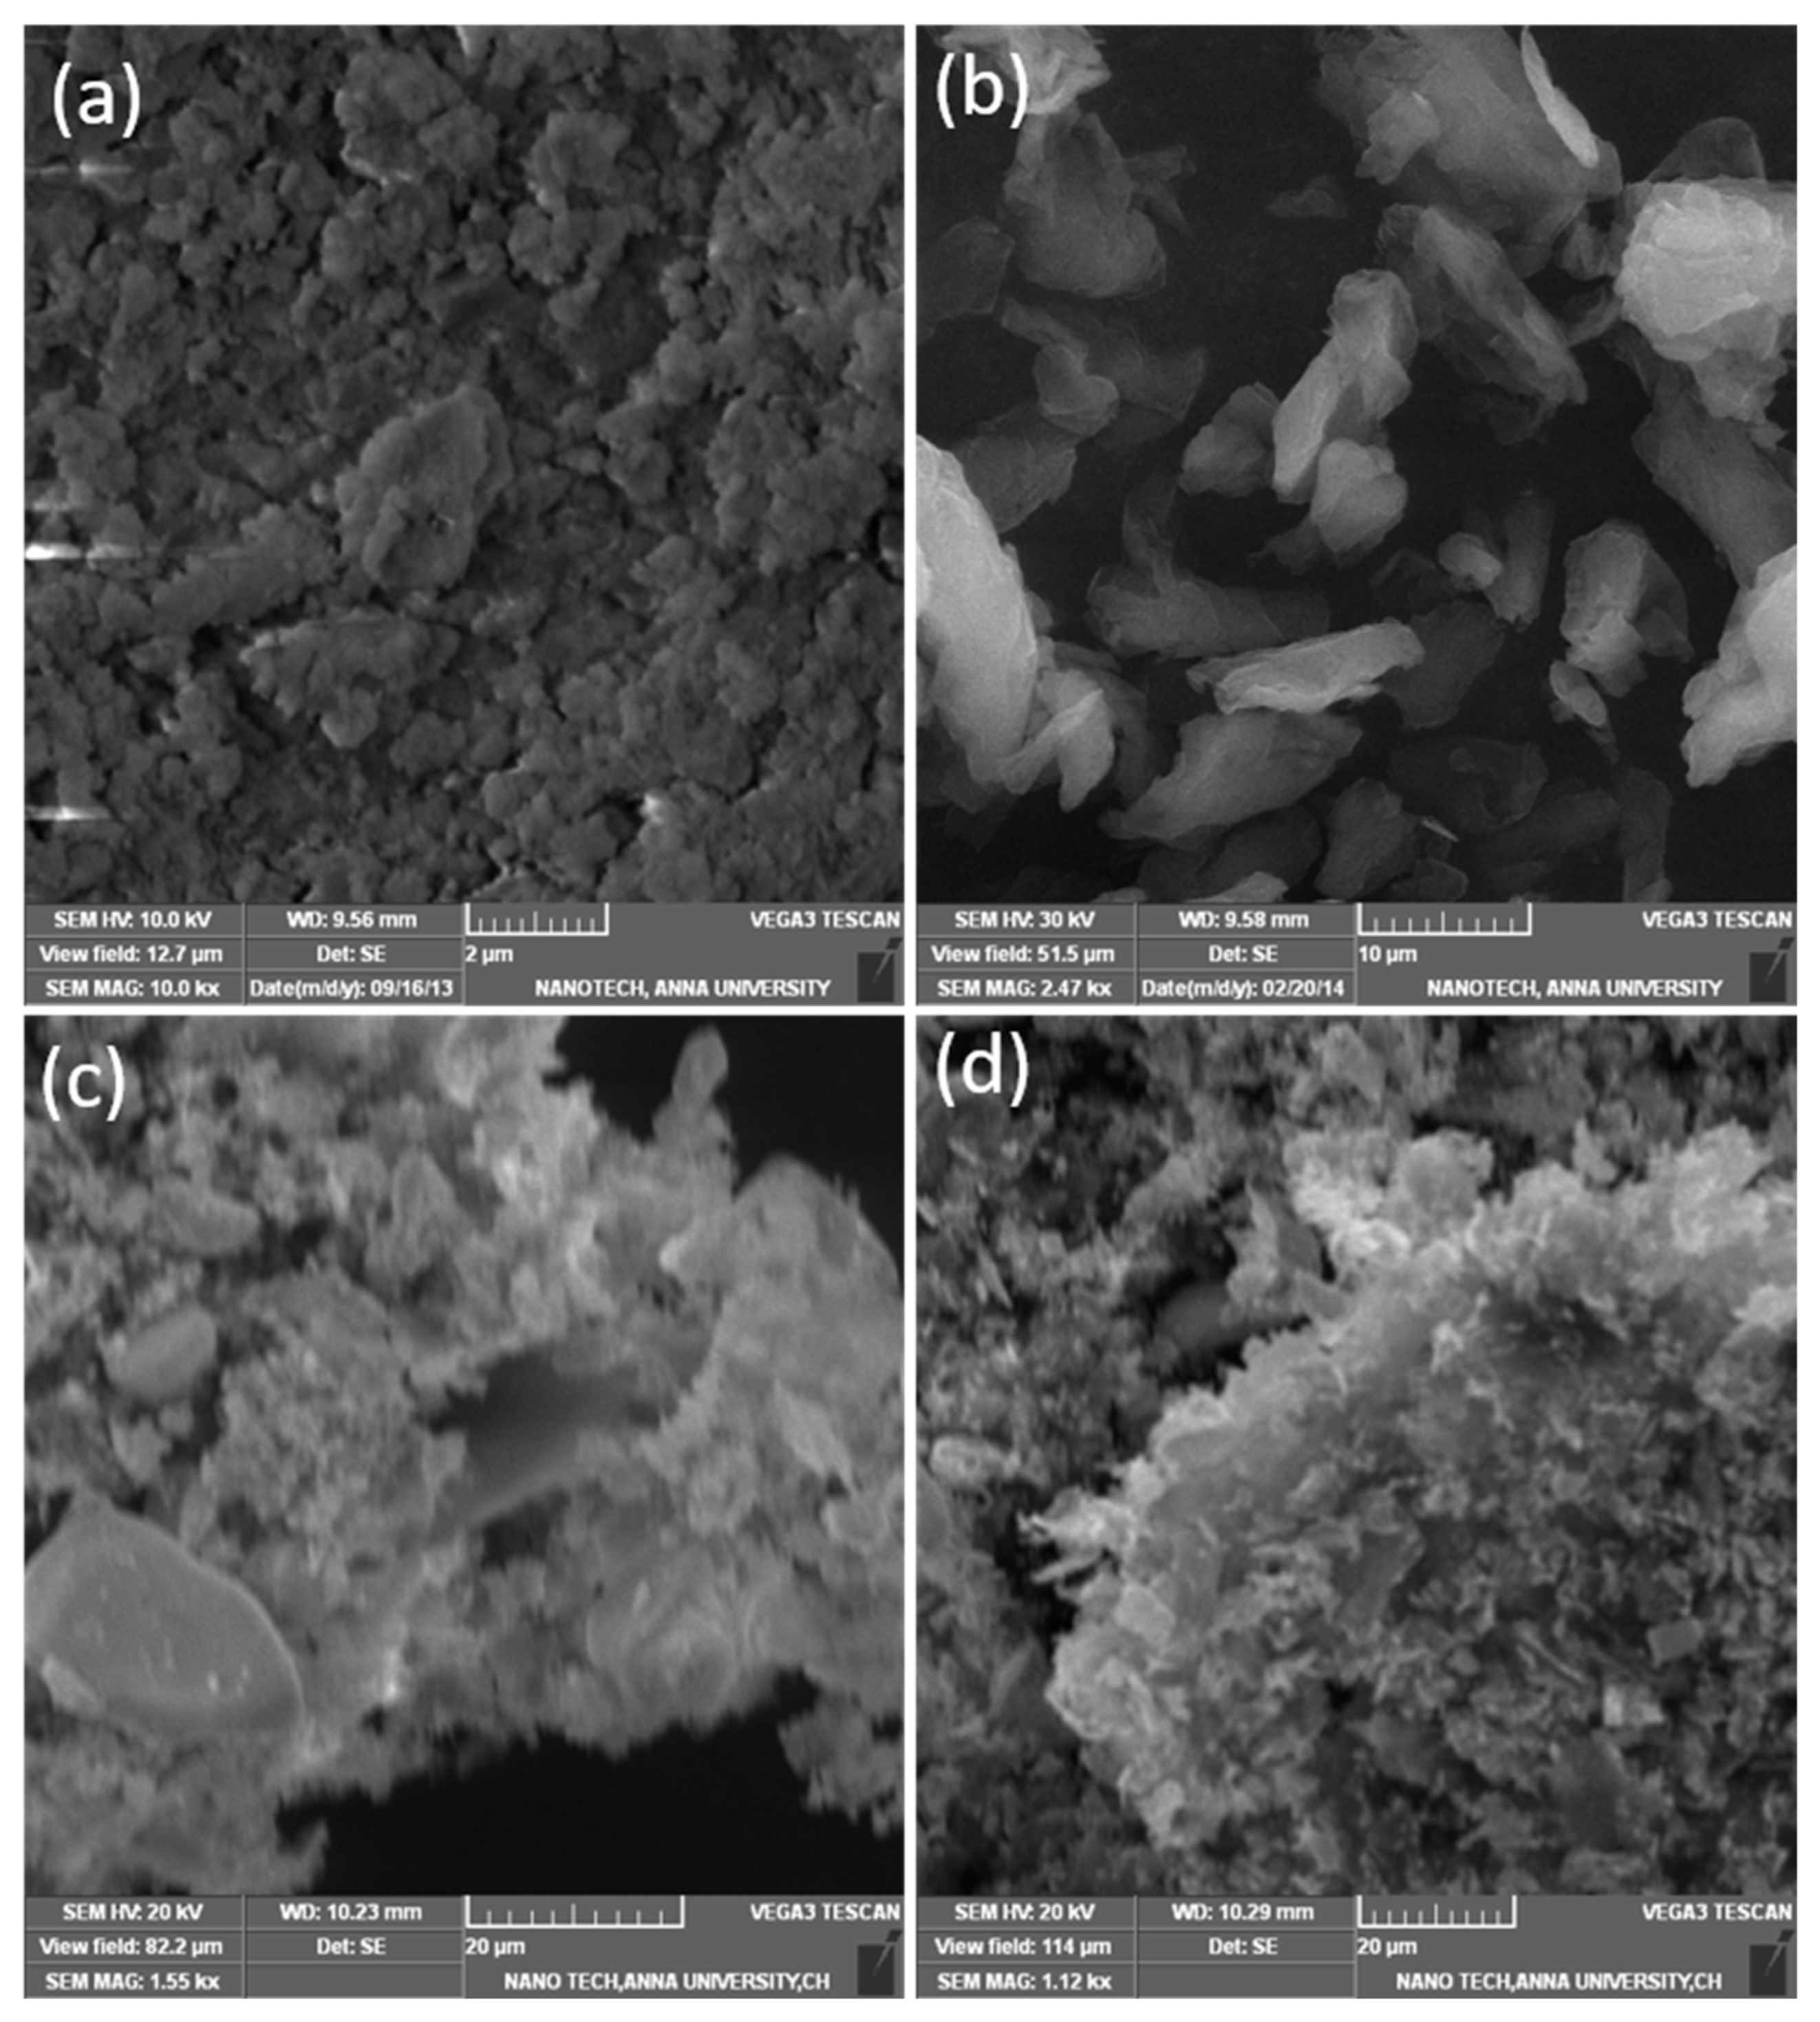
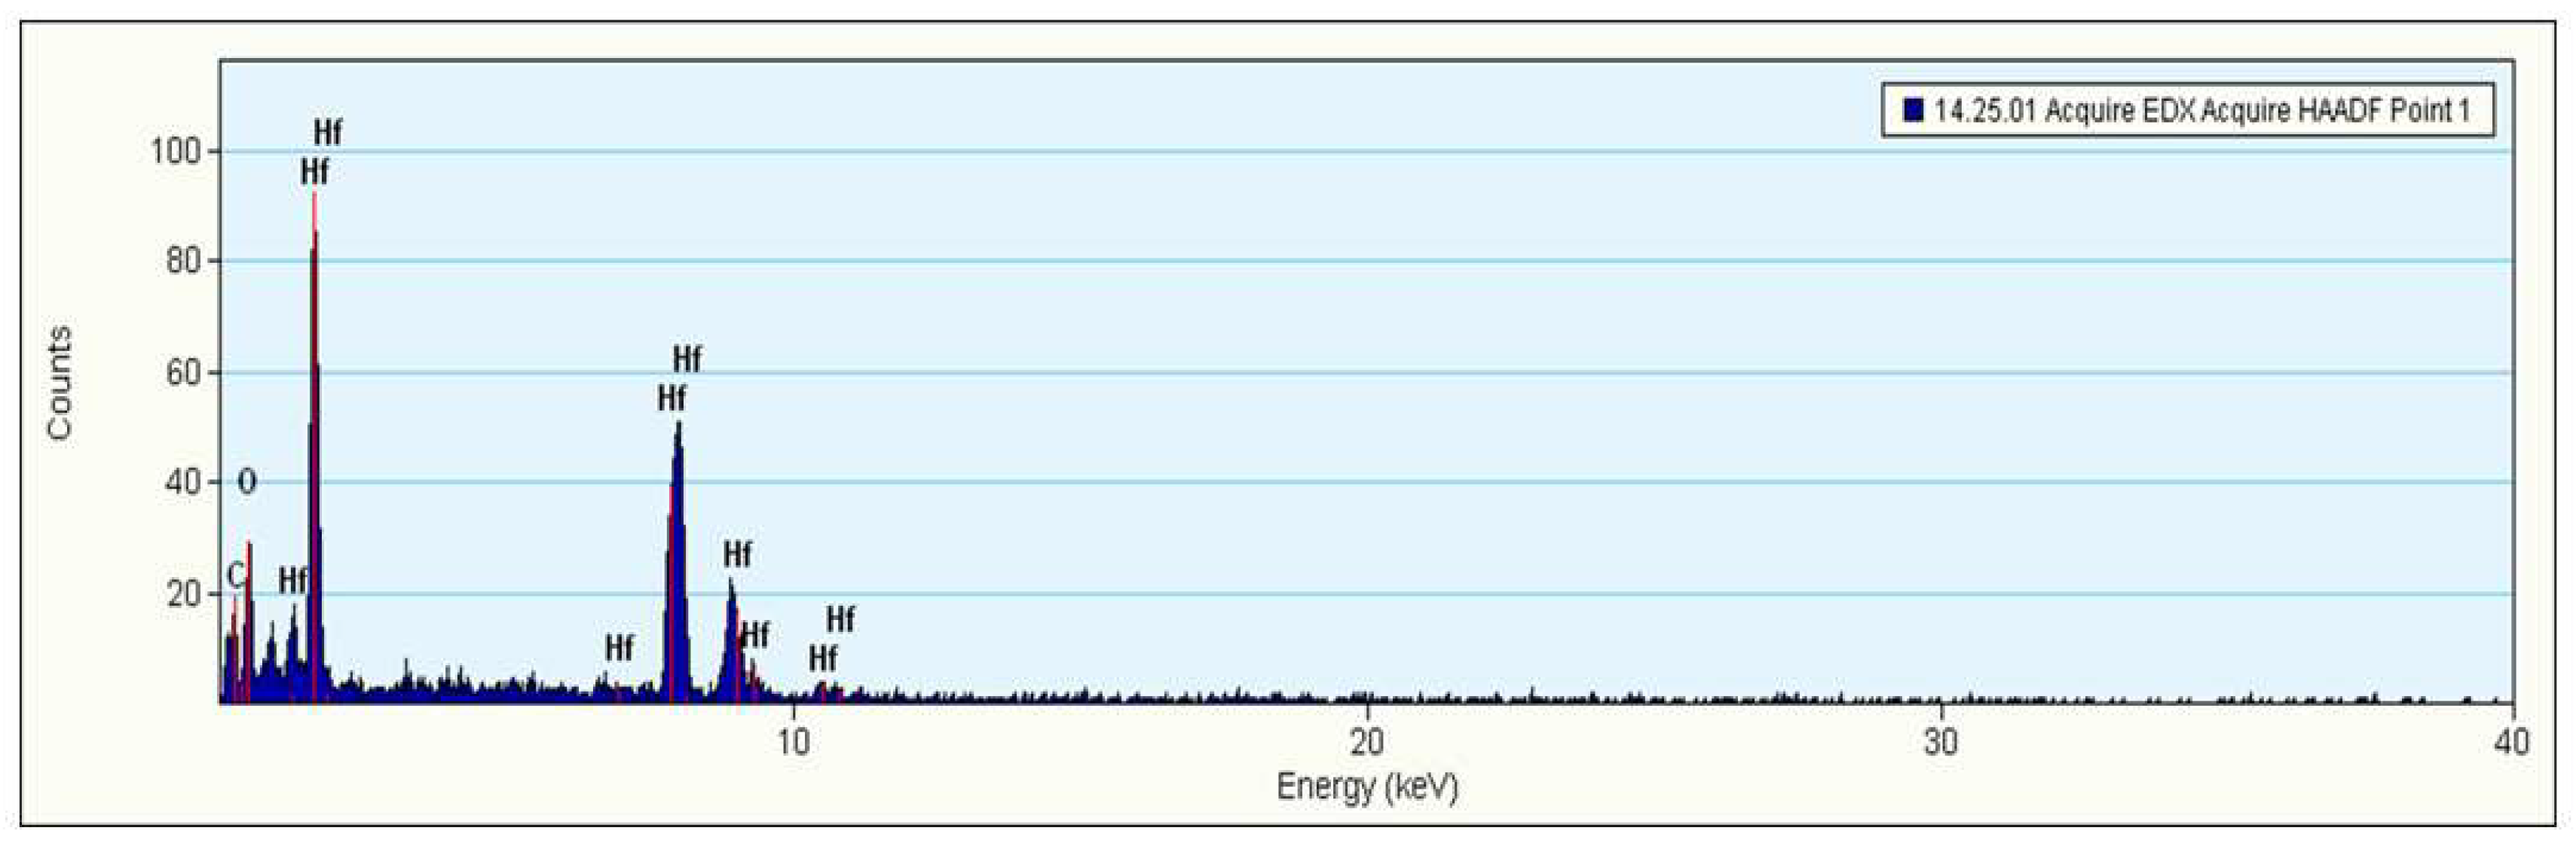
3.3. Morphology and EDX Analysis

The surface morphology of the HfO2, graphene, and HfO2-graphene nanocomposites were characterized by SEM. Figure 3a–d shows that the HfO2 nanoparticles are densely attached to the surface of graphene sheets. The surface morphology of the HfO2, graphene, and HfO2-graphene nanocomposites was characterized by SEM and displayed in Figure 3a–d. Figure 3a shows HfO2 particle aggregation due to the high surface interaction between nanoparticles with a large specific area and high surface energy [42]. Figure 3c,d shows that the graphene sheets are covered densely with the HfO2 layer.
To further characterize the morphology of the HfO2-graphene composites, HR-TEM was observed. The HR-TEM images confirm the present structure of the composites that contain graphene sheets covered with HfO2. The HR-TEM images (Figure 4a,d) also revealed that the HfO2 nanoparticles were densely bound on the surface of the graphene sheets. Similar results were observed by R.A. Dar et al., 2022 [55]. It can be seen from HR-TEM images the observed average size of the HfO2 nanoparticles was around 10 nm. The HR-TEM image size also matched with XRD measurements. The EDX spectrum of the HfO2-Graphene nanocomposite is shown in Figure 5. The results further confirm the presence of carbon (C), oxygen (O), and hafnium (Hf) elements in the HfO2-graphene nanocomposite.

3.4. Optical Properties

UV absorption spectra of HfO2, graphene, and HfO2-graphene nanocomposites (10, 30, 50 wt%) are shown in Figure 6a. We observed a peak around 205 nm that is due to the absorption of HfO2 nanoparticles [56]. The UV spectrum of graphene showed an absorption peak at 263 nm with a broad absorption spectrum [57]. The HfO2-graphene (50%) nanocomposites shows broad absorption absorbed from 225 to 300 nm when compared to other composites. Figure 6b shows the band gap energy changes from 4.5 eV to 1.6 eV when graphene weight percentage increments.

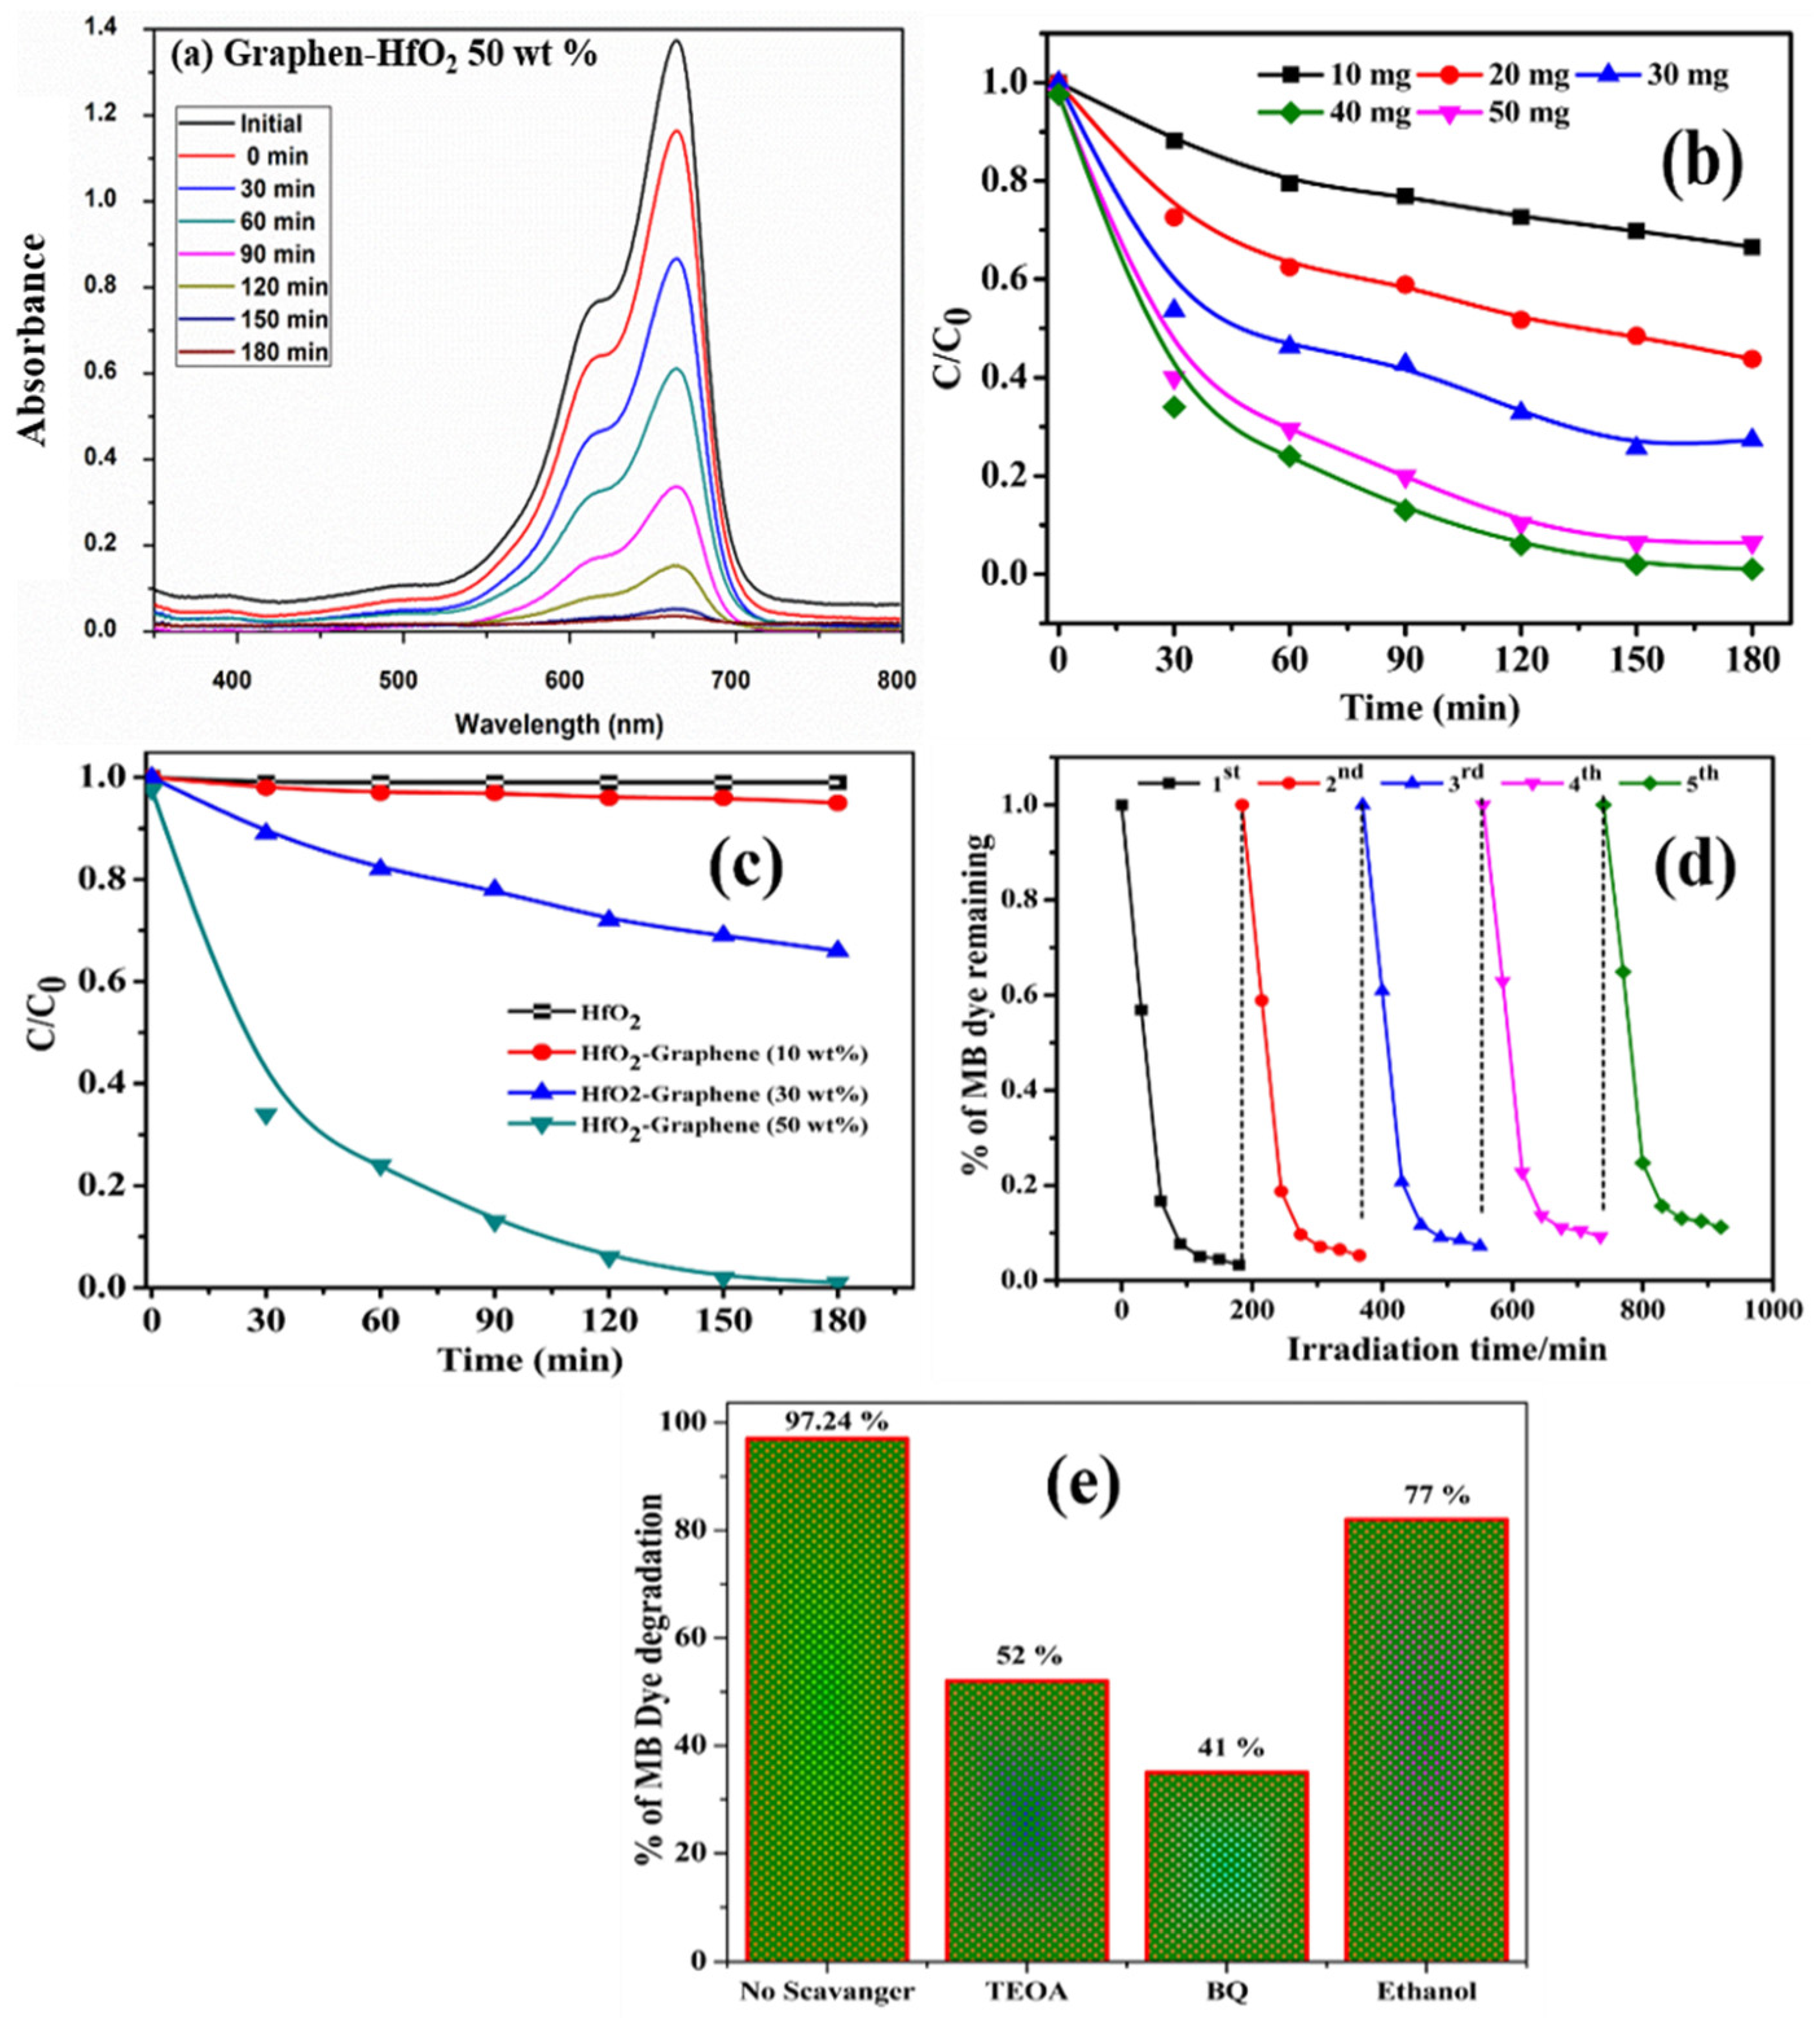
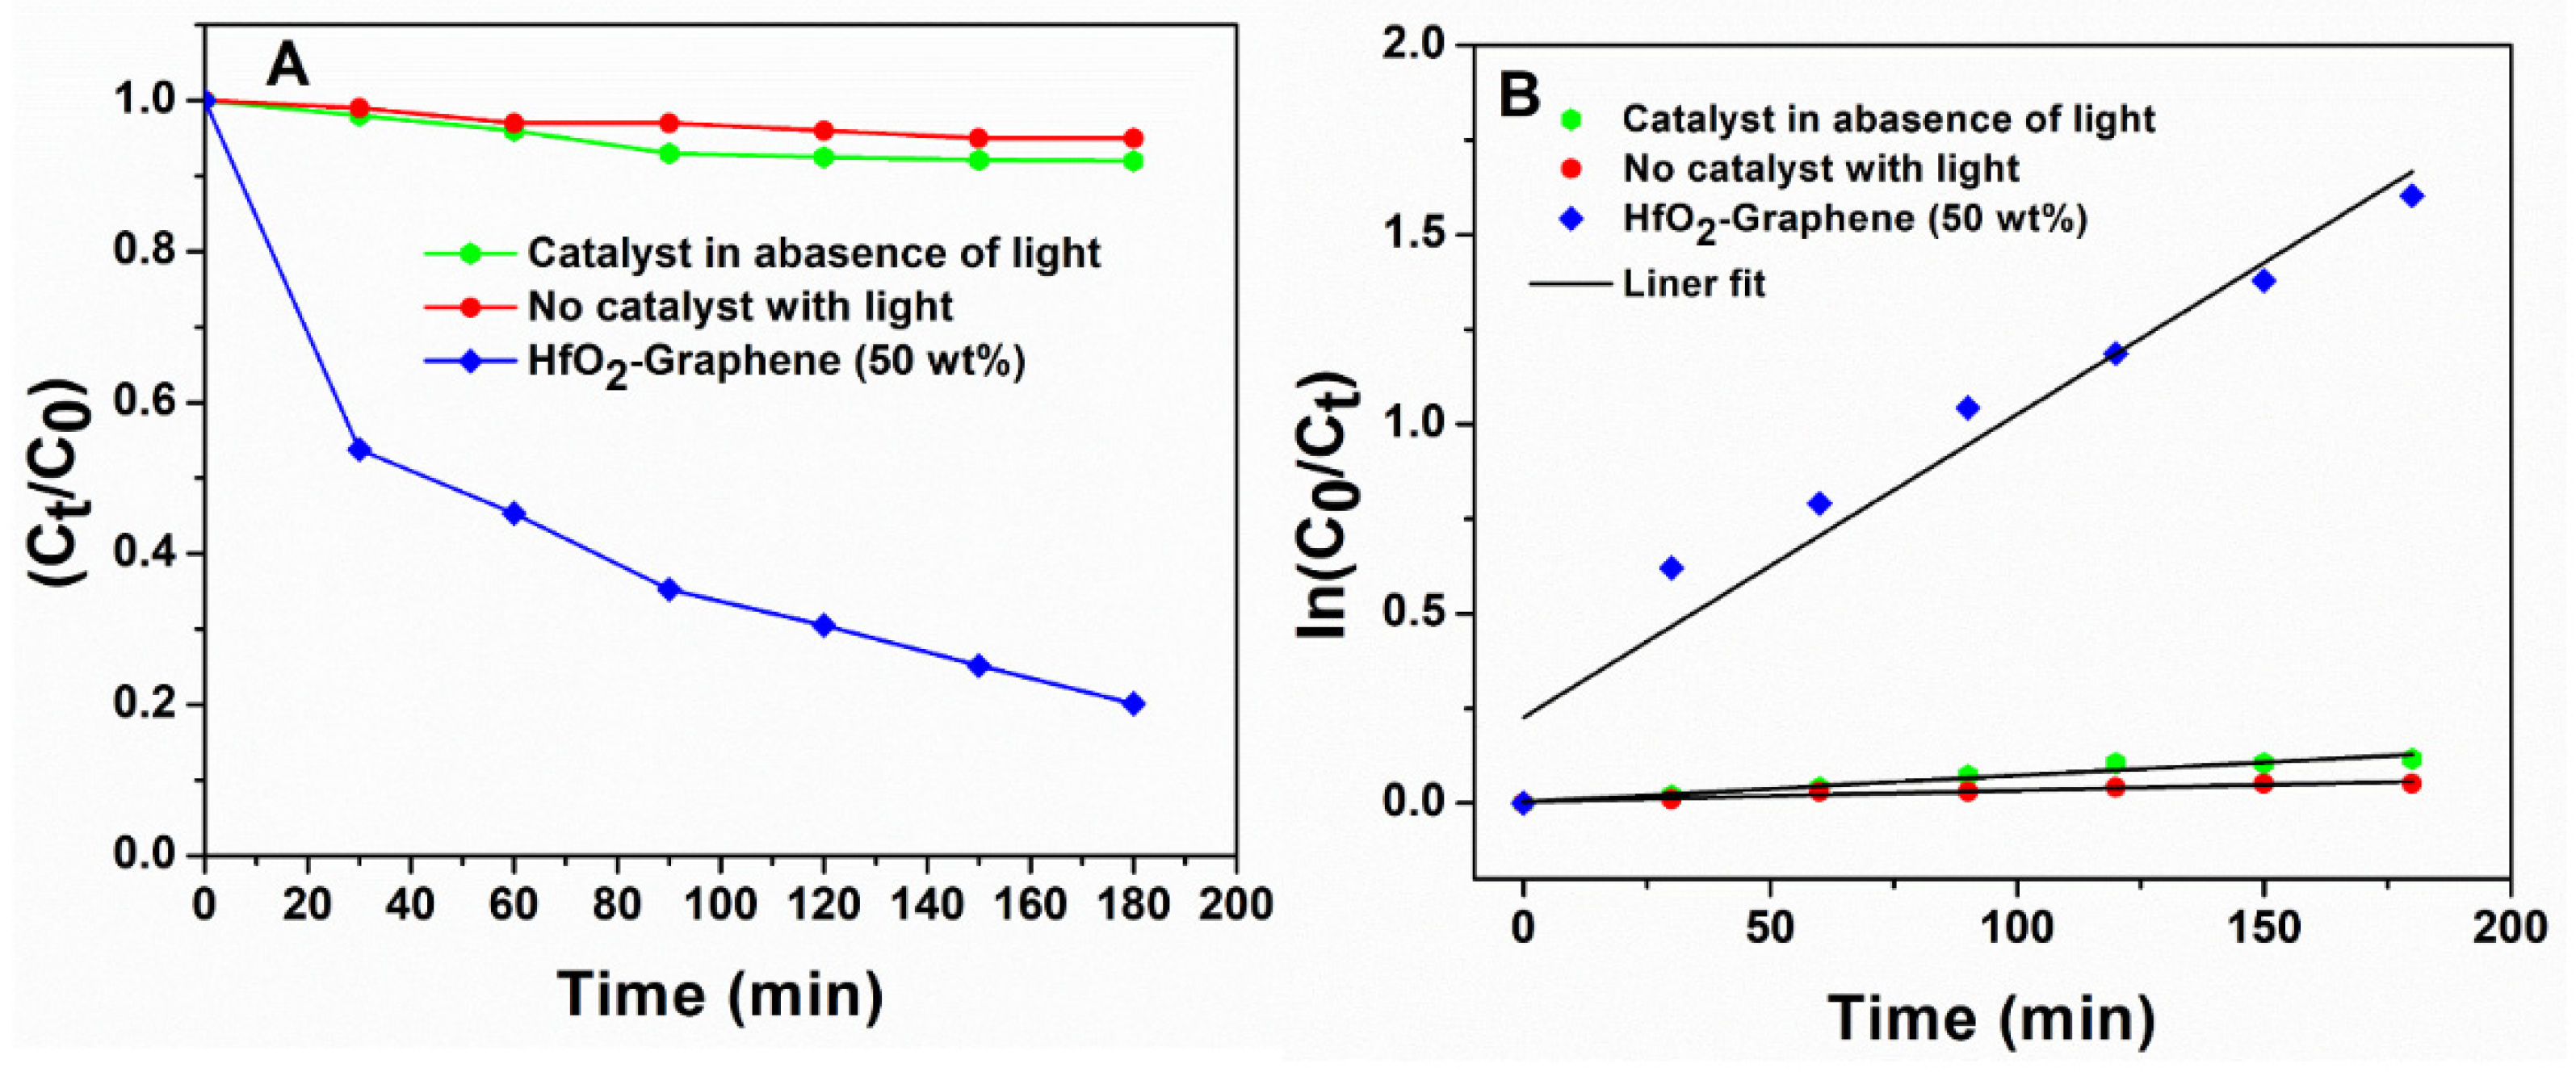
3.5. Photocatalytic Activity

HfO2-graphene nanocomposites are novel, and there are no earlier reports on their photocatalytic activity to date. The universal method of assessing a nanocomposite photocatalyst activity is by measuring the time dependence of the concentration loss of an organic compound such as MB dye under UV irradiation. To investigate the photocatalytic activities of the bare HfO2 and HfO2-graphene nanocomposites with varying amounts of graphene (10, 30, and 50 wt%) with different reaction times (0, 30, 60, 90, 120, 150, and 180 min), a photodegradation study was performed by using MB dye under UV light irradiation (Figure 7).
The prepared nanocomposite, before and after irradiation, was used to measure the degradation efficiency of MB dye (D%) by the following equation [58].
D %   =   × 100
where C0 = MB initial concentration and C = the catalyst concentration at particular time interval after irradiation. Figure 7a gives the UV-Vis absorption spectra for HfO2-graphene (50 wt%) 40 mg catalysts composite. Whereas out of various combinations of composites, Figure 7a shows that HfO2-graphene (50 wt%), whereas 40 mg catalyst composites show a significant decrease in the absorbance and, hence, a sizeable photodegradation efficiency. Figure 7b depicted that the decomposition of MB dyes using HfO2- graphene catalyst at various weight ratios, such as 10, 20, 30, 40, and 50 mg, and the corresponding decomposition efficiencies were 35%, 57%, 73%, 99%, and 94% at 180 min. The best performance of the loading catalyst is 40 mg for the maximum decomposition of HfO2-graphene. The catalyst’s ability to remove large amounts of MB dyes is 40 mh, and it is impaired by the light reflection of the catalyst particles [56]. Degradation at different concentrations of MB dyes has been analyzed.
The variation of C/C0 vs. time of exposure is depicted in Figure 7c, and it is observed that the photocatalytic efficiency increases with the increasing content of graphene. It is worth noting that the HfO2-graphene composites (50 wt%) of 40 mg show a significantly improved photodegradation efficiency related to MB dye compared to the rest of the composites, achieving complete degradation in 180 min under UV light irradiation with a sharp fall-off at 180 min marking 99% of degradation. This abrupt enhancement of photocatalytic activity in the HfO2-graphene composites (50 wt%) may be due to the excellent distribution of HfO2 particles in the graphene matrix. This may be due to the creation of intermediate energy levels, thus minimizing the bandgap. The recycled runs investigated the catalyst stability performance of the HfO2- graphene nanocomposite in removing the MB dyes with the recovered catalyst, as shown in Figure 7d. It is essential to conduct the recyclability test of the prepared photocatalyst for practical applications. Under UV light irradiation, the synthesized HfO2-graphene nanocomposite assessment was made for the photodegradation of MB dye. The decrease in the effectiveness of degradation for the dye for three recycling tests was shown, thereby showing the repeatability of the photocatalytic activity and the notable stability of the HfO2-graphene nanocomposite as a catalyst. The degradation performance for five cycles shows a small decrease, and the photocatalytic performance does not decrease significantly after five runs. The prepared catalyst was stable and reusable UV light illumination. The important reaction involved in MB dye decomposition, undergoing UV light illumination, was detected by scavengers’ impact on the degradation of oxidizing species. The results are shown in Figure 7e. Different scavengers, such as benzoquinone for O2•−, triethanolamine for h+, isopropyl alcohol for OH, and ethanol for e-, have been utilized to trap the active species for decomposition. The decomposition performance was low to a maximum extent for benzoquinone. This result depicted the significant key role of O2•− in the photodecomposition of MB dye. However, the decomposition is affected by triethanolamine, depicting the role of h+ in the decomposition. The photocatalytic degradation is mainly based on O2•−, with HfO2 under UV light illumination.
The following equations show attainable reaction steps of the photocatalytic degradation mechanism under UV light irradiation.
HfO2 + hν → HfO2 (h+ + e)
HfO2 (e) + Graphene → HfO2 + Graphene (e)
Graphene (e) + O2→ O2- + Graphene
HfO2 (h+) + OH- → HfO2 + •OH
HfO2 (h+) + •OH + O2-+ dyes → CO2 + H2O + mineralization product
The enhanced photocatalytic activity under UV light illumination can be attributed to the effective separation of photogenerated electrons inhibiting recombination in the HfO2-graphene composite. Under UV illumination, e is excited from the VB to the CB of HfO2. As a result, the electron-hole pairs are generated on the HfO2 surface (Equation (5)). These photogenerated electrons and holes play a crucial role in pollutant degradation. The previous report proposed graphene as an electron acceptor in the composite [59,60]. As a result, the negatively charged electron is transferred into the graphene through the percolation mechanism (Equation (6)). Then, these negatively charged graphene sheets can activate the dissolved oxygen to produce O2•− (Equation (7)). In addition, the positively charged holes present in the HfO2 can react with the adsorbed water to form OH (Equation (8)). Finally, the reactive active species, such as holes, OH, and O2−, were directly involved in the oxidation processes, leading to the degradation of methylene blue (Equation (9)) [61]. Figure 8 shows the degradation of the photographic image of the MB dye solution under the UV-light irradiation. From Figure 8, it was found that the gradual degradation of MB dye takes place. At 180 min of irradiation, MB in the presence of HfO2-graphene nanocomposite was completely degraded.
Seema et al. demonstrated that graphene-SnO2 composites spent nearly 360 min, even for the partial photodegradation of MB dye under UV light illumination [37]. Hao Zhang et al. synthesized the P25-graphene composite that achieved 85% of the degradation of the initial MB dye under UV light irradiation, even for less than 60 min [36]. The graphene-TiO2 composite displayed the degradation of methylene blue by 75% when illuminated with sunlight for 180 min. BiVO4-graphene catalyst degraded the methylene blue by 89% after illumination with visible light for 180 min [62]. Zhang et al. prepared TiO2−Graphene nanocomposites that degraded the MB dye under sunlight irradiation for 180 min; the degradation achieved was 75%. Shanmugam et al. prepared G- αMoO3 nanocomposite, and it degraded the MB dye under UV illumination, with a degradation percentage of 97% [63]. Atchudan et.al. prepared GO-TiO2 under UV-light irradiation, and its degradation achieved was 75% [64]. The present results were compared with the existing results in Table 1.
To determine photocatalytic tetracycline degradation of HfO2-graphene nanocomposites (50 wt%), 15 mg of HfO2-graphene nanocomposites mixed with the 20 ppm tetracycline solution (100 mL, pH = 5.19) and treated under UV light irradiation. To prevent the physisorption of tetracycline on the photocatalysts during degradation, tetracycline solution and HfO2-graphene nanocomposites were stirred in the dark for 2 h with a magnetic stirrer. Following that, the reaction mixture was then exposed to UV light irradiation with continuous stirring for 180 min to examine degradation. The characteristic absorption peak at 357 nm is used to measure tetracycline degradation concentrations [65]. As a result, HfO2-graphene degrades tetracycline with high efficiency, as shown in Figure 9A. In the blank test, without the photocatalyst, tetracycline degradation efficiency was measured under UV light. The HfO2-graphene (50 wt%) photocatalyst degrades 81 ± 2% of tetracycline after 180 min, suggesting that tetracycline can be degraded more efficiently under UV light (Figure 9A).
The degradation kinetics of HfO2-graphene under UV light were further investigated based on the pseudo-first-order kinetic model:
ln (Ct/Co) = −kt
where C0 indicates initial tetracycline concentration, Ct represents its concentration as a function of degradation time t, and k represents the reaction rate constant. Based on the results, we have identified a pseudo-first-order kinetic model for tetracycline degradation in the presence of UV light (Figure 9B). To validate the HfO2-graphene nanocomposite impact on the degradation of tetracycline, we conducted a photodegradation experiment without HfO2-graphene. Nevertheless, it rarely shows any photodegradation of tetracycline without HfO2-graphene (Figure 9A). According to these results, the synthesized HfO2-graphene nanocomposite is an extremely photoactive material, and the degradation process takes place via photocatalysis.

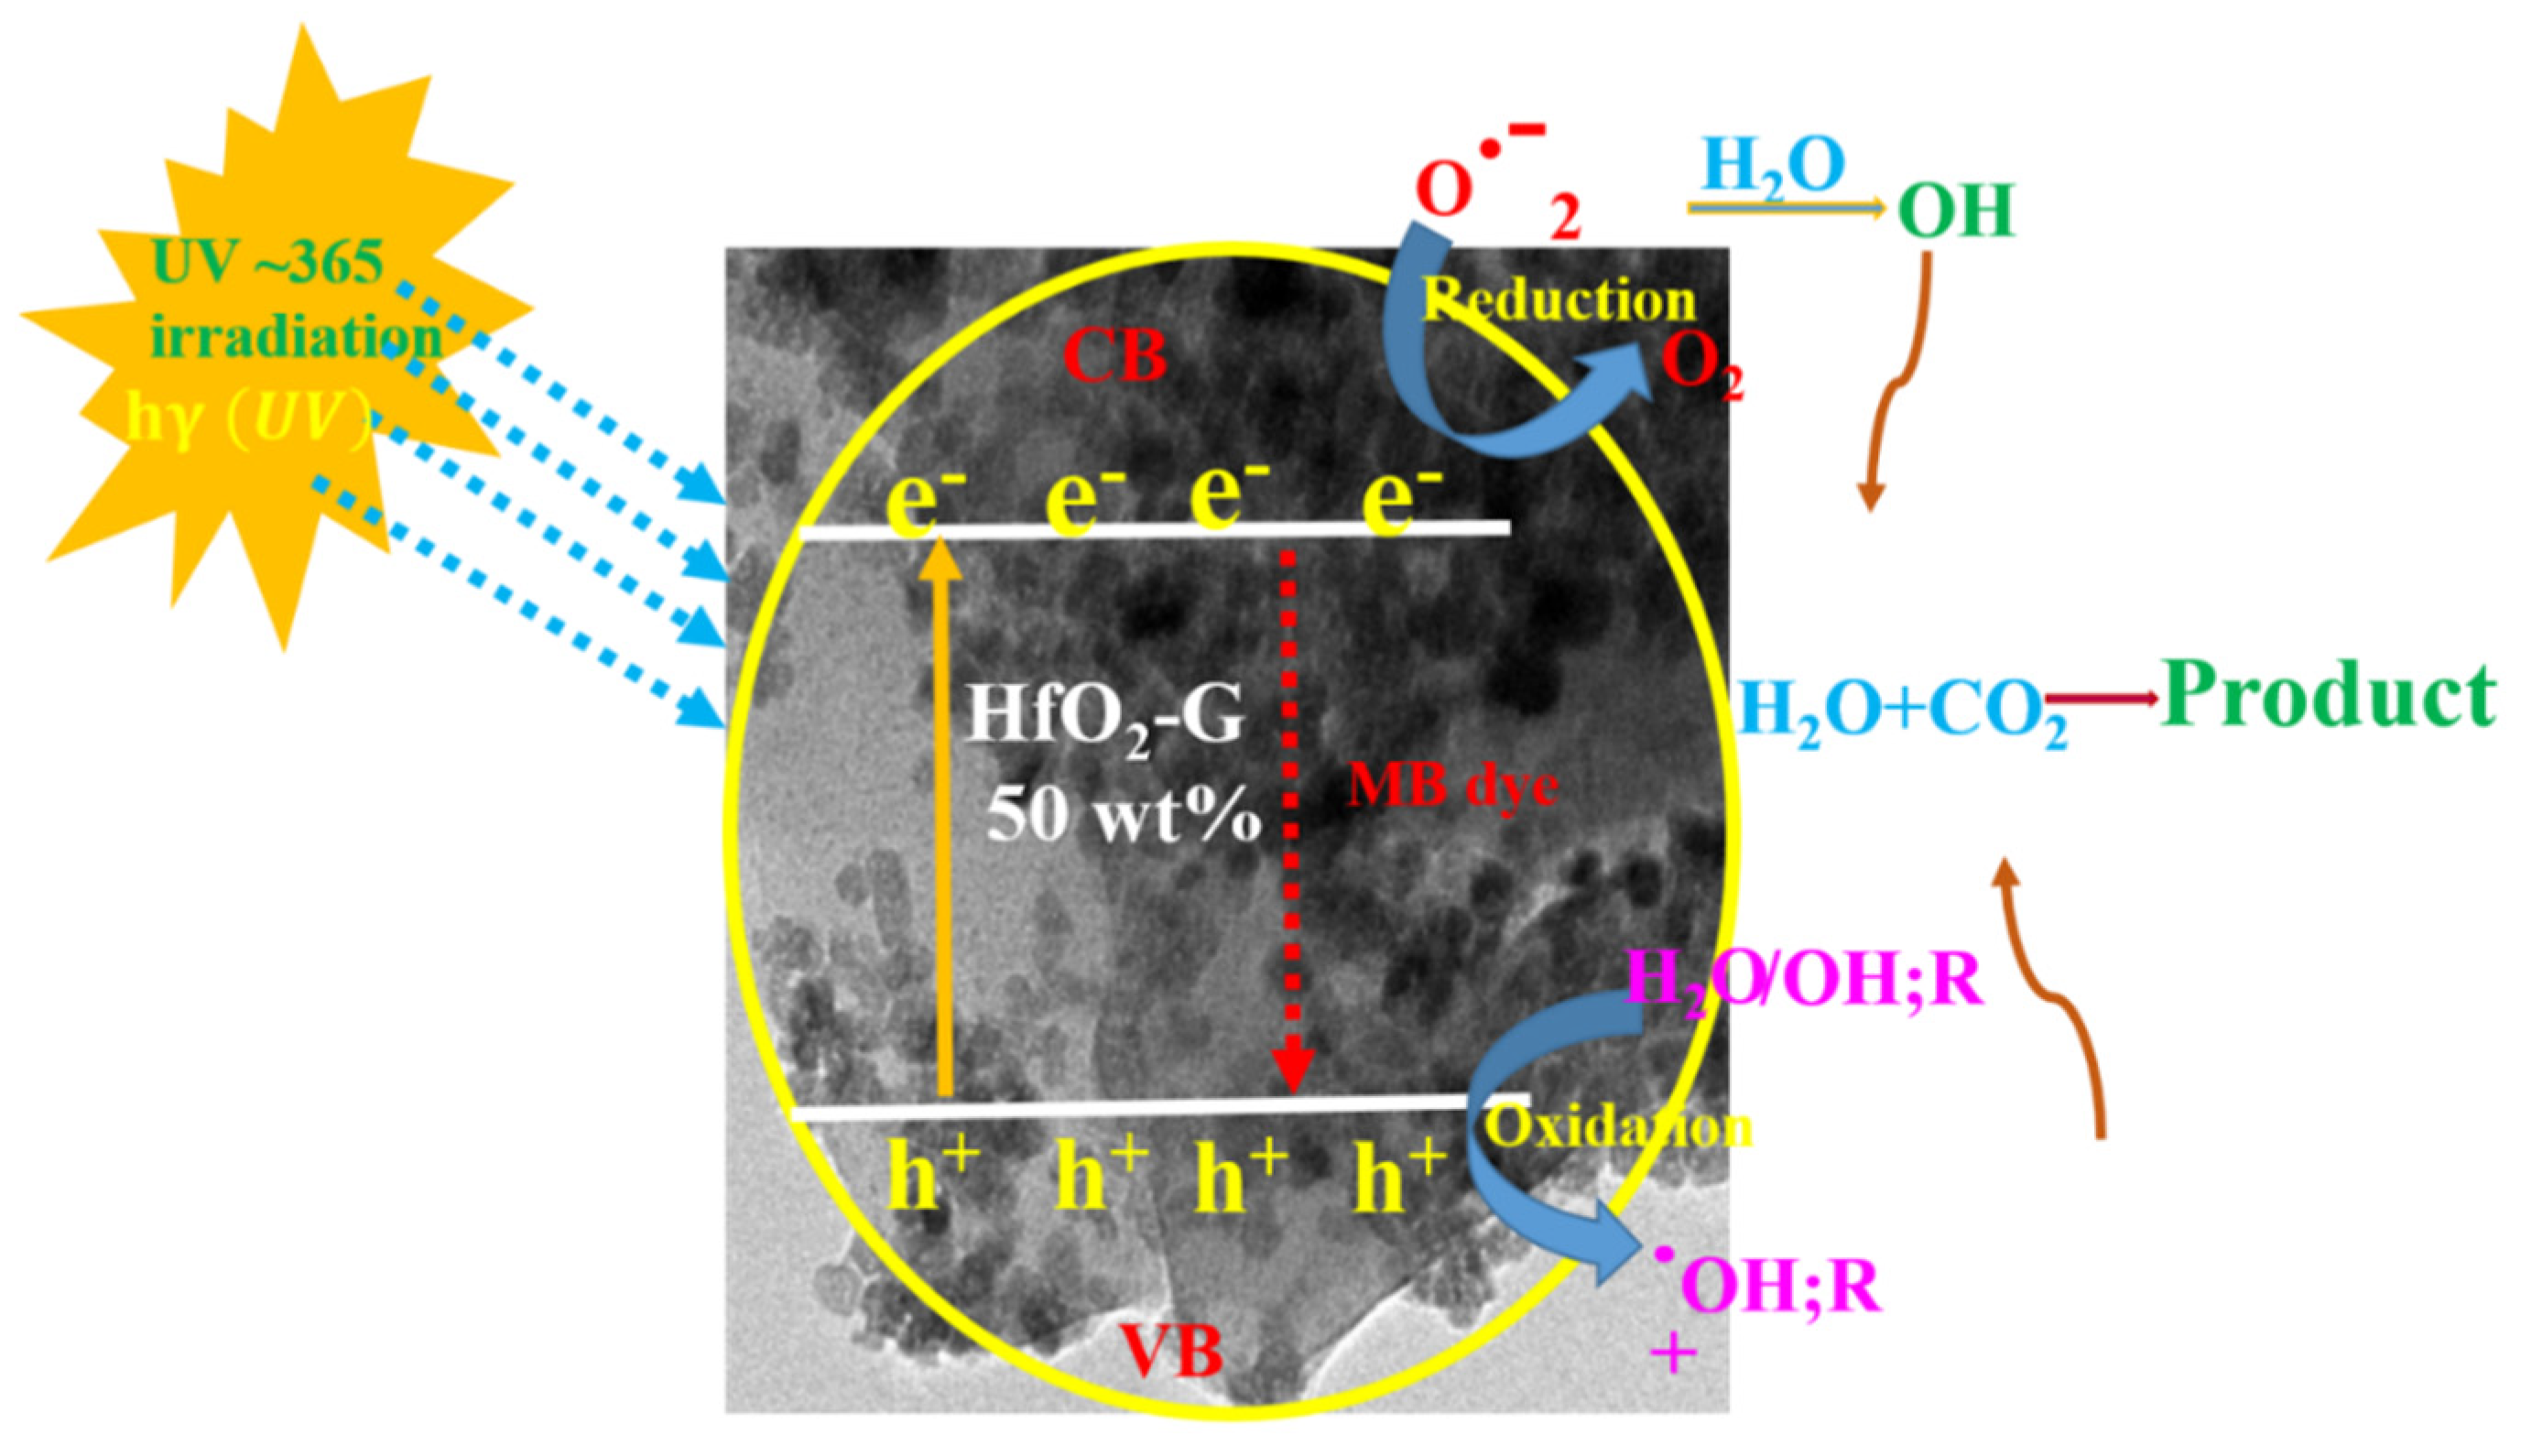
3.6. Photocatalytic Degradation Mechanism

The higher surface of the graphene comprises numerous functional groups such as hydroxyl and carboxyl groups. Under UV light irradiation, the HfO2-graphene nanocomposite generates excitons on the absorption of photons. The generation of the oxide radicals (O−2) by reducing the conduction band is intensified by the interaction of the photoexcited e- with the residual functional groups of graphene molecules. The recombination of the electrons decelerates, and the reduction reaction accelerates due to graphene’s presence and its high conductivity. Figure 10 shows the simultaneous process of the increase in hydroxyl radicals (OH) triggered by the oxidation reaction of the valence band. A strong reaction decomposes the dye molecules due to the enormous activity of O−2 radicals and OH°. The result establishes the superiority of the HfO2-graphene nanocomposite compared to HfO2 as a photocatalyst under UV light irradiation.

4. Conclusions

The simple solution mixing method using variable amounts of graphene content (10, 30, and 50 wt%), the HfO2-graphene nanocomposite, was prepared. More than the HfO2 nanoparticles, the HfO2-graphene nanocomposite showed notably higher efficacy of photodegradation. By HR-TEM, it was confirmed that the HfO2 nanoparticles had been distributed on the graphene sheets. The chemical composition of C, O, and Hf were analyzed by EDX. Using the HfO2-graphene nanocomposite as a catalyst, the MB solution’s degradation was analyzed through UV light irradiation. As a result, 99% of MB dye removal was achieved. The HfO2-graphene (50 wt%) photocatalyst degrades 81 ± 2% of tetracycline in 180 min. It reaffirms that the HfO2-graphene nanocomposite can effectively degrade MB dye and tetracycline under UV light irradiation, which can be applied optimally for proper wastewater management.

Author Contributions

V.J., S.M., S.C., A.P., S.G., J.R., G.N.P., S.A. and Y.-H.A. conceived the project; S.M., S.C., A.P., S.G. and J.R., performed the experiments, generated datasets, and wrote the first draft of the manuscript; V.J., S.A. and Y.-H.A. supervised the project and edited and revised the manuscript; All authors have read and agreed to the published version of the manuscript.

Funding

Global Korea Scholarship (GKS) Program through the National Institute for International Education (NIED), funded by the Ministry of Education Republic of Korea. The authors thank the Core Research Support Center for Natural Products and Medical Materials (CRCNM) for technical support regarding the nanoindentation test.

Institutional Review Board Statement

Not applicable.

Informed Consent Statement

Informed consent was obtained from all subjects involved in the study.

Data Availability Statement

No data were used for the research described in the article.

Acknowledgments

This research was supported by the Global Korea Scholarship (GKS) Program through the National Institute for International Education (NIED), funded by the Ministry of Education Republic of Korea. The authors thank the Core Research Support Center for Natural Products and Medical Materials (CRCNM) for technical support regarding the nanoindentation test. The first author, Venkatachalam J., is grateful to the Korean Ministry of Education for awarding the GKS to support the research program. S.C. was supported by a Grant-in-Aid for Early-Career Scientists fund (KAKENHI No.22K15249) by Japan Society for the Promotion of Science.

Conflicts of Interest

The authors declare that they have no competing interests.

References

  1. El-Shahawi, M.; Hamza, A.; Bashammakh, A.S.; Al-Saggaf, W. An overview on the accumulation, distribution, transformations, toxicity and analytical methods for the monitoring of persistent organic pollutants. Talanta 2010, 80, 1587–1597. [Google Scholar] [CrossRef] [PubMed]
  2. Osotsi, M.I.; Macharia, D.K.; Zhu, B.; Wang, Z.; Shen, X.; Liu, Z.; Zhang, L.; Chen, Z. Synthesis of ZnWO4−x nanorods with oxygen vacancy for efficient photocatalytic degradation of tetracycline. Prog. Nat. Sci. Mater. Int. 2018, 28, 408–415. [Google Scholar] [CrossRef]
  3. Tamminen, M.; Karkman, A.; Lohmus, A.; Muziasari, W.I.; Takasu, H.; Wada, S.; Suzuki, S.; Virta, M. Tetracycline resistance genes persist at aquaculture farms in the absence of selection pressure. Environ. Sci. Technol. 2011, 45, 386–391. [Google Scholar] [CrossRef]
  4. Daghrir, R.; Drogui, P. Tetracycline antibiotics in the environment: A review. Environ. Chem. Lett. 2013, 11, 209–227. [Google Scholar] [CrossRef]
  5. Lü, M.; Li, J.; Yang, X.; Zhang, C.; Yang, J.; Hu, H.; Wang, X. Applications of graphene-based materials in environmental protection and detection. Chin. Sci. Bull. 2013, 58, 2698–2710. [Google Scholar] [CrossRef] [Green Version]
  6. Chang, S.; Kim, Y.; Park, H.; Park, K. Synthesis and analysis of thermally degradable polybutadiene containing Diels–Alder adduct. Bull. Korean Chem. Soc. 2021, 42, 1602–1609. [Google Scholar] [CrossRef]
  7. Durai, M.; Chauhan, D.; Durai, M.; Saravanan, M.; Kumaravel, S.; Erusappan, E.; Ahn, Y.-H. Layered KTO/BiOCl nanostructures for the efficient visible light photocatalytic degradation of harmful dyes. Chemosphere 2022, 306, 135659. [Google Scholar] [CrossRef]
  8. Wang, H.; Zhang, L.; Chen, Z.; Hu, J.; Li, S.; Wang, Z.; Liu, J.; Wang, X. Semiconductor heterojunction photocatalysts: Design, construction, and photocatalytic performances. Chem. Soc. Rev. 2014, 43, 5234–5244. [Google Scholar] [CrossRef]
  9. Shen, X.; Zhang, T.; Xu, P.; Zhang, L.; Liu, J.; Chen, Z. Growth of C3N4 nanosheets on carbon-fiber cloth as flexible and macroscale filter-membrane-shaped photocatalyst for degrading the flowing wastewater. Appl. Catal. B 2017, 219, 425–431. [Google Scholar] [CrossRef]
  10. Hiroshi, O.; Masao, K. Photochemical Reactions between Methylene Blue and Tri-, Di- and Monomethylamine. I. Bull. Chem. Soc. Jpn. 1957, 30, 136–141. [Google Scholar] [CrossRef]
  11. Hiroshi, O.; Kenichi, K.; Masao, K. Photochemical Reactions between Methylene Blue and Tri-, Di- and Monomethylamine. III. The Behavior of Methylene Blue in the Presence of Oxygen. Bull. Chem. Soc. Jpn. 1959, 32, 125–132. [Google Scholar] [CrossRef]
  12. Senthilkumaar, S.; Porkodi, K.; Gomathi, R.; Maheswari, A.G.; Manonmani, N. Sol–gel derived silver doped nanocrystalline titania catalysed photodegradation of methylene blue from aqueous solution. Dyes Pigment. 2006, 69, 22–30. [Google Scholar] [CrossRef]
  13. Yogi, C.; Kojima, K.; Wada, N.; Tokumoto, H.; Takai, T.; Mizoguchi, T.; Tamiaki, H. Photocatalytic degradation of methylene blue by TiO2 film and Au particles-TiO2 composite film. Thin Solid Films 2008, 516, 5881–5884. [Google Scholar] [CrossRef]
  14. Kiwi, J.; Pulgarin, C.; Peringer, P.; Grätzel, M. Beneficial effects of homogeneous photo-Fenton pretreatment upon the biodegradation of anthraquinone sulfonate in waste water treatment. Appl. Catal. B Environ. 1993, 3, 85–99. [Google Scholar] [CrossRef]
  15. Hoffmann, M.R.; Martin, S.T.; Choi, W.; Bahnemann, D.W. Environmental Applications of Semiconductor Photocatalysis. Chem. Rev. 1995, 95, 69–96. [Google Scholar] [CrossRef]
  16. Kastner, J.R.; Thompson, D.N.; Cherry, R.S. Water-soluble polymer for increasing the biodegradation of sparingly soluble vapors. Enzym. Microb. Technol. 1999, 24, 104–110. [Google Scholar] [CrossRef]
  17. Miller, M.J.; Allen, D.G. Modelling transport and degradation of hydrophobic pollutants in biofilter biofilms. Chem. Eng. J. 2005, 113, 197–204. [Google Scholar] [CrossRef]
  18. Chen, Y.; Dionysiou, D.D. A comparative study on physicochemical properties and photocatalytic behavior of macroporous TiO2-P25 composite films and macroporous TiO2 films coated on stainless steel substrate. Appl. Catal. A Gen. 2007, 317, 129–137. [Google Scholar] [CrossRef]
  19. Changchun, C.; Jiangfeng, L.; Ping, L.; Benhai, Y. Investigation of photocatalytic degradation of methyl orange by using nano-sized ZnO catalysts. Adv. Chem. Eng. Sci. 2011, 1, 9–14. [Google Scholar]
  20. Chen, Y.; Crittenden, J.C.; Hackney, S.; Sutter, L.; Hand, D.W. Preparation of a Novel TiO2-Based p−n Junction Nanotube Photocatalyst. Environ. Sci. Technol. 2005, 39, 1201–1208. [Google Scholar] [CrossRef]
  21. Xiang, Q.; Yu, J.; Jaroniec, M. Graphene-based semiconductor photocatalysts. Chem. Soc. Rev. 2012, 41, 782–796. [Google Scholar] [CrossRef] [PubMed]
  22. Ren, L.; Li, Y.; Hou, J.; Zhao, X.; Pan, C. Preparation and Enhanced Photocatalytic Activity of TiO2 Nanocrystals with Internal Pores. ACS Appl. Mater. Interfaces 2014, 6, 1608–1615. [Google Scholar] [CrossRef] [PubMed]
  23. Kopidakis, N.; Schiff, E.A.; Park, N.G.; van de Lagemaat, J.; Frank, A.J. Ambipolar Diffusion of Photocarriers in Electrolyte-Filled, Nanoporous TiO2. J. Phys. Chem. B 2000, 104, 3930–3936. [Google Scholar] [CrossRef]
  24. Hurum, D.C.; Gray, K.A.; Rajh, T.; Thurnauer, M.C. Recombination Pathways in the Degussa P25 Formulation of TiO2:  Surface versus Lattice Mechanisms. J. Phys. Chem. B 2005, 109, 977–980. [Google Scholar] [CrossRef]
  25. Sangpour, P.; Hashemi, F.; Moshfegh, A.Z. Photoenhanced Degradation of Methylene Blue on Cosputtered M:TiO2 (M = Au, Ag, Cu) Nanocomposite Systems: A Comparative Study. J. Phys. Chem. C 2010, 114, 13955–13961. [Google Scholar] [CrossRef]
  26. Geim, A.K.; Novoselov, K.S. The rise of graphene. In Nanoscience and Technology; World Scientific: Singapore, 2010; pp. 11–19. [Google Scholar]
  27. Ye, Y.; Dai, Y.; Dai, L.; Shi, Z.; Liu, N.; Wang, F.; Fu, L.; Peng, R.; Wen, X.; Chen, Z.; et al. High-Performance Single CdS Nanowire (Nanobelt) Schottky Junction Solar Cells with Au/Graphene Schottky Electrodes. ACS Appl. Mater. Interfaces 2010, 2, 3406–3410. [Google Scholar] [CrossRef]
  28. Berger, C.; Song, Z.; Li, X.; Wu, X.; Brown, N.; Naud, C.; Mayou, D.; Li, T.; Hass, J.; Marchenkov, A.N. Electronic confinement and coherence in patterned epitaxial graphene. Science 2006, 312, 1191–1196. [Google Scholar] [CrossRef] [Green Version]
  29. Stankovich, S.; Dikin, D.A.; Dommett, G.H.; Kohlhaas, K.M.; Zimney, E.J.; Stach, E.A.; Piner, R.D.; Nguyen, S.T.; Ruoff, R.S. Graphene-based composite materials. Nature 2006, 442, 282–286. [Google Scholar] [CrossRef]
  30. Xu, T.; Zhang, L.; Cheng, H.; Zhu, Y. Significantly enhanced photocatalytic performance of ZnO via graphene hybridization and the mechanism study. Appl. Catal. B Environ. 2011, 101, 382–387. [Google Scholar] [CrossRef]
  31. Wang, H.; Casalongue, H.S.; Liang, Y.; Dai, H. Ni(OH)2 nanoplates grown on graphene as advanced electrochemical pseudocapacitor materials. J. Am. Chem. Soc. 2010, 132, 7472–7477. [Google Scholar] [CrossRef] [Green Version]
  32. Si, Y.; Samulski, E.T. Exfoliated graphene separated by platinum nanoparticles. Chem. Mater. 2008, 20, 6792–6797. [Google Scholar] [CrossRef]
  33. Yoo, E.; Okata, T.; Akita, T.; Kohyama, M.; Nakamura, J.; Honma, I. Enhanced Electrocatalytic Activity of Pt Subnanoclusters on Graphene Nanosheet Surface. Nano Lett. 2009, 9, 2255–2259. [Google Scholar] [CrossRef] [PubMed]
  34. Murugan, A.V.; Muraliganth, T.; Manthiram, A. Rapid, facile microwave-solvothermal synthesis of graphene nanosheets and their polyaniline nanocomposites for energy strorage. Chem. Mater. 2009, 21, 5004–5006. [Google Scholar] [CrossRef]
  35. Liang, Y.; Wang, H.; Casalongue, H.; Chen, Z.; Dai, H. TiO2 Nanocrystals grown on graphene as advanced photocatalytic hybrid materials. Nano Res. 2010, 3, 701–705. [Google Scholar] [CrossRef] [Green Version]
  36. Zhang, H.; Lv, X.; Li, Y.; Wang, Y.; Li, J. P25-graphene composite as a high performance photocatalyst. ACS Nano 2010, 4, 380–386. [Google Scholar] [CrossRef]
  37. Seema, H.; Kemp, K.C.; Chandra, V.; Kim, K.S. Graphene–SnO2 composites for highly efficient photocatalytic degradation of methylene blue under sunlight. Nanotechnology 2012, 23, 355705. [Google Scholar] [CrossRef]
  38. Yang, Y.; Ren, L.; Zhang, C.; Huang, S.; Liu, T. Facile fabrication of functionalized graphene sheets (FGS)/ZnO nanocomposites with photocatalytic property. ACS Appl. Mater. Interfaces 2011, 3, 2779–2785. [Google Scholar] [CrossRef]
  39. Lee, M.; Zine, N.; Baraket, A.; Zabala, M.; Campabadal, F.; Caruso, R.; Trivella, M.G.; Jaffrezic-Renault, N.; Errachid, A. A novel biosensor based on hafnium oxide: Application for early stage detection of human interleukin-10. Sens. Actuators B Chem. 2012, 175, 201–207. [Google Scholar] [CrossRef]
  40. Srinivasan, V.S.; Pandya, A. Dosimetry aspects of hafnium oxide metal-oxide-semiconductor (MOS) capacitor. Thin Solid Films 2011, 520, 574–577. [Google Scholar] [CrossRef]
  41. Kwatra, D.; Venugopal, A.; Anant, S. Nanoparticles in radiation therapy: A summary of various approaches to enhance radiosensitization in cancer. Transl. Cancer Res. 2013, 2, 330–342. [Google Scholar]
  42. Jayaraman, V.; Bhavesh, G.; Chinnathambi, S.; Ganesan, S.; Aruna, P. Synthesis and characterization of hafnium oxide nanoparticles for bio-safety. Mater. Express 2014, 4, 375–383. [Google Scholar] [CrossRef]
  43. Ahmad, M.; Iqbal, Z.; Hong, Z.; Yang, J.; Zhang, Y.; Khalid, N.; Ahmed, E. Enhanced sunlight photocatalytic performance of hafnium doped ZnO nanoparticles for methylene blue degradation. Integr. Ferroelectr. 2013, 145, 108–114. [Google Scholar] [CrossRef]
  44. Cho, B.H.; Ko, W.B. Preparation of graphene-ZrO2 nanocomposites by heat treatment and photocatalytic degradation of organic dyes. J. Nanosci. Nanotechnol. 2013, 13, 7625–7630. [Google Scholar] [CrossRef] [PubMed]
  45. Foster, A.S.; Gejo, F.L.; Shluger, A.; Nieminen, R.M. Vacancy and interstitial defects in hafnia. Phys. Rev. B 2002, 65, 174117. [Google Scholar] [CrossRef] [Green Version]
  46. Ni, J.; Zhou, Q.; Li, Z.; Zhang, Z. Oxygen defect induced photoluminescence of hf o 2 thin films. Appl. Phys. Lett. 2008, 93, 011905. [Google Scholar] [CrossRef]
  47. Ramadoss, A.; Krishnamoorthy, K.; Kim, S.J. Novel synthesis of hafnium oxide nanoparticles by precipitation method and its characterization. Mater. Res. Bull. 2012, 47, 2680–2684. [Google Scholar] [CrossRef]
  48. Shanmugam, M.; Jayavel, R. Synthesize of graphene-tin oxide nanocomposite and its photocatalytic properties for the degradation of organic pollutants under visible light. J. Nanosci. Nanotechnol. 2015, 15, 7195–7201. [Google Scholar] [CrossRef]
  49. Stankovich, S.; Dikin, D.A.; Piner, R.D.; Kohlhaas, K.A.; Kleinhammes, A.; Jia, Y.; Wu, Y.; Nguyen, S.T.; Ruoff, R.S. Synthesis of graphene-based nanosheets via chemical reduction of exfoliated graphite oxide. Carbon 2007, 45, 1558–1565. [Google Scholar] [CrossRef]
  50. Zhang, Y.; Tang, Z.-R.; Fu, X.; Xu, Y.-J. TiO2-graphene nanocomposites for gas-phase photocatalytic degradation of volatile aromatic pollutant: Is TiO2-graphene truly different from other TiO2-carbon composite materials? ACS Nano 2010, 4, 7303–7314. [Google Scholar] [CrossRef]
  51. Revathi, P.; Krishnasamy, K. A facile synthesis of RGO/HfO2 nanocomposite for high-performance supercapacitor. Mater. Today Proc. 2021, 47, 1–7. [Google Scholar] [CrossRef]
  52. Krishnakumar, B.; Imae, T.; Miras, J.; Esquena, J. Synthesis and azo dye photodegradation activity of ZrS2–ZnO nanocomposites. Sep. Purif. Technol. 2014, 132, 281–288. [Google Scholar] [CrossRef]
  53. Jayaraman, A.; Wang, S.; Sharma, S.; Ming, L. Pressure-induced phase transformations in HfO2 to 50 GPa studied by Raman spectroscopy. Phys. Rev. B 1993, 48, 9205. [Google Scholar] [CrossRef] [PubMed]
  54. Zhou, K.; Zhu, Y.; Yang, X.; Jiang, X.; Li, C. Preparation of graphene–TiO2 composites with enhanced photocatalytic activity. New J. Chem. 2011, 35, 353–359. [Google Scholar] [CrossRef]
  55. Dar, R.A.; Naikoo, G.A.; Srivastava, A.K.; Hassan, I.U.; Karna, S.P.; Giri, L.; Shaikh, A.M.; Rezakazemi, M.; Ahmed, W. Performance of graphene-zinc oxide nanocomposite coated-glassy carbon electrode in the sensitive determination of para-nitrophenol. Sci. Rep. 2022, 12, 117. [Google Scholar] [CrossRef] [PubMed]
  56. Takeuchi, H.; Ha, D.; King, T.-J. Observation of bulk HfO2 defects by spectroscopic ellipsometry. J. Vac. Sci. Technol. A Vac. Surf. Films 2004, 22, 1337–1341. [Google Scholar] [CrossRef]
  57. Sun, Z.; Yan, Z.; Yao, J.; Beitler, E.; Zhu, Y.; Tour, J.M. Growth of graphene from solid carbon sources. Nature 2010, 468, 549–552. [Google Scholar] [CrossRef]
  58. Pouretedal, H.R.; Norozi, A.; Keshavarz, M.H.; Semnani, A. Nanoparticles of zinc sulfide doped with manganese, nickel and copper as nanophotocatalyst in the degradation of organic dyes. J. Hazard. Mater. 2009, 162, 674–681. [Google Scholar] [CrossRef]
  59. Liu, Q.; Liu, Z.; Zhang, X.; Yang, L.; Zhang, N.; Pan, G.; Yin, S.; Chen, Y.; Wei, J. Polymer photovoltaic cells based on solution-processable graphene and P3HT. Adv. Funct. Mater. 2009, 19, 894–904. [Google Scholar] [CrossRef]
  60. Liu, Q.; Liu, Z.; Zhang, X.; Zhang, N.; Yang, L.; Yin, S.; Chen, Y. Organic photovoltaic cells based on an acceptor of soluble graphene. Appl. Phys. Lett. 2008, 92, 223303. [Google Scholar] [CrossRef] [Green Version]
  61. Zhu, J.; Ren, J.; Huo, Y.; Bian, Z.; Li, H. Nanocrystalline Fe/TiO2 visible photocatalyst with a mesoporous structure prepared via a nonhydrolytic sol-gel route. J. Phys. Chem. C 2007, 111, 18965–18969. [Google Scholar] [CrossRef]
  62. Gawande, S.B.; Thakare, S.R. Graphene wrapped BiVO4 photocatalyst and its enhanced performance under visible light irradiation. Int. Nano Lett. 2012, 2, 11. [Google Scholar] [CrossRef] [Green Version]
  63. Mahalingam, S.; Ramasamy, J.; Ahn, Y.-H. Synthesis and application of graphene-αMoO3 nanocomposite for improving visible light irradiated photocatalytic decolorization of methylene blue dye. J. Taiwan Inst. Chem. Eng. 2017, 80, 276–285. [Google Scholar] [CrossRef]
  64. Atchudan, R.; Edison, T.N.J.I.; Perumal, S.; Karthik, N.; Karthikeyan, D.; Shanmugam, M.; Lee, Y.R. Concurrent synthesis of nitrogen-doped carbon dots for cell imaging and ZnO@ nitrogen-doped carbon sheets for photocatalytic degradation of methylene blue. J. Photochem. Photobiol. A Chem. 2018, 350, 75–85. [Google Scholar] [CrossRef]
  65. Das, S.; Ahn, Y.-H. Synthesis and application of CdS nanorods for LED-based photocatalytic degradation of tetracycline antibiotic. Chemosphere 2022, 291, 132870. [Google Scholar] [CrossRef]
Figure 1. XRD pattern of (a) HfO2 nanoparticles, (b) graphene, and (ce) HfO2-graphene (10, 30, and 50 wt%) nanocomposites.
Applsci 12 11222 g001
Figure 2. Raman spectra of HfO2 nanoparticles, graphene, HfO2-graphene (10, 30, and 50 wt%) nanocomposites.
Applsci 12 11222 g002
Figure 3. SEM images of (a) HfO2 nanoparticles, (b) graphene, (c) HfO2-graphene (10 wt%) nanocomposite, and (d) HfO2-graphene (50 wt%) nanocomposites.
Applsci 12 11222 g003
Figure 4. HR-TEM images of (a) HfO2 nanoparticles, (b) graphene, (c) HfO2-graphene (10 wt%) nanocomposite, and (d) HfO2-graphene (50 wt%) nanocomposite.
Applsci 12 11222 g004
Figure 5. EDX spectrum of HfO2-graphene nanocomposite.
Applsci 12 11222 g005
Figure 6. (a) UV-Visible absorption spectra of HfO2 nanoparticles, graphene, and HfO2-graphene (10, 30, and 50 wt%) nanocomposites, (b) Variation of (αhν)2 with photon energy for graphene and HfO2 and HfO2-graphene (10, 30, and 50 wt%) nanocomposites.
Applsci 12 11222 g006
Figure 7. UV-vis absorption spectra of MB solution during the photodegradation under UV light. (a) HfO2-graphene (50 wt%) nanocomposites, (b) different dosages of catalysts, (c) c/c0 vs. time, (d) number of recycling tests, and (e) scavenger test photodegradation of MB solution by all the catalysts.
Applsci 12 11222 g007
Figure 8. Photographic image of MB dye solution in the presence of HfO2-graphene nanocomposite after 180 min of UV-light irradiation.
Applsci 12 11222 g008
Figure 9. Photocatalytic efficiency of tetracycline degradation as a function of irradiation time under UV light using HfO2-graphene (A). Rate of degradation of tetracycline under UV light (B).
Applsci 12 11222 g009
Figure 10. Proposed reaction mechanism for the photocatalytic dye degradation of MB dye by HfO2-graphene (50 wt%) nanocomposites under UV illumination.
Applsci 12 11222 g010
Table 1. Comparison of photocatalytic MB dye degradation efficiency of HfO2-graphene.
NanocompositesIrradiation Source DyeIrradiation Time (min)Degradation (%)References
P25-grapheneUVMB dye6085[36]
Graphene-SnO2UVMB dye360100[37]
TiO2-graphenesunlightMB dye18075[50]
graphene-BiVO4Visible lightMB dye18089[62]
G- αMoO3UVMB dye18097[63]
GO-TiO2UVMO dye24075[64]
HfO2-grapheneUVMB dye18098.5This work
Publisher’s Note: MDPI stays neutral with regard to jurisdictional claims in published maps and institutional affiliations.

