1. Introduction
Forcibly displaced people (FDP) refers to a group of people who leave their home or home region involuntarily due to conflicts, generalized violence, persecution, or human rights violations [
1]. The global FDP population surpassed 100 million in mid-2022, which represents more than 1% of the global population [
2]. Refugees, as an important category of FDP, refer to a group of people who are outside their home country and have received recognized mandates from the United Nations (UN) [
3]. Approximately 86% of global refugees are hosted by low- and middle-income countries which usually cannot provide sufficient living space, medical services, food, water, and sanitation [
4]. United Nations High Commissioner for Refugees (UNHCR) [
5] together with many non-governmental organizations such as Médecins Sans Frontières (MSF, Doctors Without Borders in English) [
6] have provided multiple humanitarian operations, including allocation and distribution of living resources and medical services to protect refugees.
Estimating the refugee population in need is essential for the logistics planning of humanitarian aid [
7]. However, in most cases, it is difficult to collect such information in the field due to security and access reasons [
8,
9]. With the availability of very high spatial resolution satellite imagery, remote sensing has become one of the most powerful tools for population estimation for humanitarian operations over the last decade [
8,
10,
11,
12,
13,
14]. Refugee-dwelling footprints are useful in population estimation [
15,
16]. Therefore, producing high-quality refugee dwelling footprints efficiently can save much time for urgent humanitarian operations [
17].
Multiple remote sensing image analysis techniques have been applied for this dwelling-extraction task during the last decade. Visual interpretation is thought to be capable of producing the refugee-dwelling footprints with the highest accuracy even though it still includes errors from inter-variability of observations [
8]. However, it is labour-intensive and time-consuming [
8]. Over the last decade, the OBIA approach has been widely applied to this task. Researchers have developed mature processing routines for producing refugee-dwelling footprints [
18,
19,
20]. Nevertheless, due to the fast dynamics and diverse ontology of dwellings, the complexity and transferability of OBIA rulesets remain challenging [
21].
In the past ten years, the development of deep learning in computer vision [
22,
23] has boosted a large number of applications in remote sensing [
24,
25,
26]. However, related research for this extraction task is still limited. One main reason is the unavailability of adequate accurate label data of refugee dwellings [
27] because most refugees are hosted by the countries where accurate label data of the footprints are not available in open sources, such as Open Street Map.
With the efforts of researchers and staff from humanitarian services at the Department of Geoinformatics Z_GIS, a large amount of label data for FDP dwellings has been produced by semi-automatic approaches (e.g., OBIA), with limited manual correction as post-processing [
8]. Nevertheless, due to the urgency of the humanitarian operations, the produced OBIA labels may exhibit several types of annotation errors. Therefore, the OBIA label data are considered “noisy label data” compared with manually annotated label data (Manual labels). To the best of our knowledge, no research thus far has discussed whether we can make use of the generated tremendous OBIA labels to replace the Manual labels for this extraction task by deep learning approaches.
Currently, there are numerous deep learning models for remote-sensing-based building extraction tasks [
28]. However, up to now, very few of them have been applied for this task. O. Ghorbanzadeh et al. [
29] designed shallow convolutional neural networks (CNNs) to extract refugee dwellings in the Minawao refugee camp in northern Cameroon. The prediction results prove that CNNs have a high potential in this task. J. A. Quinn et al. [
30] selected Mask-RCNN with ResNet-101 as a backbone to extract dwellings in multiple refugee camps. L. Wickert et al. [
31] chose a Faster-RCNN model with ResNet-50 as a backbone to count dwellings in refugee camps. D. Tiede et al. [
32] selected a Mask-RCNN model with ResNet-50 as a backbone to extract built-up structures in Khartoum in Sudan for fast humanitarian operations. G. W. Gella et al. [
33] tested the spatial transferability of U-Net in this extraction task. G. W. Gella et al. [
34] selected a Mask-RCNN model with ResNet-101 as a backbone to extract refugee dwellings in Cameroon. Y. Lu and C. Kwan [
35] tested the performance of multiple neural networks and found that a fully neural network (FCN) outperforms Mask-RCNN in detecting refugee tents near the Syria–Jordan border.
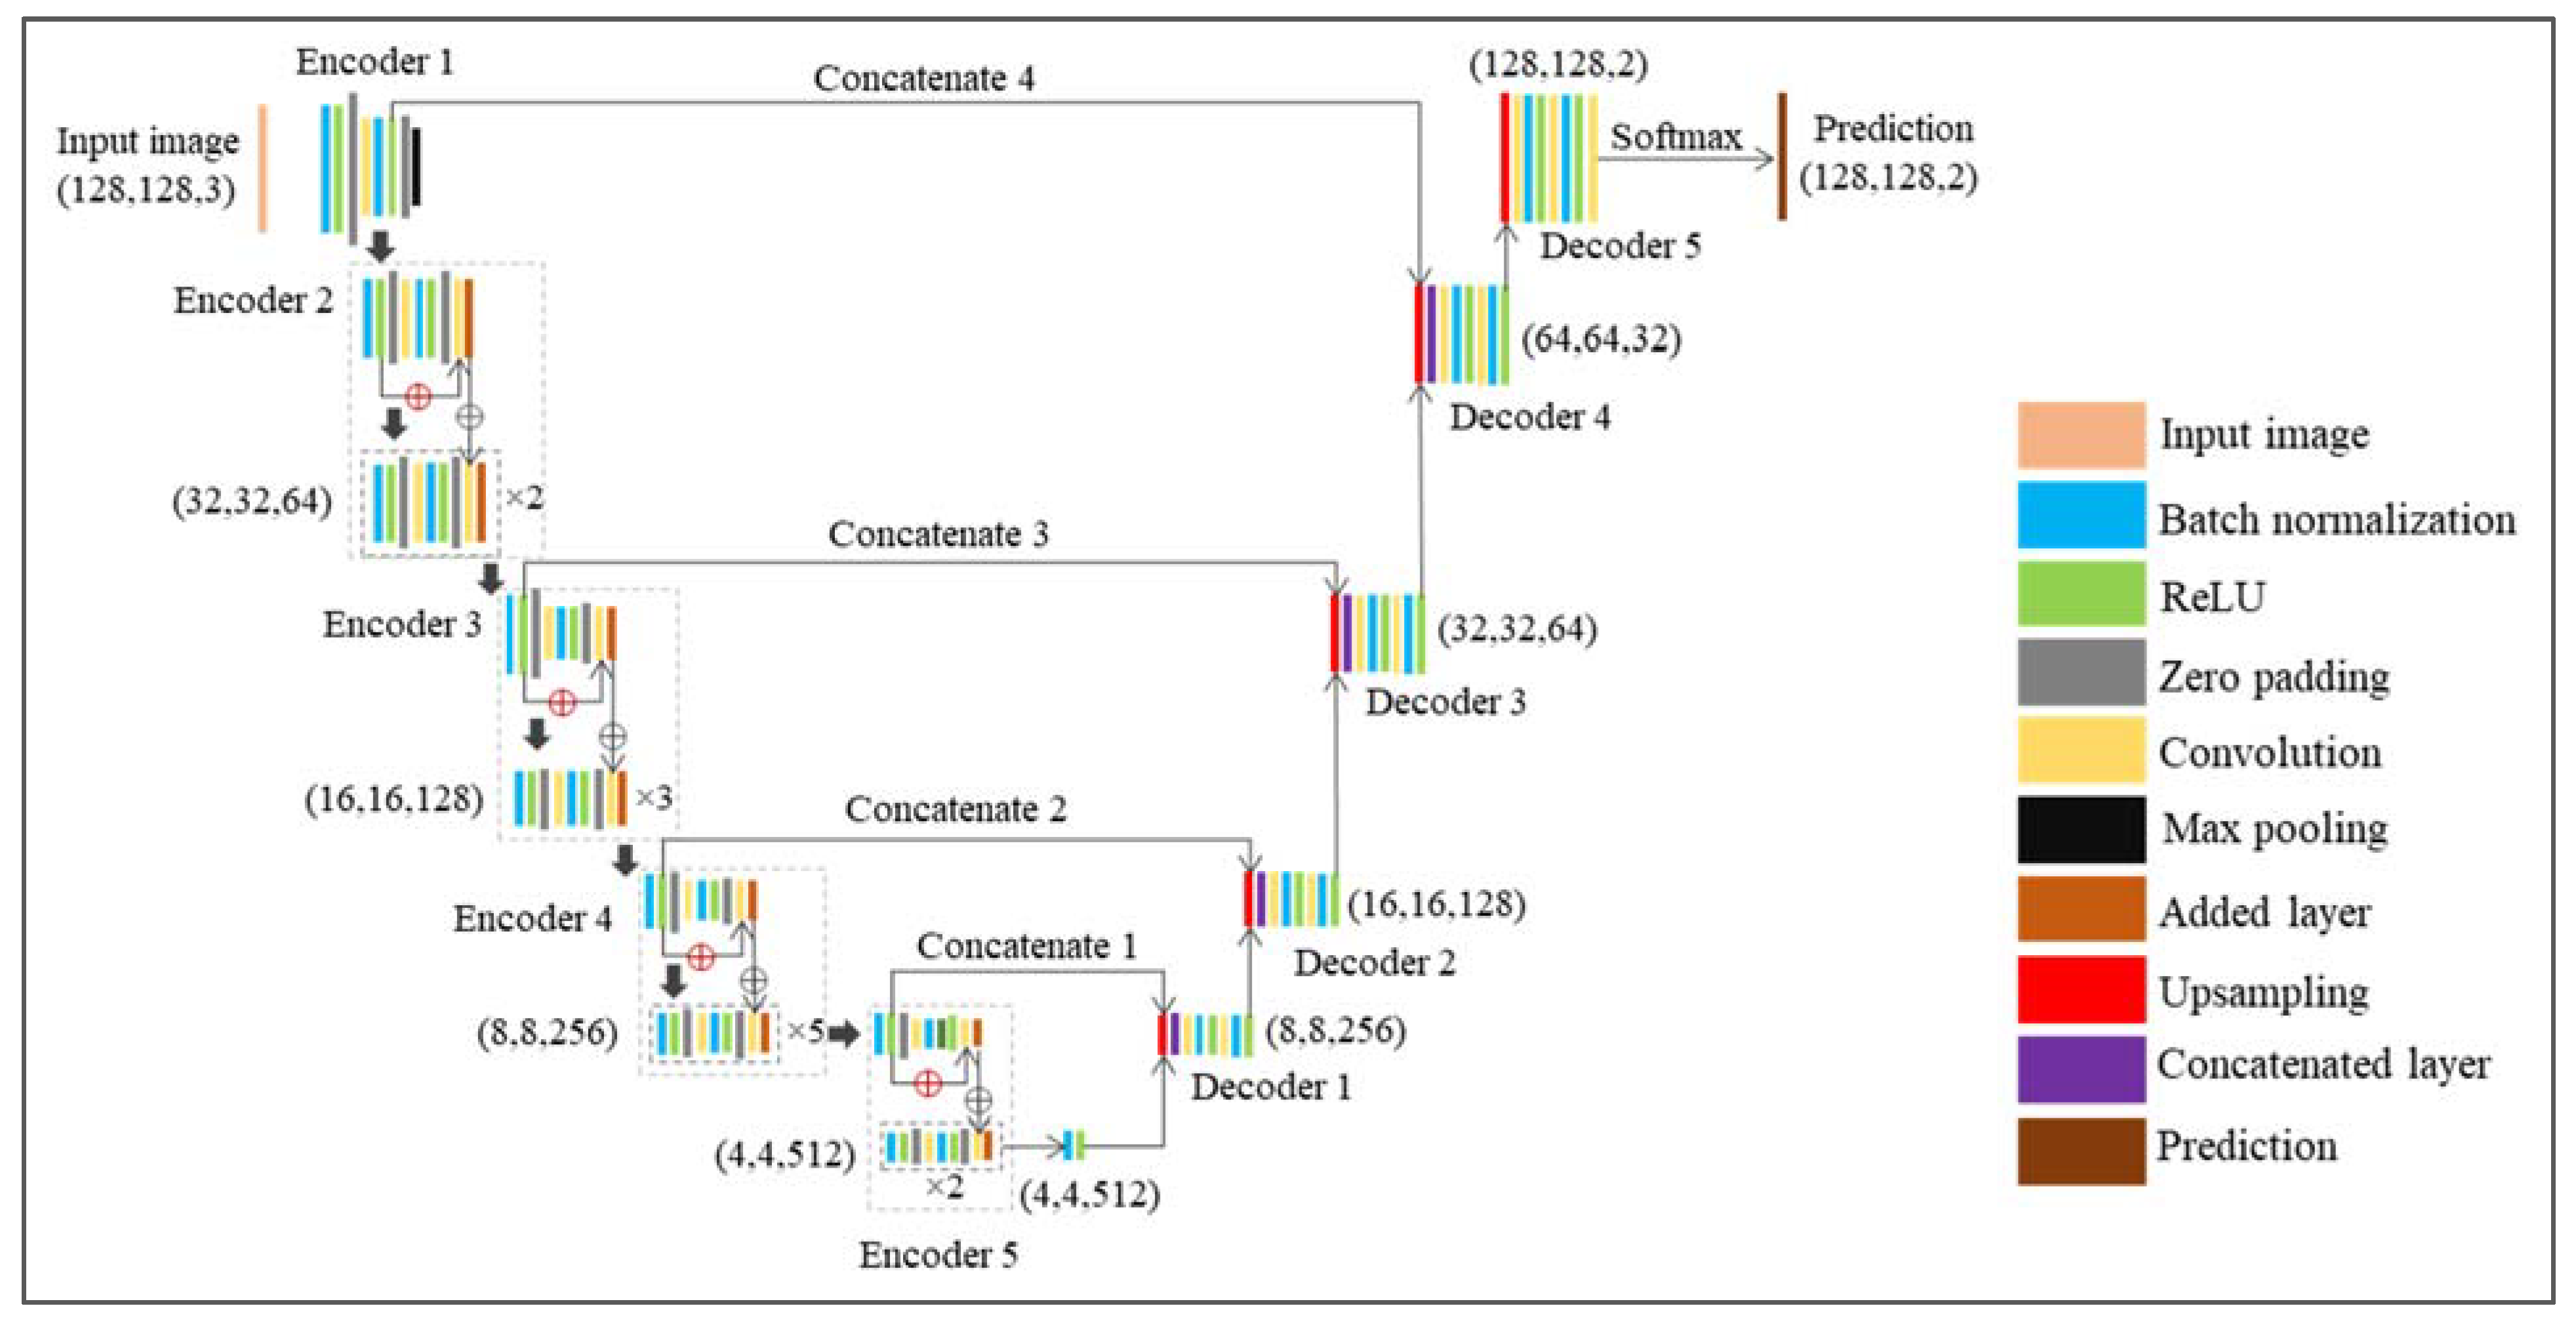
On the basis of the findings from Y. Lu and C. Kwan [
35], this research selected an FCN model for semantic segmentation for all experiments. Semantic segmentation can assign a class label to each pixel in an image to produce a fine-grained delineation of target objects with embedded spatial information [
36] and has been proven to be robust in labelling noise in image analysis applications [
37,
38].
Up to now, many techniques have been developed to handle label noise in deep learning. Karimi et al. [
39] reviewed related techniques and categorized them into six major classes, as shown in
Figure 1. Recent progress in weakly supervised semantic segmentation (WSSS) enables CNNs to learn from weakly labelled data such as image-level annotations for semantic segmentation tasks. Related techniques such as self-supervised equivariant attention mechanism [
40], group-wise learning [
41], regional semantic contrast and aggregation [
42], and adaptive early-learning correction [
43] for WSSS also bring high value to make the best of the OBIA label data for refugee dwelling extraction tasks.
Among all techniques, intermixing training data from multiple sources proved to be a less intuitive but effective approach to increase the robustness of deep learning models for image segmentation [
39]. Touzani and Granderson [
44] intermixed image data from multiple study sites, various dates, and/or different sensors and trained models with label data from the Microsoft building footprint dataset to extract building footprints from satellite imagery. The results reveal that intermixing training data from multiple sources can produce promising results despite label noise. Inspired by these findings, this research selected intermixing as the strategy to handle the label noise issue as a starting point.
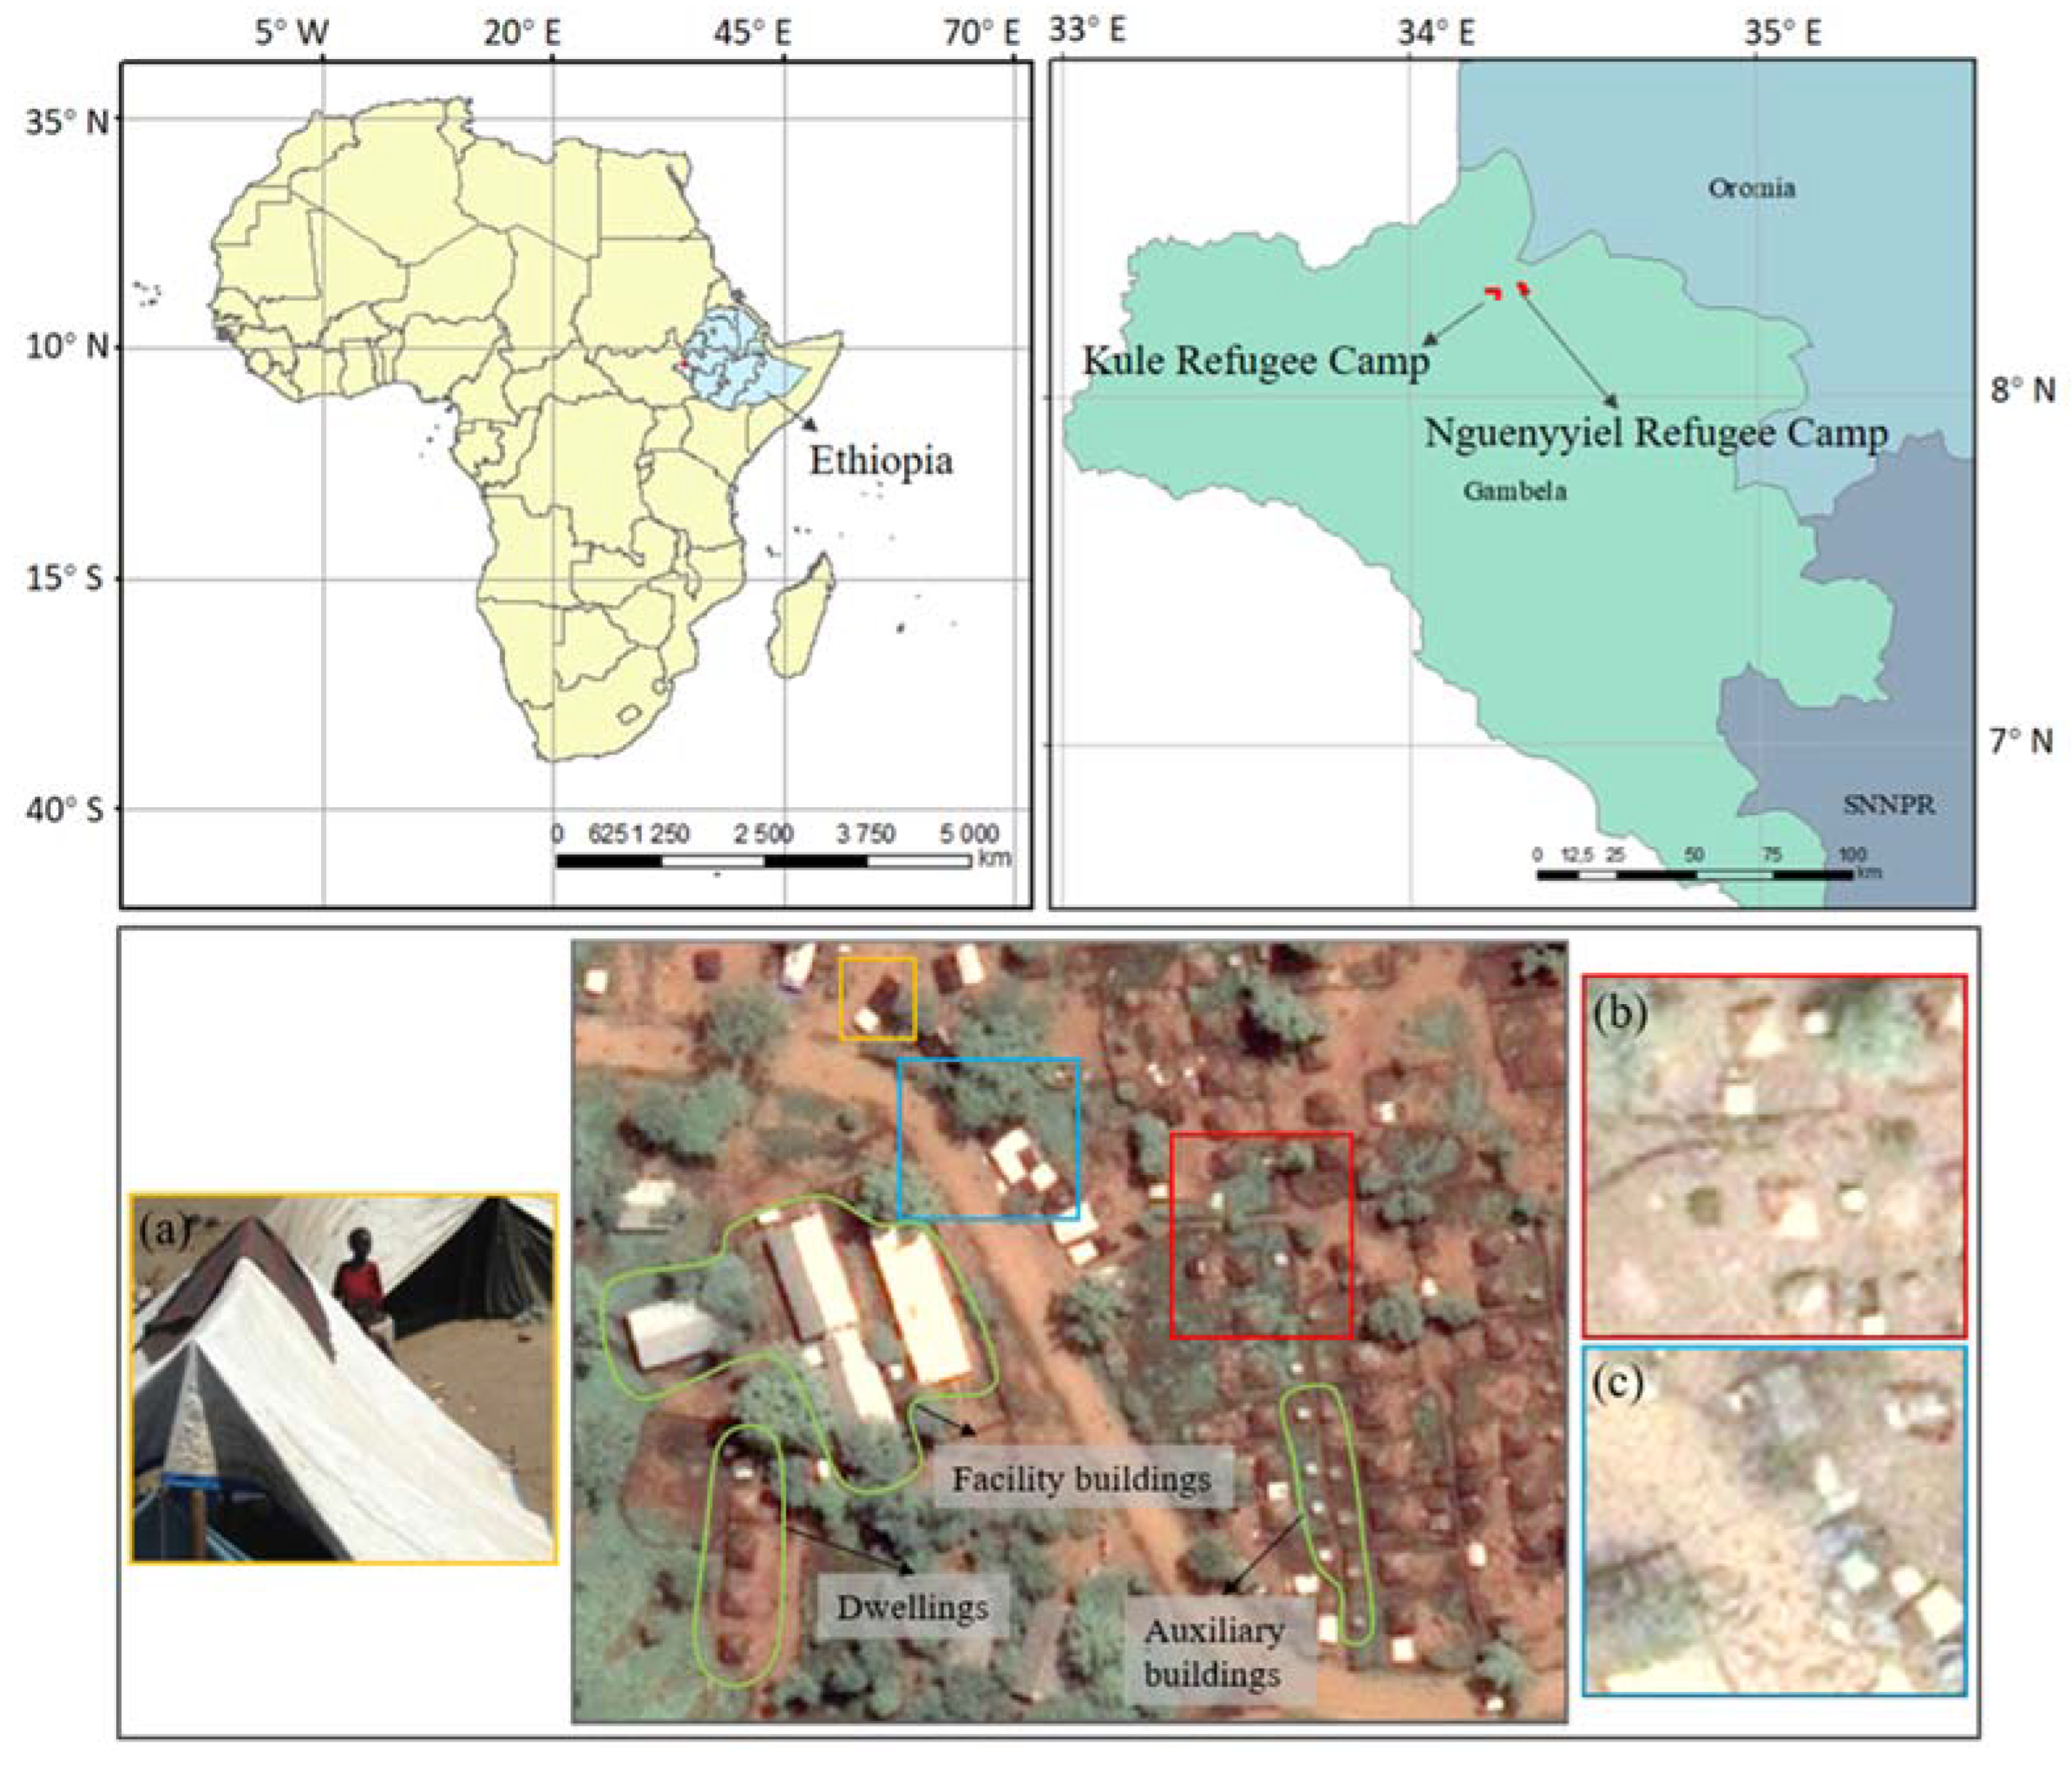
Inspired by this idea, we selected data from two refugee camps (Kule and Nguenyyiel in Ethiopia) from a dry season and a wet season (seen in
Section 2.1) and designed multiple intermixing strategies (seen in
Section 2.5) to make the comparison between the OBIA labels and the Manual labels in extracting refugee-dwelling footprints from very high-spatial-resolution satellite imagery (Pléiades-1, seen in
Section 2.2) by semantic segmentation (U-Net with ResNet-34 as a backbone, seen in
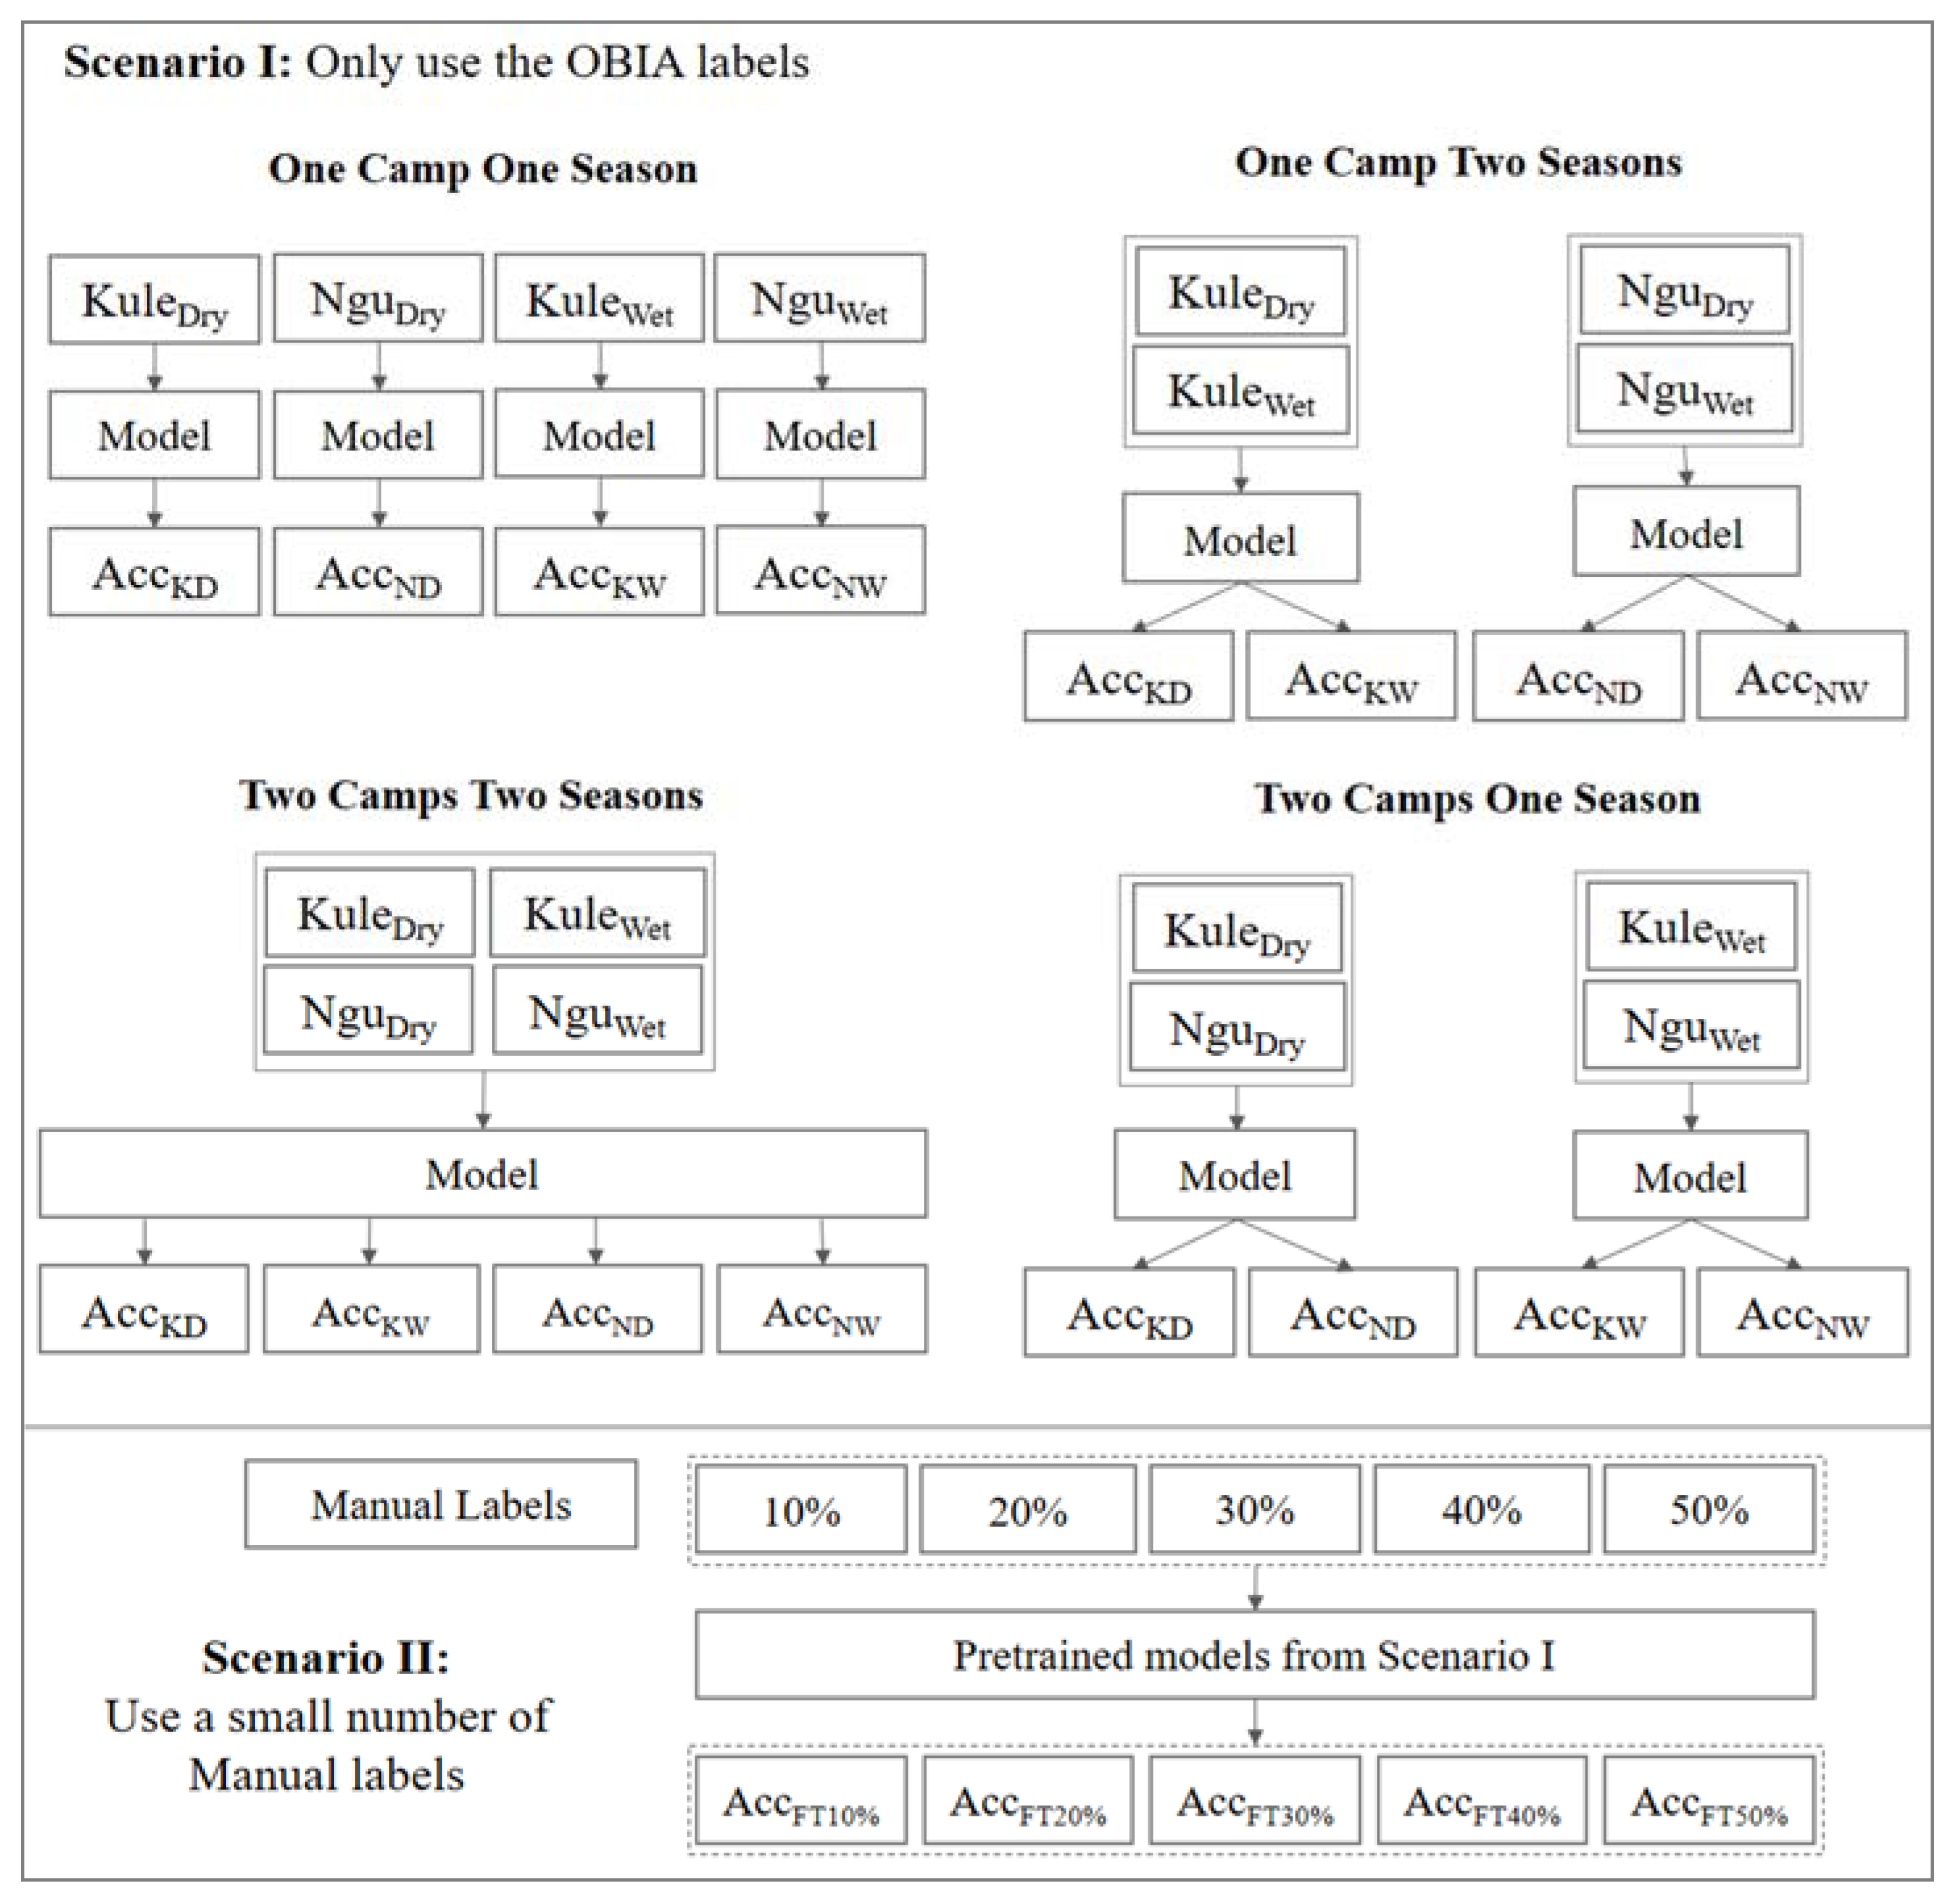
Section 2.3). In addition, we used a small amount (i.e., 10%, 20%, 30%, 40%, and 50%) of the Manual labels to fine-tune models trained with the OBIA labels to verify whether we can use a smaller amount of the Manual labels and existing OBIA labels to achieve similar performance as that of the models purely trained with a large amount of the Manual labels (seen in
Section 2.5).
The main contribution of this research is that we first prove the OBIA labels, even though they include delineation errors, have very high potential to replace the manual labels, to a certain extent, in extracting refugee-dwelling footprints. Additionally, fine-tuning models trained with the OBIA labels with a small amount of the Manual labels can outperform models trained with purely Manual labels. The currently available OBIA labels from the last decade’s humanitarian operations could be fuel for future deep-learning-based refugee-dwelling extraction tasks.
3. Results
Table 2,
Table 3 and
Table 4 show the IoU, Precision, and Recall values of all implemented experiments for the two scenarios, as shown in
Figure 7. To simplify the text, we use
Kule to replace the Kule refugee camp and
Kule Dry (or
Wet) to replace the Kule refugee camp during the dry (or wet) season.
Nguenyyiel and
Nguenyyiel Dry (or
Wet) follow the same nomenclature. In addition, we use
OBIA-OCOS models, and
Manual-OCOS models to represent models trained with the OBIA labels and the Manual labels by the OCOS strategy, respectively. The other three strategies (OCTS, TCOS, and TCTS) follow the same nomenclature. The highest values of metrics for each camp and season by each training strategy are highlighted in blue. The highest values for each camp and season among all training strategies are highlighted in red.
3.1. Scenario I
In terms of IoU values, we can observe four main findings. Firstly, models trained with the Manual labels outperform models trained with the OBIA labels in both camps during both seasons under all four training strategies. Secondly, the accuracy differences in Kule cases are higher than those in the Nguenyyiel cases. For example, in the Kule Dry case, the OBIA-OCOS model can produce an IoU value of 0.5113, while it is 0.5857 for the Manual-OCOS model. However, for the Nguenyyiel Dry case, the IoU values of the OBIA-OCOS model and the Manual-OCOS model are 0.6051 and 0.6377, respectively. Thirdly, the IoU values from the wet season are higher than those from the dry season. For instance, the IoU values of the OBIA-OCOS model and the Manual-OCOS model in the Kule Wet case are 0.5539 and 0.6400, respectively, which are higher than the values (0.5113, 0.5857) from the dry season. Last but not least, we can observe that the changes in IoU values (within 0.01, in general) brought by the three intermixing strategies are insignificant for the Manual labels. For the OBIA labels, the TCTS intermixing strategy shows a stable but limited improvement (approximately 0.01). The other two intermixing strategies cannot consistently improve the model performance. Instead, they decrease the IoU values in most cases.
The Recall values share similar findings as the IoU values, as shown in
Table 3. We can observe the TCTS intermixing strategy brings a consistent improvement (approximately 0.01) for the models trained with the OBIA labels, but the other two strategies harm the model performance in most cases.
For Precision values as shown in
Table 4, we can observe that the OBIA labels outperform the Manual labels in Precision values in all implemented experiments. On the contrary, the Manual labels outperform the OBIA labels in terms of Recall. For instance, in the Nguenyyiel Wet case, the Precision values of the OBIA-OCOS model and the Manual-OCOS model are 0.8545 and 0.8147, respectively. However, the Recall values of the same two models are 0.6890 and 0.7638, respectively. This finding indicates that the annotation errors in the OBIA labels cause models to miss much of TP in prediction.
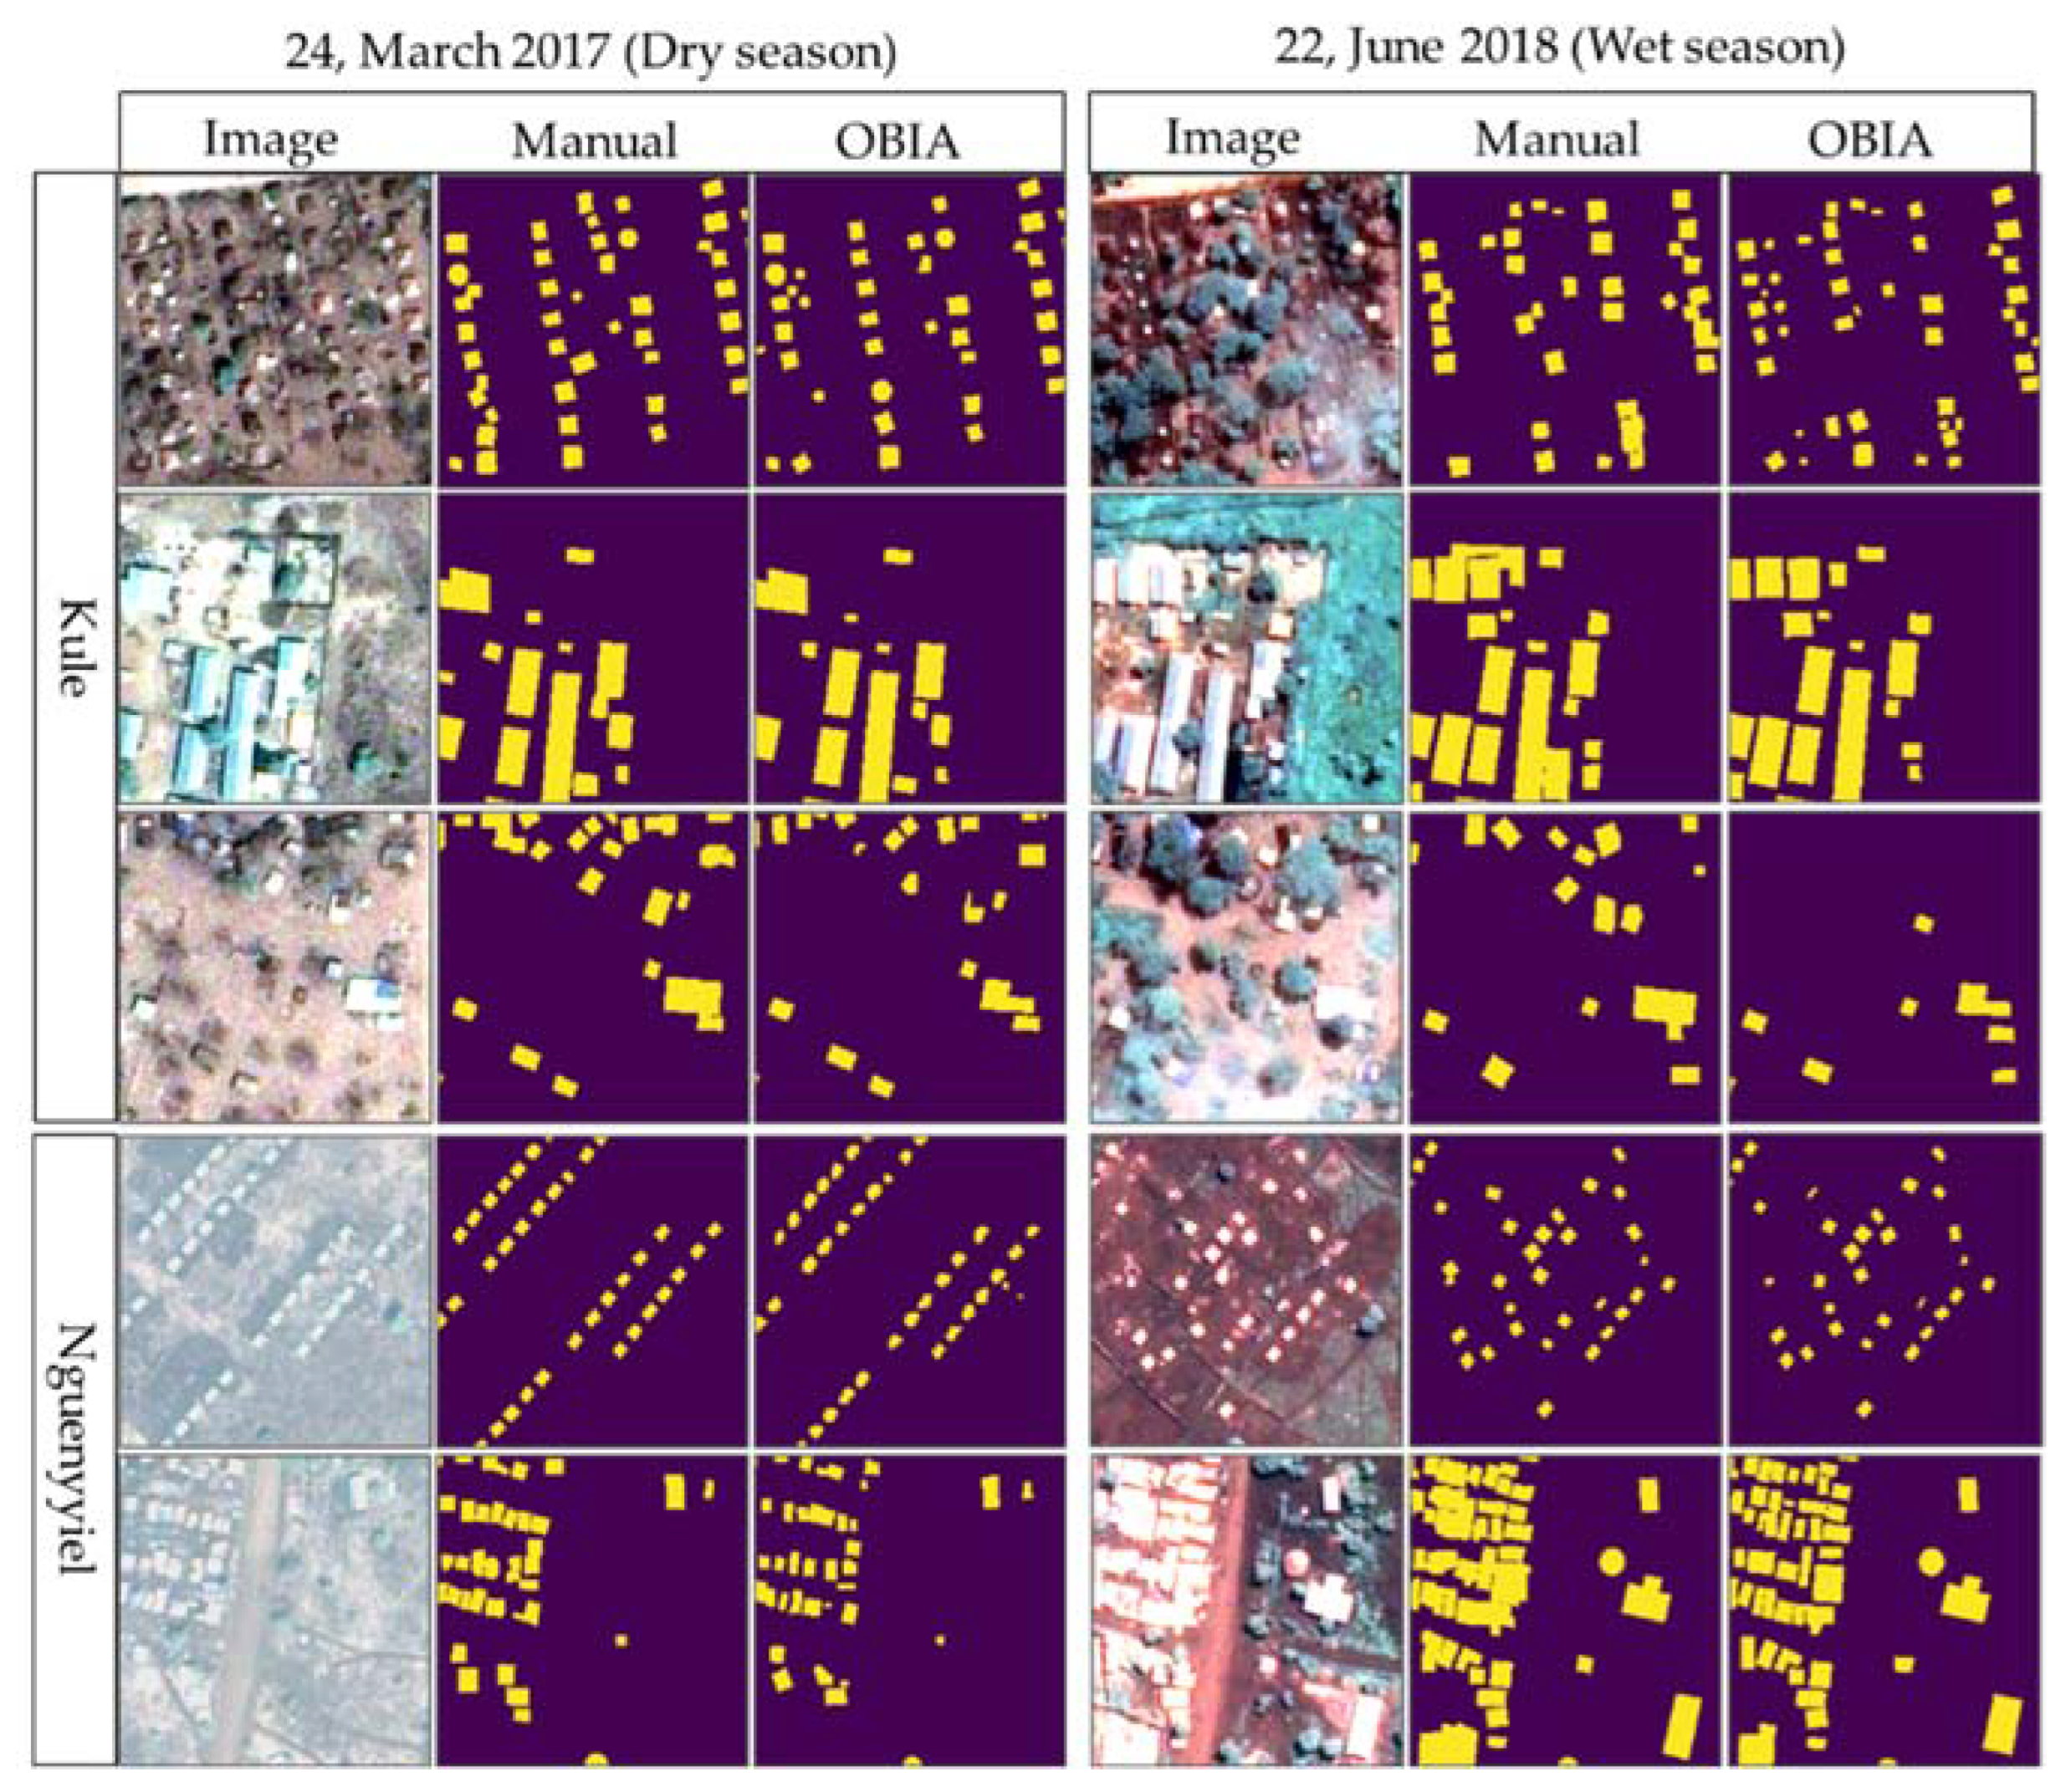
In the following content, we used Kule Wet as an example to explain the above findings because Kule Wet includes the most typical examples for an explanation.
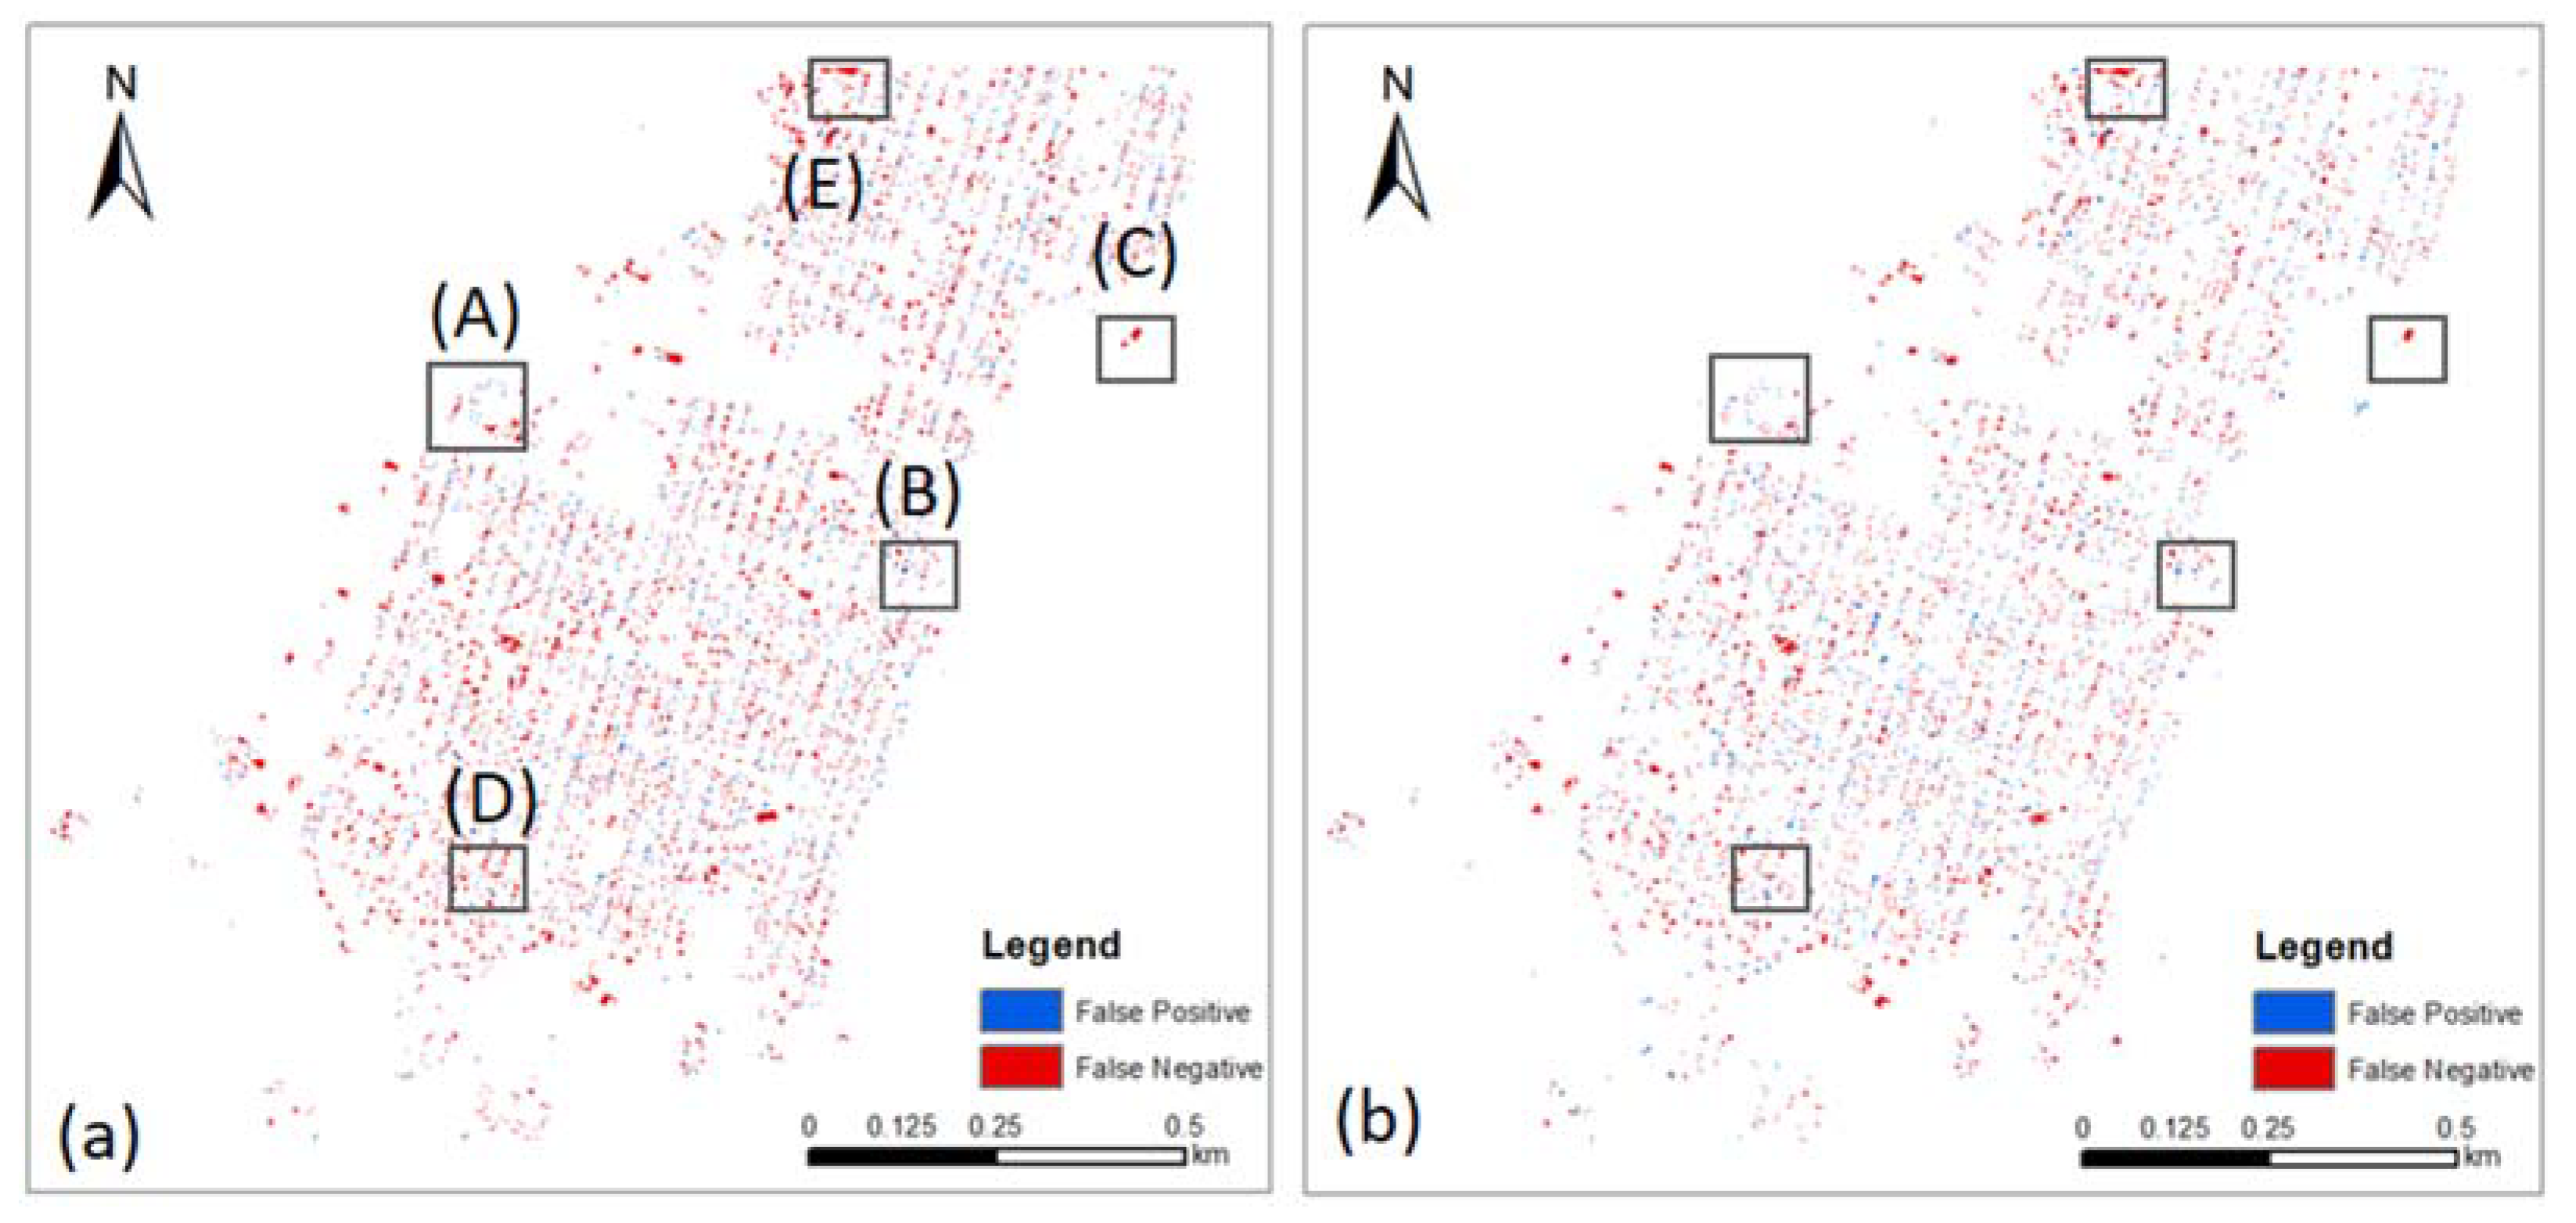
Figure 8 displays the spatial distribution of predicted FP (blue) and FN (red) pixels of the OBIA-OCOS model (left) and the Manual-OCOS model (right).
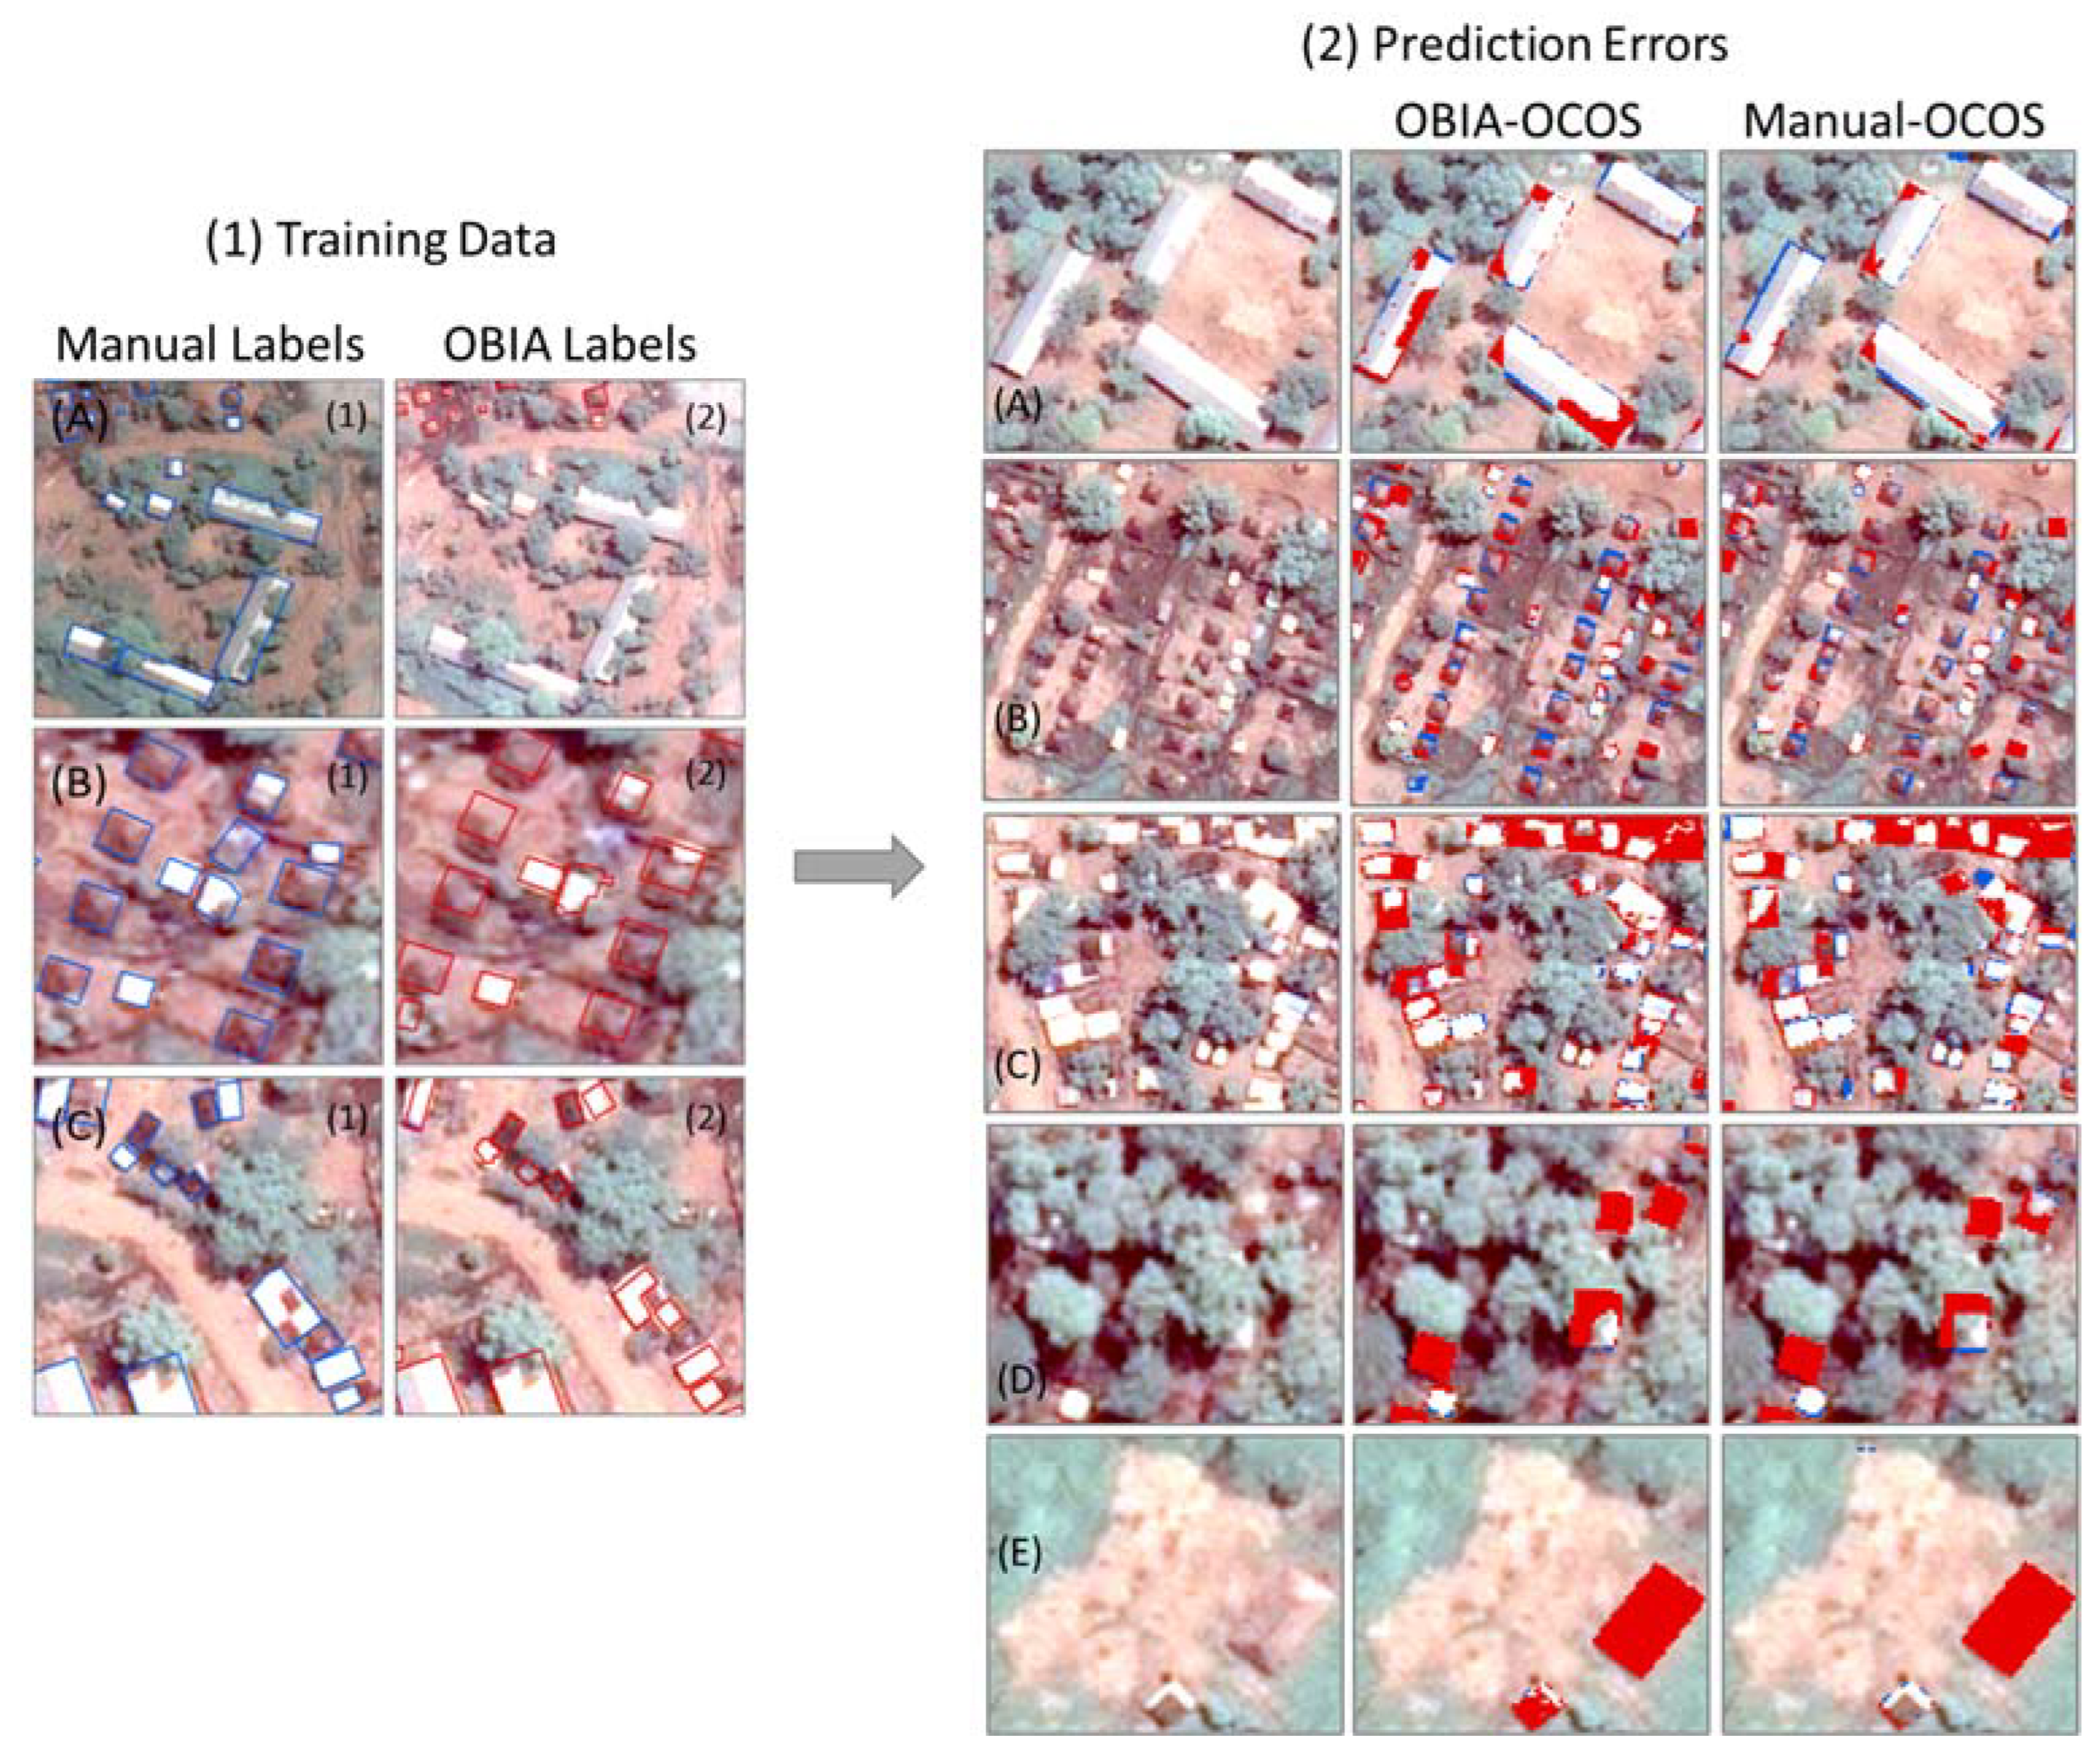
Overall, we can observe the two models share a similar spatial distribution of FP and FN pixels, but the OBIA-OCOS model produced more falsely predicted pixels. We selected five typical examples (A)–(E) to further show the prediction differences between the two models, as shown in
Figure 9. In general, we found four main sources of errors coming from facility buildings, trees, boundaries, and brown cloth on the rooftop of dwellings.
There are two main types of facility buildings in the selected camps. Most facility buildings are white and grey in terms of spectral characteristics. Only a few of them are brownish. The OBIA labels missed some of the white and grey facility buildings in training data as shown in
Figure 9(1A). This can be the reason that the Manual-OCOS models perform better than the OBIA-OCOS models for this type. For brownish facility buildings, both models cannot perform well, as shown in
Figure 9(2E). This may be due to the very limited number of such structures in training data and the high similarity to the surrounding environment.
The occlusion of trees increases the difficulty of detecting target built-up structures. Both types of models cannot detect most brownish dwellings partially covered by trees, as shown in
Figure 9(2D). However, due to the limited number of tree-occluded brownish dwellings, this type of error may not play a significant role in the results. Additionally, we can observe the IoU values from the wet season are higher than those from the dry season. This indicates that the similarity between target-up structures and the surrounding environment may play a more important role in this extraction task.
The prediction errors around the boundaries of target built-up structures widely spread the whole testing area for both models, as shown in
Figure 8.
Figure 9(1B) presents an example showing the difference in the annotation of dwellings between the OBIA labels and the Manual labels. We can observe an obvious shift of the OBIA labels compared with the Manual labels, which may cause more predicted FN and FP pixels. In addition, due to the difficulty of determining the exact boundaries of built-up structures, the Manual-OCOS models also unavoidably have FN and FP pixels around the boundaries. These incorrectly predicted pixels around the boundaries are the major source of errors at pixel levels for both types of labels. This type of error is also the main reason that the Manual labels outperform the OBIA labels in terms of IoU values.
Last but not least, models trained with either type of label are unable to detect brown cloth on the top of large dwellings that are densely distributed, as shown in
Figure 9(2C). This is likely because both spatial distribution patterns (too dense) and the size (much larger) are different from most dwellings. However, for smaller dwellings covered by brown cloth, the Manual-OCOS models perform better than OBIA-OCOS models. This is mainly because the OBIA labels usually ignore brown parts within a dwelling and separate them into several individual dwellings, as shown in
Figure 9(1C).
3.2. Scenario II
In Scenario II, we used different shares (10%, 20%, 30%, 40%, and 50%) of the Manual labels to fine-tune the models pretrained with the OBIA labels from Scenario I. The results reveal that the fine-tuning approach can produce a comparable or even better performance than the models trained with purely Manual labels. For example, the IoU value of the Manual-OCOS model for the Kule Dry is 0.5857. Fine-tuning the OBIA-OCOS model with 20% of the Manual labels improves the IoU value to 0.6033. The fine-tuned models produced all of the highest IoU values (highlighted in red) for each camp during each season. Based on the existing results, it is not found that intermixing training strategies are influential in the fine-tuning results. Additionally, most of the highest IoU values occur in between 20% and 40% of cleaned labels. However, no such stable percentage was found to perform the best in all cases. More research is required to dissect the further relations between these factors.
4. Discussion
This research aims to verify whether we can use the OBIA labels to replace the Manual labels with intermixing strategies (Scenario I), and, if the intermixing strategies fail, whether we can use a smaller number of Manual labels to reduce the manual annotation work (Scenario II) to achieve similar performance to a large number of Manual labels.
Touzani and Granderson [
44] collected building footprints from open data web portals from 15 cities in America as label data for a semantic segmentation model (DeepLab-v3+). The collected labels, similar to the OBIA labels, include many annotation errors. The models trained with mixed datasets from 15 cities can produce a mean IoU value of 0.89. The finding shows the high value of using mixed open datasets from multiple sources to replace manually annotated labels for extracting building footprints. However, the performance of the OBIA labels was slightly improved only by the TCTS intermixing strategy. The other two intermixing strategies even slightly harmed the models. This is perhaps because we selected only two refugee camps. It may be worthwhile to intermix data from more refugee camps to verify whether the intermixing strategy can help improve this extraction task.
As mentioned in the
Section 1, many techniques have been applied to handle label noise in deep learning. In this research, we found that the improvement of intermixing data from multiple sources is limited under the initial set up, but fine-tuning based on the models trained with intermixing data has very high potential.
In terms of the selection of networks, even though it is not the main focus of this research, we can nevertheless find that the selected model performs quite well compared with other models in previous research. G. W. Gella et al. [
34] selected a Mask-RCNN model with ResNet-101 as a backbone to extract refugee dwellings in Cameroon. They used WorldView-3 and WorldView-2 images with a spatial resolution of 0.5 m, which is the same as that used in this research. The Mask-RCNN model produced the mean IoU value up to 0.669 which is lower than the outputs of all experiments here, as shown in
Table A2 in
Appendix A. These comparison results are consistent with the results from Y. Lu and C. Kwan [
35]. In addition, Ref. [
54] compared multiple semantic segmentation models, including three classical deep learning architectures (U-Net, LinkNet, and Feature Pyramid Network (FPN)) and twelve backbones (VGG16, VGG19, ResNet-18, ResNet-34, DenseNet-121, DenseNet-169, Inception-v3, InceptionResnet-v2, MobileNet-v1, MobileNet-v2, EfficientNet-B0, and EfficientNet-B1) to test the validity of the OBIA labels compared with the Manual labels by using the same training and testing data of the Kule refugee camp during the dry and the wet seasons. The results show that these models perform similarly, in general. Therefore, it is necessary to undertake more state-of-the-art techniques in the future to discover more suitable workflows for this task.


