Article

Influence of the Mesh Topology on the Accuracy of Modelling Turbulent Natural and Excited Round Jets at Different Initial Turbulence Intensities

Faculty of Mechanical Engineering and Computer Science, Czestochowa University of Technology, Armii Krajowej 21, 42-201 Czestochowa, Poland
*
Author to whom correspondence should be addressed.
Appl. Sci. 2022, 12(21), 11244; https://doi.org/10.3390/app122111244
Submission received: 15 October 2022 / Revised: 31 October 2022 / Accepted: 3 November 2022 / Published: 6 November 2022

Abstract

:
The paper is aimed at an assessment of the importance of the coordinate system (Cartesian vs. cylindrical) assumed for simulations of free-round jets. The research is performed by applying the large eddy simulation method with spatial discretisation based on high-order compact difference schemes. The results obtained for natural and excited jets at three different turbulence intensity levels, T i = 0.01 % , 0.1 % and 1.0 % , are compared. In the case of the natural jet, it is found that both instantaneous and time-averaged results are significantly dependent on the coordinate system only for the lowest T i . In this case, in the Cartesian coordinate system, the errors introduced by an azimuthal non-uniformity of the mesh seem to have a larger impact on the solutions than the disturbances generated at the nozzle exit. The azimuthal non-uniformity of the mesh also has a substantial influence on the results of the modelling of the excited jets. In this case, the excitation is introduced as time-varying forcing, with the frequency corresponding to half of the preferred mode frequency and the amplitude equal to 5 % of the jet velocity. Such an excitation leads to the formation of the so-called side-jets being revealed as inclined streams of fluid ejected outside the main jet stream. Primary attention is paid to the mechanism of the formation of the side-jets, their number and location. The results obtained on Cartesian meshes show that for very low turbulence intensity levels ( T i = 0.01 % ), the number and direction of the side-jets are dependent on the non-uniform distribution of the mesh nodes along the azimuthal direction of the jet. On the other hand, when the cylindrical coordinate system is used, the number of the side-jets and their locations are random and dependent only on inlet parameters. It has been demonstrated that the mechanism of side-jet formation is the same in both coordinate systems; however, its random nature can only be predicted when the cylindrical coordinate system is used.

1. Introduction

Investigations devoted to circular jets have both a fundamental character and practical implications. In the former case, they concentrate on a deeper understanding of mixing processes, hydrodynamic instability and interactions between vortices. In the latter, the need for jet dynamic analysis stems from the fact that jets are commonly used in various technical devices, e.g., as fuel injectors in combustion chambers, as burners or as the ends of paint sprayers. A very interesting and still not fully understood phenomenon accompanying jet flows is the formation of side-jets. They were observed experimentally in globally unstable [1,2,3,4,5] and strongly forced [6,7] round jets as inclined streams released from the jet at a certain angle to the jet axis. The necessary conditions for the occurrence of side-jets are the existence of strong vortical structures in the near field of the jet and a low level of turbulence intensity. Monkewitz et al. [1] claimed that the primary mechanism of the formation of side-jets was the azimuthal instability of vortical structures (Widnall instability [8]), which causes the deformation of vortices and ejects fluid away from the jet stream. The subsequent experimental [6] and numerical [9] analyses showed that the generation of the side-jets was not directly caused by the Widnall instability of vortex rings but rather by the occurrence of pairs of streamwise vortices originating from the instability of the braid region. However, the mechanism leading to this phenomenon has not been fully understood so far and needs further studies.
Contemporary computational fluid dynamics (CFD), which offers a wide range of numerical methods, allows for very accurate predictions of complex phenomena occurring in fluid flows and seems to be a very useful tool to explain and understand the phenomenon of the side-jets. As shown by Boguslawski et al. [10], where the global instability in a round jet using a large eddy simulation (LES) was investigated, the formation of the side-jets turned out to be very sensitive to small disturbances such as inlet turbulence intensity, mesh non-uniformity or errors stemming from discretisation. The LES performed on the Cartesian mesh showed the occurrence of four equally spaced side-jets aligned with the mesh lines, while in the experiment [1], the number of the side-jets was between 2 and 6 and their orientation was rather random. The authors claimed that the mechanism of the side-jet formation was reflected accurately, and the only difference between experimental and numerical investigations was the mechanism introducing the perturbation, namely one that was random (a real situation) and one that was determined by the Cartesian mesh. The formation of four side-jets equally spaced in the azimuthal direction could also be observed in the direct numerical simulation (DNS) of forced jets [11], where the effect of varicose perturbation was examined. The authors did not pay attention to the side-jet phenomenon, but the results of vorticity and streamwise velocity presented showed the formation of four side-jets, which were oriented along the mesh lines or diagonals of the computational box. Wawrzak and Boguslawski [12] analysed the formation of the side-jets in excited round jets using the LES method in the Cartesian and cylindrical coordinate systems. The obtained solutions suggested that the occurrence and number of side-jets in some regimes are influenced by the mesh topology. A strong impact of the Cartesian mesh on the orientation and localisation of the side-jets was also noted in a DNS study of high-p jets [13]. The results showed the emergence of four side-jets; however, the majority of attention was paid to the effect of the occurrence of the side-jets rather than the mechanism of their formation.
The present work is focused on the accuracy of LES of the turbulent jets subjected to various turbulence intensity levels. The solutions obtained for natural and excited jets in the Cartesian and cylindrical coordinate systems are compared. It is analysed whether and when the choice of the coordinate system is important from the point of view of the correctness of simulations. In the case of excited jets, an attempt is made to explain in detail the side-jet formation phenomenon and show to what extent this phenomenon is dependent on the modelling strategy.

2. Numerical Modelling

In the present work, the incompressible homogeneous density flow is considered, for which the continuity and Navier–Stokes equations in the framework of LES are given as [14]:
· U ¯ = 0
t U ¯ + ( U ¯ · ) U ¯ + 1 ρ p ¯ = · ( τ + τ s g s )
where the bar symbol represents spatial filtering [14]. The variables in the above equations are the velocity vector U, the density ρ , the pressure p and the viscous stress tensor τ . The sub-grid stress tensor is given by τ s g s = 2 ν s g s S + tr ( τ s g s ) / 3 , where S is the rate of the strain tensor of the resolved velocity field, S i j = 1 / 2 ( U ¯ i / x j + U ¯ j / x i ) , and ν s g s is the sub-grid viscosity. The trace of the sub-grid tensor is added to the pressure, resulting in the so-called modified pressure P ¯ = p ¯ tr ( τ s g s ) / 3 [14]. Thus, the elements of the effective viscous tensor are defined as τ i j e f f = τ i j + τ i j s g s = 2 ( ν + ν s g s ) S i j , where ν is the kinematic viscosity, and Equation (2) can be written in the following form:
t U ¯ + ( U ¯ · ) U ¯ + 1 ρ P ¯ = · τ e f f
As shown by Wawrzak et al. [15], the correct prediction of the jet dynamics and laminar–turbulent transition process, particularly at a low inlet turbulence intensity, is largely conditioned by the sub-grid viscosity model. It should not be over-dissipative, e.g., as the classical Smagorinsky model is, because an excess of an additional dissipation falsifies the transition mechanism. Therefore, in the present work, ν s g s is modelled by applying Vreman’s model [16], where ν s g s vanishes in laminar flows and pure shear regions. According to this model, the eddy viscosity ν s g s is computed as:
ν s g s = C B β α i j α i j
α i j = u ¯ j x i , β k l = Δ 2 α m k α m l
B β = β 11 β 22 β 12 2 + β 11 β 33 β 13 2 + β 22 β 33 β 23 2
where the constant in (4) is taken as C = 2.5 × 10 2 [16]. The filter width is computed as Δ = Δ x Δ y Δ z 1 / 3 , with Δ x , Δ y , Δ z being the mesh spacings.
The LES code employed in this study is called SAILOR. It is an academic high-order solver, which was previously verified in computations of isothermal, non-isothermal, excited and reacting jets [17]. It enables calculations in the Cartesian ( x , y , z ) and cylindrical ( x , r , ϕ ) coordinates. Note that when the cylindrical coordinate system is used, all the spatial terms and model formulas are correspondingly transformed. A solution algorithm is based on a projection method for pressure–velocity coupling. The time integration is performed by a predictor–corrector (Adams–Bashforth/Adams–Moulton) approach. Equations (1) and (2) are discretised in space using the 6th-order compact difference method [18]. The solution algorithm is formulated on a half-staggered mesh, where the velocity components are stored in the same computational nodes, while the pressure nodes are moved a half grid size from them. As shown in [19], the staggering of the pressure nodes is sufficient to ensure strong velocity–pressure coupling, which eliminates the well-known pressure oscillations occurring on collocated meshes. At the same time, compared to the full staggered approach, where both the velocity components and pressure values are stored in different locations, the interpolation between particular nodes is significantly reduced. Details of the solution algorithm and applied discretisation and interpolation formulas in the Cartesian coordinate system can be found in [19]. It has been directly translated to the cylindrical coordinates in which the singularity problem in the axis ( r = 0 ) has been solved by expanding the governing equations in power series at r = 0 according to the procedure proposed in [20].

2.1. Computational Configurations

The computational domains are shown in Figure 1. They are a simple rectangular box 12 D × 2 D × 15 D and cylinder 6 D × 15 D , where D is the jet diameter. A nozzle that is present upstream of the inlet plane in real situations is not taken into account in the computations. Instead, the inlet boundary condition is specified in terms of an instantaneous velocity profile as:
u ( r , t ) = U mean ( r ) + u turb ( r , t ) + u excit ( r , t )
The velocity fluctuations u turb ( r , t ) are computed using a digital filtering method proposed by Klein et al. [21], which guarantees the properly correlated turbulent velocity field. The mean velocity profile is described by the hyperbolic tangent function as follows:
U mean ( r ) = U 0 + U inf 2 U 0 + U inf 2 tanh 1 4 R θ r R R r
where U 0 is the jet centerline velocity, U inf is the co-flow velocity, R = D / 2 is the radius of the jet and θ is the momentum thickness. The co-flow U inf is added to compensate for the lack of a natural entrainment through the lateral walls.
As mentioned in the introduction, the occurrence of the side-jets is conditioned by the appearance of relatively strong vortical structures in an initial jet region. These structures can originate from the global instability mechanism in variable density jets [1,2,5] or can be generated by an external excitation [6,7], which is also applied in the present work. It is assumed to be an axial forcing term u excit ( r , t ) in Equation (7) that is added to the axial velocity. It is defined as:
u excit ( r , t ) = A sin 2 π St excit U 0 D t
where A and St excit = f D / U 0 are the amplitude and the Strouhal number of the excitation, and f is the excitation frequency.
At the side boundaries, the axial velocity is equal to the co-flow velocity, while the remaining velocity components are set equal to zero. The pressure is computed by the Neumann conditions at the inlet and side boundaries. At the outlet plane, the velocity components are computed using the convective boundary condition U i / t + U C U i / n , where U C is a convection velocity, which is computed at every time step as a mean velocity at the outlet plane. The pressure is assumed to be constant at the outlet plane.
Figure 2 shows the computational meshes used in the Cartesian and cylindrical coordinate systems in the cross-section perpendicular to the jet axis. The black circle represents the localisation of the nozzle edge. In the case of the Cartesian coordinate system, the mesh consists of 264 nodes in the axial direction and 192 × 192 nodes in the lateral directions. The mesh is compacted radially towards the jet region using the tangent hyperbolic function and axially towards the inlet using the exponential function. The node distribution is such that across the jet, the cell sizes in the region y , z 0.6 D are almost uniform and equal to Δ y = Δ z = 0.028 D . In the axial direction, the minimum cell size in the direct vicinity of the inlet equals Δ x = 0.039 D . It is worth noting that such a mesh was used by Tyliszczak [22] for the numerical analysis of excited bifurcating and blooming jets. There, a comparison with the results obtained on a denser mesh ( 384 × 320 × 320 ) and experimental data for different Reynolds numbers were performed. It was shown that the mesh consisting of 264 × 192 × 192 nodes that is used in the present study is sufficient to correctly capture the round jet behaviour and ensures almost grid-independent solutions. The cylindrical mesh contains 96 × 64 × 264 nodes in the radial, azimuthal and axial directions, respectively. In the radial and axial directions, the cell sizes are distributed similarly as on the Cartesian mesh ( Δ r = 0.028 D , Δ x = 0.039 D ). Along the azimuthal direction, the cell sizes are the function of the r-coordinate, and at the location r = 0.6 D , Δ L θ = 0.03 D , where L θ is the arc length. A distance 0 r 0.6 D was covered by 24 computational nodes. The test computations performed on a slightly denser mesh with 128 × 96 × 264 nodes did not reveal any important differences; hence, the coarser mesh was used in the simulations.

3. Results

The computations were carried out for the Reynolds number Re = U 0 D / ν = 5000 for which the jet dynamics significantly depends both on the variation of the Reynolds number and the velocity parameters at the nozzle exit [23]. The momentum thickness of the velocity profile θ = 0 U / U 0 1 U / U 0 d r was equal to θ = D / 40 , whereas the shape factors (H), computed as H = δ / θ ( δ = 0 1 U / U 0 d r —the displacement thickness), was equal to H = 1.38 , which indicates the velocity profile typical for a turbulent flow. The turbulence intensity was assumed at the levels T i = u x / U 0 = 0.01 % , 0.1 % and 1.0 % ( u x —RMS of the axial velocity fluctuation). The following analysis is divided into two parts:
  • Non-excited jets, where the influence of the coordinate system (Cartesian vs. cylindrical) on an evolution of the natural free jet and analysis of how it changes with the turbulence intensity level is presented;
  • Excited jets, where an attempt was made to explain and demonstrate the mechanism of side-jet formation and to show differences in their occurrence when the jets are modelled applying the Cartesian and cylindrical coordinate systems at different turbulence intensity levels.
In all analysed cases, the simulations began from a quiescent flow in the domain. The jet and co-flowing stream started flowing impulsively and freely evolved in space. After an initial transient time ( t = 100 D / U 0 ), the flow was fully developed, and the time-averaging procedure was turned on. It lasted for t = 300 D / U 0 , after which the obtained time-averaged solutions were statistically steady, and further computations practically did not change them. To make the presentation of the results and their discussion clear, the particular cases are denoted as: E / N E C a r / C y l T i T i , where E means excited jets, N E stands for non-excited jets, and the abbreviations C a r and C y l represent Cartesian and cylindrical coordinate systems, respectively. For example, the case E C a r T i 0.01 refers to an excited jet with a turbulence level T i = 0.01 % predicted on the Cartesian mesh.

3.1. Non-Excited Jets

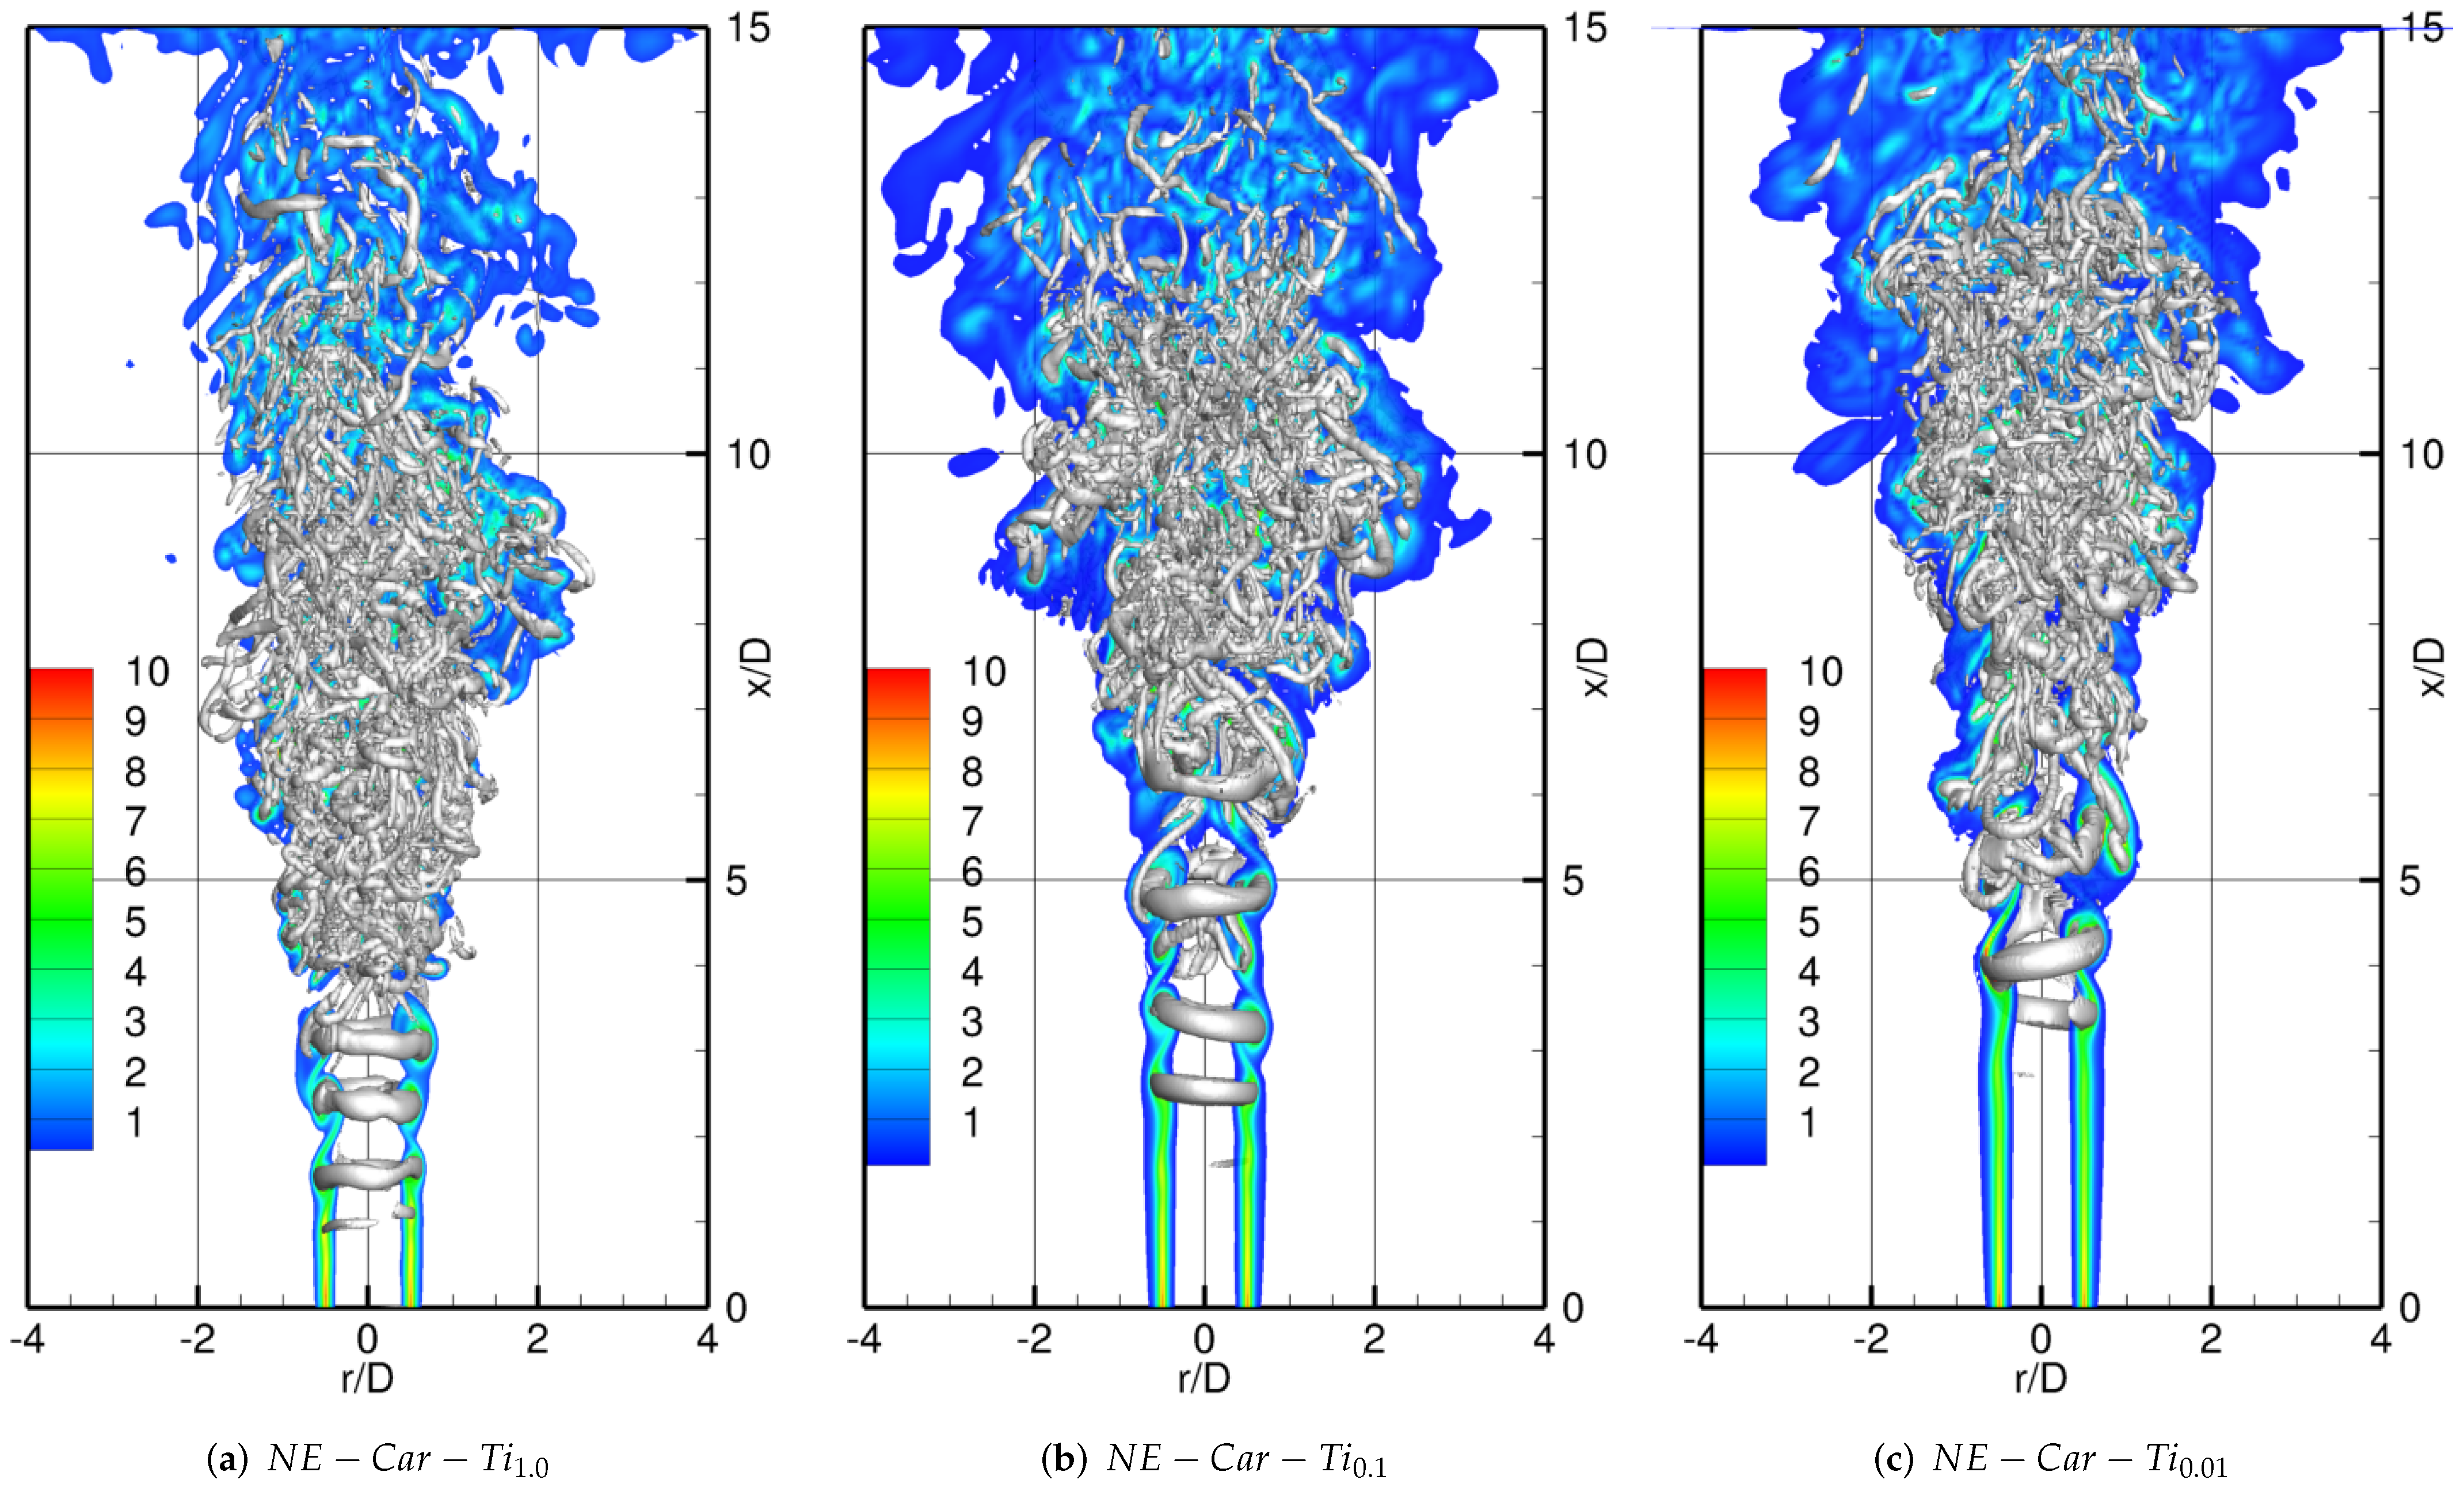
Figure 3 shows the contours of instantaneous values of the vorticity modulus in the central cross-section and isosurfaces of the so-called Q-parameter ( Q = 1 ( U 0 / D ) 2 ) obtained for T i = 0.01 % , 0.1 % and 1.0 % in the Cartesian and cylindrical coordinate systems. The Q-parameter is defined as Q = 0.5 ( Ω i j Ω i j S i j S i j ) , where Ω i j and S i j are antisymmetric and symmetric parts of the velocity gradient tensor. It is often used as an indicator of vortical structures and coherent motion of vortices [24]. Here, it nicely reveals the presence of toroidal structures stemming from the Kelvin–Helmholtz instability. They are formed downstream from the nozzle and pass through the centres of rolled-up vortices in the shear layer, where the vorticity level is the largest. Note that the vorticity contours are shown only if their values are larger than | Ω | = 1 ( U 0 / D ) . Comparing the presented solutions, one can see that qualitatively, they are all similar.
As the toroidal structures flow downstream, the axial distance between subsequent vortices becomes smaller, and they combine and eventually break up into tiny turbulent structures. Important questions are where the vortices are formed and where their destruction happens. It can be seen that lowering T i moves both these processes further downstream. Comparing the solutions obtained in the Cartesian and cylindrical coordinate systems, the first observation is that when the turbulence level is T i = 1.0 % or T i = 0.1 % , the results are qualitatively very similar; please compare the cases N E C a r T i 1.0 vs. N E C y l T i 1.0 and N E C a r T i 0.1 vs. N E C y l T i 0.1 . On the contrary, when T i = 0.01 % , significant differences are readily seen. In the Cartesian system, the toroidal vortices break up very close to the place where they appear ( x / D 4.0 ). In the cylindrical system they are better formed and seem to be stronger as they “survive” over a definitively larger distance downstream. A wavy shape of the vorticity contours on the external edge of the jet core in the region x / D = 4.0 7.0 (see Figure 3f) shows the occurrence of the almost undisturbed motion of vortices flowing one after the other.

3.1.1. Evolution of the Amplitude Spectra

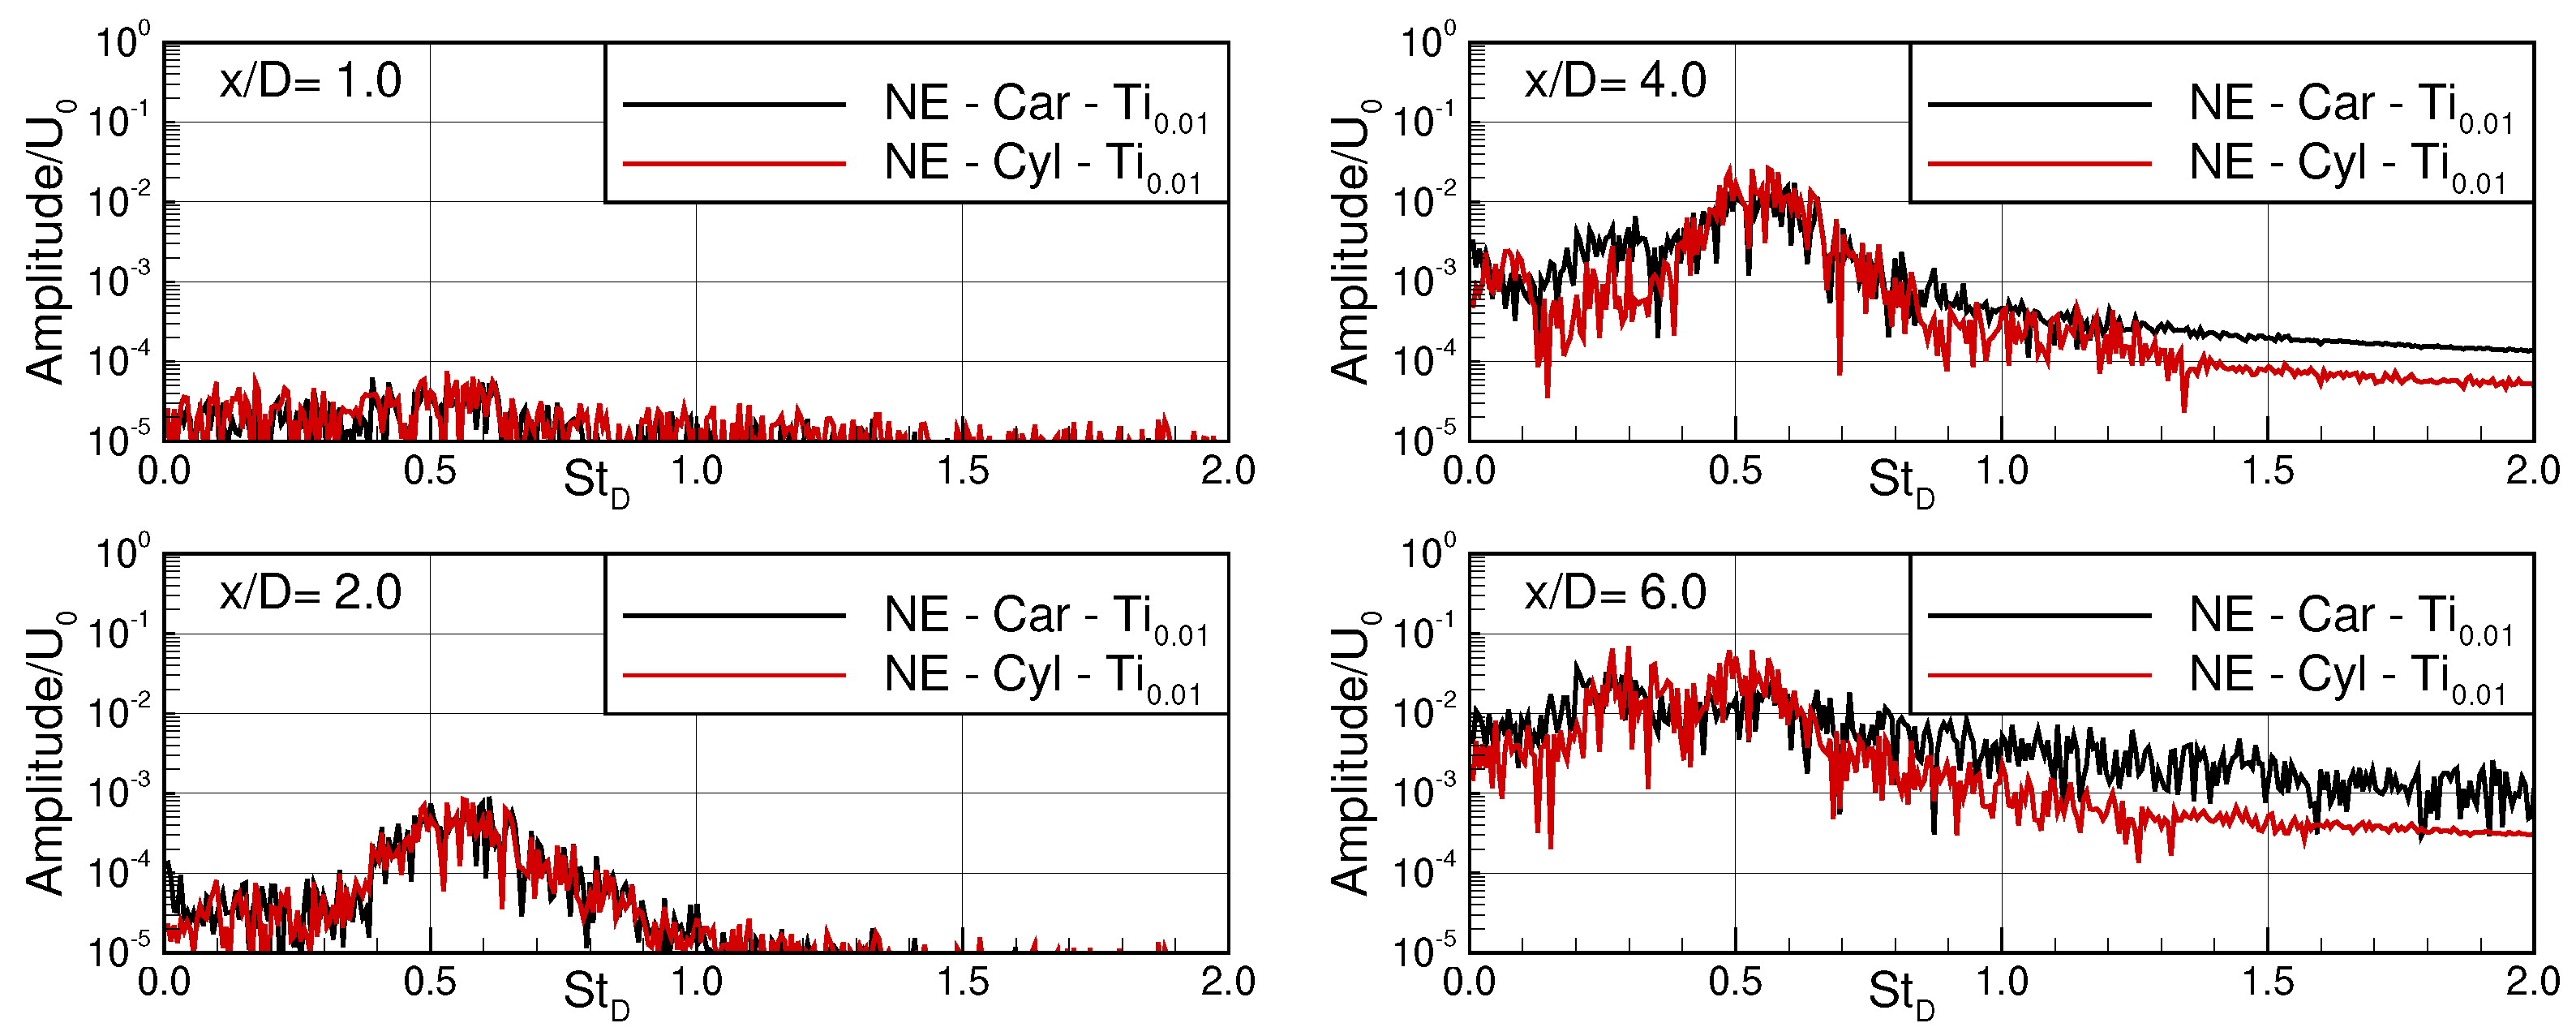
The above-mentioned periodic behaviour of the motion of the vortices is reflected in the amplitude spectra of the axial velocity presented in Figure 4 as a function of the Strouhal number St = f D / U 0 , where f stands for the frequency of the recorded signal. These spectra were computed based on the time signals of the velocity recorded over the time period of 164 D / U 0 . Numerical probes were placed along the axis in four points x / D = 1.0 , 2.0 , 4.0 , 6.0 , which allowed detecting the initial phase of the formation of these vortices and their evolution downstream. The results are presented only for the cases with T i = 0.01 % , for which the solutions depend on the mesh topology. In the location x / D = 1.0 , the spectra are flat, which means that the toroidal structures observed in Figure 3 are formed only further downstream, and they are not an accidental result of the time-varying velocity profile imposed at the inlet boundary. Indeed, an evident rise of the frequency is seen starting from x / D = 2.0 , and it manifests as a broadband peak centred at St = 0.58 that agrees well with a characteristic frequency of the preferred mode ( St p = 0.54 ) reported in [25]. In the point x / D = 4.0 , the amplitude of the fluctuations increases, and in the case of the solution obtained on the Cartesian mesh, the first signs of the vortex pairing process appear. They manifest in the rise of a rather broadband peak at St 0.3 . Its amplitude grows downstream, and at x / D = 6.0 , it reaches a level the same as the peak corresponding to the basic frequency. It is worth noticing that in the range of higher frequencies ( St > 0.8 ), the amplitude of the fluctuations are larger in the Cartesian coordinate systems. This means that in this case, the temporal variation of the small-scale phenomena is more dynamic.

3.1.2. Instantaneous vs. Time-Averaged Results

Figure 5 shows the contours of instantaneous axial velocity distributions in the central cross-section in the Cartesian and cylindrical coordinate systems obtained for T i = 0.01 % , 0.1 % and 1.0 % . These data are presented on the left sides of the subfigures. The presented values are normalised by the inlet velocity in the axis, i.e., U x / U 0 . It can be seen that the instantaneous values locally exceed the U 0 , which is the result of the vortices’ rollup process in the shear layer of the jet, as one can see in Figure 3. The counterclockwise rotation of the toroidal vortices causes the acceleration of the fluid in the central part of the jet. A close analysis of the presented results shows the regions where U x > U 0 are located in between these vortices. Note that these regions occur further downstream when the level of turbulence intensity is low. In effect, larger values of the time-averaged axial velocity extend further downstream. Its contours are shown on the right-hand sides of the subfigures presented in Figure 5. Evidently, with decreasing T i , the potential core length ( L P C ), i.e., the region in the axis where U U 0 , becomes longer. Taking into account the solutions obtained in the Cartesian and cylindrical coordinate systems, it can be seen that a substantial difference in L P C is only seen for the cases with T i = 0.01 % .
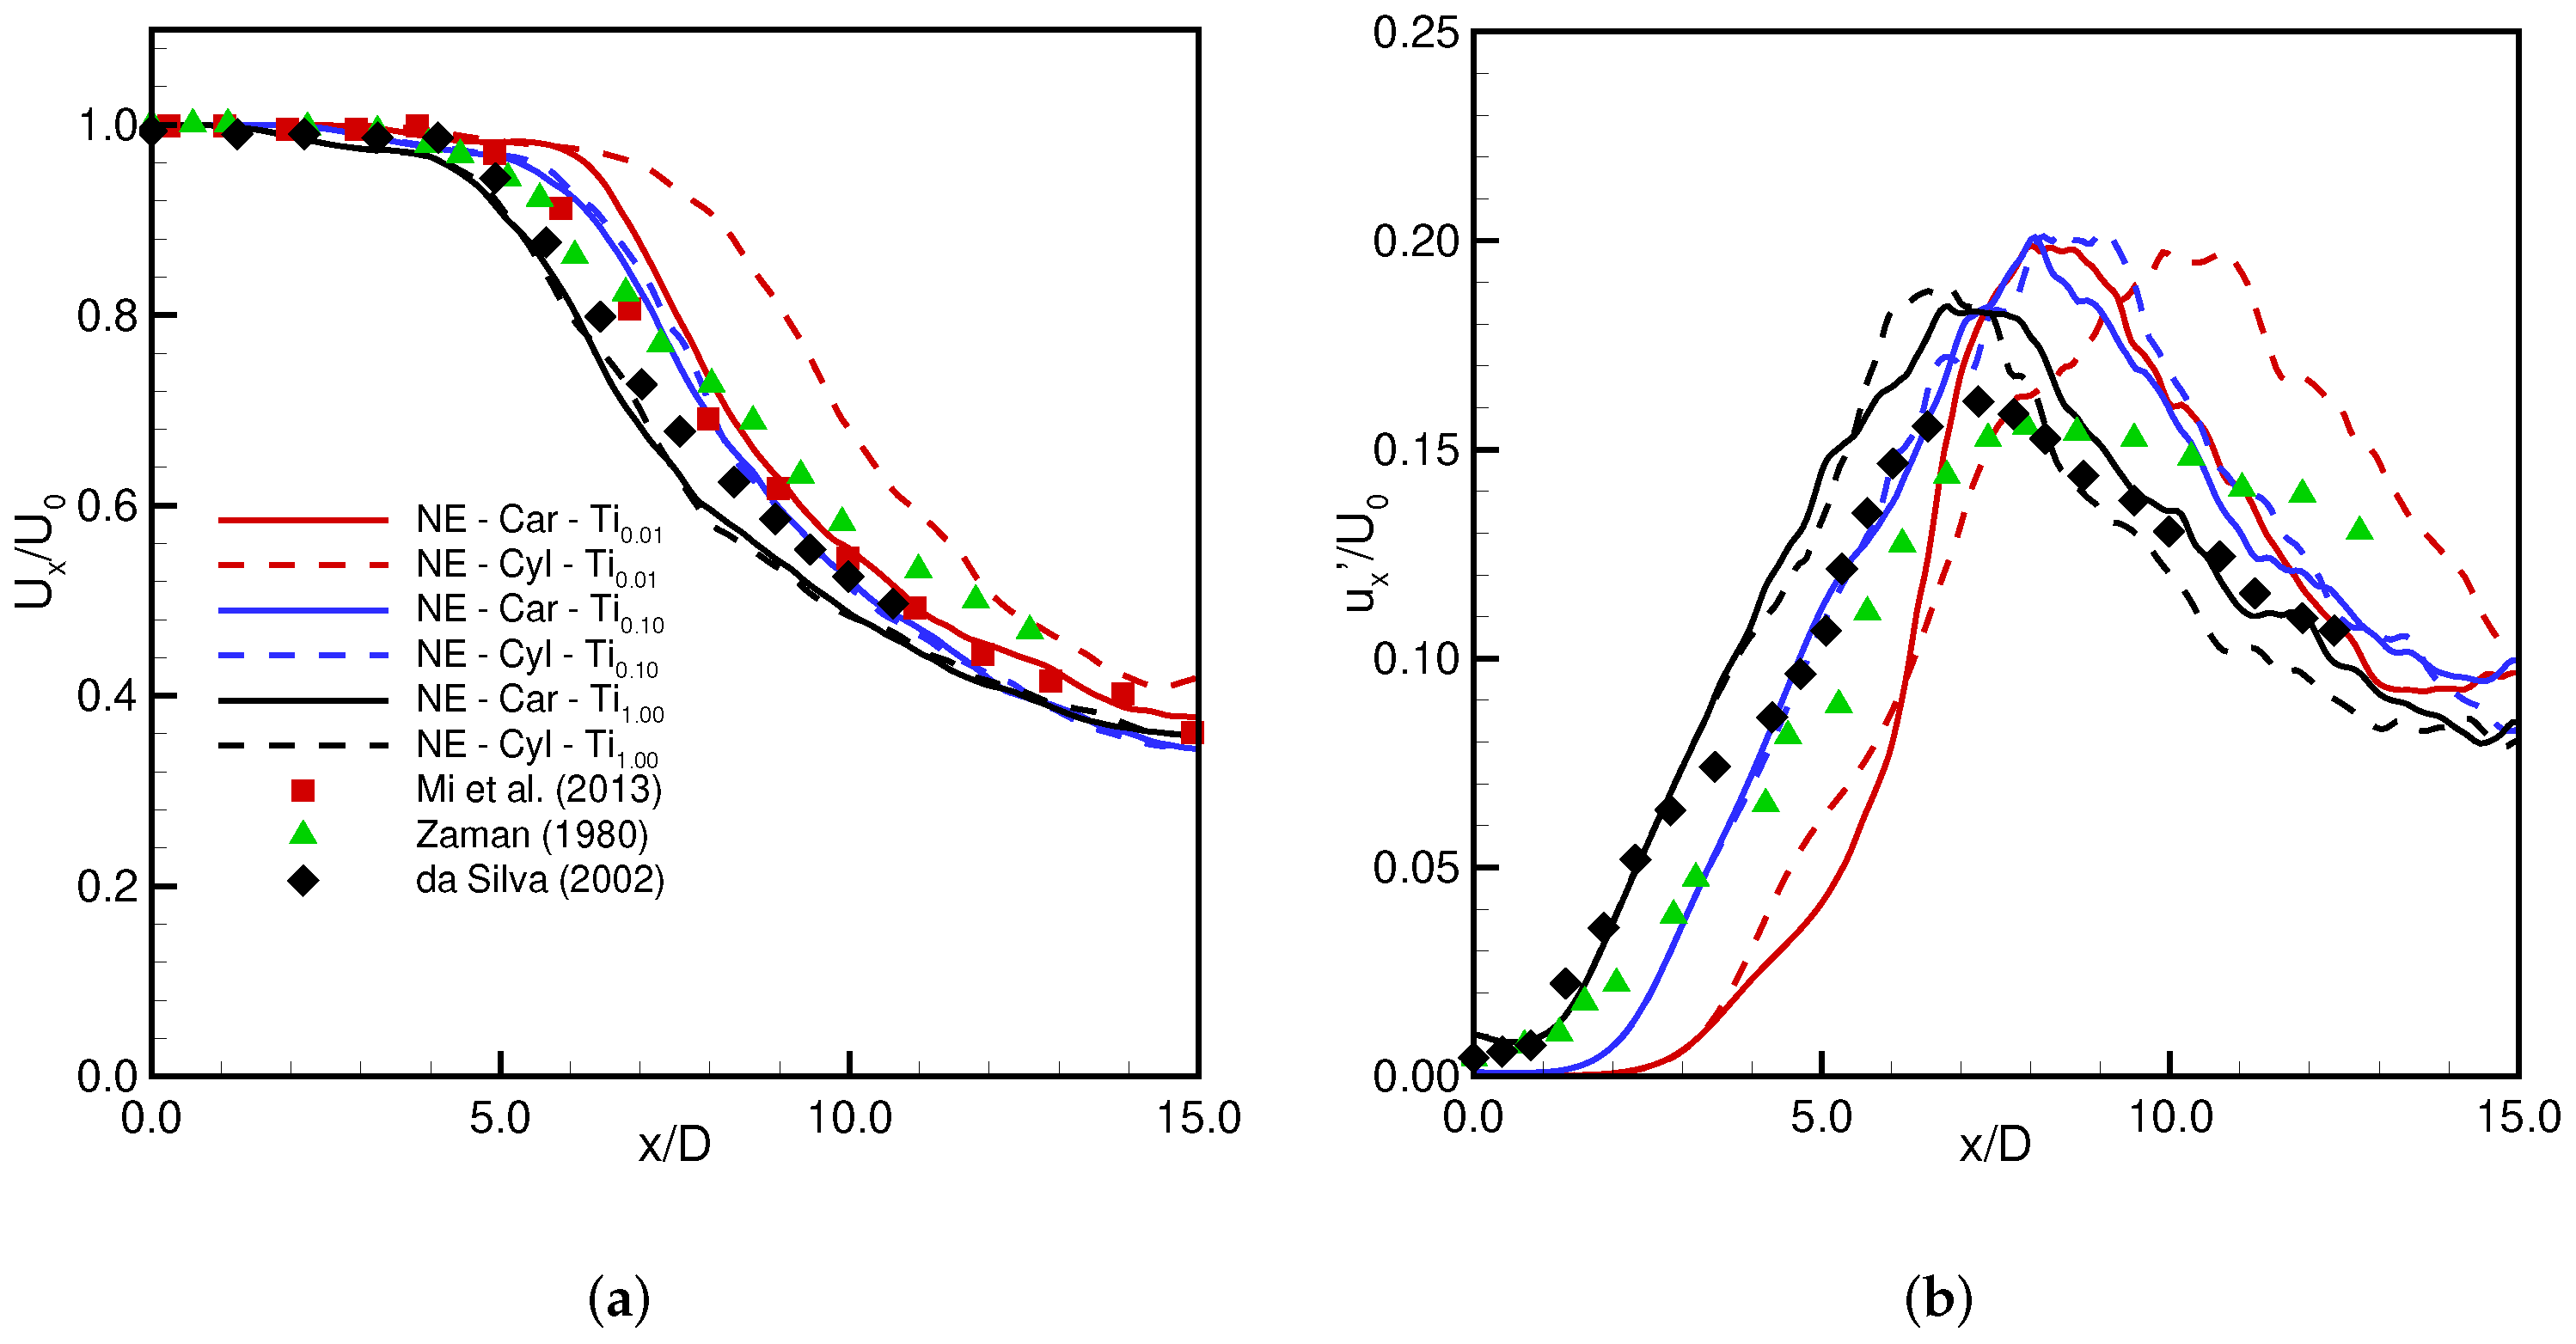
Profiles of the time-averaged axial velocity and its fluctuation along the axis are shown in Figure 6. Additionally, to verify the correctness of the present solutions, the experimental and numerical data from Mi et al. [26], da Silva and Metais [27], and Zaman and Hussain [28] are presented in Figure 6. These data were obtained for T i = 1.0 % at the Reynolds numbers Re = 4050 [26] and Re = 10 , 000 [27,28]. It can be seen that both the rate of velocity decay in the region x / D > 5 and the potential core length are predicted accurately. The profiles of the fluctuations also agree relatively well with the literature data, especially for the case with the same turbulence intensity ( T i = 1.0 % ). The occurrence of the maximum of the fluctuations is correctly captured, yet its level is slightly over-predicted. This, however, can result from differences in spatio-temporal turbulent length scales in the present simulations and the ones prescribed in the cited references. Taking into account the impact of T i , it is clear that its alteration changes the L P C . It equals L P C / D 3.5 for T i = 1.0 % and L P C / D 5.5 for T i = 0.01 % . Note that the T i level also affects the growth of velocity fluctuations along the axis. In all cases, they start increasing before the potential core regions ends, but this happens further downstream when T i is low. As a consequence, the maxima of the fluctuations shift downstream as well.
Regarding the impact of the coordinate system on the obtained results, it can be seen that for the highest and moderate turbulence intensities, i.e., T i = 1.0 % and T i = 0.1 % , the solutions are very weakly dependent on the mesh topology, and the profiles nearly overlap each other. Similar to the instantaneous solutions, the time-averaged values differ significantly when T i = 0.01 % . On the Cartesian mesh, the profile of the axial velocity obtained for T i = 0.01 % is similar to the one computed for T i = 0.1 % . Additionally, the maxima of the fluctuations for these two cases occur in almost the same location ( x / D 8.0 ), yet the localisations where the fluctuations start growing in the near field of the jet differ substantially. In the cylindrical coordinate system, the profiles obtained for T i = 0.01 % seem to be closer with expectations. A lower T i causes a shift of the axial localisation, where the mean velocity starts to drop down ( x / D 6.5 ), which, as a consequence, leads to the preservation of the axial momentum over a longer distance. Note that at x / D = 10.0 , the axial velocity is equal to U / U 0 = 0.54 when it is computed in the Cartesian coordinate system, whereas it equals U / U 0 = 0.68 in the cylindrical system. This is additionally associated with the shift of the maximum of the fluctuations over 2 D downstream.

3.2. Excited Jet

The results obtained in the previous section have shown that for the cases in which the turbulence intensity is low, the solutions obtained in the Cartesian and cylindrical coordinate system differ significantly. In this section, we analyse how these findings translate to the excited jets and the formation of the side-jets. To trigger them, forcing is applied according to the Equation (9) defined in Section 2.1. As discussed by Tyliszczak and Geurts [29], the forcing is effective only when its amplitude is higher than the level of inlet turbulence intensity. Hence, the amplitude A / U 0 = 5 % and the frequency based on St excit = 0.3 , which corresponds to the subharmonic frequency of the preferred mode in the natural jet, are assumed as forcing parameters. Note that this frequency is associated with the vortex pairing process, and, as shown by Crow and Champagne [30], the forcing at this particular frequency causes the generation and largest growth of an additional maximum in the profile of the axial velocity fluctuations.
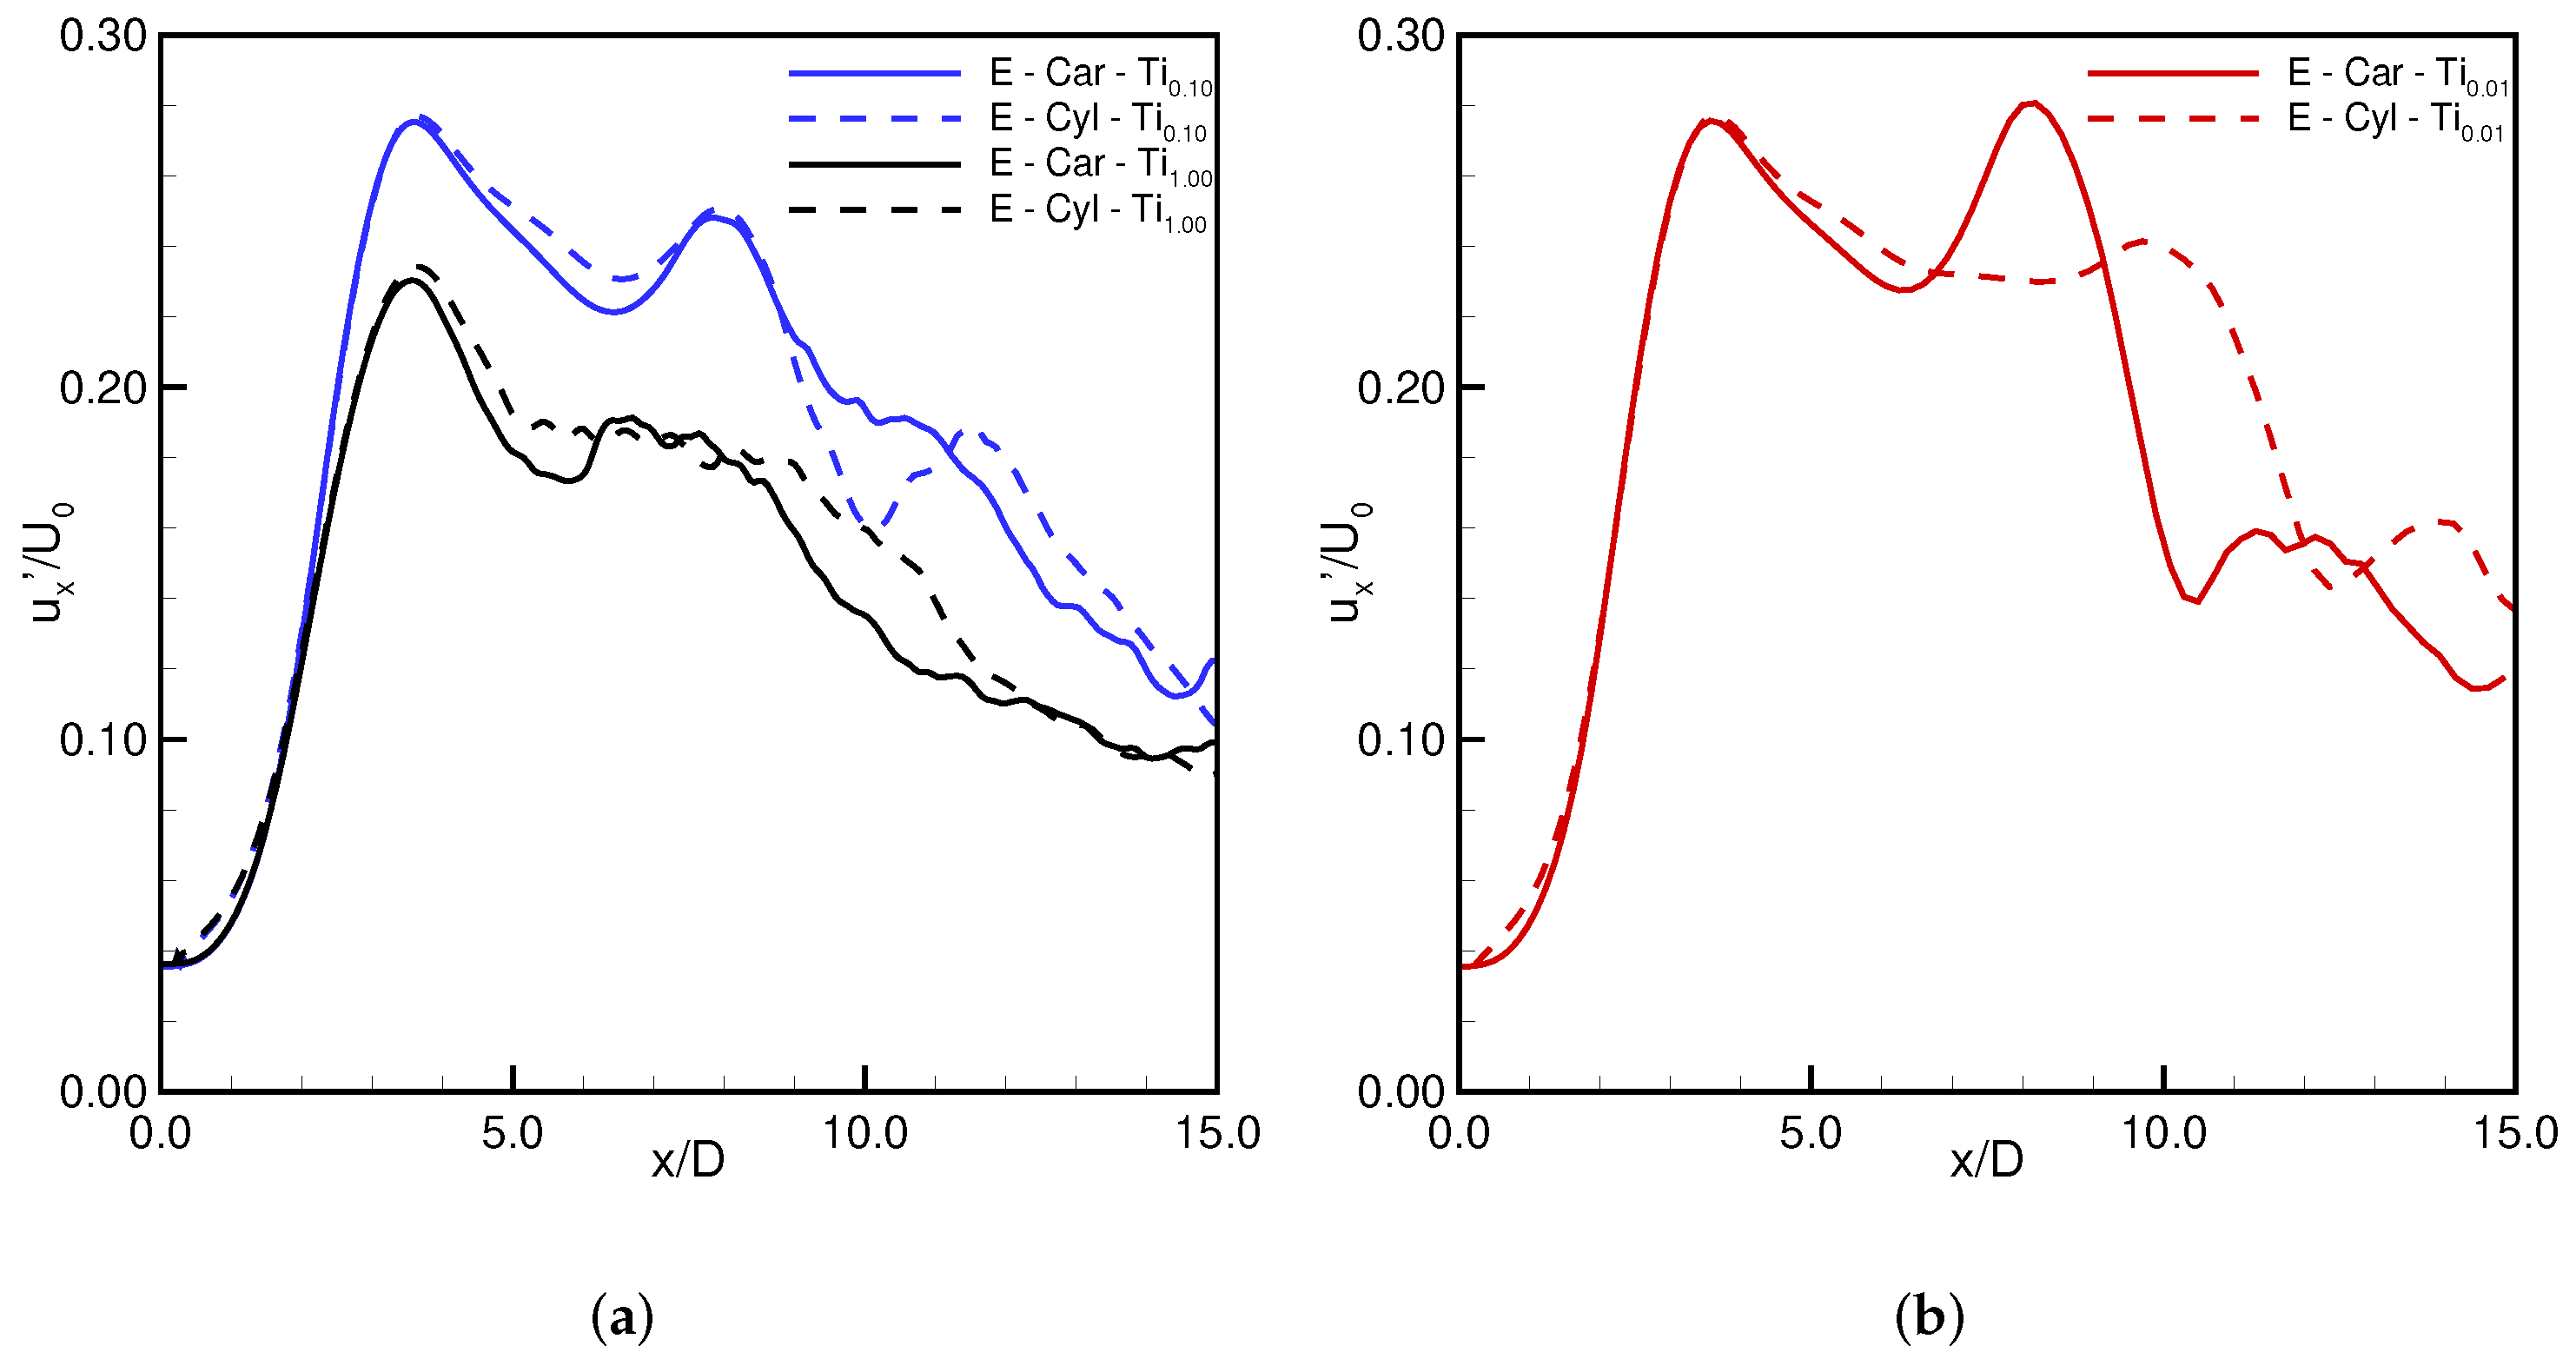
Figure 7 shows the profiles of the axial velocity fluctuations along the axis obtained for different levels of the turbulence intensity. The forcing significantly amplifies the fluctuations and causes the emergence of the above-mentioned second maximum of the fluctuations at x / D 3 . This localisation agrees very well with [30,31]. The observed development of the perturbation close to the inlet is attributed to the nonlinear interactions of the primary structures that emerged due to the Kelvin–Helmholtz instability in the direct vicinity of the nozzle. They interact and form larger structures at x / D 3 . Note that this distance is independent of T i . On the contrary, the maximum level that is attained by fluctuations is visibly dependent on T i , and it turns out that it is larger when T i is low, i.e., T i = 0.1 % and T i = 0.01 % . This means that a high level of natural turbulence prevents the formation of strong vortical structures and their downstream evolution and amplification. Concerning the impact of the coordinate system involved in the simulations, it can be seen that the fluctuation profiles are similar for the cases T i = 1.0 % and T i = 0.1 % . Again, a strong influence of the coordinate system is seen for T i = 0.01 % , especially when the profiles downstream of the location x / D = 5 are compared. The local maxima occur in almost exactly the same localisations as for the non-excited jets ( x / D 8.0 and x / D 10.0 ), but the one predicted in the Cartesian coordinate system is visibly higher. The next section examines the extent to which the turbulence intensity and coordinate system in which the simulations are performed affect the prediction of the formation of side-jets.

3.3. Physics of the Side-Jets Formation Phenomenon

3.3.1. Generation of Longitudinal Streamwise Vortices

The mechanism of side-jet formation was studied experimentally by Monkewitz and Pfizenmaier [6] and numerically by Brancher et al. [9]. In both cases, the number and orientation of the side-jets were fixed by an external jet perturbation. In the experimental analysis [6], stabilisation of the side-jets at fixed azimuthal angles was achieved by a corrugated nozzle, which caused deformation of the vortex structures at specific locations. In the DNS [9], the deformation of the vortex rings was introduced by application of an azimuthal perturbation. In both studies, the side-jets originated from a velocity induction by pairs of counter-rotating streamwise vortex structures, which connect the two consecutive distorted vortex rings. The same mechanism of the side-jet formation is revealed in the present simulations in both the Cartesian and cylindrical coordinate system. Figure 8 presents the iso-surfaces of the Q-parameter, contours of the streamwise vorticity and the radial velocity with the velocity vectors in the cross-section perpendicular to the jet axis obtained for the test cases with the lowest turbulence intensity ( E C a r T i 0.01 and E C y l T i 0.01 ) . The Q-parameter exhibits the formation of pairs of streamwise vortical structures. Sometimes, they are called rib or braid vortices, and their occurrence is frequently reported in studies of non-circular jets, e.g., rectangular, triangular or hexagonal jets [32]. There, the rib vortices originate from local disturbances introduced by the corners of the nozzles. In the present case of circular jets, the rib vortices are generated by a slightly different mechanism. A careful analysis of the results presented in Figure 8a shows that there are four pairs of ribs. If one plots them with the computational mesh in the background, one could readily see that the ribs are generated along the diagonal directions of the mesh, and the azimuthal distance between neighbouring pairs is 90 deg. Hence, it is inferred that the disturbance that triggers the formation of rib vortices is introduced by an azimuthal non-uniformity of the computational mesh. Indeed, at angles of 45 , 135 , 225 and 315 deg, the spacings between the mesh nodes along the radius of the jet are the largest, and thus, the accuracy of approximation in these directions is the worst. In effect, the generated ribs are persistent in the same localisations during the whole simulation. Knowing the origin of perturbation in the Cartesian coordinate system, one may ask “What is the mechanism of the formation of braids when the computations are performed in the cylindrical coordinate system?” The iso-surfaces of the Q-parameter in Figure 8b clearly show the pairs of rib vortices, but their localisation and number have nothing common with the mesh structure and seem accidental. Indeed, as will be shown later when the cylindrical coordinate system is used, the number of ribs and their spatio-temporal occurrence can be regarded as a random process conditioned by the randomness of the inlet velocity perturbation. If at a given instant in time and at a given azimuthal angle in the inlet plane of the cylindrical mesh the generated velocity disturbance has a tendency to grow faster than the disturbances in the neighbouring localisation, it creates rib vortices.

3.3.2. Mechanism of the Formation of Side-Jets

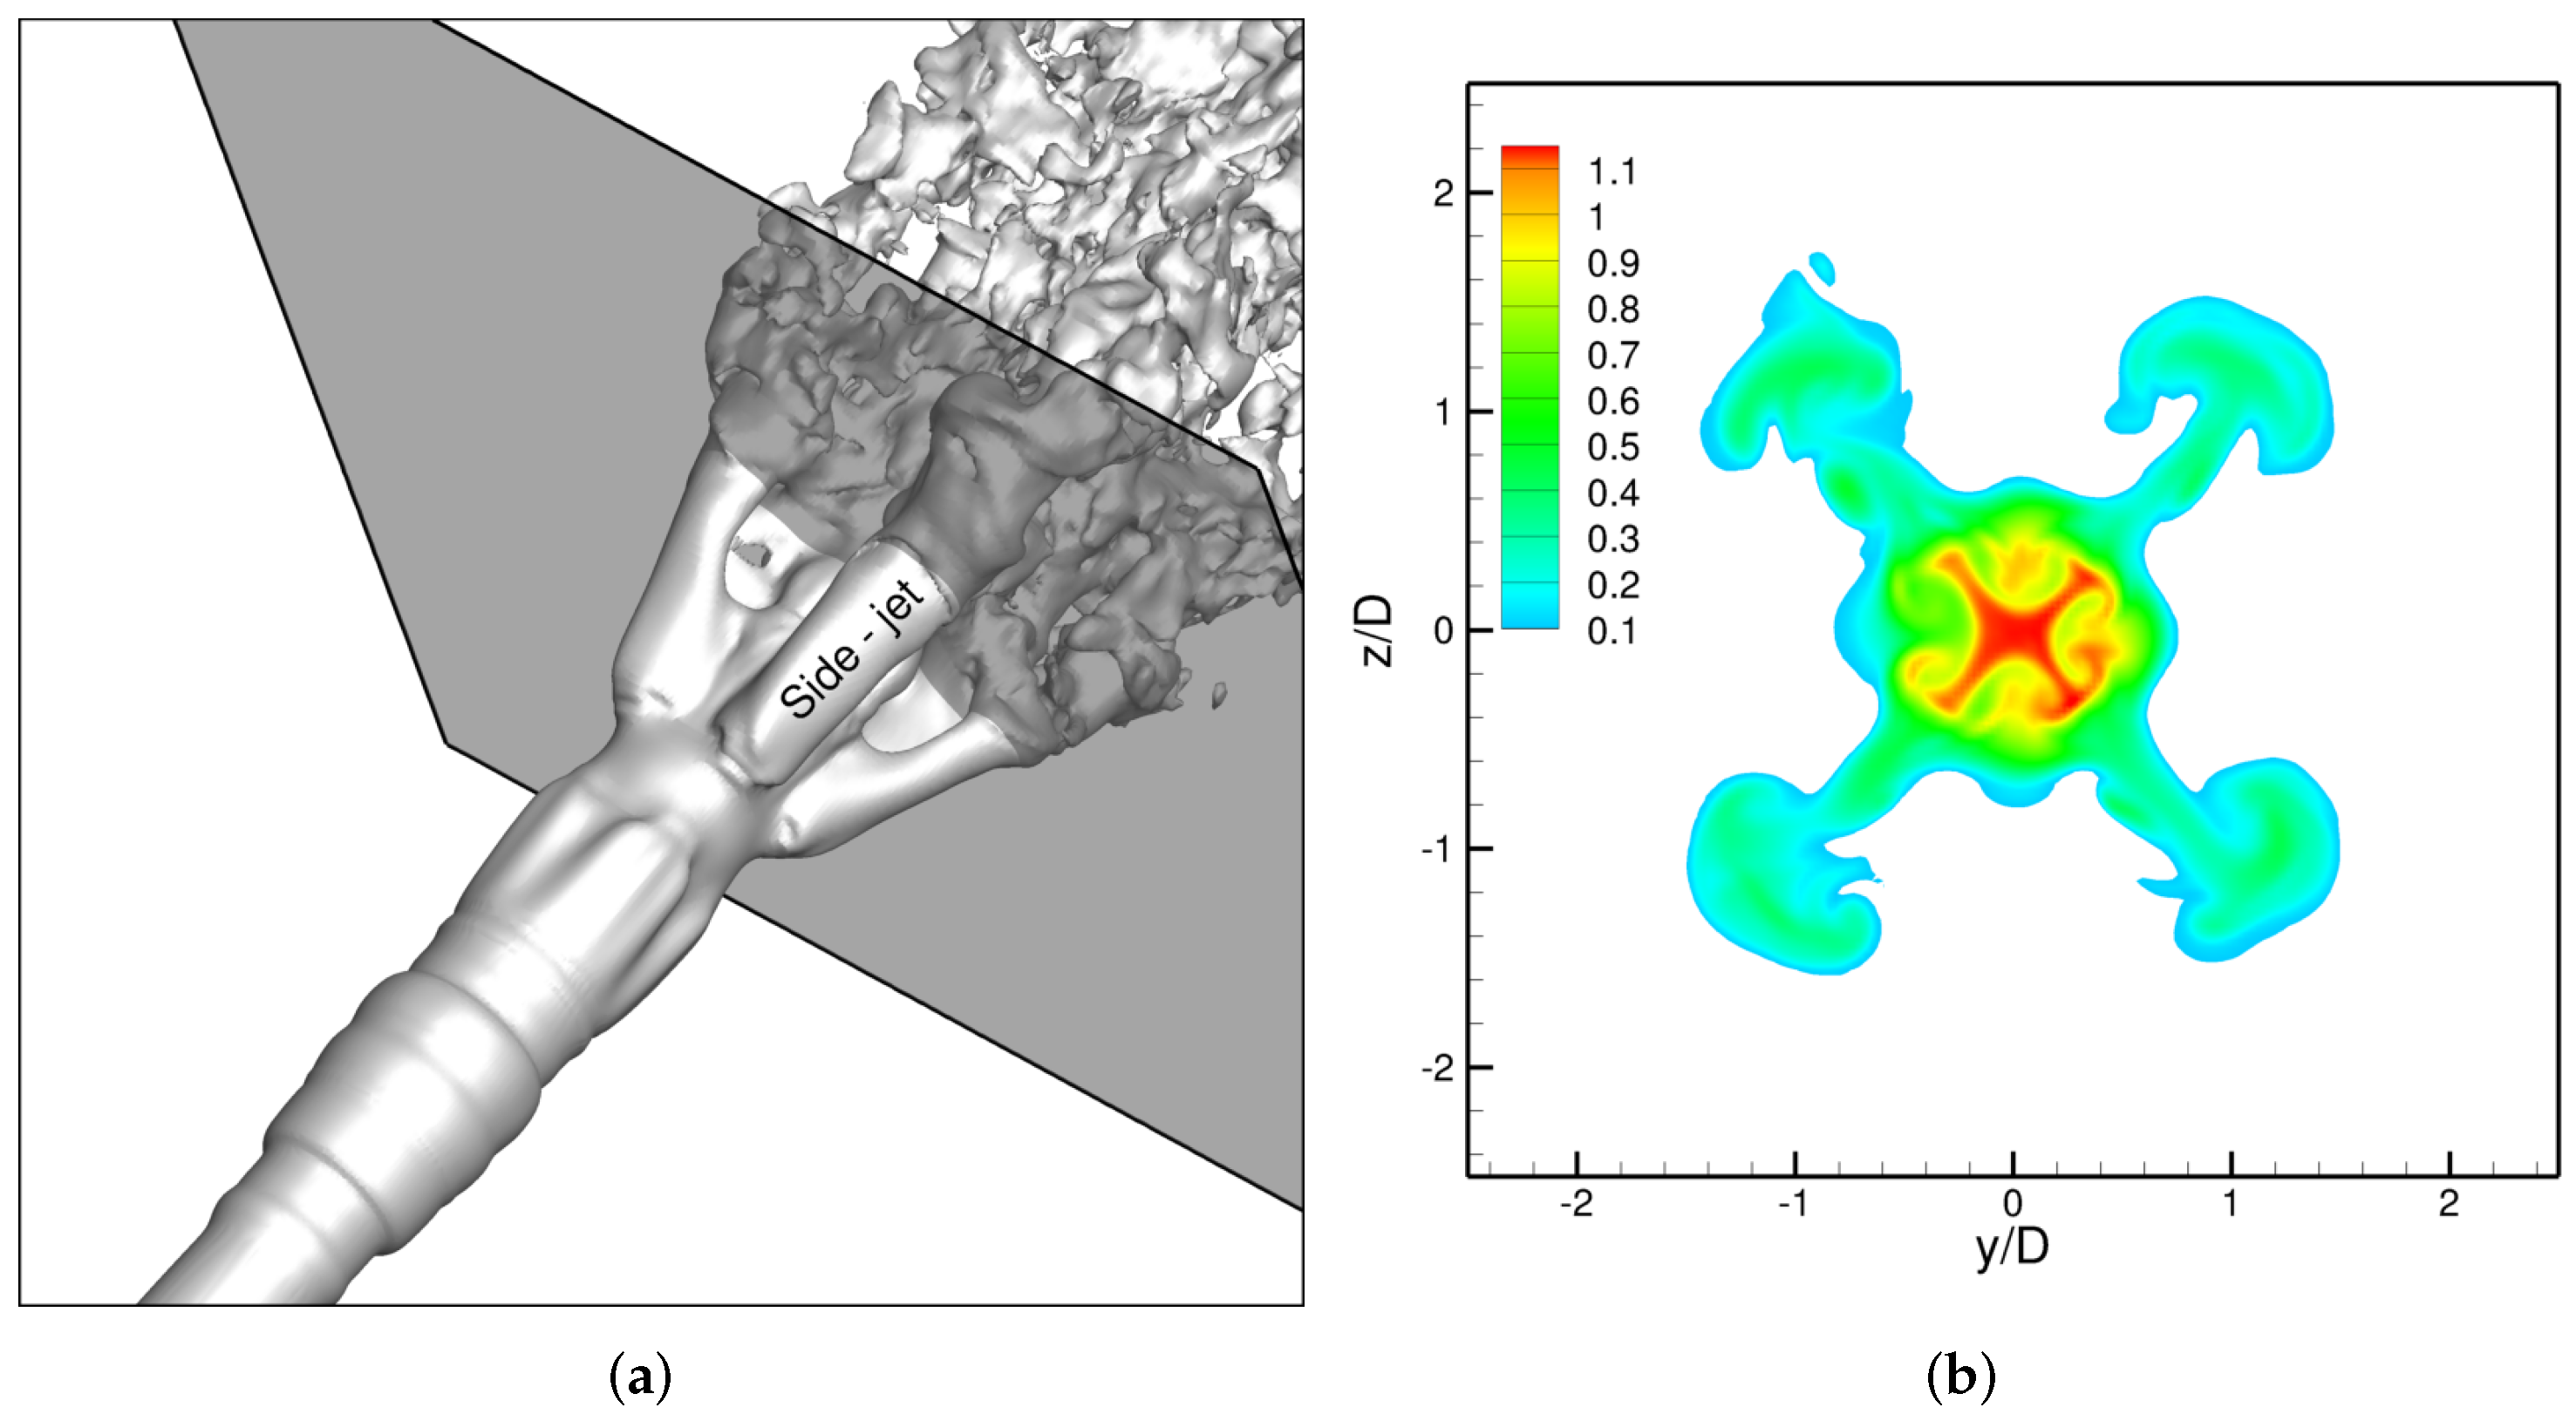
The subsection focuses on the role of the rib vortices in the formation of the side-jets. In Figure 8a,b, it can be seen that they are pushed outside by the vortex ring. The contours of the streamwise vorticity and radial velocity are shown in the cross-sections passing through one pair of the ribs. Note that the streamwise vortices are counter-rotating, which is additionally visualised by the velocity vectors. This causes the ejection of the fluid from the jet core towards the jet periphery, as can be inferred based on large values of the radial velocity. This stream forms a side-jet. Note that the presented scenario is exactly the same in the Cartesian and cylindrical coordinate systems, and the only difference is the mechanism of the generation of rib vortices. The influence of the turbulence intensity level on these phenomena will be presented in the next subsection. The formed side-jets are presented in Figure 9 and Figure 10. They show the iso-surfaces of the axial velocity ( U x / U 0 = 0.2 ) and the axial velocity distribution in the cross-sections perpendicular to the jet at the axial distance x / D = 9 . As can be seen in Figure 9, showing the solution obtained in the Cartesian coordinate system, there are four side-jets located at the diagonals of the computational domain that correspond to the directions of the worst mesh resolution along the radius, as discussed above. The solution obtained in the cylindrical coordinate system, presented in Figure 10, is significantly different. In this case, only three side-jets are observed, and they are randomly distributed along the azimuthal direction. During the simulation, the number of side-jets and their localisation in the cylindrical coordinates change and, as suggested above, seem to have unpredictable nature. Figure 11 shows the contours of an instantaneous axial velocity in the cross-section located at x / D = 9 , where the side-jets are clearly visible. Particular subfigures refer to the solutions at selected time moments spaced by Δ T = 10 D / U 0 . It can be seen that in the Cartesian system, the side-jets are always in the same four places, and only the values of the velocity inside them changes, as this depends on the strength of the counter-rotating vortices in the ribs. This, on the other hand, is connected to the time-varying strength of the toroidal vortices that push them away from the jet core. In the case of the cylindrical system, the situation is different; see Figure 12. Here, the side-jets are formed in different locations; the velocities inside them differ, and moreover, there are time moments, e.g., Figure 12c, when the side-jets disappear.

3.3.3. Impact of T i on the Formation of Side-Jets

The mechanism of side-jet formation has been explained in the previous section. Now it is analysed whether the above explanations are valid for the cases with larger T i . In an analogy with Figure 11 and Figure 12, the results obtained for the cases with T i = 0.1 % and T i = 1.0 % are presented in Figure 13, Figure 14, Figure 15 and Figure 16. As can be seen, for T i = 1.0 % , the side-jets do not appear either in the Cartesian coordinate or cylindrical systems. They occur for T i = 0.1 % , but their number and azimuthal locations differ. In the Cartesian system, contrary to what we can see in the case with T i = 0.01 % , the occurrence of side-jets is random and not along the diagonal directions. Worth noticing is the fact that they expand in the radial direction over a larger distance and are more irregular than in the case with T i = 0.01 % . The random occurrence of the side-jets is caused by the disturbance generated at T i = 0.1 % that overwhelms the disturbances related to the azimuthal mesh non-uniformity. A larger irregularity of the side-jets also takes place in the cylindrical coordinate system. As can be seen in Figure 15, three or four side-jets appear at particular time instances, but they are not as well formed as for the case with T i = 0.01 % (Cf. Figure 12).
Summing up the above observations, one can say that: (i) a high level of natural turbulent intensity prevents the formation of the side-jets, as already mentioned in the introduction; (ii) the mechanism that triggers the development of the rib vortices creating the side-jets has atwofold nature, i.e., strictly numerical, stemming from the azimuthal non-uniformity of the mesh in the Cartesian coordinate system, and physical, originating from the non-uniformity and randomness of the disturbances at the nozzle exit in the cylindrical coordinates; (iii) in the Cartesian coordinate system, the localisation and number of the side-jets is random only when the naturally generated disturbances are larger than the disturbances resulting from the azimuthal mesh non-uniformity. One can conclude that for modelling the side-jet phenomena, one should use the cylindrical coordinate system.

4. Conclusions

The investigations presented in this paper were focused on the influence of the numerical approach on the accuracy of LES modelling of natural and excited jets. The numerical approach differed by the coordinate system in which the Navier–Stokes equations were formulated and discretised, i.e., the solutions obtained in the Cartesian and cylindrical coordinate systems were compared. Calculations were performed for different levels of the turbulence intensity, T i = 1.0 % , T i = 0.1 % and T i = 0.01 % . For natural jets, the comparison of the solutions was performed based on instantaneous and time-averaged results. For the cases with T i = 1.0 % and T i = 0.1 % , the solutions were almost independent of the coordinate system. On the other hand, significant differences were observed for T i = 0.01 % . In this case, both the potential core length and localisations of the maxima of the fluctuations diverged substantially.
Analysis of the excited jets concentrated on the identification of the side-jets and the explanation of the mechanism of their formation. These computations were also performed in the Cartesian and cylindrical coordinate systems. In the former case, for T i = 0.01 % , the obtained results revealed the formation of four side-jets extending only along the diagonals of the computational domain. Such an unnatural behaviour was attributed to the non-uniform mesh resolution along the azimuthal direction, leading to different levels of derivative approximation errors. This phenomenon was diminished for the case with T i = 0.1 % , for which the natural disturbances introduced at the nozzle exit dominated over the numerically induced disturbances. In this case, the side-jets had the tendency to appear in a definitively more random manner. For T i = 1.0 % , the side-jets did not appear. The application of the cylindrical coordinate system excluded the azimuthal non-uniformity of nodes, and in this case a random number and location of the side-jets were observed.
The conducted analysis showed that the mechanism leading to the formation of the side-jets is essentially the same in both coordinate systems, i.e., it is a localised disturbance. However, its origin can be different—numerical or physical—as demonstrated in the paper. Knowing that the formation of side-jets has a temporary and random character, one can conclude that it can only be predicted correctly in the cylindrical coordinate system. This avoids artificial perturbations along the azimuthal direction, which leads to the deformation of the vortex rings and the unphysical creation of the rib vortices.

Author Contributions

Conceptualization, K.W. and A.T.; methodology, K.W.; software, K.W. and A.T.; formal analysis, K.W. and A.T.; investigation, K.W.; data curation, K.W.; writing—original draft preparation, K.W. and A.T.; writing—review and editing, K.W. and A.T.; visualization, K.W.; funding acquisition, A.T. All authors have read and agreed to the published version of the manuscript.

Funding

This research was supported in part by the National Science Center, Poland (Grant no. 2018/31/B/ST8/00762) and the statutory funds of the Department of Thermal Machinery (Czestochowa University of Technology). The international collaboration was possible thanks to the International Academic Partnerships Programme (PPI/APM/2019/1/00062) sponsored by the National Agency for Academic Exchange (NAWA). The computations were carried out using PL-Grid infrastructure.

Institutional Review Board Statement

Not applicable.

Informed Consent Statement

Not applicable.

Data Availability Statement

The data presented in this study are available on request from the corresponding author.

Acknowledgments

The authors thank Andrzej Boguslawski from the Czestochowa University of Technology and Bernard Geurts from the University of Twente for fruitful discussions on the jet instability mechanisms and flow phenomena presented in this paper.

Conflicts of Interest

The authors declare no conflict of interest.

References

  1. Monkewitz, P.A.; Lehmann, B.; Barsikow, B.; Bechert, D.W. The spreading of self-excited hot jets by side jets. Phys. Fluids A Fluid Dyn. 1989, 1, 446–448. [Google Scholar] [CrossRef]
  2. Sreenivasan, K.R.; Raghu, S.; Kyle, D. Absolute instability in variable density round jets. Exp. Fluids 1989, 7, 309–317. [Google Scholar] [CrossRef]
  3. Monkewitz, P.A.; Bechert, D.W.; Barsikow, B.; Lehmann, B. Self-excited oscillations and mixing in a heated round jet. J. Fluid Mech. 1990, 213, 611–639. [Google Scholar] [CrossRef]
  4. Kyle, D.; Sreenivasan, K.R. The instability and breakdown of a round variable-density jet. J. Fluid Mech. 1993, 249, 619–664. [Google Scholar] [CrossRef]
  5. Hallberg, M.; Strykowski, P. On the universality of global modes in low-density axisymmetric jets. J. Fluid Mech. 2006, 569, 493–507. [Google Scholar] [CrossRef]
  6. Monkewitz, P.A.; Pfizenmaier, E. Mixing by side jets in strongly forced and self-excited round jets. Phys. Fluids A Fluid Dyn. 1991, 3, 1356–1361. [Google Scholar] [CrossRef]
  7. Raghu, S.; Monkewitz, P.A.; Lehmann, B. On the mechanism of side-jet generation in periodically excited axisymmetric jets. In Advances in Turbulence 3; Johansson, A.V., Alfredsson, P.H., Eds.; Springer: Berlin, Germany, 1991; pp. 221–226. [Google Scholar]
  8. Widnall, S.E.; Bliss, D.B.; Tsai, C.Y. The instability of short waves on a vortex ring. J. Fluid Mech. 1974, 66, 35–47. [Google Scholar] [CrossRef]
  9. Brancher, P.; Chomaz, J.; Huerre, P. Direct numerical simulations of round jets: Vortex induction and side jets. Phys. Fluids 1994, 6, 1768–1774. [Google Scholar] [CrossRef]
  10. Boguslawski, A.; Tyliszczak, A.; Wawrzak, K. Large eddy simulation predictions of absolutely unstable round hot jet. Phys. Fluids 2016, 28, 025108. [Google Scholar] [CrossRef]
  11. Gohil, T.B.; Saha, A.K.; Muralidhar, K. Direct numerical simulation of forced circular jets: Effect of varicose perturbation. Int. J. Heat Fluid Flow 2013, 44, 524–541. [Google Scholar] [CrossRef]
  12. Wawrzak, K.; Boguslawski, A. Impact of numerical method on a side jets formation in a round jet. J. Phys. Conf. Ser. 2016, 760, 012040. [Google Scholar] [CrossRef] [Green Version]
  13. Gnanaskandan, A.; Bellan, J. Side-jet effects in high-pressure turbulent flows: Direct Numerical Simulation of nitrogen injected into carbon dioxide. J. Supercrit. Fluids 2018, 140, 165–181. [Google Scholar] [CrossRef]
  14. Sagaut, P. Large Eddy Simulation for Incompressible Flows: An Introduction, 3rd ed.; Springer: Berlin/Heidelberg, Germany, 2006. [Google Scholar]
  15. Wawrzak, K.; Boguslawski, A.; Tyliszczak, A. LES predictions of self-sustained oscillations in homogeneous density round free jet. Flow Turbul. Combust. 2015, 95, 437–459. [Google Scholar] [CrossRef] [Green Version]
  16. Vreman, A. An eddy-viscosity subgrid-scale model for turbulent shear flow: Algebraic theory and applications. Phys. Fluids 2004, 16, 3670–3681. [Google Scholar] [CrossRef]
  17. Boguslawski, A.; Tyliszczak, A.; Wawrzak, A.; Wawrzak, K. Numerical simulation of free jets. Int. J. Numer. Methods Heat Fluid Flow 2017, 27, 1056–1063. [Google Scholar] [CrossRef]
  18. Lele, S.K. Compact finite difference schemes with spectral-like resolution. J. Comput. Phys. 1992, 103, 16–42. [Google Scholar] [CrossRef]
  19. Tyliszczak, A. A high-order compact difference algorithm for half-staggered grids for laminar and turbulent incompressible flows. J. Comput. Phys. 2014, 276, 438–467. [Google Scholar] [CrossRef]
  20. Constantinescu, G.S.; Lele, S.K. A highly accurate technique for the treatment of flow equations at the polar axis in cylindrical coordinates using series expansions. J. Comput. Phys. 2002, 183, 165–186. [Google Scholar] [CrossRef] [Green Version]
  21. Klein, M.; Sadiki, A.; Janicka, J. A digital filter based generation of inflow data for spatially developing direct numerical or large eddy simulations. J. Comput. Phys. 2003, 186, 652–665. [Google Scholar] [CrossRef]
  22. Tyliszczak, A. Parametric study of multi-armed jets. Int. J. Heat Fluid Flow 2018, 73, 82–100. [Google Scholar] [CrossRef]
  23. Ball, C.G.; Fellouah, H.; Pollard, A. The flow field in turbulent round free jets. Prog. Aerosp. Sci. 2012, 50, 1–26. [Google Scholar]
  24. Hunt, J.C.R.; Wray, A.A.; Moin, P. Eddies, Streams, and Convergence Zones in Turbulent Flows. Studying Turbulence Using Numerical Simulation Databases, 2. Available online: https://ntrs.nasa.gov/citations/19890015184 (accessed on 10 September 2022).
  25. Sadeghi, H.; Pollard, A. Effects of passive control rings positioned in the shear layer and potential core of a turbulent round jet. Phys. Fluids 2012, 24, 115103. [Google Scholar] [CrossRef]
  26. Mi, J.; Xu, M.; Zhou, T. Reynolds number influence on statistical behaviors of turbulence in a circular free jet. Phys. Fluids 2013, 25, 075101. [Google Scholar] [CrossRef]
  27. da Silva, C.B.; Metais, O. Vortex control of bifurcating jets: A numerical study. Phys. Fluids 2002, 14, 3798–3819. [Google Scholar] [CrossRef]
  28. Zaman, K.B.M.Q.; Hussain, A.K.M.F. Vortex pairing in a circular jet under controlled excitation. Part 1. general jet response. J. Fluid Mech. 1980, 101, 449–491. [Google Scholar] [CrossRef]
  29. Tyliszczak, A.; Geurts, B.J. Parametric analysis of excited round jets–numerical study. Flow Turbul. Combust. 2014, 93, 221–247. [Google Scholar] [CrossRef] [Green Version]
  30. Crow, S.C.; Champagne, F.H. Orderly structure in jet turbulence. J. Fluid Mech. 1971, 48, 547–691. [Google Scholar] [CrossRef]
  31. Boguslawski, A.; Wawrzak, K.; Tyliszczak, A. A new insight into understanding the Crow and Champagne preferred mode: A numerical study. J. Fluid Mech. 2019, 869, 385–416. [Google Scholar] [CrossRef]
  32. Tyliszczak, A.; Kuban, L.; Stempka, J. Numerical analysis of non-excited and excited jets issuing from non-circular nozzles. Int. J. Heat Fluid Flow 2022, 94, 108944. [Google Scholar] [CrossRef]
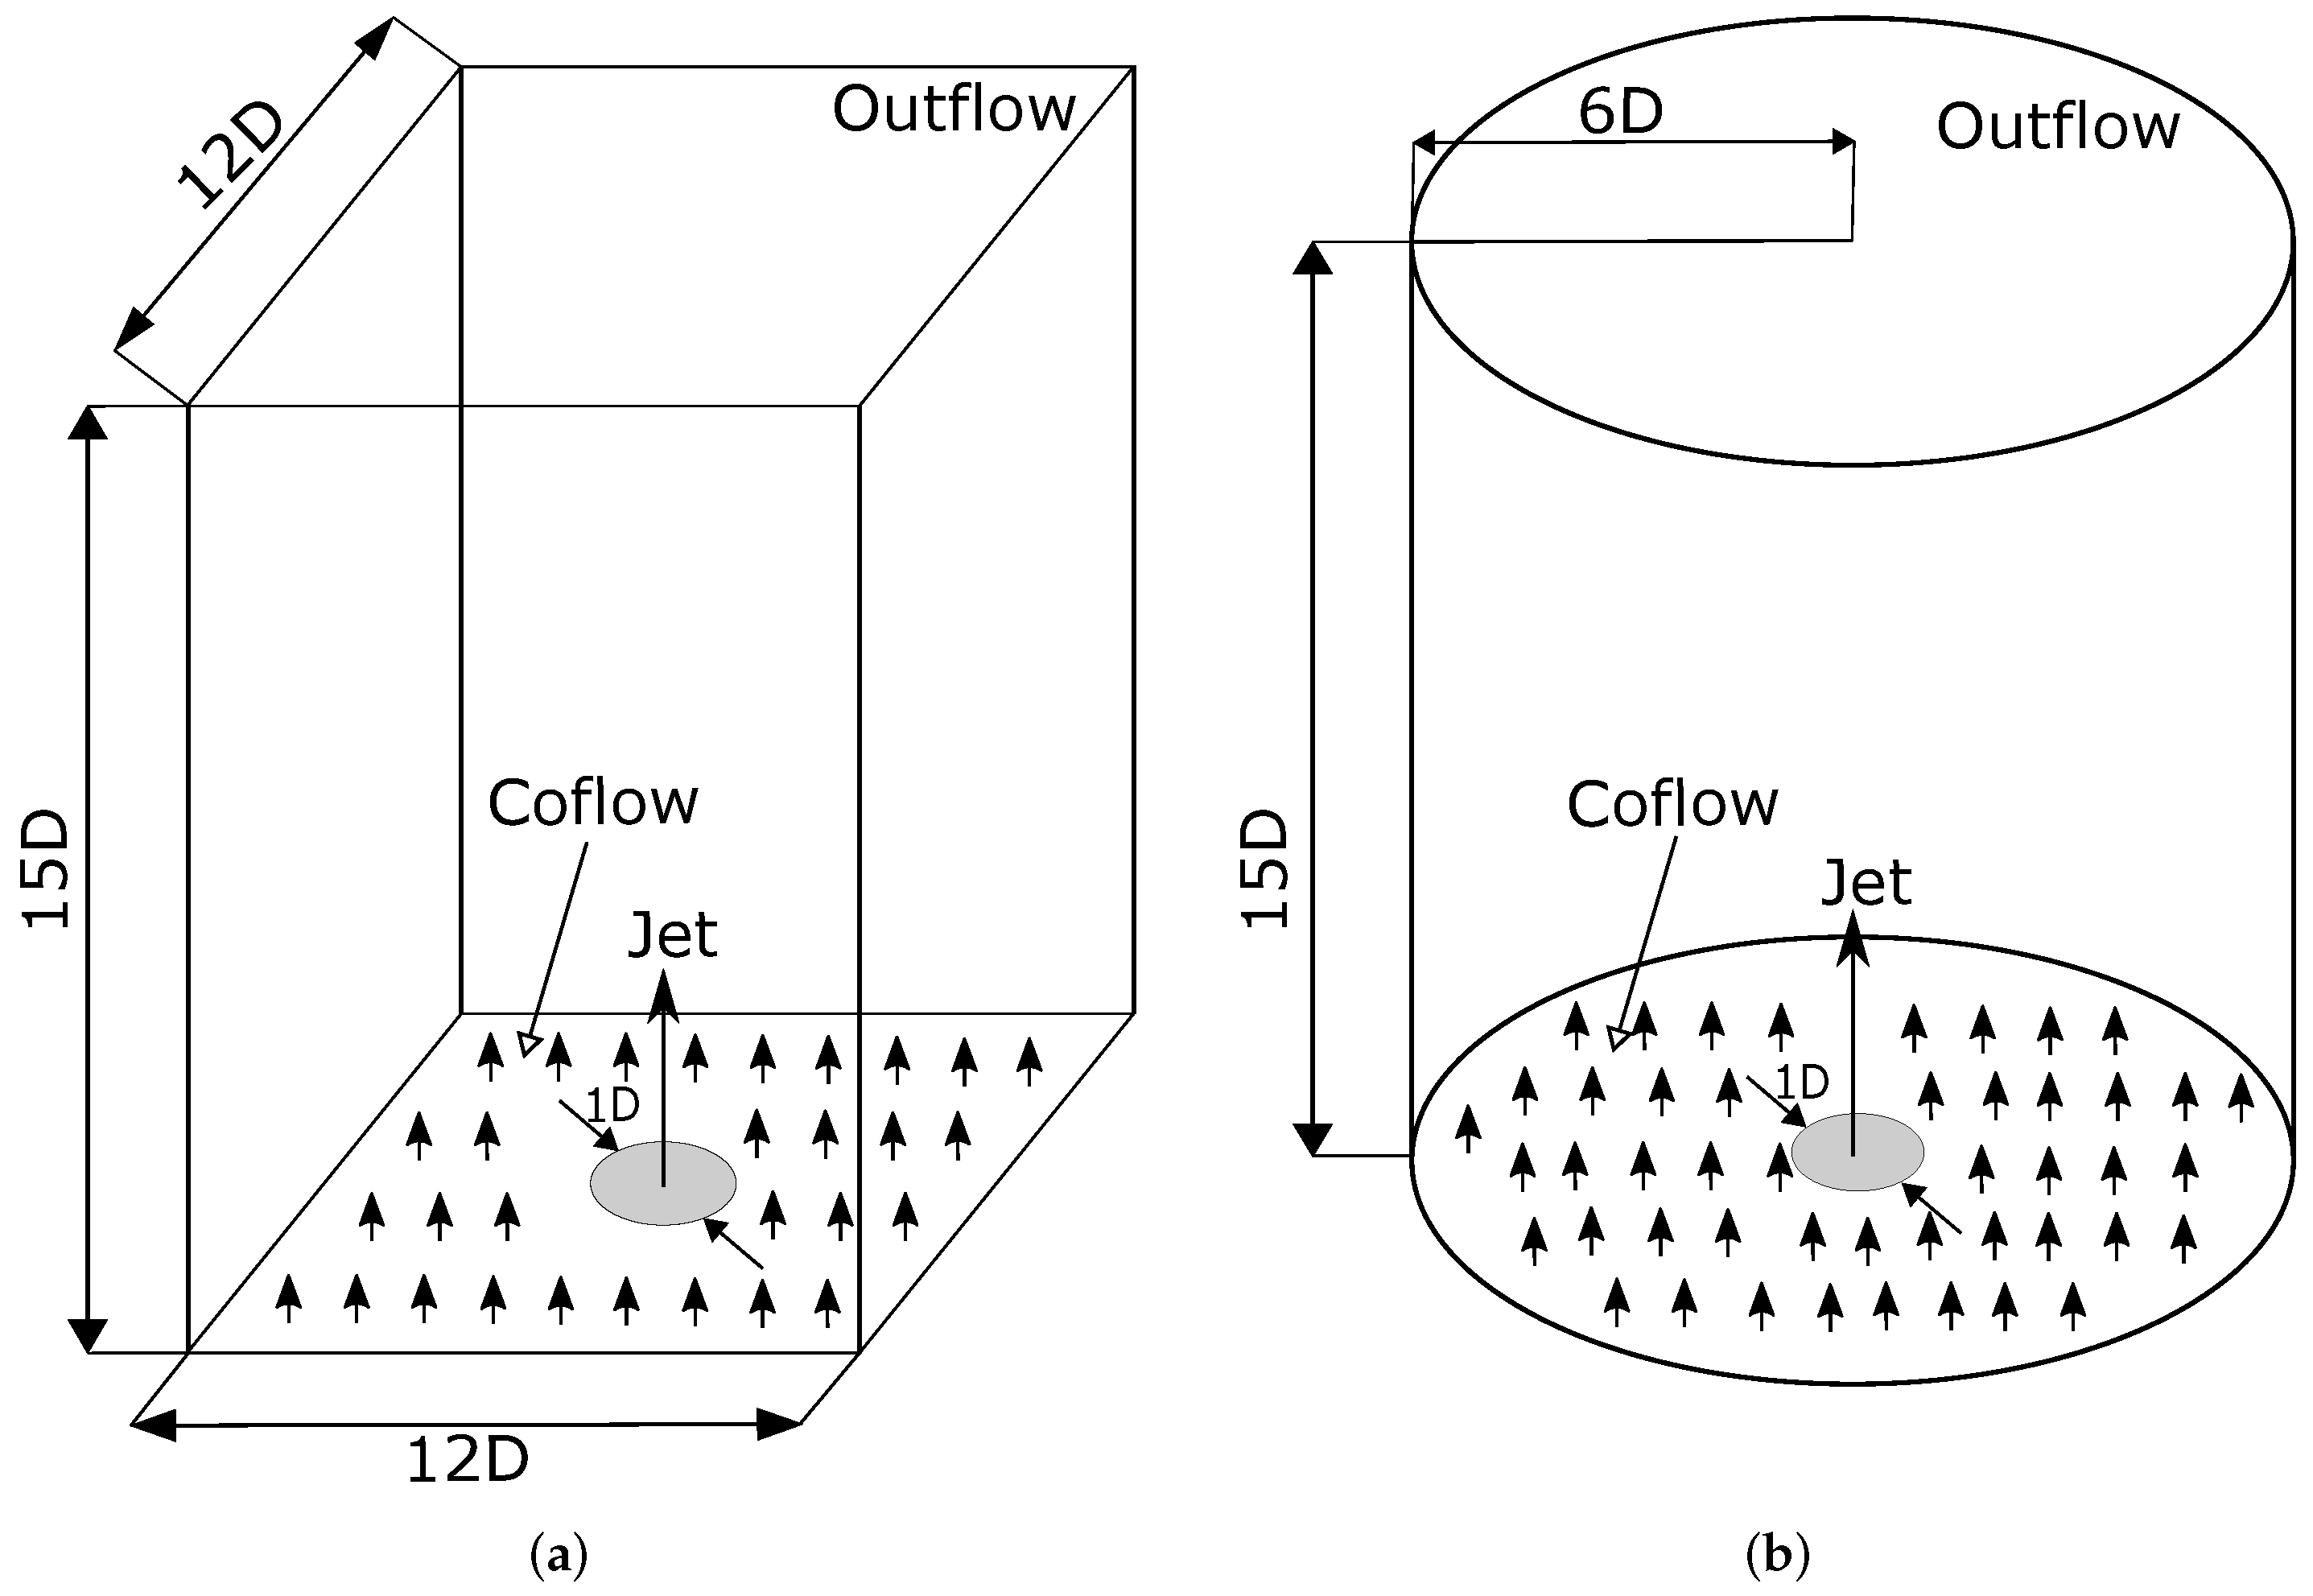
Figure 1. Computational domains: Cartesian (a) and cylindrical (b).
Applsci 12 11244 g001
Figure 2. Computational meshes: Cartesian (a) and cylindrical (b).
Applsci 12 11244 g002
Figure 3. Contours of instantaneous values of the vorticity modulus | Ω | × D / U 0 in the central cross-section and isosurfaces of the Q-parameter ( Q = 1 ( U 0 / D ) 2 ) in the Cartesian and cylindrical coordinate systems obtained for T i = 0.01 % , 0.1 % and 1.0 % .
Applsci 12 11244 g003aApplsci 12 11244 g003b
Figure 4. Evolution of the spectra of the axial velocity fluctuations registered at the jet axis. The results obtained for N E C a r T i 0.01 and N E C y l T i 0.01 .
Applsci 12 11244 g004
Figure 5. Contours of instantaneous (left sides of the subfigures) and time-averaged (right sides of the subfigures) values of the axial velocity U x / U 0 in the central cross-section in the Cartesian and cylindrical coordinate systems obtained for T i = 0.01 % , 0.1 % and 1.0 % .
Applsci 12 11244 g005
Figure 6. Profiles of the time-averaged axial velocity (a) and its fluctuations (b) along the jet axis. The comparison of the results obtained in the Cartesian and cylindrical coordinate systems [26,27,28].
Applsci 12 11244 g006
Figure 7. Profile of the axial velocity fluctuations along the jet axis in excited jets in the Cartesian and cylindrical coordinate systems at T i = 1.0 % , T i = 0.1 % (a) and T i = 0.01 % (b).
Applsci 12 11244 g007
Figure 8. Iso-surfaces of Q-parameter Q = 1 ( U 0 / D ) 2 (a,b left) and contours of streamwise vorticity ω x × D / U 0 (a,b right top) and radial velocity U r / U 0 (a,b right bottom) with velocity vectors.
Applsci 12 11244 g008
Figure 9. Iso-surfaces of the axial velocity U x / U 0 = 0.2 (a) and contours of axial velocity U x / U 0 at the plane perpendicular to the jet axis (b). The results are obtained for the case E C a r T i 0.01 .
Applsci 12 11244 g009
Figure 10. Iso-surfaces of the axial velocity U x / U 0 = 0.2 (a) and contours of axial velocity U x / U 0 at the plane perpendicular to the jet axis (b). The results are obtained for the case E C y l T i 0.01 .
Applsci 12 11244 g010
Figure 11. Contours of an instantaneous axial velocity U x / U 0 at the plane perpendicular to the jet axis x / D = 9 for the case E C a r T i 0.01 .
Applsci 12 11244 g011
Figure 12. Contours of an instantaneous axial velocity U x / U 0 at the plane perpendicular to the jet axis x / D = 9 for the case E C y l T i 0.01 .
Applsci 12 11244 g012
Figure 13. Contours of an instantaneous axial velocity U x / U 0 at the plane perpendicular to the jet axis x / D = 9 for the case E C a r T i 0.1 .
Applsci 12 11244 g013
Figure 14. Contours of an instantaneous axial velocity U x / U 0 at the plane perpendicular to the jet axis x / D = 9 for the case E C a r T i 1.0 .
Applsci 12 11244 g014
Figure 15. Contours of an instantaneous axial velocity U x / U 0 at the plane perpendicular to the jet axis x / D = 9 for the case E C y l T i 0.1 .
Applsci 12 11244 g015
Figure 16. Contours of an instantaneous axial velocity U x / U 0 at the plane perpendicular to the jet axis x / D = 9 for the case E C y l T i 1.0 .
Applsci 12 11244 g016
Publisher’s Note: MDPI stays neutral with regard to jurisdictional claims in published maps and institutional affiliations.