Article

Prediction of Residual NPK Levels in Crop Fruits by Electronic-Nose VOC Analysis following Application of Multiple Fertilizer Rates

1
Department of Mechanical Engineering of Biosystems, Razi University, Kermanshah 67156-85421, Iran
2
Department of Biosystems Engineering, University of Mohaghegh Ardabili, Ardabil 56199-11367, Iran
3
Southern Hardwoods Laboratory, Center for Forest Health & Disturbance, Forest Genetics & Ecosystems Biology, Pathology Department, Southern Research Station, USDA Forest Service, 432 Stoneville Road, Stoneville, MS 38776-0227, USA
*
Authors to whom correspondence should be addressed.
Appl. Sci. 2022, 12(21), 11263; https://doi.org/10.3390/app122111263
Submission received: 20 September 2022 / Revised: 28 October 2022 / Accepted: 3 November 2022 / Published: 7 November 2022
(This article belongs to the Section Agricultural Science and Technology)

Abstract

:
The excessive application of nitrogen in cucumber cultivation may lead to nitrate accumulation in fruits with potential toxicity to humans. Harvested fruits of agricultural crops should be evaluated for residual nitrogen, phosphorus, and potassium (NPK) nutrient levels. This is necessary to avoid nutrient toxicity from the consumption of fresh produce with excessive nutrient levels. Electronic noses are instruments well-suited for the nondestructive detection of fruit and vegetable quality based on volatile organic compound (VOC) emissions. This proof-of-concept study was designed to test the efficacy of using an electronic nose with statistical regression models to indirectly predict excessive fertilizer application based on VOC emissions from cucumber fruits grown under controlled greenhouse conditions to simulate field conditions but eliminate most environmental variables affecting plant volatile emissions. To identify excess nitrogen in cucumber plants, five different levels of urea fertilizer application rates were tested on cucumbers (control without fertilizer, 100, 200, 300, and 400 kg/ha). Chemometric methods, such as the partial least squares regression (PLSR) method, the principal component regression (PCR) method, and the multiple linear regression (MLR) method, were used to create separate regression models to predict nitrogen (N), phosphorus (P), and potassium (K) levels in cucumber fruits following application of different fertilizer rates to greenhouse soils. The correlation coefficients for the MLR model (based on the optimal parameters of PCR and PLSR) were 0.905 and 0.905 for the calibration sets and 0.900 and 0.900 for the validation sets, respectively. The nitrogen prediction model for fruit nitrates was more accurate than other nutrient models. The proposed method could potentially be used to indirectly detect excessive use of fertilizers in cucumber field crops.

1. Introduction

Cucumber (Cucumis sativus L.), a member of the Cucurbitaceae family, has long been an economically important, commercial vegetable fruit crop. Globally, it is grown as a seasonal crop and is native to India [1]. Cucumber ranks as the fourth largest vegetable crop in the world based on annual production level [2]. Fresh cucumber is a popular vegetable in the human diet due to its antioxidants, vitamins (vitamin C, pantothenic acid, B5), and minerals (especially magnesium), which are all important for nutritional health. The fruits are low in calories (150 kcal/Kg) and consist of about 95% water, 3.6% carbohydrates, and 0.65% protein [3]. Food quality and safety are currently major issues around the world. Product safety in the food industry is directly related to consumer health and social progress [4]. In sustainable agriculture today, an important focus is on providing plants with sufficient nutrients by increasing soil fertility using materials of natural origin and biofertilizers, when possible, and minimizing the use of commercial fertilizers [5].
A variety of operations (from cultivation to processing) are required to produce safe food within the production chain. Any biological or chemical substance harmful to human consumption threatens food safety. Thus, healthful vegetable products (fresh produce) must have minimal amounts of harmful chemical substances that pose health risks to the consumer [6]. Excessive use of fertilizers has led to an environmental crisis in many parts of the world, negatively impacting terrestrial and aquatic ecosystems by reducing biodiversity and increasing greenhouse gas emissions from agriculture [7,8]. Organic agricultural products have been used as a substitute to help reduce the use of chemical fertilizers and increase levels of organic matter in soil.
Plants require 14 essential nutrients, including the macronutrient nitrogen (N) and the minerals potassium (K) and phosphorus (P) in relatively large amounts for healthy plant growth. The best-known nitrogen fertilizer is urea (NH2CONH2) [9]. Fertilizer application rates should be based on a soil analysis [9]. Depending on soil conditions, micro-dosing with nitrogen fertilizer leads to healthier plants and is thus more efficient to support crop production [10]. Excessive use of fertilizers may lead to nutrient toxicity in food products [11]. Nitrogen (N) fertilizers such as urea are converted into nitrate (within the plant), a carcinogen known to cause gastrointestinal cancer and immune disorders [12]. Potassium (K) is essential for proper plant nutrition and is particularly required for flowering. Applying phosphorus (P) to soils helps maintain plant productivity by improving plant growth, crop yield, and promoting growth of beneficial soil microbes [13]. However, the accumulation of excessive nutrients in soils leads to nutrient imbalances and reductions in populations of beneficial soil microorganisms [14].
Gas sensor technologies, such as electronic-nose (e-nose) instruments, have greatly improved the quality of plant products resulting from production systems in many industries, including agriculture [15]. The development of gas sensing, electronic aroma detection (EAD) devices has helped to solve many common problems associated with various production industries such as quality control and quality assurance (QA-QC) [15], odor or aroma detection [16,17], food and beverage contamination [18], environmental pollution [19], human health problems [20], as well as product quality, purity, consistency, and safety [21,22,23]. E-nose devices are particularly useful for acquiring real-time information about the chemical and physiological characteristics of plants and plant products based on their volatile organic compound (VOC) emissions [15]. Many different e-nose instruments have been developed with different operating principals for the detection of specific chemical classes of target VOCs emitted from plants [16]. Electronic nose devices with metal oxide semiconducting (MOS) sensors are often a preferred sensor type selected to analyze plant volatiles because of their stability, precision, rapid recovery, resistance to deactivation (poisoning) by strongly polar VOC analytes, and effective operating mechanism for plant VOC detection [15].
Several analytical methods have been shown to be effective in identifying VOCs derived from living organic sources, including mass and ion mobility spectroscopy [24], gas chromatography [25], and infrared spectroscopy [26]. However, these instruments are very expensive to operate and require lengthy and complex analytical procedures [27,28]. In recent years, e-nose devices have been shown to be effective alternative instruments to detect and analyze VOC emissions from commercial plant and animal food products. These devices offer more simplified means of discriminating between VOC emissions from different sources and provide reliable and precise measurements, fast operation, and quick sensor recovery times at affordable operating costs [15,27,28,29].
A recent study, utilizing an experimental MOS e-nose device, provided evidence of the potential efficacy of analyzing differences in VOC emissions from cucumber fruits, derived from plants receiving known urea fertilization rates, to estimate actual nitrogen-based nutrient levels with the assistance of statistical models [30]. The current research is a follow-up of this study to further evaluate these methods using statistical models for indirectly estimating levels of NPK nutritive components of cucumber fruits using data from chemical analyses of plant tissues in combination with e-nose (olfactory machine-based VOC analyses) data for correlating fertilizer application rates to resulting nutrient levels in harvested fruits. We hypothesized that differences in nitrate levels in fruits could be indirectly detected by changes and differences in VOC emissions from cucumber fruits, due to nitrate-level effects on host plant metabolic pathways, as reflected by differences in the e-nose sensor array output (smellprint) patterns. The objectives of this study were to (1) evaluate the capabilities of an e-nose instrument to detect differences in fertilizer treatments based on VOC emissions from fruits and (2) test partial least squares regression (PLSR), principal component regression (PCR), and multiple linear regression (MLR) statistical models for estimating and correlating actual nutrient levels in cucumber fruits relative to soil fertilizer application rates applied to individual treatment plants.

2. Materials and Methods

The cucumber fertilizer experiment described herein was initiated with the planting of seeds in February 2021 and completed with the final harvesting of all resulting cucumber fruits from experimental plants by the end of July. Cultivated plants were grown within a metal-frame greenhouse covered with anti-ultraviolet (UV) plastics with necessary environmental controls for temperature control and ventilation. The soil upon which the greenhouse was built had a medium texture, sandy loam with good drainage, and no salinity or alkalinity. A precise plant growth medium (described in Section 2.1) was brought in to prepare cultivation beds on top of the greenhouse base soil type, requiring no tillage.

2.1. Preparation of Plant Growth Medium, Experimental Design, and Fruit Samples

We mixed silty-clay soil, aged and composted animal manure, and sand at a ratio of 2:1:1 to prepare a suitable growth medium for planting cucumber seeds within greenhouse research plots. For the analysis of the chemical and physical properties of the soil, soil samples were taken randomly from a depth of 0 to 30 cm after soil preparation and before initiating the experiment [30]. The physical and chemical properties of the soil growth medium are listed in Table 1.
The experimental cucumber cultivation area within a greenhouse was divided into five parts with an area of 1.8 m2 for each subplot. Specific amounts of urea nitrogen fertilizer (46% urea) were applied to separate treatment subplots before sowing in the amounts of 0 (no added fertilizer), 100, 200, 300, and 400 kg urea/ha using a completely randomized experimental (spatial) placement design for the five treatments, identical to methods described previously [30]. The levels of urea applied to individual cucumber plants were assumed to have directly affected nitrate levels in the fruits affecting host physiology and resulting changes in fruit VOC emissions. Other physical and chemical characteristics of the greenhouse soil used in this study were determined by various soil chemical tests. Dutch cucumber seeds (cultivar Beta Alpha F1) were obtained from vegetable seed stores (Kermanshah, Iran). Seeds were planted uniformly in subplots (for each treatment) prepared directly in soil beds within a research greenhouse on the agricultural campus of Razi University. Three cucumber vines were prepared for each of the five fertilizer-treatment levels. Five cucumber fruits were harvested from each plant approximately 4 months after seed planting, providing a minimum of 15 total replications for each treatment. All subplots were irrigated every two days to soil saturation. The temperature in the greenhouse was 25 ± 4 °C with relative humidity of 50–80%. Urea fertilizer was the only treatment variable. For all five treatments with variable urea fertilizer applied, all plants were at the same growth stage and age for each treatment. No pesticides or insecticides were used in the experiment. After the cucumbers produced fruits, fruits of equal weight were taken from plants of each urea treatment for laboratory chemical tests to measure nitrogen, potassium, and phosphorus levels [30].

2.2. Electronic Nose

An experimental electronic nose equipped with 8 metal oxide sensors (MOS), as described previously in detail [30], each with cross-sensitivity to specific chemical or VOCs, was used for electronic aroma analyses. The names of sensors in the sensor array (in order, with primary VOCs detected) are as follows: MQ3 (alcohols), TGS822 (organic solvents), MQ136 (sulfur dioxide), MQ9 (carbon monoxide and combustible gases), TGS813 (aliphatic alkanes), MQ135 (ammonia, benzene, sulfides), TGS2620 (alcohols, organic solvents), and TGS2602 (H2S, sulfides, ammonia, toluene).
The detection parameters utilized for e-nose operation are as follows. To establish a stable sensor baseline, the e-nose system was purged with fresh air for 150 s before testing. At initial stage, air flow was initiated by a diaphragm pump in which air passed through an activated carbon filter to remove VOCs from the purge air. Purge air was injected into the sensor chamber to clean the sensors from any volatiles attached to the sensor surfaces. Sample headspace volatiles were analyzed for 150 s for one complete sample run. The flow rate of the sample gas to the sensor array chamber was set at 200 mL/min. Data responses were instantly collected for subsequent analysis. The final step in the run sequence ended with the sensor array being purged again with fresh air for 200 s. The output voltage of the sensors changed due to exposure to VOCs within gases emitted from the sample and all sensor responses were collectively recorded in data collection cards. The sensor signals were recorded and stored at 1 s intervals (Figure 1). To maintain e-nose sensor-response stability, the e-nose operating temperature for the analysis of all samples was held at 25 ± 1 °C. The variation in air sample relative humidity of cucumber samples was 5 ± 2% RH. Thus, relative humidity had minimal impact on e-nose sensor responses and recognition of fruit volatiles (VOC emissions) from cucumber samples analyzed by MOS sensors.
Electronic aroma data, recorded for each sensor within the sensor array, were stored as electrical resistance values recorded over time within an Excel spreadsheet. E-nose response consists of three components: (1) a baseline response during the carrier gas reference phase, (2) a response curve during the sampling (data acquisition) phase, and (3) a transition of sensor responses back to baseline during the purge and recovery phase (Figure 1).

Cucumber Fruit Volatile Analyses

Cucumber fruits of similar same size (length 10 to 12 cm) and weight (50 to 60 g) were harvested and placed into separate sample storage containers. Five cucumber fruit samples from each of three plants, n = 15 for each treatment, were maintained at 23 °C for 120 min and placed singly (1 cucumber per sample) within the sampling chamber to build headspace volatiles prior to separate e-nose analysis. The e-nose sensor array was exposed to cucumber fruit sample VOCs via a tube delivery system in which individual sensors interacted with VOCs adsorbing to the sensor surface leading the changes in electrical resistance by which sensor responses were recorded. The changes in electrical resistance are proportional to the amount of chemical adsorption and response specificity of the sensor surface to specific VOC vapors. The signal responses of individual sensors, resulting in changes in electrical resistance, provided the primary data from the sensor array which were assembled to create a sensor-response distribution pattern (smellprint signature) used to identify VOC mixtures based on pattern recognition algorithms. To establish and maintain a stable sensor baseline, the e-nose system was purged with fresh air for 150 s before the testing of each cucumber air sample.

2.3. Determination of Chemical Fertilizer Residues

Nutrient NPK content of soil growth medium was measured by spectroscopic-spectrophotometric analysis for phosphorus, flame photometer analysis for potassium, and Kjeldahl instrument analysis for nitrogen [31]. To measure phosphorus content, the samples were placed in an oven heated to 600 °C for about 2 h until dried. Dried samples were crushed, and then 0.2 g of each dried sample was mixed with 10 mL of HCl 1N using a pipette. The ash was placed on a hot plate to evaporate to dryness. The cooled ash sample was moved into a 100 mL volumetric flask and filled to 100 mL volume with distilled water. Then, 10 mL aliquots of each sample were transferred by pipette along with 10 mL of yellow vanadate (in distilled water) into a 50 mL volumetric flask, brought up to 50 mL volume. The phosphorus concentration was then determined using the spectrophotometer at 170 nm. The phosphorus standard was prepared first and analyzed before the samples. A vanadate–molybdate colorimeter was used to measure the phosphorus content [32]. The potassium content of soil samples was determined via the flame emission method by measuring the potassium content (100 mL) in a volumetric flask with a flame photometer after standardization with relevant minerals [32].
Nitrogen content in soils was determined using a Kjeldahl apparatus equipped with a digestion system and a distillation unit. Soil samples (100 g) were dried and weighed, then transferred to a Kjeldahl digestion flask containing 7–10 g of catalyst (prepared by mixing K2SO4 (9 g) and 1 g of CuSO4 × 5 H2O) and 25 mL of H2SO4 concentrated acid. After 2.5 h of digestion along with heat extraction and cooling to 21 °C, 80 mL of NaOH (mass fraction w = 33%) was added to each flask. By distillation, the ammonium hydroxide was trapped as ammonium borate in boric acid solution (mass concentration = 40 g/L). Total nitrogen content was determined by standardized HCl titration, using a 1mg/mL green bromocresol with 1 mg/mL methyl red 1:1 mixture color-indicator solution (in ethanol), based on a volume concentration (σ = 950 mL/L) [32].

2.4. Statistical Model Development

Mathematical and statistical methods were used in chemometrics to select the optimal experimental method and to analyze chemical data [33,34]. This method is used in many different fields of study, including science and engineering, and has had a particular impact in the field of spectroscopy [34]. Chemometrics tools include multiple linear regression (MLR), principal component regression (PCR) [35,36], and partial least squares (PLS) regression [37]. The main (multiple) linear calibration methods included: multiple linear regression (MLR), principal component regression (PCR), and partial least squares (PLS). MLR is a linear statistical technique for predicting a response (dependent variable) using two or more multiple predictors (independent variables). However, when MLR is used, a multilinear phenomenon may occur. In a multilinear model, a predictor variable in an MLR model can be linearly predicted with considerable accuracy [38]. Therefore, the estimate of MLR coefficients may change irregularly due to small changes in the model or data. PCR is a multilinear problem solution based on PCA. Under this regression model, a set of predictors is considered based on a standard linear regression model, but PCA is used to estimate the unknown regression coefficients in the model. PCR, a method based on dimensionality reduction, selects some principal components with high variance in the regression phase, which leads to dimensionality reduction by reducing a sufficient number of parameters to describe the base model [39]. In addition, PLS regression is a reliable and effective multivariate chemometric method that is often used to develop a mathematical model between spectral data and reference measurements [40]. Geladi [34] proposed this linear statistical method, which is often referred to as component-based structural equation modeling. PLS variables are different from other methods, such as PCA, which looks for maximum variance schemes between output and input variables. PLS variables show output and input in a new space and then find a linear regression method in the predicted space. It is also a non-parametric method that does not require data normalization and is strong to sample size [41].
The main difference between PLS and PCR is that the latter considers only the X-variable matrix, while PLS includes the Y-response matrix in the regression phase [34]. Multivariate calibration, PLS, PCR, and multiple linear regression (MLR) have been used to predict the percentage of ternary mixtures of cattle, ewes, and goats based on the analysis of milk protein by capillary electrophoresis [42]. MLR and PLS calibration methods were previously used to determine the absorption signal of drugs during drug preparation [43]. Furthermore, PLS and PCR predictions of protein content and hardness for bulk Canadian wheat samples were compared using infrared and near-infrared imaging [44]. These analytical methods also were used to quantify sugar in acarbose fermentation using infrared spectroscopy and chemotherapy [45] and simultaneously evaluate different soil properties [46]. A quantitative PLS model was employed for determining water content of peanut kernels utilized hyperspectral imaging techniques [47].

3. Results

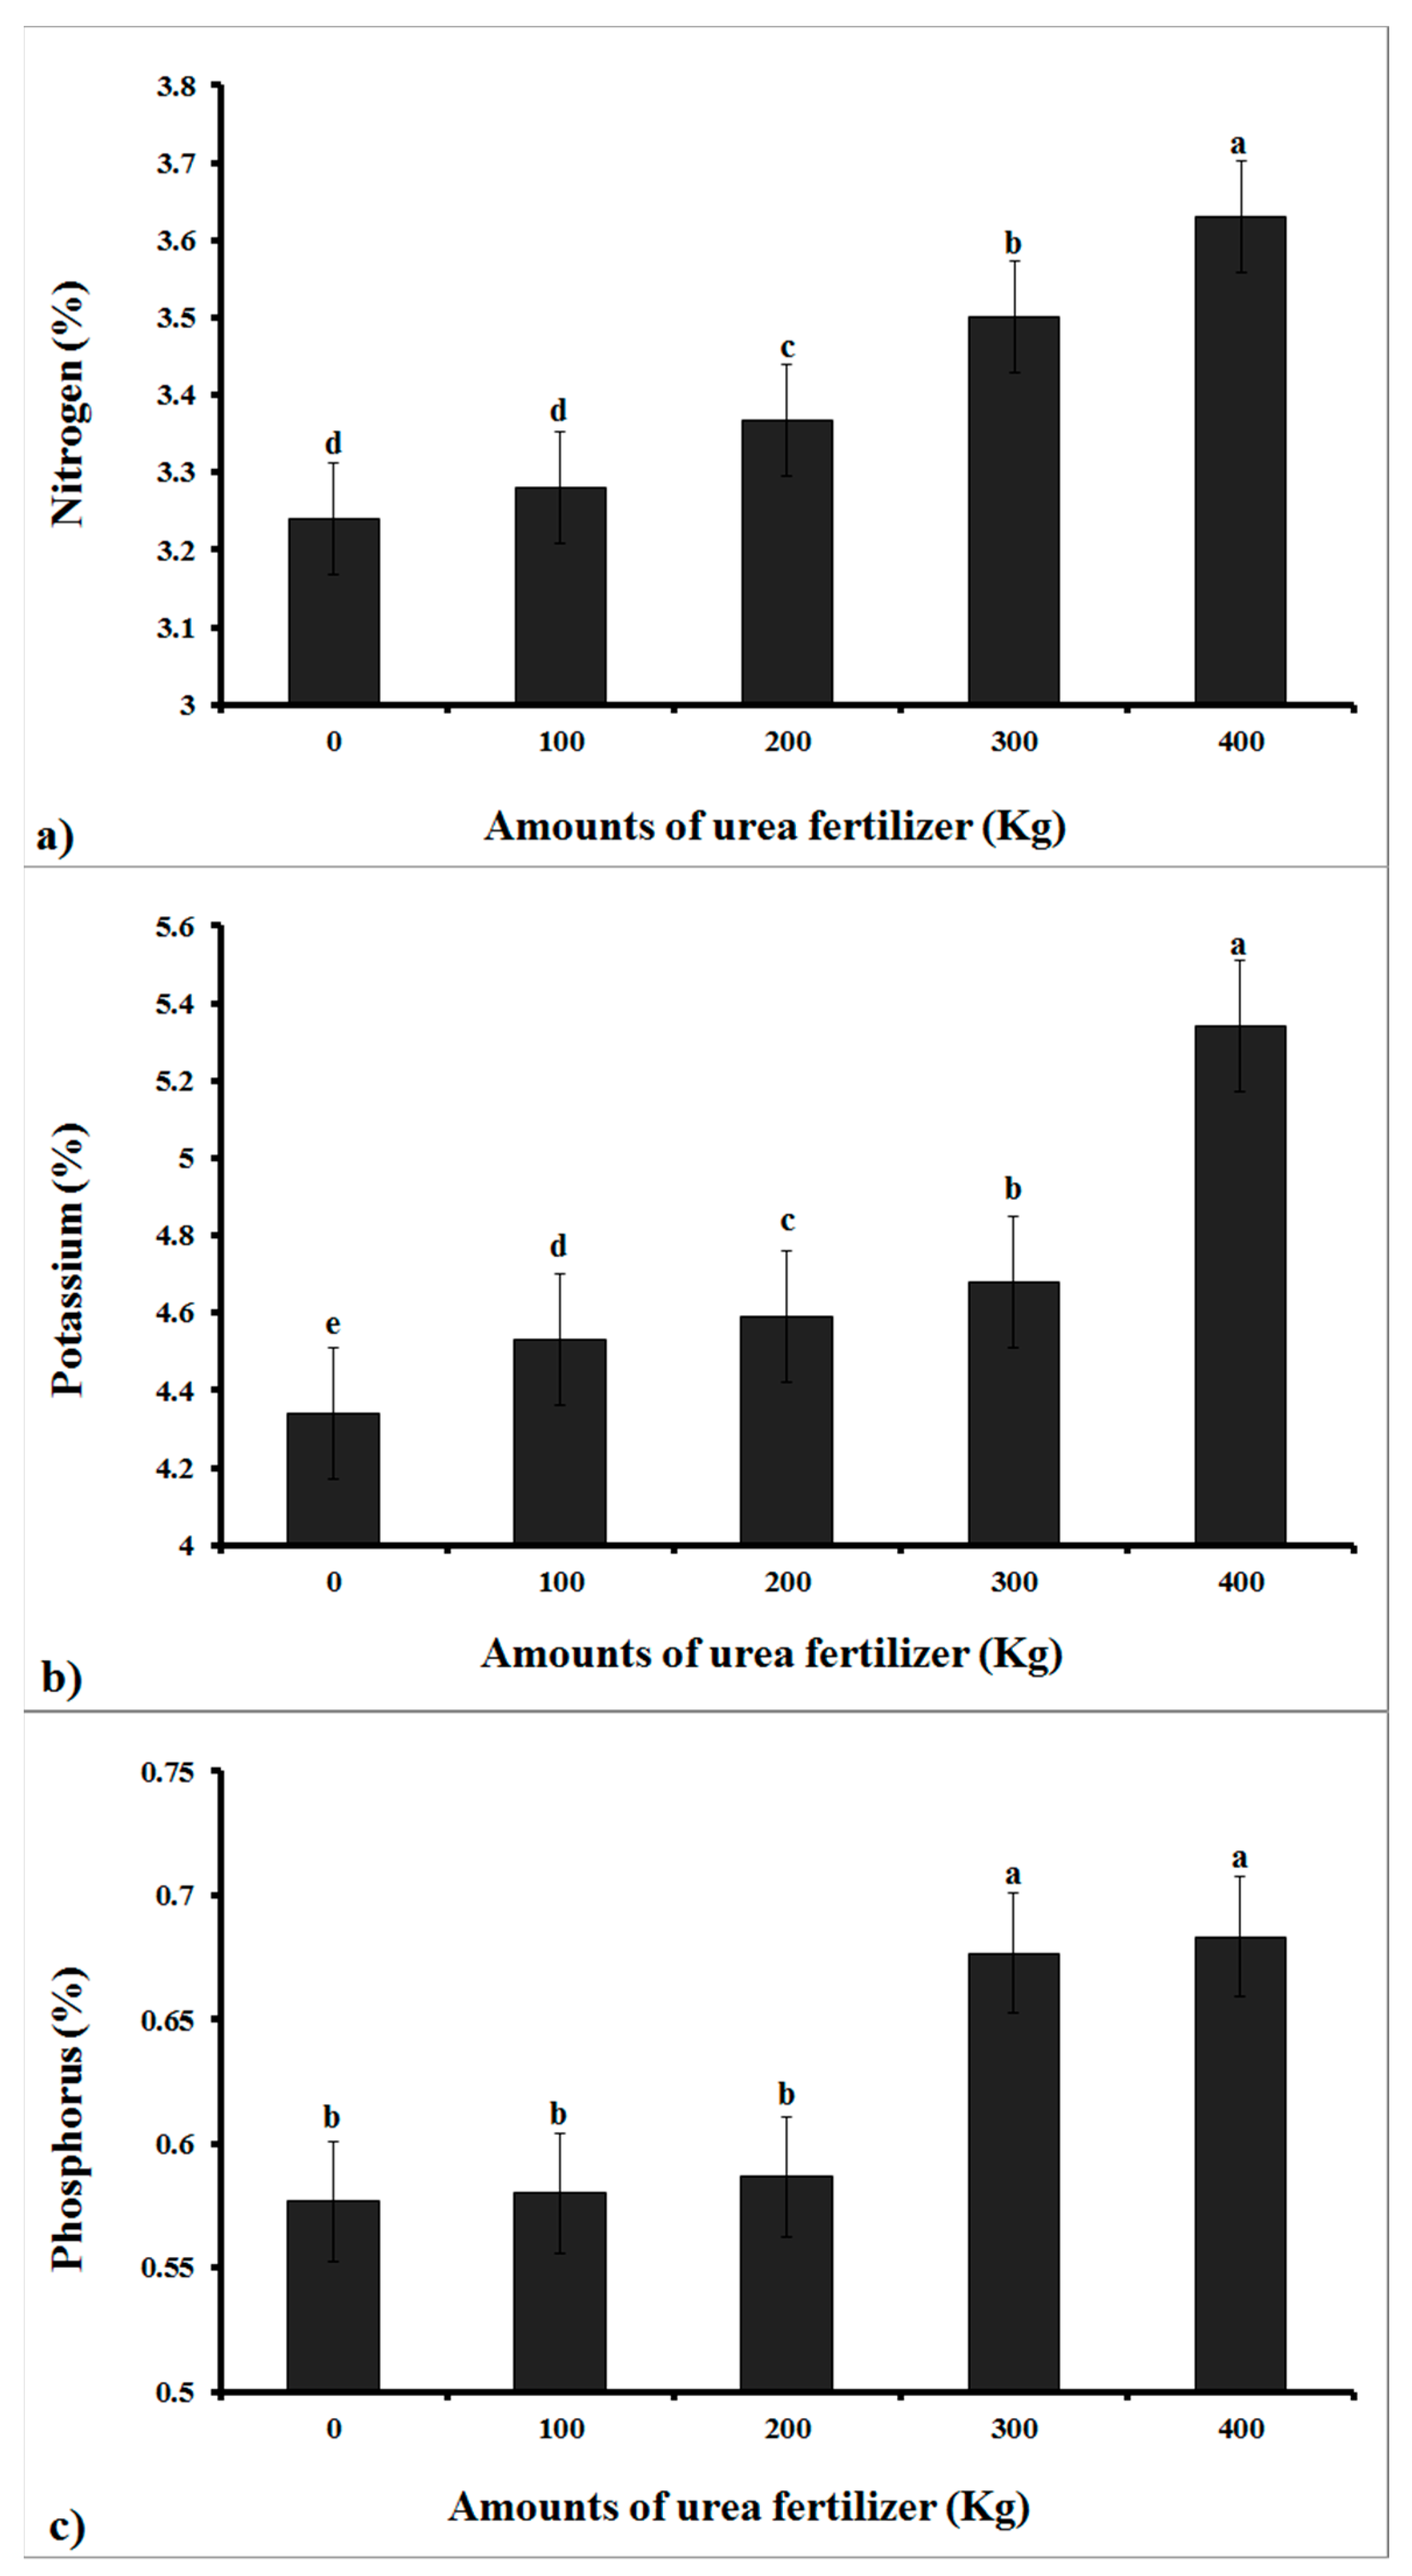
3.1. Results of the Analysis of Variance of the N, P, and K Content of the Cucumber

The N, P, and K macronutrient content in cucumber fruits, determined according to a completely randomized experimental design with five treatments (five levels of urea fertilizer), five replicates per plant, three plants per treatment, and thus 15 total samples per treatment (n = 15), were analyzed using SPSS software (SPSS Inc., Chicago, IL, USA). The ANOVA analysis results for each of the three macronutrients are presented in Table 2.
The results from the ANOVA were significant for the N, P, and K content for all five levels of urea fertilizer (p ≤ 0.01). A comparison of the mean values of the measured factors was also carried out using the Duncan multiple range test (secondary statistics), the results of which are presented in Figure 2. The highest amount of nitrogen was allocated to treatment 5 (3.63%), while the lowest percentages were recorded in the control treatment, where no fertilizer was used, and the second treatment (100 kg). The more urea fertilizer that was applied to greenhouse soils, the more nitrogen that was stored in the cucumber fruits (based on our operating hypothesis).
The NPK nutrient levels estimated in cucumber fruits were highest for potassium (4.0–5.6%), intermediate for nitrogen (3.0–3.8%), and lowest for phosphorus (0.5–0.75%). The highest and lowest potassium values of control and fifth treatments were 4.34 and 5.34%, respectively. There was no significant difference in phosphorus between the first three treatments, and neither the fourth nor the fifth treatment had a significant effect. The first three treatments had the lowest amount of phosphorus, whereas the fourth and fifth treatments had the highest.

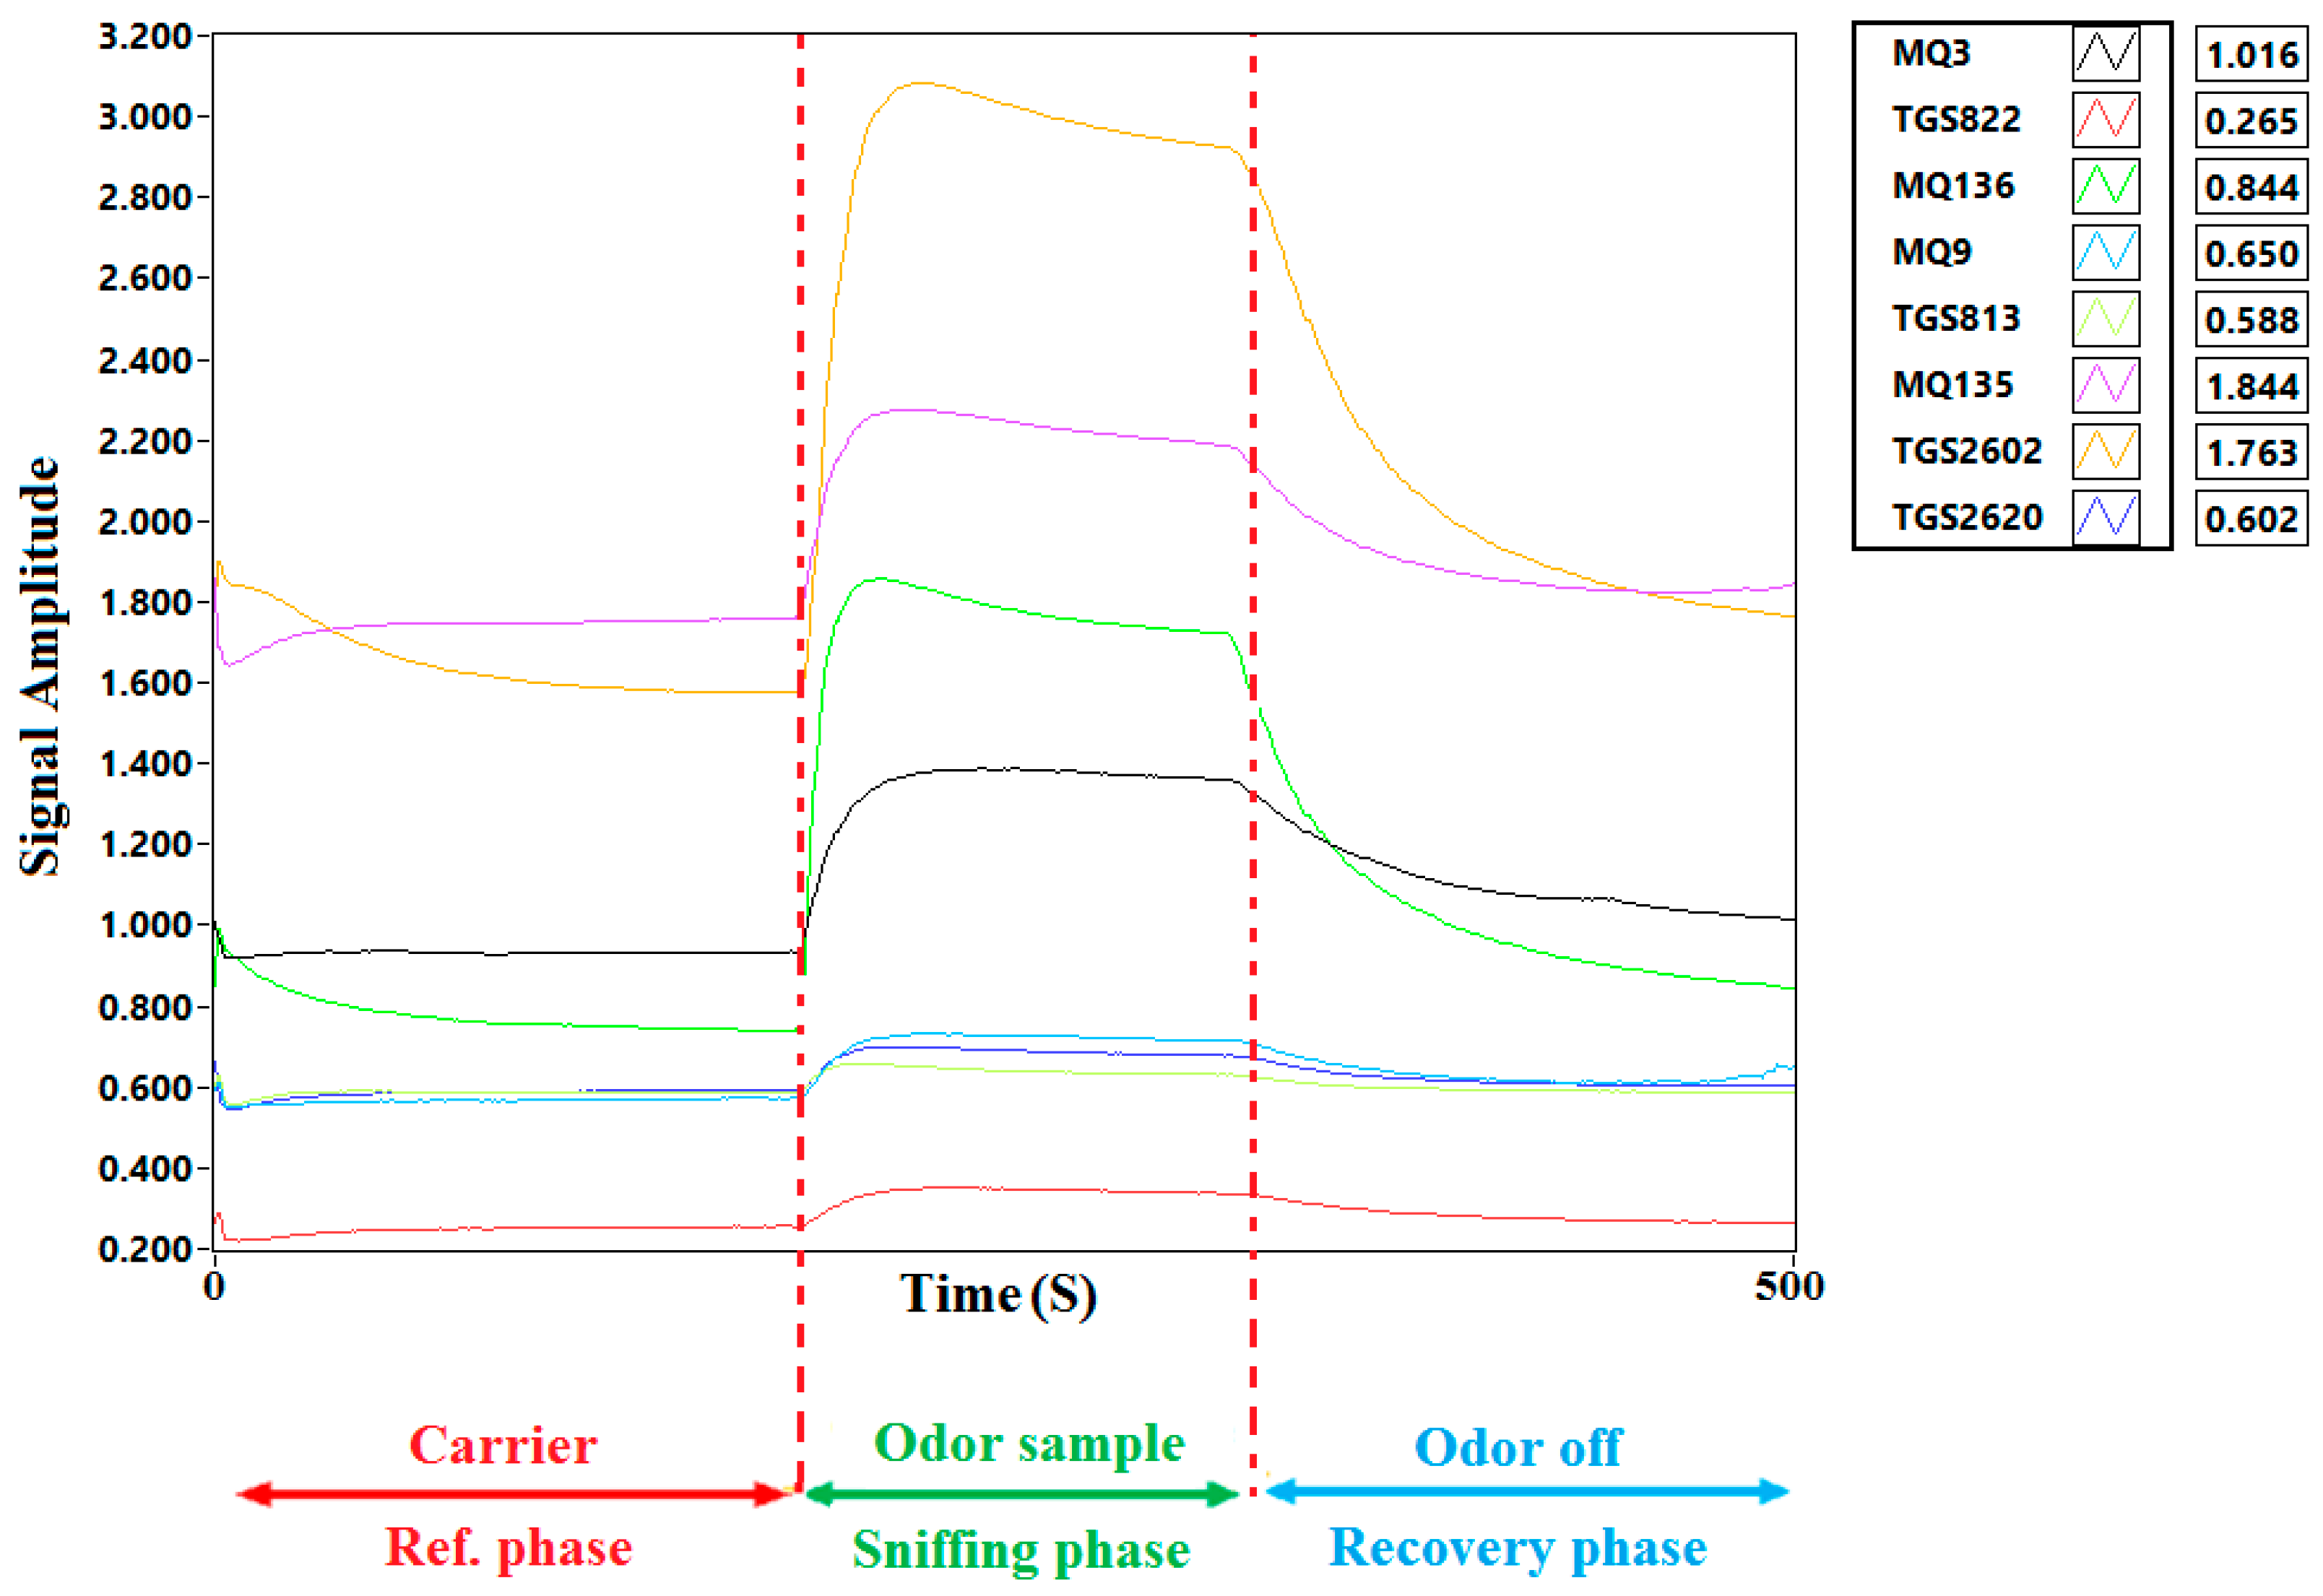
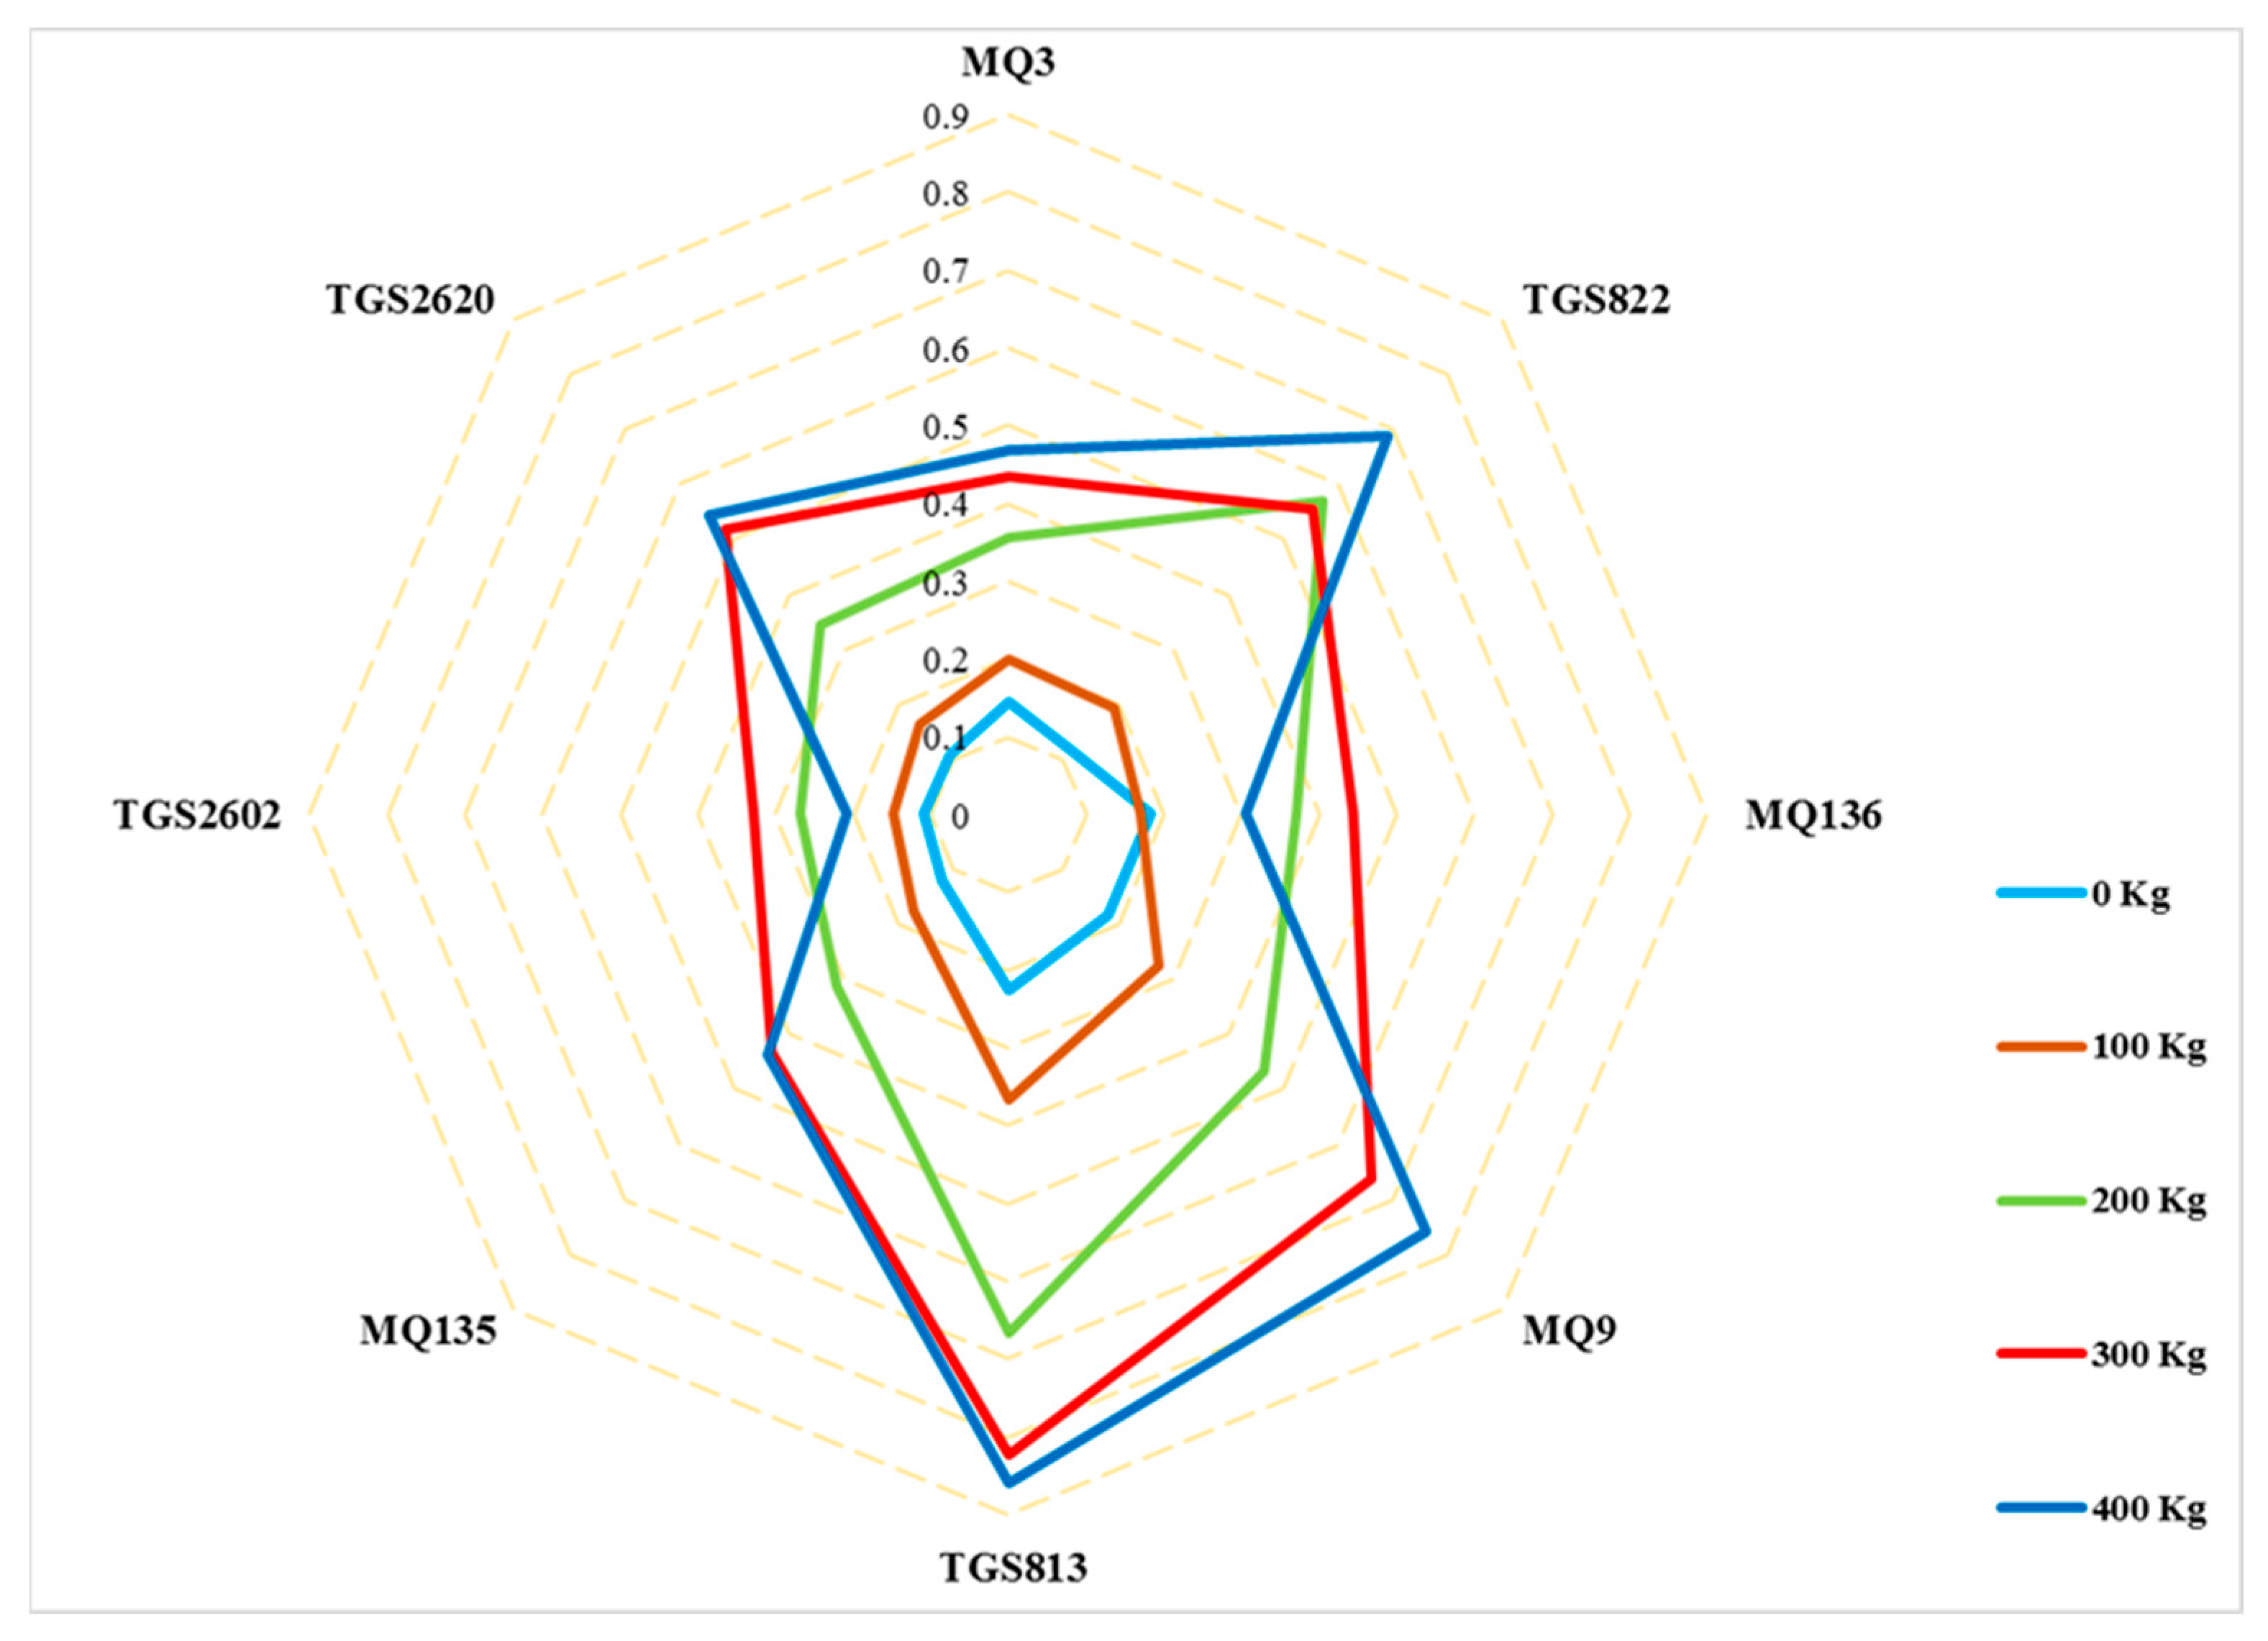
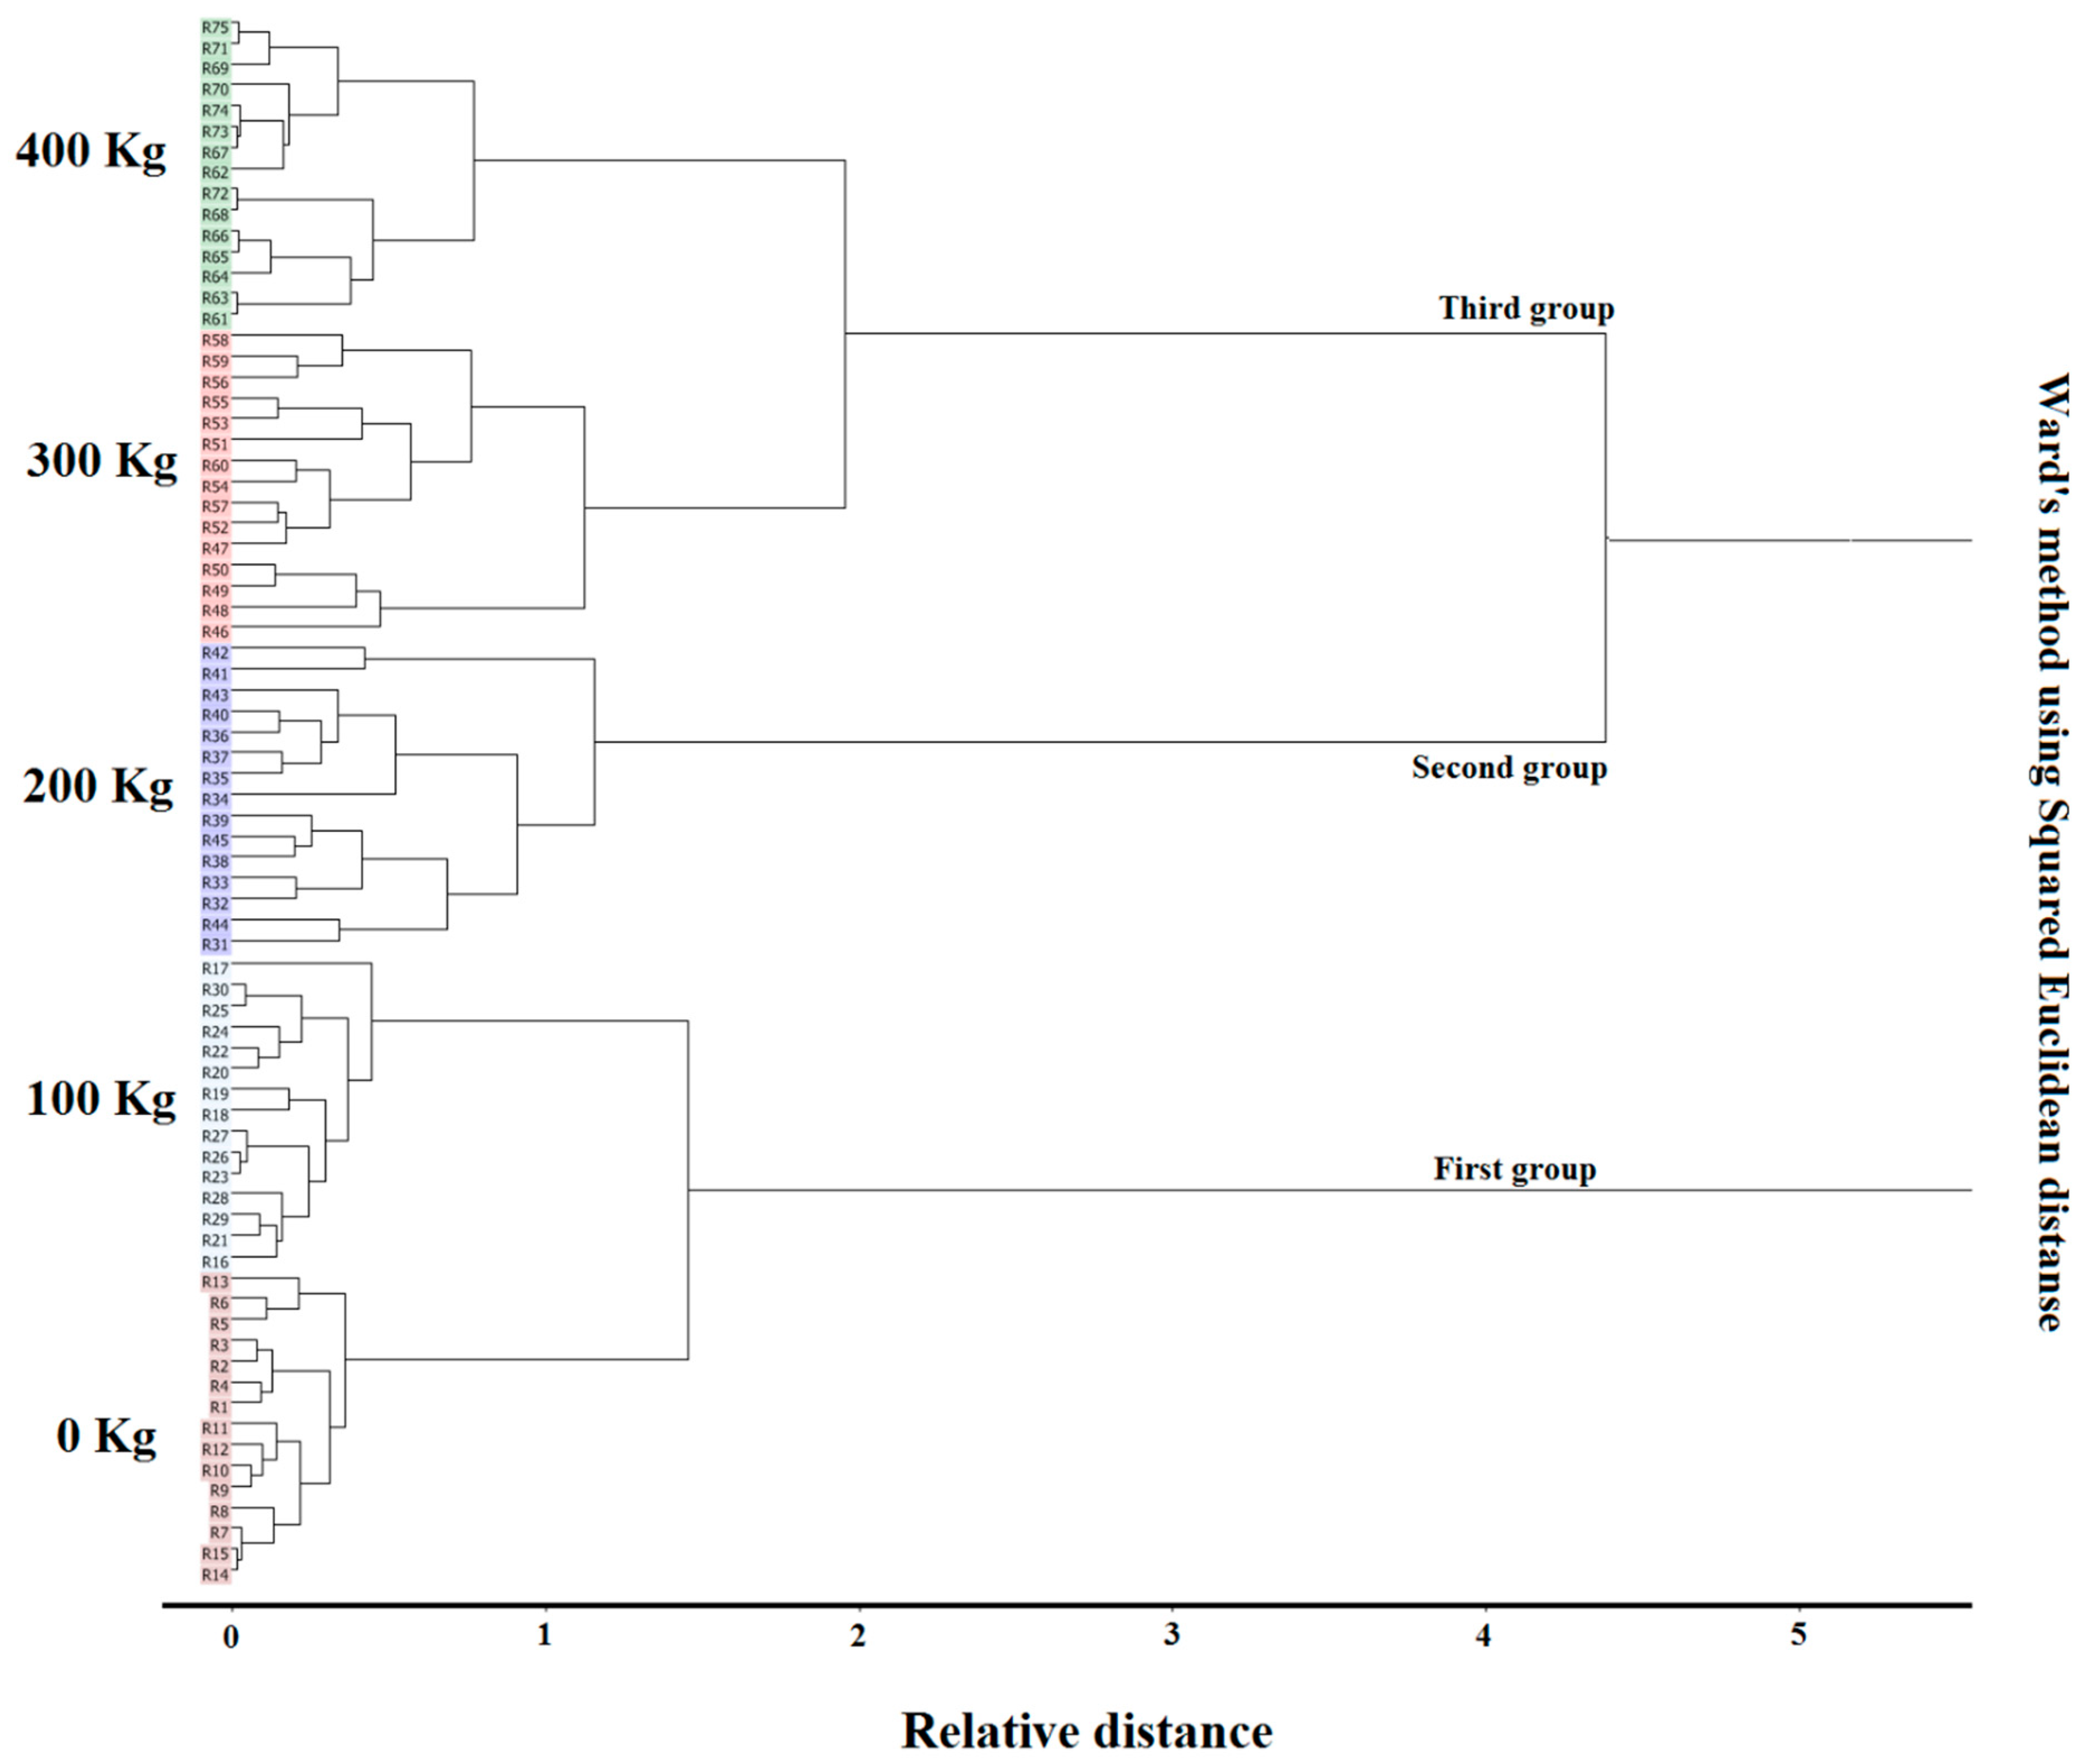
3.2. E-Nose Responses to Cucumber Fruit VOCs

Five different urea fertilizer levels were tested on cucumber plants. Radar plots showed observable differences in sensor response patterns (smellprint signatures) between cucumber fruit samples collected from plants receiving different amounts of urea fertilizer applied during plant growth. After normalization of sensor outputs values, the average sensor output response of the electronic nose sensors were plotted as a radar plot to visualize differences between the response patterns of the sensors to the odor of different levels of urea fertilizer in cucumbers indicated in Figure 3. Radar plot response patterns of each sensor (within the sensor array) indicated levels of sensor response intensities to different urea fertilizer levels that were associated with VOC emissions of headspace volatiles. The relative pattern of sensor responses to different urea levels were very similar, but the sensor intensity responses varied considerably at five different levels of urea fertilizer applied to cucumbers plants.
The sensor intensity responses of individual sensors increased as fertilizer consumption and content increased, indicating that fertilizer consumption has a direct effect on the responses of sensors to differences in VOC emissions from cucumber fruits.
The score plot showed that the total variance of the data was 93% for PC 1 and 2% for PC 2 (Figure 4). The first two principal components accounted for 95% of the total variance of the normalized data. All treatments were correctly separated. Treatments 4 and 5, with higher fertilizer applications, can be seen on the right side of the score plot, while the two control treatments and the second treatment with lower fertilizer applications can be observed on the left side. The e-nose sensor array responded well to differences in VOCs associated with different rates of urea fertilizer applied to soil in treatment plots. The capability of the e-nose to detect different amounts of fertilizer based on VOC emissions provides good evidence of its efficacy for determining quantities of macronutrients in cucumber fruits.
The correlation loading plot showed the relationships between all variables. The loading plot (Figure 5) illustrated the relative role of each principal component. The inner circle represents 50% and the outer circle represents 100% of the total variance of the data. The higher the loading coefficient of a sensor, the greater its role in VOC detection and classification. Therefore, sensors located in the outer circle, such as the TGS2620, TGS813, and TGS822 sensors, play a greater role in data classification.
Ward’s method using cluster analysis (Figure 6) allowed better observation and visualization of clustering between closely spaced sample types. The dendrogram correctly classified five levels of urea fertilizer into three clusters. The dendrograms were composed of the first cluster (control and second treatment), the second cluster (third treatment), and the third cluster (fourth and fifth treatments). From cluster 1 to cluster 3, the clearly defined groups and the percentage of fertilizer use increased.

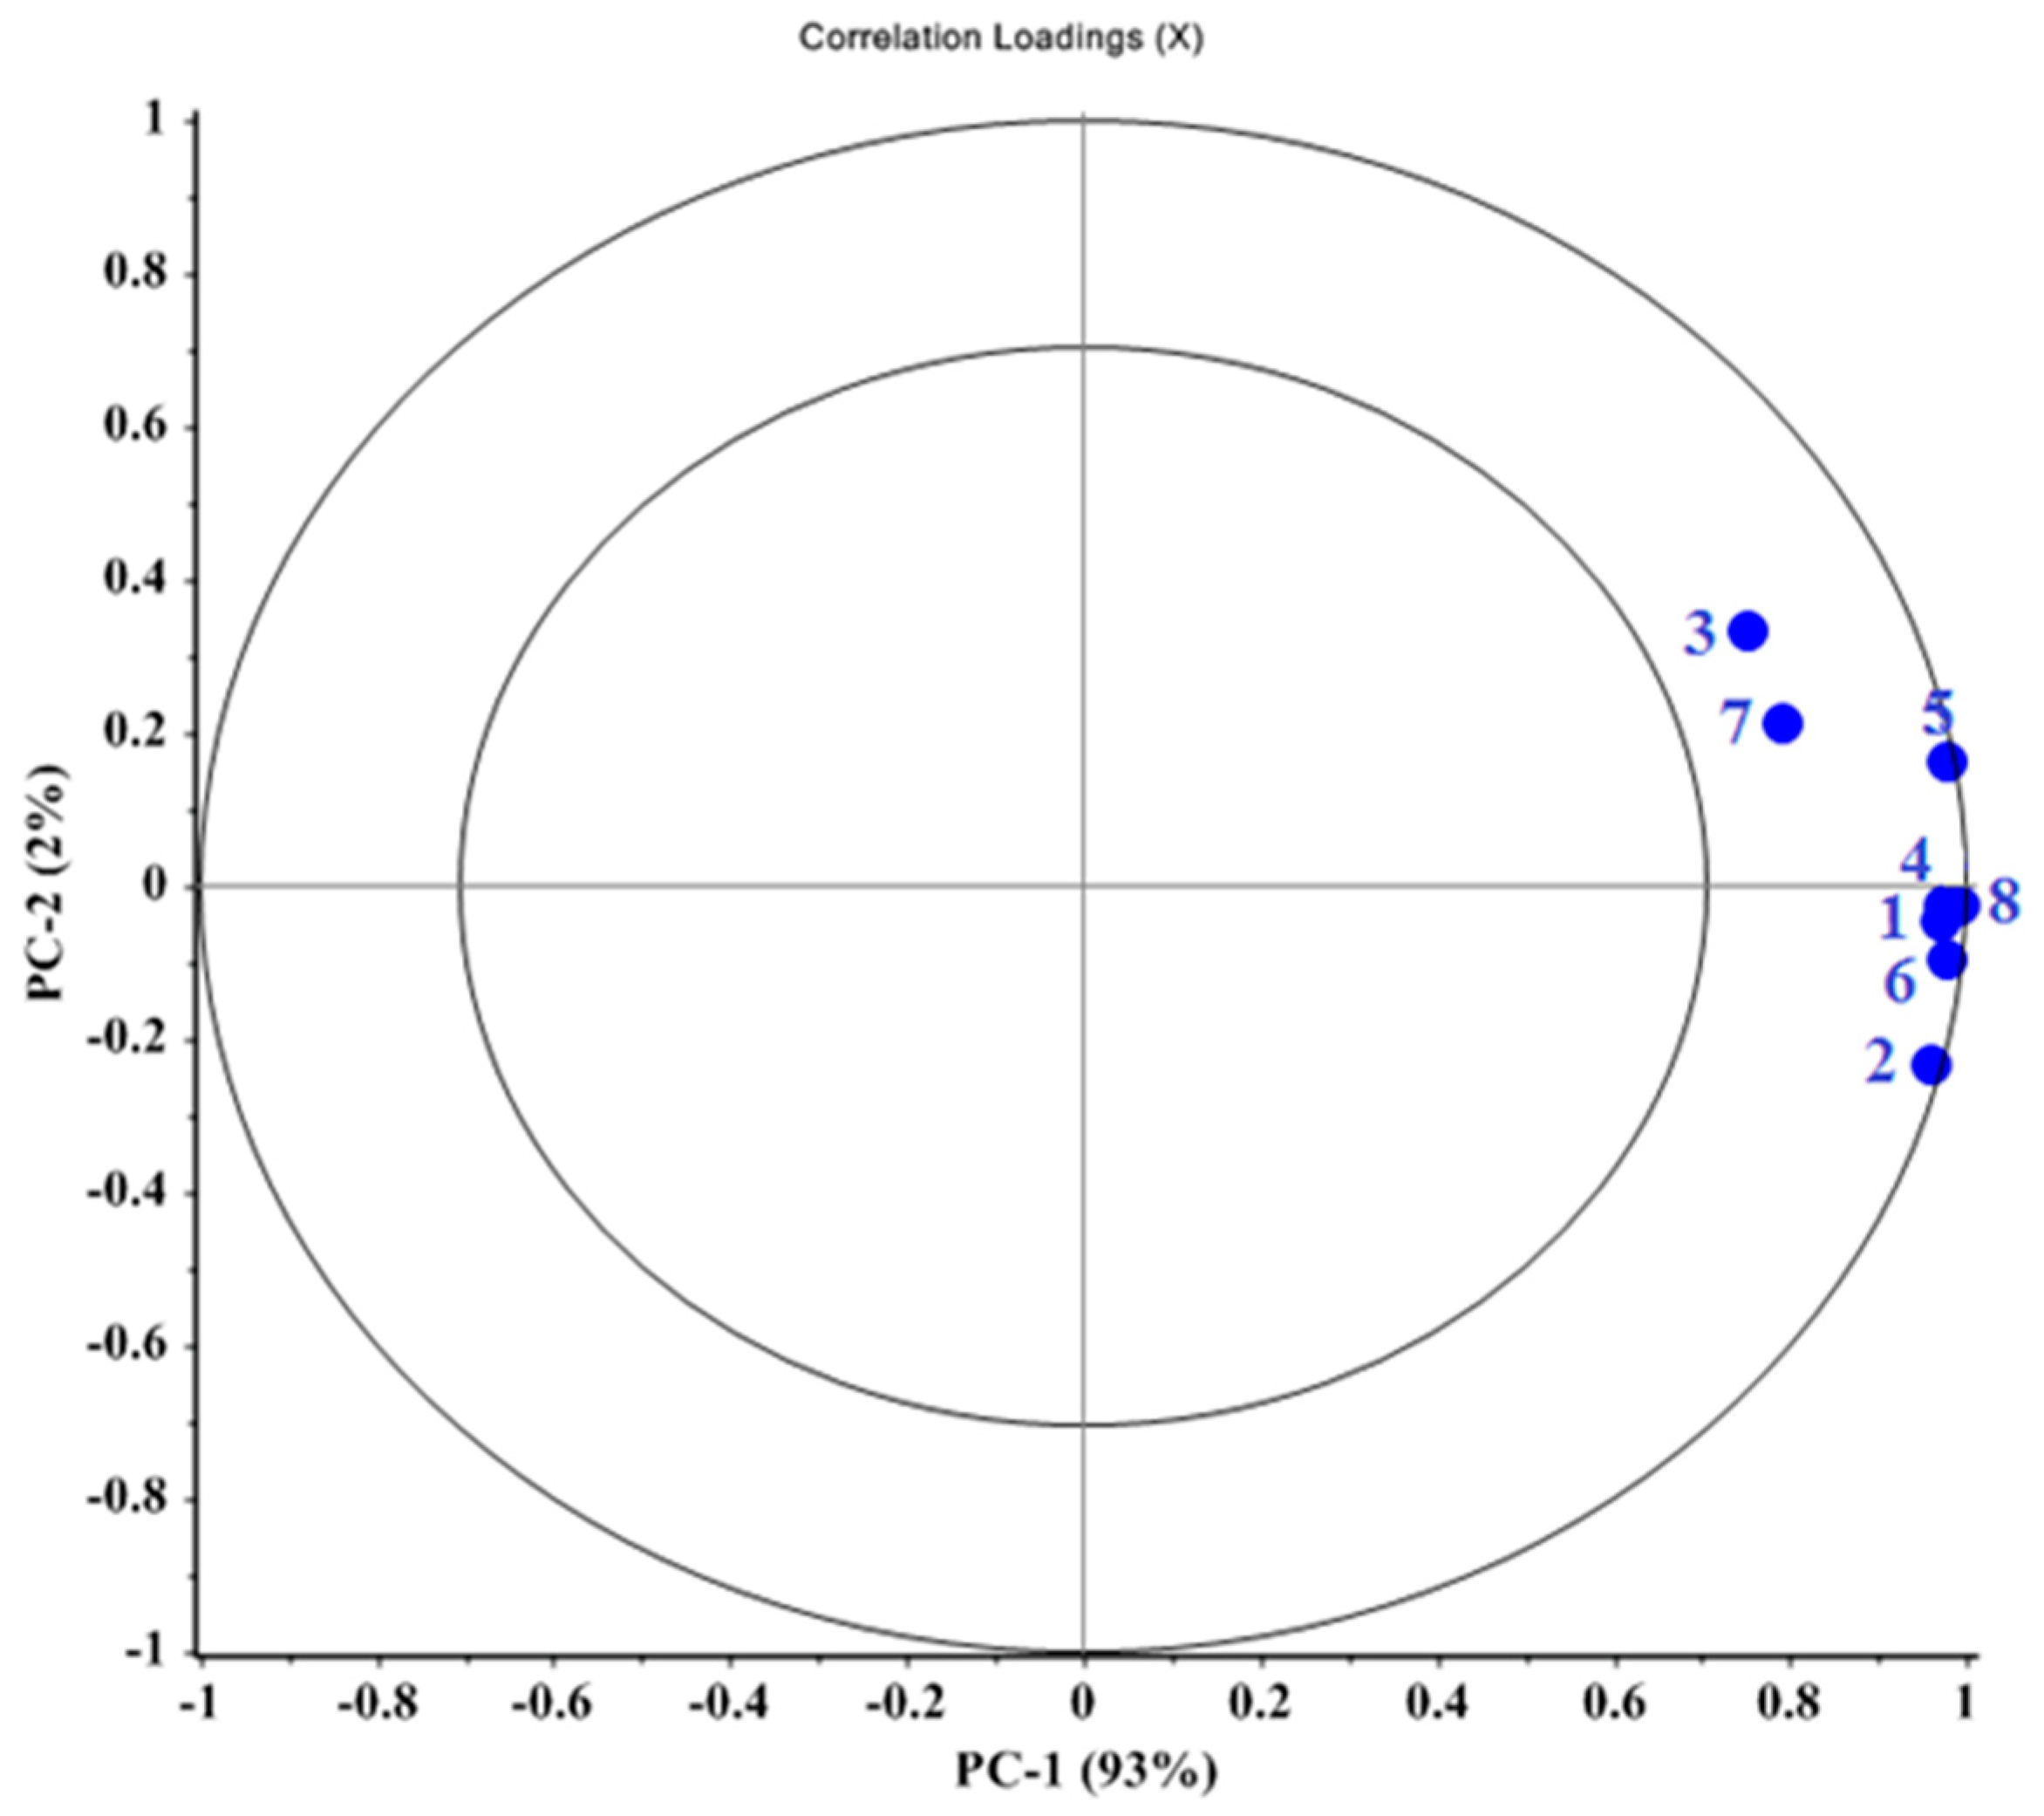
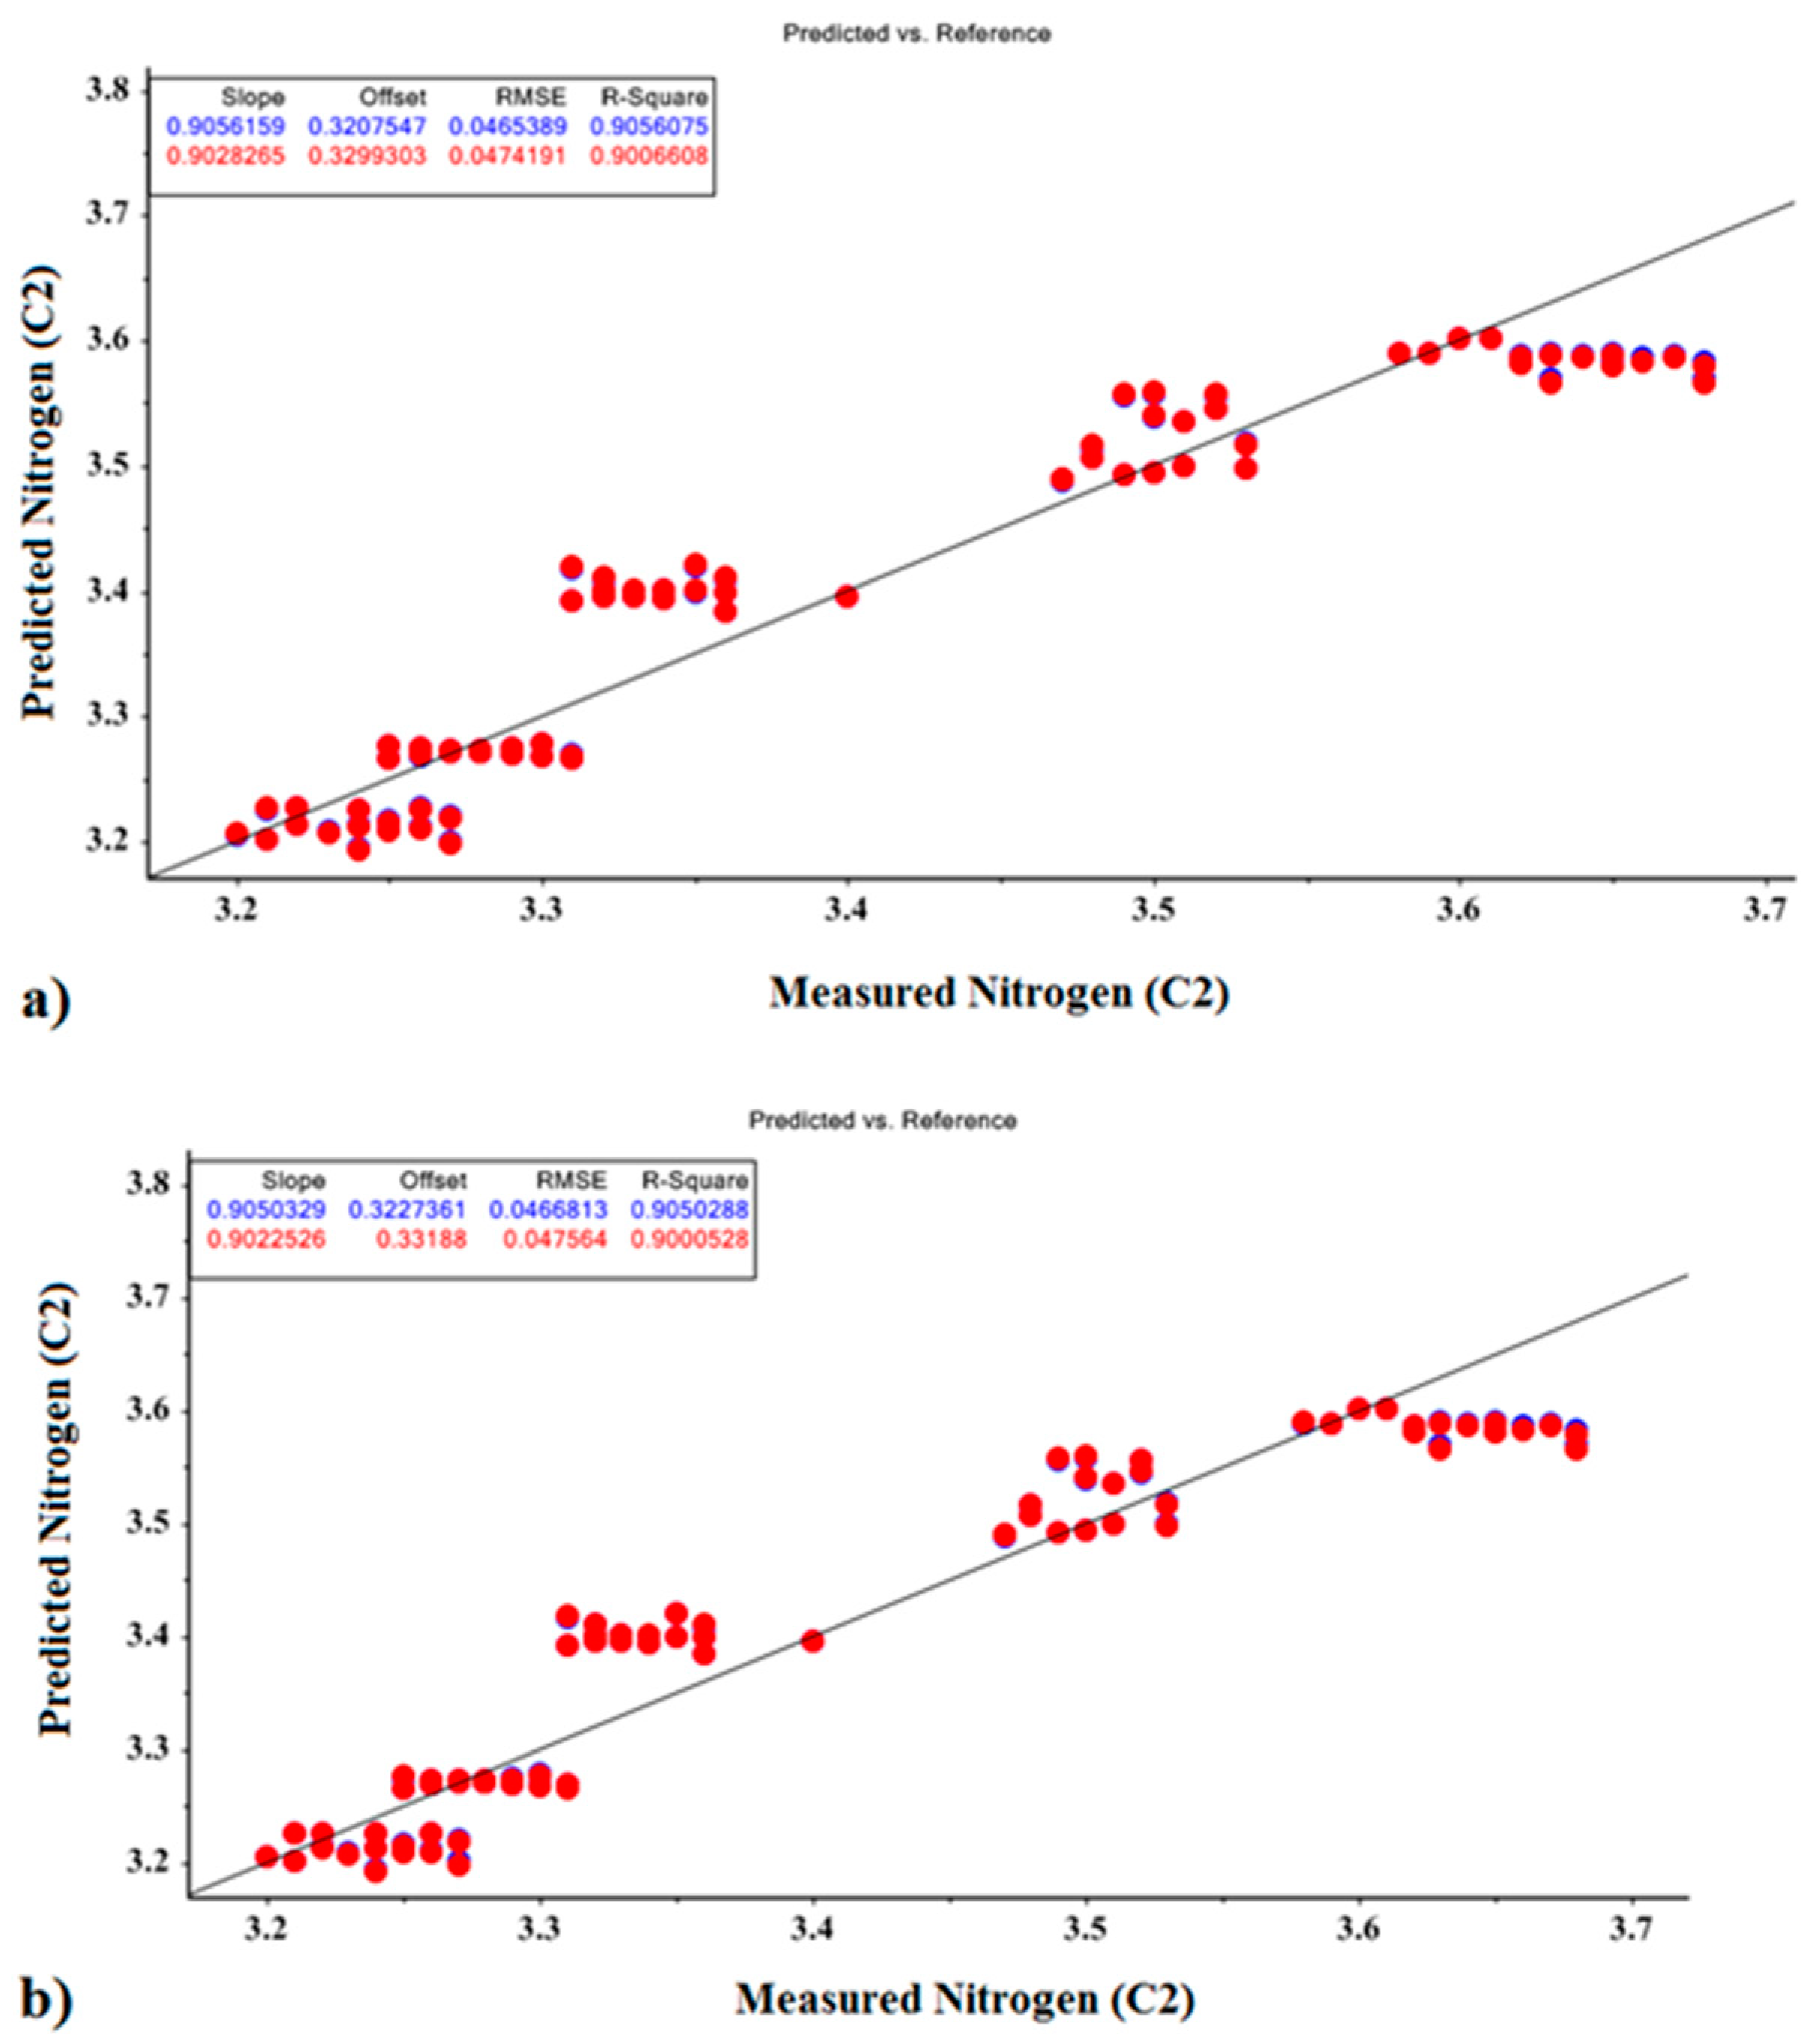
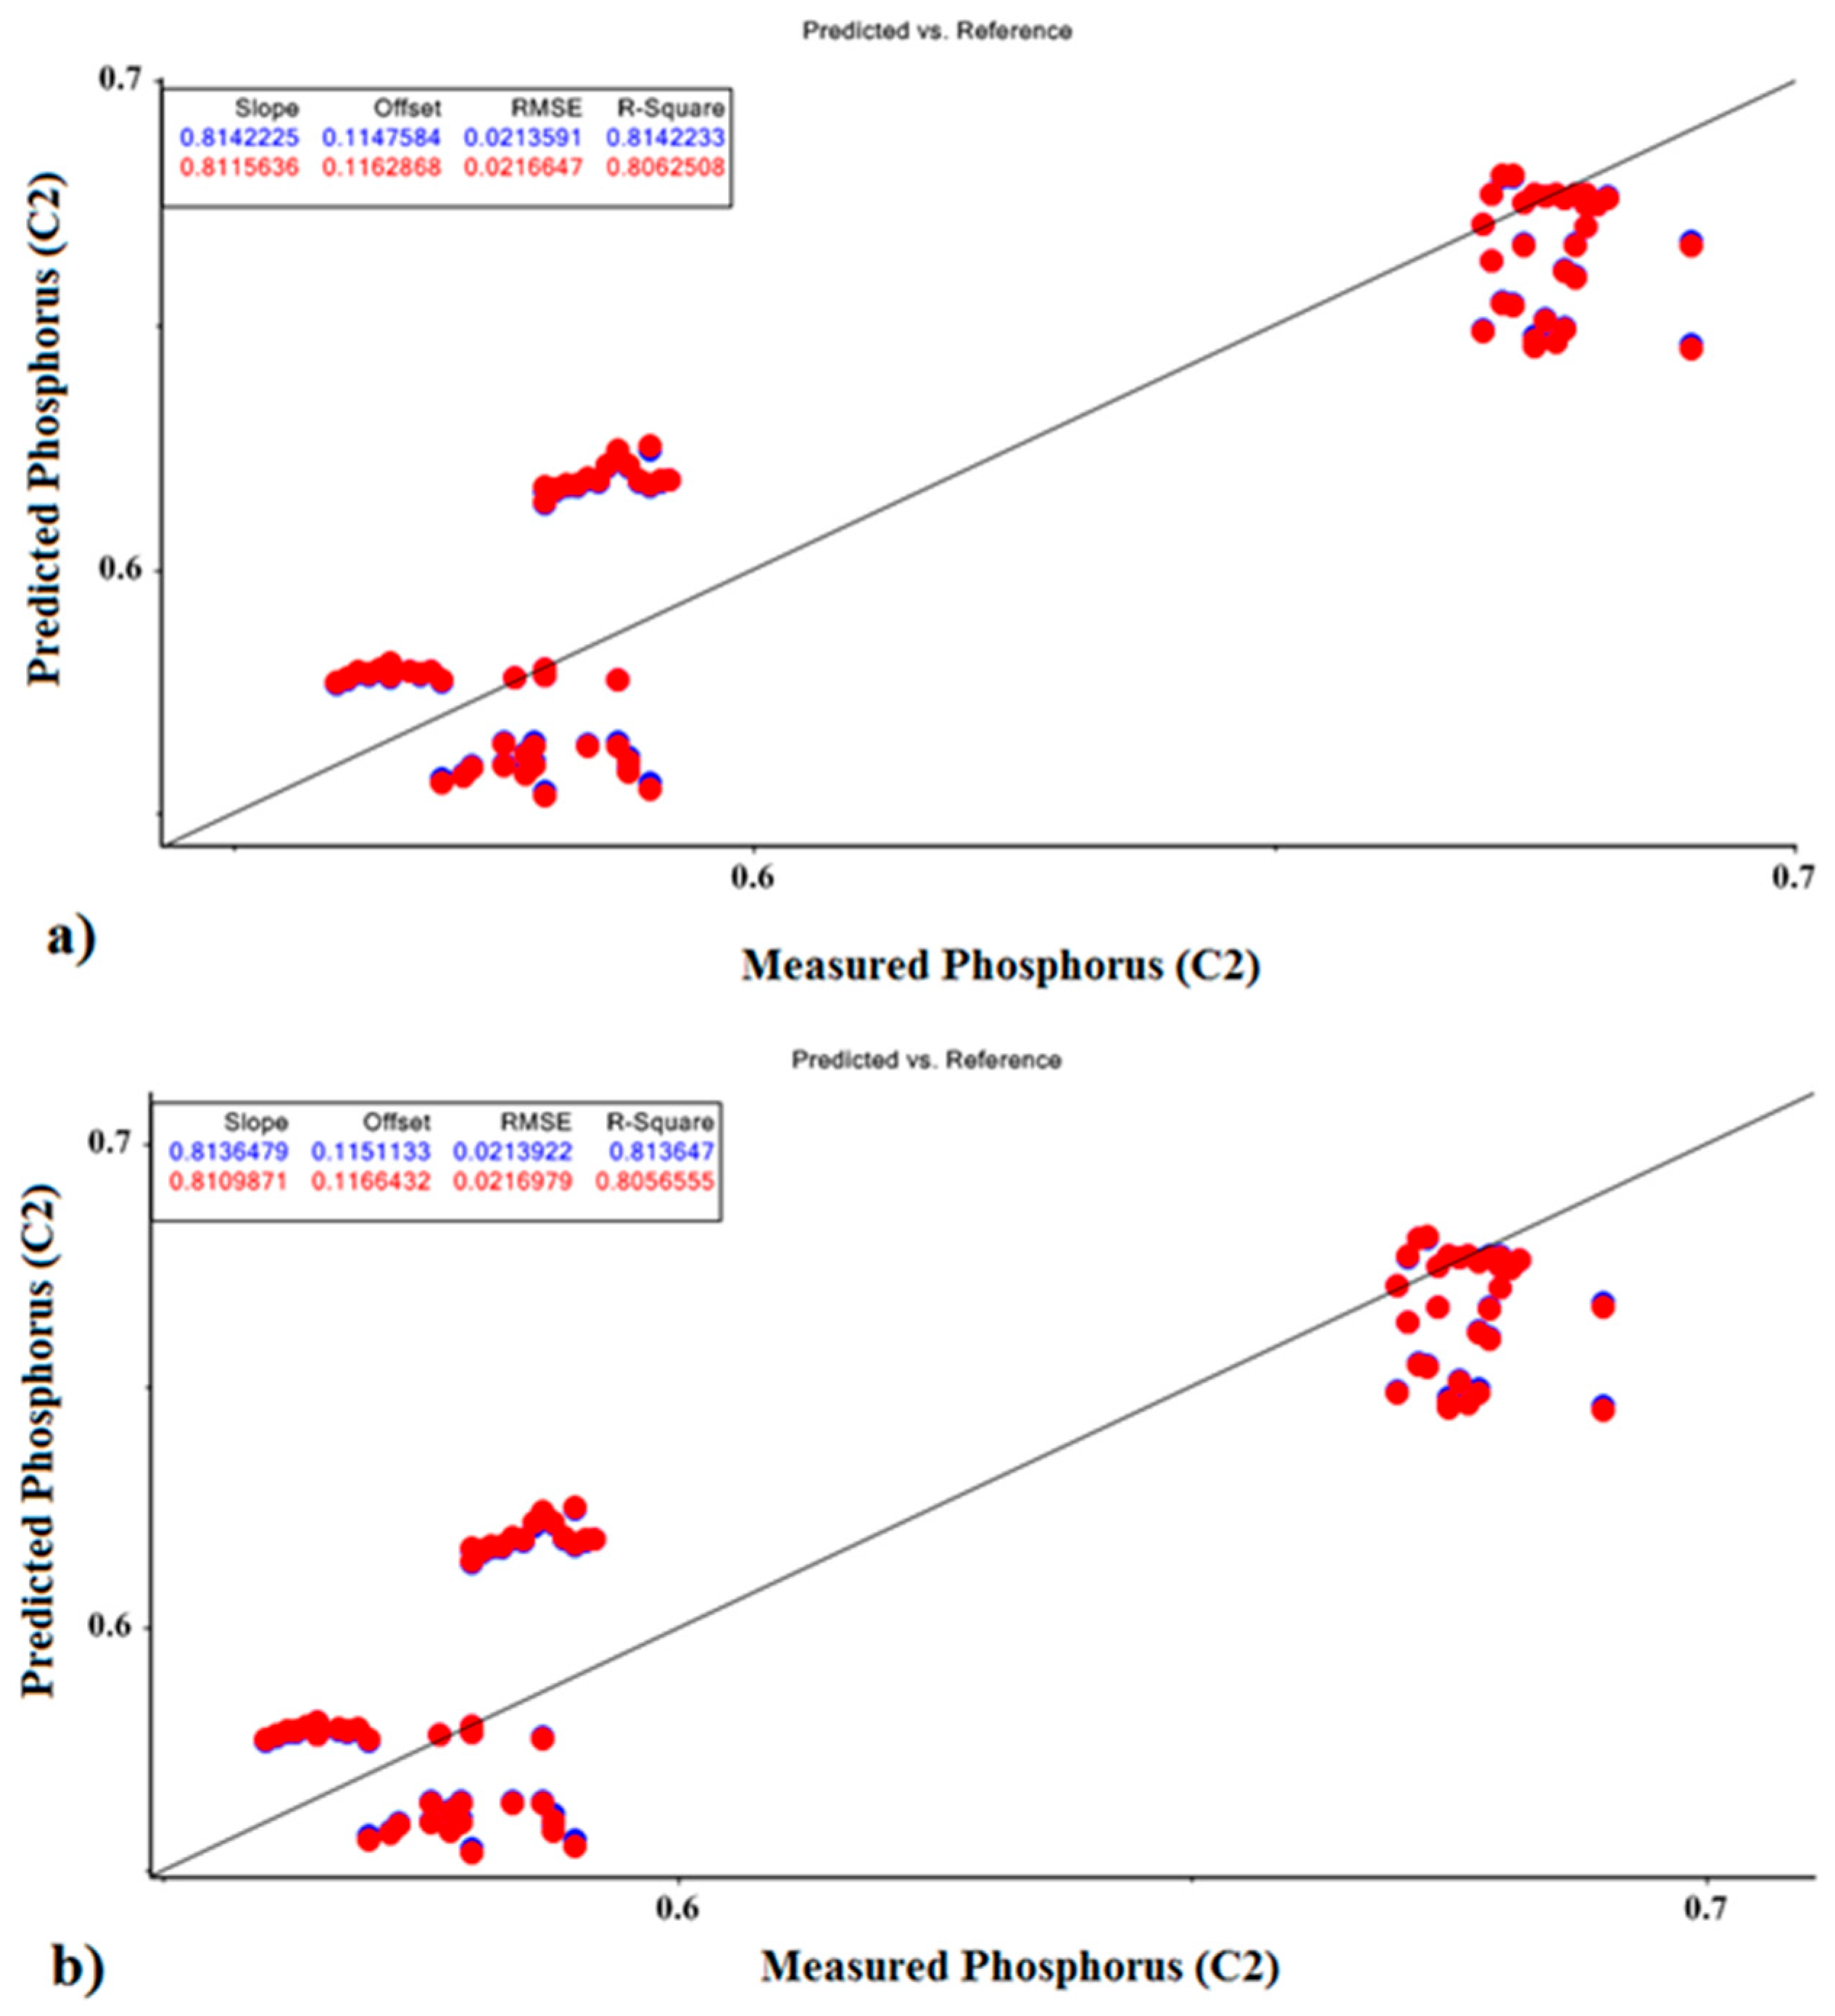
3.3. Prediction of NPK Levels in Fruits Based on PLSR and PCR

PLSR and PCR models described the relationship between electronic nose VOC-emission signals and the amounts of N, P, and K present in cucumber fruits. These models were evaluated for their ability to predict the content of the above macronutrients in terms of correlation of determination (R2) and root mean square error (RMSE). The root mean square error of validation (RMSEval) also was chosen as a numerical tool for selecting the optimal model, based on results shown in Table 3. The results show that the PLSR and PCR models were very close for the determination of N, P, and K contents. In addition, the model was able to predict the amount of nitrogen fertilizer with an R2 around 0.90 and an RMSE of 0.047, indicating its accuracy; however, the values for potassium and phosphorus fertilizers were less accurate.
The PCR and PLSR models were found to be more accurate in predicting N than K or P, based on the results (Table 3). The e-nose predicted the N content determined from the VOC volatile gases in the headspace of cucumber fruit samples with higher accuracy than for K or P content. The coefficient of determination (R2) values of 0.90 and 0.91 (using PCR and PLSR models, respectively) indicated that nitrogen content levels were more highly correlated with changes in VOC emissions than were potassium levels (R2 = 0.83) and phosphorus levels (R2 = 0.81), based on VOC emissions detected by the electronic nose. Nevertheless, the relatively high correlation levels between e-nose VOC emissions and estimated levels of N, P, and K in cucumber fruits was sufficiently high to provide reasonably good estimates of the nutrient contents of these macronutrients in fruit tissues.

3.4. Prediction of NPK Content of Fruits Based on MLR

The PCR and PLSR models were constructed using MLR. As a result of conducting the analysis and identifying the optimal factors, the N, K, and P levels were considered as independent variables (x) and the measured chemical levels were considered as dependent variables (y) and were entered into the MLR model separately. Figure 3 presents the correlation plots, a visual method for evaluating the models fit with experimental data. As shown in Equations (1) and (2), the model obtained by MLR can predict the amount of nitrogen-based on the optimal factors of PCR and PLSR:
Nitrogen (PLSR) = 3.4 + 0.317 X1 + 0.002
Nitrogen (PCR) = 3.4 + 0.316 X1 + 0.002
The MLR prediction models for N fertilizer values, shown for calibration and validation sets, are presented in Figure 7. Based on the MLR model, the correlation coefficients for predicting nitrogen levels based on the optimal PCR and PLSR parameters were 0.905 and 0.905, respectively, and for the calibration sets, the coefficients were 0.900 and 0.900, respectively, for the validation sets.
To build the model, the K content was calculated as presented in Equations (3) and (4), based on the optimal factors of PCR and PLSR:
Potassium (PLSR) = 4.7 + 0.648 X1 + 1.861 X2 + 0.018
Potassium (PCR) = 4.7 + 0.648 X1 − 0.909 X2 − 0.958 X3 − 1.512 X4 + 0.018
The MLR prediction models for K fertilizer values for calibration and validation are shown in Figure 8. Based on the optimal parameters of PCR and PLSR, the MLR model achieved correlation coefficients of 0.847 and 0.849 for calibration and 0.835 and 0.825 for validation, respectively.
The final step for constructing a potassium prediction model with optimal PCR and PLSR factors is presented with the calculations indicated in Equations (5) and (6), respectively:
Phosphorus (PLSR) = 0.62 + 0.098 X1 + 0.0004
Phosphorus (PCR) = 0.62 + 0.098 X1 + 0.0004
The MLR prediction models for P fertilizer values for calibration and validation sets are presented in Figure 9. In this model, the correlation coefficients for predicting phosphorus, based on the optimal parameters of PCR and PLSR, were 0.814 and 0.813, respectively, for the calibration sets and 0.806 and 0.805, respectively, for validation sets.
The N model showed good performance criteria and may be considered a reliable and acceptable predictive mode based on the relatively high coefficients of determination.

4. Discussion

The process and mechanism by which an e-nose device is capable of indirectly detecting differences in specific types and amounts of nutrients that have been taken up by the plant is important for conceptual understanding. When a nutrient such as nitrogen is first taken up by the plant, it is rapidly converted into more stable forms that can be further assimilated and used for specific plant physiological processes. None of these stable forms of nitrogen can be directly detected by an electronic nose device which only detects VOC emissions. However, the nutrients are utilized at varying levels, based on availability due to relative amounts of nutrient uptake by the plant from the soil, which directly affect the vegetative growth and metabolic processes of the plant within the leaves and fruits. As a result of biochemical effects of different nutrient levels on host metabolic pathways, the VOC emissions released from various plant parts accordingly change to reflect these differences in nutrient level effects on plant pathways that generate VOC emissions. An electronic-nose device is capable of directly detecting changes in plant VOC emissions resulting from effects of different nutrient levels on host physiology. In this way, a plant receiving no additional exogenous nutrients may be distinguished from a plant that has received additional nutrients by differences in their VOC emissions which reflects internal differences in plant metabolic pathways that give rise to uniquely different types and amounts of plant volatiles present in plant VOC emissions.
The development of PCR and PLSR regression models were used to determine the effectiveness and error levels of each statistical model for indirectly estimating nutrient levels in fruits. These values were further used to describe the regression models using the MLR method. We found that the PCR and PLSR methods could accurately predict the estimated nitrogen content of cucumber fruits, following different graduated soil application rates, with an accuracy of about 90%, based on an optimal factor (X1) and calibration error and a prediction of 0.046 and 0.047, respectively. For the measurement of potassium with the PCR method using four optimal factors (X1, X2, X3, and X4) and the PLSR method with two optimal factors (X1 and X2), we obtained calibration and prediction errors equal to 0.013 and 0.0141, respectively, and an accuracy of about 83%. For the prediction of phosphorus content using PCR and PLSR methods with one optimal factor (X1) and calibration and prediction error, the predictive value was 0.021 and the accuracy was about 80.0%. We also determined that nitrogen could be estimated with high accuracy, using a combination of statistical prediction models and electronic-nose data based on the detection of cucumber fruit VOCs. The results suggest that the NPK content of cucumber fruit may be accurately estimated indirectly using MOS e-nose data based on VOCs emissions using appropriate regression models. The e-nose prediction of N content from the analysis of cucumber fruit VOC gases in the sample headspace was at a higher accuracy than for K or P. It was concluded that changes in cucumber fruit VOC emissions associated with nitrogen levels in cucumber fruits were better correlated with e-nose smellprint signatures than were fruit VOC emissions associated with changes in soil K or P levels detected by the electronic nose.
Abu-Khalaf [48] used PLS models to identify olive oil quality parameters from chemical data derived from an e-nose. The e-nose showed good performance in modelling the acidity parameter. Moreover, the correlation coefficients for a PLS model for acidity were 0.87 for calibration and 0.88 for validation sets. Zhang et al. [49] reported similar results using the PLSR method and an electronic nose for grapes, with an R2 of 0.93. Zhou and Zeng [44] used partial least squares spectroscopy and linear discriminant analysis (PLS-LDA) with R2 = 0.96 to obtain comparable results. Zhou et al. [50] used partial least squares spectroscopy in combination with linear discriminant analysis (PLS-LDA) to obtain comparable results (R2 = 0.96), which agreed with the results presented here. Wei et al. [51] used an e-nose to analyze the quality changes in peanuts without skins and peanut kernels during storage. According to PLSR statistical analysis, the characteristics of shelled peanuts and peanut kernels were strongly correlated with acidity and peroxide content, respectively.
Khorramifar et al. [52] applied three statistical methods, including PLSR, PCR, and MLR, to create separate regression models for sugars and carbohydrates. They reported that the accuracy of predicting carbohydrate levels in all cultivars was somewhat better than the accuracy of predicting sugar levels. Zaki Dizaji et al. [53] used an electronic nose technique with PLS, PCR, and MLR models to predict the quality of sugarcane syrup based on the purity and the percentage of refined sugar. They reported that the accuracy of the PLS method for this purpose was 77 and 71%, respectively, and that the accuracy of the PCR method was 72% and 68%, respectively. Furthermore, the accuracy of the PLS method was 82% and 74%, respectively. Zhou et al. [54] predicted the amount of linalool content in volatiles of tea olive (Osmanthus fragrans) using an electronic nose. The R2 for PCR and MLR methods was reported as 0.736 and 0.895, respectively, and the RMSE for each was reported as 3.98 and 10.10, respectively.
Other studies have examined the correlation between e-nose analysis signatures, associated with VOC emissions from various parts of vegetable plant species, and the occurrence of specific chemical components that could be useful information for various applications. These studies have in common the use of VOC-based e-nose data (in combination with specific statistical models) to derive useful chemical information about plant-based products and fresh produce sold in commercial markets. Rasakh et al. [55] used a MOS electronic nose to classify and discriminate between sweet peppers vs. hot peppers based on differences in VOC emissions detected by the e-nose instrument. They predicted the amount of capsaicin in two types of sweet pepper and hot pepper using MLR, PCR and PLSR statistical models with high accuracy. Biondi et al. [56] applied an electronic nose device to diagnose brown rot and ring rot diseases in potato. Other research has focused on the use of PLSR, PCR, and MLR statistical modelling methods in combination with e-nose devices to evaluate chemical constituents of plant products, including the sugar content of potatoes [57], chemical classification of black heart in potatoes [50], prediction of rapeseed quality and purity [58], shelf life of wheat bread [59], qualitative analysis of plant-derived edible oil oxidation [60], effects of the roasting process on pyridine content in coffee beans [61], effects of flour fruit-fiber supplementation on the VOC profile of bread [62], and prediction of post-harvest storage time and indicators of spoilage in peanuts [63].
Finding new ways to improve e-nose performance through the selection of targeted and more appropriate sensors and sensor arrays, pattern-recognition algorithms, and data analysis methods significantly widens the range of gas-sensing capabilities applicable to agriculture. Developing electronic noses for narrower, more specific industrial applications, such as in agriculture technology, allows e-nose manufacturers to build smaller and cheaper portable instruments that provide greater utility, efficiency, and effectiveness for more specialized agricultural applications [15]. Improving the VOC-detection efficiency for specialized (customized) e-noses is possible because of the ability to reduce or minimize the number of sensors required for targeting detection of specific VOCs (associated with certain sample types), and thereby reducing instrument costs, allowing for miniaturization. E-nose devices provide more rapid analyses that are less expensive than complex analytical tools, are easier and cheaper to operate, and have greater potential for portability and customization for unskilled laborers [64]. E-nose devices also may be more effectively used in combination with other technologies. For example, mobile ground robots and flying drones may now be used to transport e-nose devices to survey farmlands, along with global positioning system (GPS) data, for collecting necessary information to improve crop yields, such as recording ambient conditions, soil fertility, and presence of disease used for managing fertilization, watering, and pests [65].

5. Conclusions

A scientific approach to effectively apply fertilizers to soils at appropriate rates is essential to achieve sustainable agriculture and simultaneously promote food safety through optimal crop fertilization. We present data in this study to demonstrate that a new e-nose method for the indirect estimation of fertilizer nutrient content of cucumber fruits was possible by analyzing changes in plant VOC emissions (resulting from nutrient-induced changes in host physiology) using appropriate statistical methods to effectively correlate e-nose signatures (indicating differences in VOC profiles) to amounts of fertilizers applied to soils. The results show that e-nose data derived from analysis of VOC emissions from cucumber fruits may be used to indirectly estimate NPK chemical fertilizer residue levels in cucumber fruits. These methods could potentially be used to indirectly detect other nutrient and chemical elements in agricultural products. Statistical modeling methods, including MLR, PLSR, and PCR, were used to predict levels of N, P, and K residues in cucumber fruits. We conclude that the experimental e-nose used in this study is a suitable tool for indirectly predicting the amount of these and possibly other macronutrient parameters in cucumber fruits (based on VOC emission data). The current paper reports on the novel application of e-nose technologies for indirect detection of chemical fertilizer residues in agricultural produce. To our knowledge, this approach has not been reported previously to predict or estimate quantities of residual fertilizer nutrient levels present in agricultural fruit crops, except for our first paper reporting initial results using these methods [30]. This approach could potentially be utilized to develop a rapid method to detect and prevent excessive fertilizer applications to agricultural soils.

Author Contributions

The contributions of collaborating scientists to this research article, as individual authors, are specified as follows. The contribution categories of individual authors include conceptualization, E.M.-G. and H.K.; methodology, E.M.-G. and H.K.; software, H.K.; validation, E.M.-G. and H.K.; formal analysis, H.K.; investigation, E.M.-G.; resources, E.M.-G.; data curation, H.K.; writing—original draft preparation, H.K. and S.T.; writing—review and editing, A.D.W., H.K. and S.T.; visualization, A.D.W. and H.K.; supervision, E.M.-G. and H.R.; project administration, E.M.-G. and H.R.; funding acquisition, E.M.-G. All authors have read and agreed to the published version of the manuscript.

Funding

This research received no external funding.

Acknowledgments

The authors recognize the financial, assistance, and infrastructure support provided by Razi University which is duly appreciated.

Conflicts of Interest

The authors declare no conflict of interest.

References

  1. Cao, Q.; Li, L.; Yang, Z.; Wang, Y.; Li, J.; Chen, W.; Wang, J.; Meng, Z. Transcriptome analysis of genes in response to magnesium nitrate stress on cucumber leaf. Sci. Hortic. 2021, 288, 110391. [Google Scholar] [CrossRef]
  2. Zhang, K.; Wang, X.; Zhu, W.; Qin, X.; Xu, J.; Cheng, C.; Lou, Q.; Li, J.; Chen, J. Complete resistance to powdery mildew and partial resistance to downy mildew in a Cucumis hystrix introgression line of cucumber were controlled by a co-localized locus. Theor. Appl. Genet. 2018, 131, 2229–2243. [Google Scholar] [CrossRef] [PubMed]
  3. Mohammadi, A.; Hashemi, M.; Hosseini, S.M. Postharvest treatment of nanochitosan-based coating loaded with Zataria multiflora essential oil improves antioxidant activity and extends shelf-life of cucumber. Innov. Food Sci. Emerg. Technol. 2016, 33, 580–588. [Google Scholar] [CrossRef]
  4. Gizaw, Z. Public health risks related to food safety issues in the food market: A systematic literature review. Environ. Health Prev. Med. 2019, 24, 68. [Google Scholar] [CrossRef] [Green Version]
  5. Vessey, J.K. Plant growth promoting rhizobacteria as biofertilizers. Plant. Soil 2003, 255, 571–586. [Google Scholar] [CrossRef]
  6. Philippe, V.; Neveen, A.; Marwa, A.; Ahmad Basel, A.-Y. Occurrence of pesticide residues in fruits and vegetables for the Eastern Mediterranean Region and potential impact on public health. Food Control 2021, 119, 107457. [Google Scholar] [CrossRef]
  7. Sun, Y.; Hu, R.; Zhang, C. Does the adoption of complex fertilizers contribute to fertilizer overuse? Evidence from rice production in China. J. Clean. Prod. 2019, 219, 677–685. [Google Scholar] [CrossRef]
  8. Sutton, M.A.; Bleeker, A.; Howard, C.; Erisman, J.W.; Abrol, Y.P.; Bekunda, M.; Datta, A.; Davidson, E.; Vries, W.; Oenema, O.; et al. Our nutrient world. In The Challenge to Produce More Food and Energy with Less Pollution; Centre for Ecology & Hydrology on behalf of the Global Partnership on Nutrient Management (GPNM) and the International Nitrogen Initiative (INI): Edinburgh, UK, 2013; ISBN 978-1-906698-40-9. [Google Scholar]
  9. Al-mansour, B.; Kalaivanan, D.; Suryanarayana, M.A.; Umesha, K.; Nair, A.K. Influence of organic and inorganic fertilizers on yield and quality of sweet basil (Ocimum basilicum L.). J. Spices Aromat. Crops 2018, 27, 38–44. [Google Scholar] [CrossRef] [Green Version]
  10. Olarewaju, O.A.; Alashi, A.M.; Taiwo, K.A.; Oyedele, D.; Adebooye, O.C.; Aluko, R.E. Influence of nitrogen fertilizer micro-dosing on phenolic content, antioxidant, and anticholinesterase properties of aqueous extracts of three tropical leafy vegetables. J. Food Biochem. 2018, 42, e12566. [Google Scholar] [CrossRef]
  11. Sabzi, S.; Pourdarbani, R.; Rohban, M.H.; García-Mateos, G.; Arribas, J.I. Estimation of nitrogen content in cucumber plant (Cucumis sativus L.) leaves using hyperspectral imaging data with neural network and partial least squares regressions. Chemometr. Intell. Lab. Syst. 2021, 217, 104404. [Google Scholar] [CrossRef]
  12. Bryan, N.S.; van Grinsven, H. Chapter Three—The role of nitrate in human health. Adv. Agron. 2013, 119, 153–182. [Google Scholar] [CrossRef]
  13. Alori, E.T.; Glick, B.R.; Babalola, O.O. Microbial phosphorus solubilization and its potential for use in sustainable agriculture. Front. Microbiol. 2017, 8, 971. [Google Scholar] [CrossRef] [PubMed] [Green Version]
  14. Liu, Y.-M.; Liu, D.-Y.; Zhang, W.; Chen, X.-X.; Zhao, Q.-Y.; Chen, X.-P.; Zou, C.-Q. Health risk assessment of heavy metals (Zn, Cu, Cd, Pb, As and Cr) in wheat grain receiving repeated Zn fertilizers. Environ. Pollut. 2020, 257, 113581. [Google Scholar] [CrossRef] [PubMed]
  15. Wilson, A.D. Diverse applications of electronic-nose technologies in agriculture and forestry. Sensors 2013, 13, 2295–2338. [Google Scholar] [CrossRef] [PubMed] [Green Version]
  16. Baietto, M.; Wilson, A.D. Electronic-nose applications for fruit identification, ripeness, and quality grading. Sensors 2015, 15, 899–931. [Google Scholar] [CrossRef]
  17. Rasekh, M.; Karami, H.; Wilson, A.D.; Gancarz, M. Classification and identification of essential oils from herbs and fruits based on a MOS electronic-nose technology. Chemosensors 2021, 9, 142. [Google Scholar] [CrossRef]
  18. Bonah, E.; Huang, X.; Aheto, J.H.; Osae, R. Application of electronic nose as a non-invasive technique for odor fingerprinting and detection of bacterial foodborne pathogens: A review. J. Food Sci. Technol. 2020, 57, 1977–1990. [Google Scholar] [CrossRef]
  19. Wilson, A.D. Review of electronic-nose technologies and algorithms to detect hazardous chemicals in the environment. Proc. Technol. 2012, 1, 453–463. [Google Scholar] [CrossRef] [Green Version]
  20. Binson, V.; Subramoniam, M.; Mathew, L. Discrimination of COPD and lung cancer from controls through breath analysis using a self-developed e-nose. J. Breath Res. 2021, 15, 046003. [Google Scholar] [CrossRef]
  21. Rasekh, M.; Karami, H.; Wilson, A.D.; Gancarz, M. Performance analysis of MAU-9 electronic-nose MOS sensor array components and ANN classification methods for discrimination of herb and fruit essential oils. Chemosensors 2021, 9, 243. [Google Scholar] [CrossRef]
  22. Rasekh, M.; Karami, H. E-nose coupled with an artificial neural network to detection of fraud in pure and industrial fruit juices. Int. J. Food Prop. 2021, 24, 592–602. [Google Scholar] [CrossRef]
  23. Jha, S.K.; Yadava, R.; Hayashi, K.; Patel, N. Recognition and sensing of organic compounds using analytical methods, chemical sensors, and pattern recognition approaches. Chemometr. Intell. Lab. Syst. 2019, 185, 18–31. [Google Scholar] [CrossRef]
  24. Zheng, C.; Wang, Z.; Zhang, J.; Wang, J.; Zhong, J.; Wang, Y. Discrimination of wood-boring beetles infested Platycladus orientalis plants by using gas chromatography-ion mobility spectrometry. Comput. Electron. Agric. 2021, 180, 105896. [Google Scholar] [CrossRef]
  25. Wang, Z.; Chen, W.; Gu, S.; Wang, Y.; Wang, J. Evaluation of trunk borer infestation duration using MOS E-nose combined with different feature extraction methods and GS-SVM. Comput. Electron. Agric. 2020, 170, 105293. [Google Scholar] [CrossRef]
  26. Junaedi, E.C.; Lestari, K.; Muchtaridi, M. Infrared spectroscopy technique for quantification of compounds in plant-based medicine and supplement. J. Adv. Pharm. Technol. Res. 2021, 12, 1. [Google Scholar] [CrossRef]
  27. Seesaard, T.; Goel, N.; Kumar, M.; Wongchoosuk, C. Advances in gas sensors and electronic nose technologies for agricultural cycle applications. Comput. Electron. Agric. 2022, 193, 106673. [Google Scholar] [CrossRef]
  28. Khorramifar, A.; Karami, H.; Wilson, A.D.; Sayyah, A.H.A.; Shuba, A.; Lozano, J. Grape cultivar identification and classification by machine olfaction analysis of leaf volatiles. Chemosensors 2022, 10, 125. [Google Scholar] [CrossRef]
  29. Khorramifar, A.; Rasekh, M.; Karami, H.; Malaga-Toboła, U.; Gancarz, M. A machine learning method for classification and identification of potato cultivars based on the reaction of MOS type sensor-array. Sensors 2021, 21, 5836. [Google Scholar] [CrossRef]
  30. Tatli, S.; Mirzaee-Ghaleh, E.; Rabbani, H.; Karami, H.; Wilson, A.D. Rapid detection of urea fertilizer effects on VOC emissions from cucumber fruits using a MOS e-nose sensor array. Agronomy 2022, 12, 35. [Google Scholar] [CrossRef]
  31. Beljkaš, B.; Matić, J.; Milovanović, I.; Jovanov, P.; Mišan, A.; Šarić, L. Rapid method for determination of protein content in cereals and oilseeds: Validation, measurement uncertainty and comparison with the Kjeldahl method. Accredit. Qual. Assur. 2010, 15, 555–561. [Google Scholar] [CrossRef]
  32. Adenipekun, C.O.; Oyetunji, O.J. Nutritional values of.f some tropical vegetables. J. Appl. Biosci. 2010, 35, 2294–2300. [Google Scholar]
  33. Kumar, N.; Bansal, A.; Sarma, G.; Rawal, R.K. Chemometrics tools used in analytical chemistry: An overview. Talanta 2014, 123, 186–199. [Google Scholar] [CrossRef] [PubMed]
  34. Geladi, P. Chemometrics in spectroscopy. Part 1. Classical chemometrics. Spectrochim. Acta Part B At. Spectrosc. 2003, 58, 767–782. [Google Scholar] [CrossRef]
  35. Malley, D.F.; Yesmin, L.; Wray, D.; Edwards, S. Application of near-infrared spectroscopy in analysis of soil mineral nutrients. Commun. Soil Sci. Plant Anal. 1999, 30, 999–1012. [Google Scholar] [CrossRef]
  36. Choe, E.; Kim, K.-W.; Bang, S.; Yoon, I.-H.; Lee, K.-Y. Qualitative analysis and mapping of heavy metals in an abandoned Au–Ag mine area using NIR spectroscopy. Environ. Geol. 2009, 58, 477–482. [Google Scholar] [CrossRef]
  37. Chang, C.-W.; Laird, D.; Mausbach, M.J.; Hurburgh, C.R., Jr. Near-infrared reflectance spectroscopy–principal components regression analyses of soil properties. Soil Sci. Soc. Am. J. 2001, 65, 480. [Google Scholar] [CrossRef] [Green Version]
  38. Freedman, D.A. Statistical Models: Theory and Practice; Cambridge University Press: Cambridge, UK, 2009; ISBN 1139477315. [Google Scholar]
  39. Abdi, H.; Williams, L.J. Principal component analysis. Wiley Interdiscip. Rev. Comput. Stat. 2010, 2, 433–459. [Google Scholar] [CrossRef]
  40. He, H.-J.; Wu, D.; Sun, D.-W. Non-destructive and rapid analysis of moisture distribution in farmed Atlantic salmon (Salmo salar) fillets using visible and near-infrared hyperspectral imaging. Innov. Food Sci. Emerg. Technol. 2013, 18, 237–245. [Google Scholar] [CrossRef]
  41. Rossel, R.A.V. ParLeS: Software for chemometric analysis of spectroscopic data. Chemometr. Intell. Lab. Syst. 2008, 90, 72–83. [Google Scholar] [CrossRef]
  42. Rodriguez-Nogales, J. Approach to the quantification of milk mixtures by partial least-squares, principal component and multiple linear regression techniques. Food Chem. 2006, 98, 782–789. [Google Scholar] [CrossRef]
  43. Bautista, R.; Aberasturi, F.; Jimenez, A.; Jimenez, F. Simultaneous spectrophotometric determination of drugs in pharmaceutical preparations using multiple linear regression and partial least-squares regression, calibration and prediction methods. Talanta 1996, 43, 2107–2115. [Google Scholar] [CrossRef]
  44. Mahesh, S.; Jayas, D.; Paliwal, J.; White, N. Comparison of partial least squares regression (PLSR) and principal components regression (PCR) methods for protein and hardness predictions using the near-infrared (NIR) hyperspectral images of bulk samples of Canadian wheat. Food Bioproc. Technol. 2015, 8, 31–40. [Google Scholar] [CrossRef]
  45. Zhou, W.; Guo, P.; Chen, J.; Lei, Y. A rapid analytical method for the quantitative determination of the sugar in acarbose fermentation by infrared spectroscopy and chemometrics. Spectrochim. Acta A Mol. Biomol. 2020, 240, 118571. [Google Scholar] [CrossRef] [PubMed]
  46. Rossel, R.V.; Walvoort, D.; McBratney, A.; Janik, L.J.; Skjemstad, J. Visible, near infrared, mid infrared or combined diffuse reflectance spectroscopy for simultaneous assessment of various soil properties. Geoderma 2006, 131, 59–75. [Google Scholar] [CrossRef]
  47. Jin, H.; Li, L.; Cheng, J. Rapid and non-destructive determination of moisture content of peanut kernels using hyperspectral imaging technique. Food Anal. Methods 2015, 8, 2524–2532. [Google Scholar] [CrossRef]
  48. Abu-Khalaf, N. Identification and quantification of olive oil quality parameters using an electronic nose. Agriculture 2021, 11, 674. [Google Scholar] [CrossRef]
  49. Zhang, X.; Li, M.; Cheng, Z.; Ma, L.; Zhao, L.; Li, J. A comparison of electronic nose and gas chromatography–mass spectrometry on discrimination and prediction of ochratoxin A content in Aspergillus carbonarius cultured grape-based medium. Food Chem. 2019, 297, 124850. [Google Scholar] [CrossRef]
  50. Zhou, Z.; Zeng, S.; Li, X.; Zheng, J. Nondestructive detection of blackheart in potato by visible/near infrared transmittance spectroscopy. J. Spectrosc. 2015, 2015, 786709. [Google Scholar] [CrossRef] [Green Version]
  51. Wei, Z.; Wang, J.; Zhang, W. Detecting internal quality of peanuts during storage using electronic nose responses combined with physicochemical methods. Food Chem. 2015, 177, 89–96. [Google Scholar] [CrossRef]
  52. Khorramifar, A.; Rasekh, M.; Karami, H.; Covington, J.A.; Derakhshani, S.M.; Ramos, J.; Gancarz, M. Application of MOS gas sensors coupled with chemometrics methods to predict the amount of sugar and carbohydrates in potatoes. Molecules 2022, 27, 3508. [Google Scholar] [CrossRef]
  53. Zaki Dizaji, H.; Adibzadeh, A.; Aghili Nategh, N. Application of e-nose technique to predict sugarcane syrup quality based on purity and refined sugar percentage. J. Food Sci. Technol. 2021, 58, 4149–4156. [Google Scholar] [CrossRef] [PubMed]
  54. Zhou, C.; Fan, J.; Tan, R.; Peng, Q.; Cai, J.; Zhang, W. Prediction of linalool content in Osmanthus fragrans using e-nose technology. J. Sens. 2022, 2022, 7349030. [Google Scholar] [CrossRef]
  55. Rasekh, M.; Karami, H.; Fuentes, S.; Kaveh, M.; Rusinek, R.; Gancarz, M. Preliminary study non-destructive sorting techniques for pepper (Capsicum annuum L.) using odor parameter. LWT 2022, 164, 113667. [Google Scholar] [CrossRef]
  56. Biondi, E.; Blasioli, S.; Galeone, A.; Spinelli, F.; Cellini, A.; Lucchese, C.; Braschi, I. Detection of potato brown rot and ring rot by electronic nose: From laboratory to real scale. Talanta 2014, 129, 422–430. [Google Scholar] [CrossRef] [PubMed]
  57. Rady, A.M.; Guyer, D.E. Evaluation of sugar content in potatoes using NIR reflectance and wavelength selection techniques. Postharvest Biol. Technol. 2015, 103, 17–26. [Google Scholar] [CrossRef]
  58. Gancarz, M.; Wawrzyniak, J.; Gawrysiak-Witulska, M.; Wiącek, D.; Nawrocka, A.; Tadla, M.; Rusinek, R. Application of electronic nose with MOS sensors to prediction of rapeseed quality. Measurement 2017, 103, 227–234. [Google Scholar] [CrossRef]
  59. Rusinek, R.; Gancarz, M.; Nawrocka, A. Application of an electronic nose with novel method for generation of smellprints for testing the suitability for consumption of wheat bread during 4-day storage. LWT 2020, 117, 108665. [Google Scholar] [CrossRef]
  60. Karami, H.; Rasekh, M.; Mirzaee-Ghaleh, E. Qualitative analysis of edible oil oxidation using an olfactory machine. J. Food Meas. Charact. 2020, 14, 2600–2610. [Google Scholar] [CrossRef]
  61. Gancarz, M.; Dobrzański, B.; Malaga-Toboła, U.; Tabor, S.; Combrzyński, M.; Ćwikła, D.; Strobel, W.R.; Oniszczuk, A.; Karami, H.; Darvishi, Y.; et al. Impact of coffee bean roasting on the content of pyridines determined by analysis of volatile organic compounds. Molecules 2022, 27, 1559. [Google Scholar] [CrossRef]
  62. Rusinek, R.; Gawrysiak-Witulska, M.; Siger, A.; Oniszczuk, A.; Ptaszyńska, A.A.; Knaga, J.; Malaga-Toboła, U.; Gancarz, M. Effect of supplementation of flour with fruit fiber on the volatile compound profile in bread. Sensors 2021, 21, 2812. [Google Scholar] [CrossRef]
  63. Raigar, R.K.; Upadhyay, R.; Mishra, H.N. Storage quality assessment of shelled peanuts using non-destructive electronic nose combined with fuzzy logic approach. Postharvest Biol. Technol. 2017, 132, 43–50. [Google Scholar] [CrossRef]
  64. Wilson, A.D. Future applications of electronic-nose technologies in healthcare and biomedicine. In Wide Spectra of Quality Control; Işin, A., Ed.; InTech Publishing: Rijeka, Croatia, 2011; pp. 267–290. [Google Scholar]
  65. Kerdcharoen, T.; Pobkrut, T. Soil sensing survey robots based on electronic nose. In Proceedings of the 14th Annual International Conference on Control, Automation, and Systems, Seoul, Korea, 22–25 October 2014; pp. 1604–1609. [Google Scholar] [CrossRef]
Figure 1. Typical electronic nose sensor array responses to cucumber fruit headspace volatiles (VOCs) in air samples.
Applsci 12 11263 g001
Figure 2. Results of Duncan’s multiple range mean comparison tests for analysis of estimated nutrient contents in cucumber fruits for: (a) Nitrogen (b) Potassium, and (c) Phosphorus. Values with the same letter (a–e) are not significantly different at P = 0.01.
Applsci 12 11263 g002
Figure 3. Radar graph response of sensors in the e-nose sensor array.
Applsci 12 11263 g003
Figure 4. Score plot PCA analysis for different levels of applied urea fertilizer.
Applsci 12 11263 g004
Figure 5. Loading plot for PCA analysis for different levels of urea fertilizer.
Applsci 12 11263 g005
Figure 6. Cluster analysis dendrogram responds to different levels of urea fertilizer applied to cucumber plants.
Applsci 12 11263 g006
Figure 7. MLR prediction models for nitrogen fertilizer based on optimal factors of (a) PCR model and (b) PLSR model.
Applsci 12 11263 g007
Figure 8. MLR prediction models for potassium fertilizer based on optimal factors of (a) PCR model and (b) PLSR model.
Applsci 12 11263 g008
Figure 9. MLR prediction models for phosphorus fertilizer based on optimal factors of (a) PCR model and (b) PLSR model.
Applsci 12 11263 g009
Table 1. Characteristics of greenhouse soil used for cucumber plant cultivation.
Soil Sample Chemical and Structural CompositionGreenhouse Soil Parameters
Depth (cm)0–30
Electrical Conductivity (EC × 10 3 )1.550
Total Saturated Acidity (pH of paste)7.600
Percentage Neutralizing Substances (T.N.V)25.000
Permeability (cm/ha)1.000
% FC37.000
% PWP19.000
Bulk density (g/ cm 3 )1.280
% Sand25.000
% Silt33.400
% Clay41.600
% Organic Carbon (O.C.)1.670
Nitrogen (N mg/kg)0.167
Phosphorus (P mg/kg)67.400
Potassium (K mg/kg)1140.000
Manganese (Mn mg/kg)7.200
Iron (Fe mg/kg)8.980
Zinc (Zn mg/kg)5.550
Copper (Cu mg/kg)1.900
Table 2. Analysis of variance of chemical fertilizer residues in cucumber.
SourcesDegrees of FreedomMean Square
Nitrogen40.078 **
Error100.001
Total14
Potassium40.435 **
Error100.001
Total14
Phosphorus40.035 **
Error106.678 × 10−5
Total14
** Statistically significant at P ≤ 0.01.
Table 3. PLSR and PCR model analysis results for chemical fertilizer residues in cucumber.
ModelR2valR2calRMSE-ValRMSE-CalOffsetvalOffsetcalOptimal Factor
NitrogenPCR0.8990.9050.0470.0460.3280.3231
PLSR0.9050.9060.0470.0460.3340.3221
PotassiumPCR0.8320.8500.1420.1320.7800.7064
PLSR0.8310.8480.1440.1330.7890.7132
PhosphorusPCR0.8080.8140.2160.2110.1170.1151
PLSR0.8060.8140.2170.2100.1190.1151
Publisher’s Note: MDPI stays neutral with regard to jurisdictional claims in published maps and institutional affiliations.

