Article

Characterization of Waxes in the Roman Wall Paintings of the Herculaneum Site (Italy)

1
Department of Chemistry, Life Sciences and Environmental Sustainability, University of Parma, Parco Area delle Scienze 17/A, 43124 Parma, Italy
2
Department of Food and Drug, University of Parma, Parco Area delle Scienze 27A, 43124 Parma, Italy
3
Department of Mathematical, Physical and Computer Sciences, University of Parma, Parco Area delle Scienze 7/A, 43124 Parma, Italy
*
Authors to whom correspondence should be addressed.
Appl. Sci. 2022, 12(21), 11264; https://doi.org/10.3390/app122111264
Submission received: 31 August 2022 / Revised: 13 October 2022 / Accepted: 3 November 2022 / Published: 7 November 2022
(This article belongs to the Section Materials Science and Engineering)

Abstract

:

Featured Application

The results derived from this research paper contribute to the body of knowledge available for Vesuvian painting techniques and materials and are considered useful for conservation and restoration plans.

Abstract

A multi-analytical approach is proposed for the detection and quantitative characterization of waxes in wall paintings from the Vesuvian area, in particular in the House of the Skeleton, the House of the Deer and the House of the two Atriums in Herculaneum (Italy). Different types of waxes, of animal, vegetable, mineral and artificial origin, were investigated, as reference materials, by Fourier transform infrared (FTIR) spectroscopy, Raman spectroscopy and gas chromatography coupled with mass spectrometry (GC/MS). The obtained results were compared with those found on samples from the wall paintings of Herculaneum. By non-destructive techniques, Raman and FTIR spectroscopies, waxes were generally found in the wall painting fragments investigated. A more quantitative characterization by GC/MS analysis, performed on three representative samples on the three houses, allowed highlighting the features of beeswax. In addition to beeswax, candelilla wax and an artificial wax, compatible with the formulated candelilla wax, were also detected. The presence of candelilla, a vegetable wax introduced in Europe after the sixteenth century, suggests maintenance works probably carried out with the aim of preserving the original colors of the paintings. In addition, by Raman and FTIR spectroscopies hematite and Egyptian blue pigments were identified. Calcite, aragonite and gypsum were also detected.

1. Introduction

The present investigation focuses on the identification of waxes in wall paintings from three domus of Herculaneum.
Painting techniques and organic materials of the houses of the Vesuvian area represent fundamental documents for the knowledge of the development of Roman mural painting. The extraordinary knowledge of Roman painting is mainly due to the unique conditions of preservation of the Vesuvian cities of Pompeii, Herculaneum and Stabiae, where huge quantities of paintings have been found, especially wall frescoes.
Pliny in Historia Naturalis [1] and Vitruvius in De Architectura [2] describe the fresco technique used for Roman paintings. Vitruvius also debates about a secco painting, but there is no chapter in which he definitely investigates the organic binders.
The study of organic binders in Roman paintings is an open question: the chemical–physical approach has given imprecise and incomplete data, often conflicting [3]. A “fresco theory” has been formulated in this regard, supported by Mora and Philippot [4]. They claim that Roman wall paintings were exclusively frescoed. According to this theory, the final aesthetic effect is similar to that of the a secco technique thanks to the final polishing. The treatises illustrate that the technique used for the creation of the Vesuvian wall paintings consisted of applying to the wall two or three layers of calcium-based plaster, mixed with sand and marble powder. It is known that the process consisted of the creation of the painting on the still-fresh plaster, which, by drying, fixes the pigments in a stable and lasting way.
Pompeian paintings can be dated between the end of the second century BC and the date of the Vesuvius eruption, 79 AD. At the time of the eruption of Vesuvius, unlike Pompeii, which was buried by a rain of ash and lapilli, Herculaneum was overwhelmed by a tide of mud and volcanic debris, which gave rise as it solidified to a sort of very hard tuff bank, between 8 and 15 m high, where the floors and ceilings of the buildings were preserved together with all the organic materials, such as wood, fabrics, paper, food: this fact enables a unique vision of the world of Roman private life. The houses were extensively decorated by the wall paintings that are their most extraordinary aspect.
The knowledge of the organic compounds used as decorative or preservative materials in artistic paintings and the identification of binding media are the most important results in the conservation studies of the archaeological and historical artefacts and may reveal significant information on the development of the painting techniques [5,6,7]. Natural organic materials, like natural waxes, have been used since ancient times for different purposes: as paint binders, waterproofing substances, sealants, protective surface coatings, ingredients of balms and cosmetics and for conservation processes in mummification, lighting candles and restoration practices [8,9].
Natural waxes are highly heterogeneous materials containing esters of fatty acids with long-chain alcohols, free fatty acids and/or long-chain hydrocarbons [10,11]. Waxes can be of animal (beeswax, lanolin, spermaceti wax, Chinese wax), vegetable (carnauba, candelilla, esparto wax, Japan wax) and fossil origin (paraffin wax, montan wax, ceresine) [12]. Waxes are solid at room temperature, highly hydrophobic, have a plastic character, become soft and workable when warm, have a melting point in the 60–80 °C range and are stable to chemical and enzymatic agents [10]. Beeswax, produced by worker bees of the Apis mellifera genus, represents the most used natural wax in history. In ancient times, it was thought that it came from the flowers; only at the end of the XVIII century, it was understood that it was produced by the bees themselves [13]. The use of beeswax as a sealing agent in pottery and for lighting has been known since the Neolithic [14,15]. The Egyptians employed beeswax for balms to be used for the mummification process, in shipbuilding, to polish the surface of paintings and to make statues and writing tablets [16,17]. Beeswax was particularly appreciated by Greeks and Romans for its shine and waterproofing properties and was largely applied on stone surfaces for both aesthetic and protective purposes [18]. According to the ancient sources, beeswax was used as a binder in a painting technique named encaustic [2,19]: by Romans and Egyptians in mummy portraits, as in Fayum mummy portraits [20,21,22], and by Greek, Roman and Byzantine artists in ceramic, wall paintings, in polychrome sculptures and other artworks made by other materials [23]. For a long time, due to the brilliant colors of the paintings and their extraordinary preservation and also to the complex interpretation of Vitruvius’ and Pliny’s texts, it was thought that Herculaneum and Pompeii wall paintings had been made with the encaustic technique. Studies in recent years have actually found the presence of beeswax in Pompeii’s paintings, but from the observation of the cross sections of the collected samples, it has been possible to localize the wax only on the pictorial surface: this suggests the application of wax during later conservation treatments [24,25].
In particular, research on Insula del Centenario in Pompeii was carried out to verify the presence of protein and lipid materials as binders for the pigments and to identify organic compounds on the paintings from previous restoration works [24]. Samples collected from wall paintings from different rooms were studied by Fourier transform infrared spectroscopy (FTIR) and gas chromatography coupled with mass spectrometry GC/MS. Analytical results show that these Roman wall paintings were made without the use of lipid and proteinaceous binders, most probably with a fresco technique. In addition, wax, egg and animal glue have been identified on the surface of the paint: their presence could be associated with previous restoration works. The use of lipid and protein compounds for protective purposes and/or to restore wall paintings to their original brilliance has been documented in the restorations carried out in Pompeii in the nineteenth century [5,24,25].
An investigation carried out by Duran et al. [26] has employed several analytical techniques to study Roman wall paintings from House of the Villa of Papyri in Herculaneum and the Golden Bracelet in Pompeii. Organic binding media have been studied by means of infrared spectroscopy and Py–GC/MS. The results of FTIR spectroscopy indicate the presence of some glue- or gum-like compounds. The results of this study showed vegetable wax, beeswax and some types of protein and gum compounds, thus underlining the presence of a dry paint [26]
Another study has been carried out in the Villa of the Papyri in Herculaneum, in order to identify the organic binders [27]. The authors, by means of GC/MS, detected egg, in some samples, wherein the pigments required a secco technique. They also investigated the presence of waxes employed as superficial treatments of the wall paintings. The fact that they did not find beeswax in all the considered samples gives additional evidence that the encaustic technique was not used in the Villa of the Papyri in Herculaneum [27].
Cuní [3] points out that the analytical investigations of ancient Roman wall paintings present a difficulty in efficiently extracting organic binders. The author believes that sometimes a mural painting can be considered a fresco when the organic binder may not be identified for purely analytical problems. He also notices that there is a clear difference between the results of different research groups.
The absence of data in most studies on the effectiveness of extraction actions used in ancient samples and the effect of microbial attack may raise doubts about the results obtained.
In addition to beeswax, other natural waxes of different origin have been used by artists and by art restorers both to improve the beeswax properties (melting point, hardness, workability) and to minimize the amount of needed wax [28,29]. Spermaceti wax is obtained from the precious oil in the head cavity of the sperm whale (Physeter macrocephalus) [30,31]. Currently, since whaling is prohibited, synthetic cetyl esters wax is used instead of spermaceti wax. The main vegetable waxes carnauba and candelilla are obtained from plants growing in the American continent. Carnauba wax is extracted from the leaves of Copernicia prunifera, a Brazilian palm tree and is the hardest of the vegetable waxes [32]. In restoration practice, carnauba is added to make beeswax harder and increase its melting point [33]. Candelilla wax is produced from plants of Euphorbia cerifera native to Mexico [34,35]. The product known as “formulated candelilla wax” is a mixture of glyceryl stearate, paraffin, carnauba and candelilla (max 5%). Paraffins are considered natural mineral waxes produced from petroleum and look like a waxy and white mass, insoluble in water and acids [30,33]. The higher molecular-weight fractions in paraffin tend to crystallize into very small crystals. This material is used to produce microcrystalline waxes.
The technique used for the wall paintings of the Vesuvian area has been the subject of several archaeometric investigations [25,36,37,38,39]: this study aims to evaluate, by different analytical techniques, the presence of waxes in Roman wall paintings of the Vesuvian area by the investigation of samples taken from the Herculaneum House of the Skeleton, House of the Deer and House of the two Atriums.
Beeswax, spermaceti, carnauba, candelilla and paraffin waxes, found on the market, were investigated by Fourier transform infrared (FTIR) spectroscopy, Raman spectroscopy and gas chromatography coupled with mass spectrometry (GC/MS). GC/MS provides qualitative and quantitative determination of different analytes, for example, amino acids, fatty acids, sugars, hydrocarbons and esters. It has been successfully applied in recent decades in the characterization of archaeological organic residues containing natural waxes [7,29,38,40]. The results were compared with those obtained on samples taken from the wall paintings in the abovementioned houses of Herculaneum.

2. Experimental

2.1. Materials

N,O-bis-trimethylsilyl-trifluoroacetamide (BSTFA) with 1% trimethylchlorosilane was purchased from Fluka. Potassium hydroxide (KOH), methanol (CH3OH), hexane (C6H14), diethyl ether ((C2H5)2O), ethyl acetate (C4H8O2), hydrochloric acid 37% (HCl) and n-eicosane (C20H42) were supplied by Sigma-Aldrich (Saint Louis, MO, USA).
Pure beeswax was acquired from a local beekeeper; bleached beeswax “Cera Alba”, natural candelilla, carnauba waxes and microcrystalline wax were acquired from Polichimica s.r.l. Synthetic spermaceti wax (Cetyl palmitate), formulated candelilla wax and paraffin were supplied by A.C.E.F. s.p.a. (Fiorenzuola d’Arda, PC, Italy). Lanolin was purchased from Sigma-Aldrich (Saint Louis, MO, USA).
The archaeological samples from Herculaneum houses and their description are summarized in Table 1. As will be discussed below, a preliminary screening of the AC 18, AC 21, AC 22, AC 23 and AC 26 samples by FTIR and Raman evidenced organic compounds attributable to waxes. The actual identification of waxes was attempted by GC/MS analysis in the samples AC 17, AC 20 and AC 25.

2.2. Instruments and Methods

2.2.1. Fourier Transform Infrared Spectroscopy (FTIR)

The infrared spectroscopy investigation was carried out on AC 18, AC 21, AC 22. AC 23 and AC 26 samples with attenuated total reflectance (ATR) employing a JASCO FTIR 6100 Spectrometer equipped with a Pike diamond single-reflection ATR (JASCO Co., Tokyo, Japan). Infrared spectra were recorded in the spectral range 4000 to 400 cm−1, resolution 4 cm−1 and 96 scans.

2.2.2. Micro-Raman Spectroscopy

The Raman spectra were recorded, on the surface of the AC 18, AC 21, AC 22, AC 23 and AC 26 samples, in a nearly backscattered geometry by means of a Jobin Yvon LabRam micro-spectrometer (Jobin Yvon Horiba, Kyoto, Japan) equipped with an integrated Olympus BX40 microscope with excitation at 632.8 nm (He-Ne) and at 473.2 nm (Nd:YAG). The spectral resolution was about 1.5–3 cm−1. Typical exposures were 5 s, performed 3–5 times. To avoid unwanted thermal effects, density filters were used to have a laser power less than 1 mW on the samples [41]. Spectra were collected using a long working-distance microscope objective providing a magnification of 50×. The lateral resolution was about 2 µm. The 520.6 cm−1 Raman band of silicon was used to calibrate the system.

2.2.3. Gas Chromatography–Mass Spectrometry (GC/MS)

The GC/MS samples (500–1000 μg) from reference materials and wall painting fragments AC 17, AC 20 and AC 25 were extracted twice with 1 mL of dichloromethane by 30 min sonication. The extracts, after centrifugation, were hydrolyzed with 1 mL of 5% KOH in methanol by vigorous stirring for 60 min at 80 °C. After cooling at room temperature, the hydrolysate was extracted with hexane (2 mL). The hexane extract (neutral fraction) was mixed with 1 mL solution of n-eicosane as internal standard (500 ppm in hexane). Then the mixture was acidified with 1 mL hydrochloric acid (6 N) and extracted twice with 1 mL of diethyl ether (acidic fraction). The organic extracts were put in a screw cap test tube, dried under a gentle flow of nitrogen, recovered with 100 μL N,O-bis(trimethylsilyl)trifluoroacetamide (BSTFA) and silanized by keeping the tube at 60 °C for 30 min. Then, 1 μL of the reaction mixture was injected. The GC/MS analysis was performed by 6890 N GC system gas chromatograph equipped with a split/splitless injection port and coupled with a 5973A mass selective detector mass spectrometer (Agilent Technologies, Santa Clara, CA, USA). The mass spectrometer operated in electron impact positive mode (70 eV), and the mass spectra were acquired in the scan range 40–500 m/z. The MS transfer line temperature was 280 °C, and the MS ion source temperature was kept at 230 °C. The gas chromatographic separation was done in a fused-silica DB5 capillary column, 5% diphenyl–95% dimethylpolysiloxane, 30 m × 0.25 mm (internal diameter) and 0.25 μm film thickness (Agilent Technologies, Santa Clara, CA, USA). The carrier gas was used in the constant flow mode (He, purity 99.995%) at 20 mL/min. The main wax components, i.e., fatty acids, alcohols and hydrocarbons, were chosen as reference markers. For fatty acid, alcohol, and hydrocarbon analysis, the PTV injector was used in split mode at 280 °C. The chromatographic oven was programmed as follows: 80 °C, isothermal for 2 min, 10 °C/min up to 200 °C, 200 °C, isothermal for 5 min, 20 °C/min up to 280 °C, 280 °C, isothermal for 20 min. MS spectra were recorded in TIC (total ion current) mode.

3. Results and Discussion

Raman spectroscopy, FTIR spectroscopy and GC/MS results on commercial reference waxes and wall painting samples from Herculaneum are separately discussed in the following.

3.1. Analyses of the Reference Wax Samples

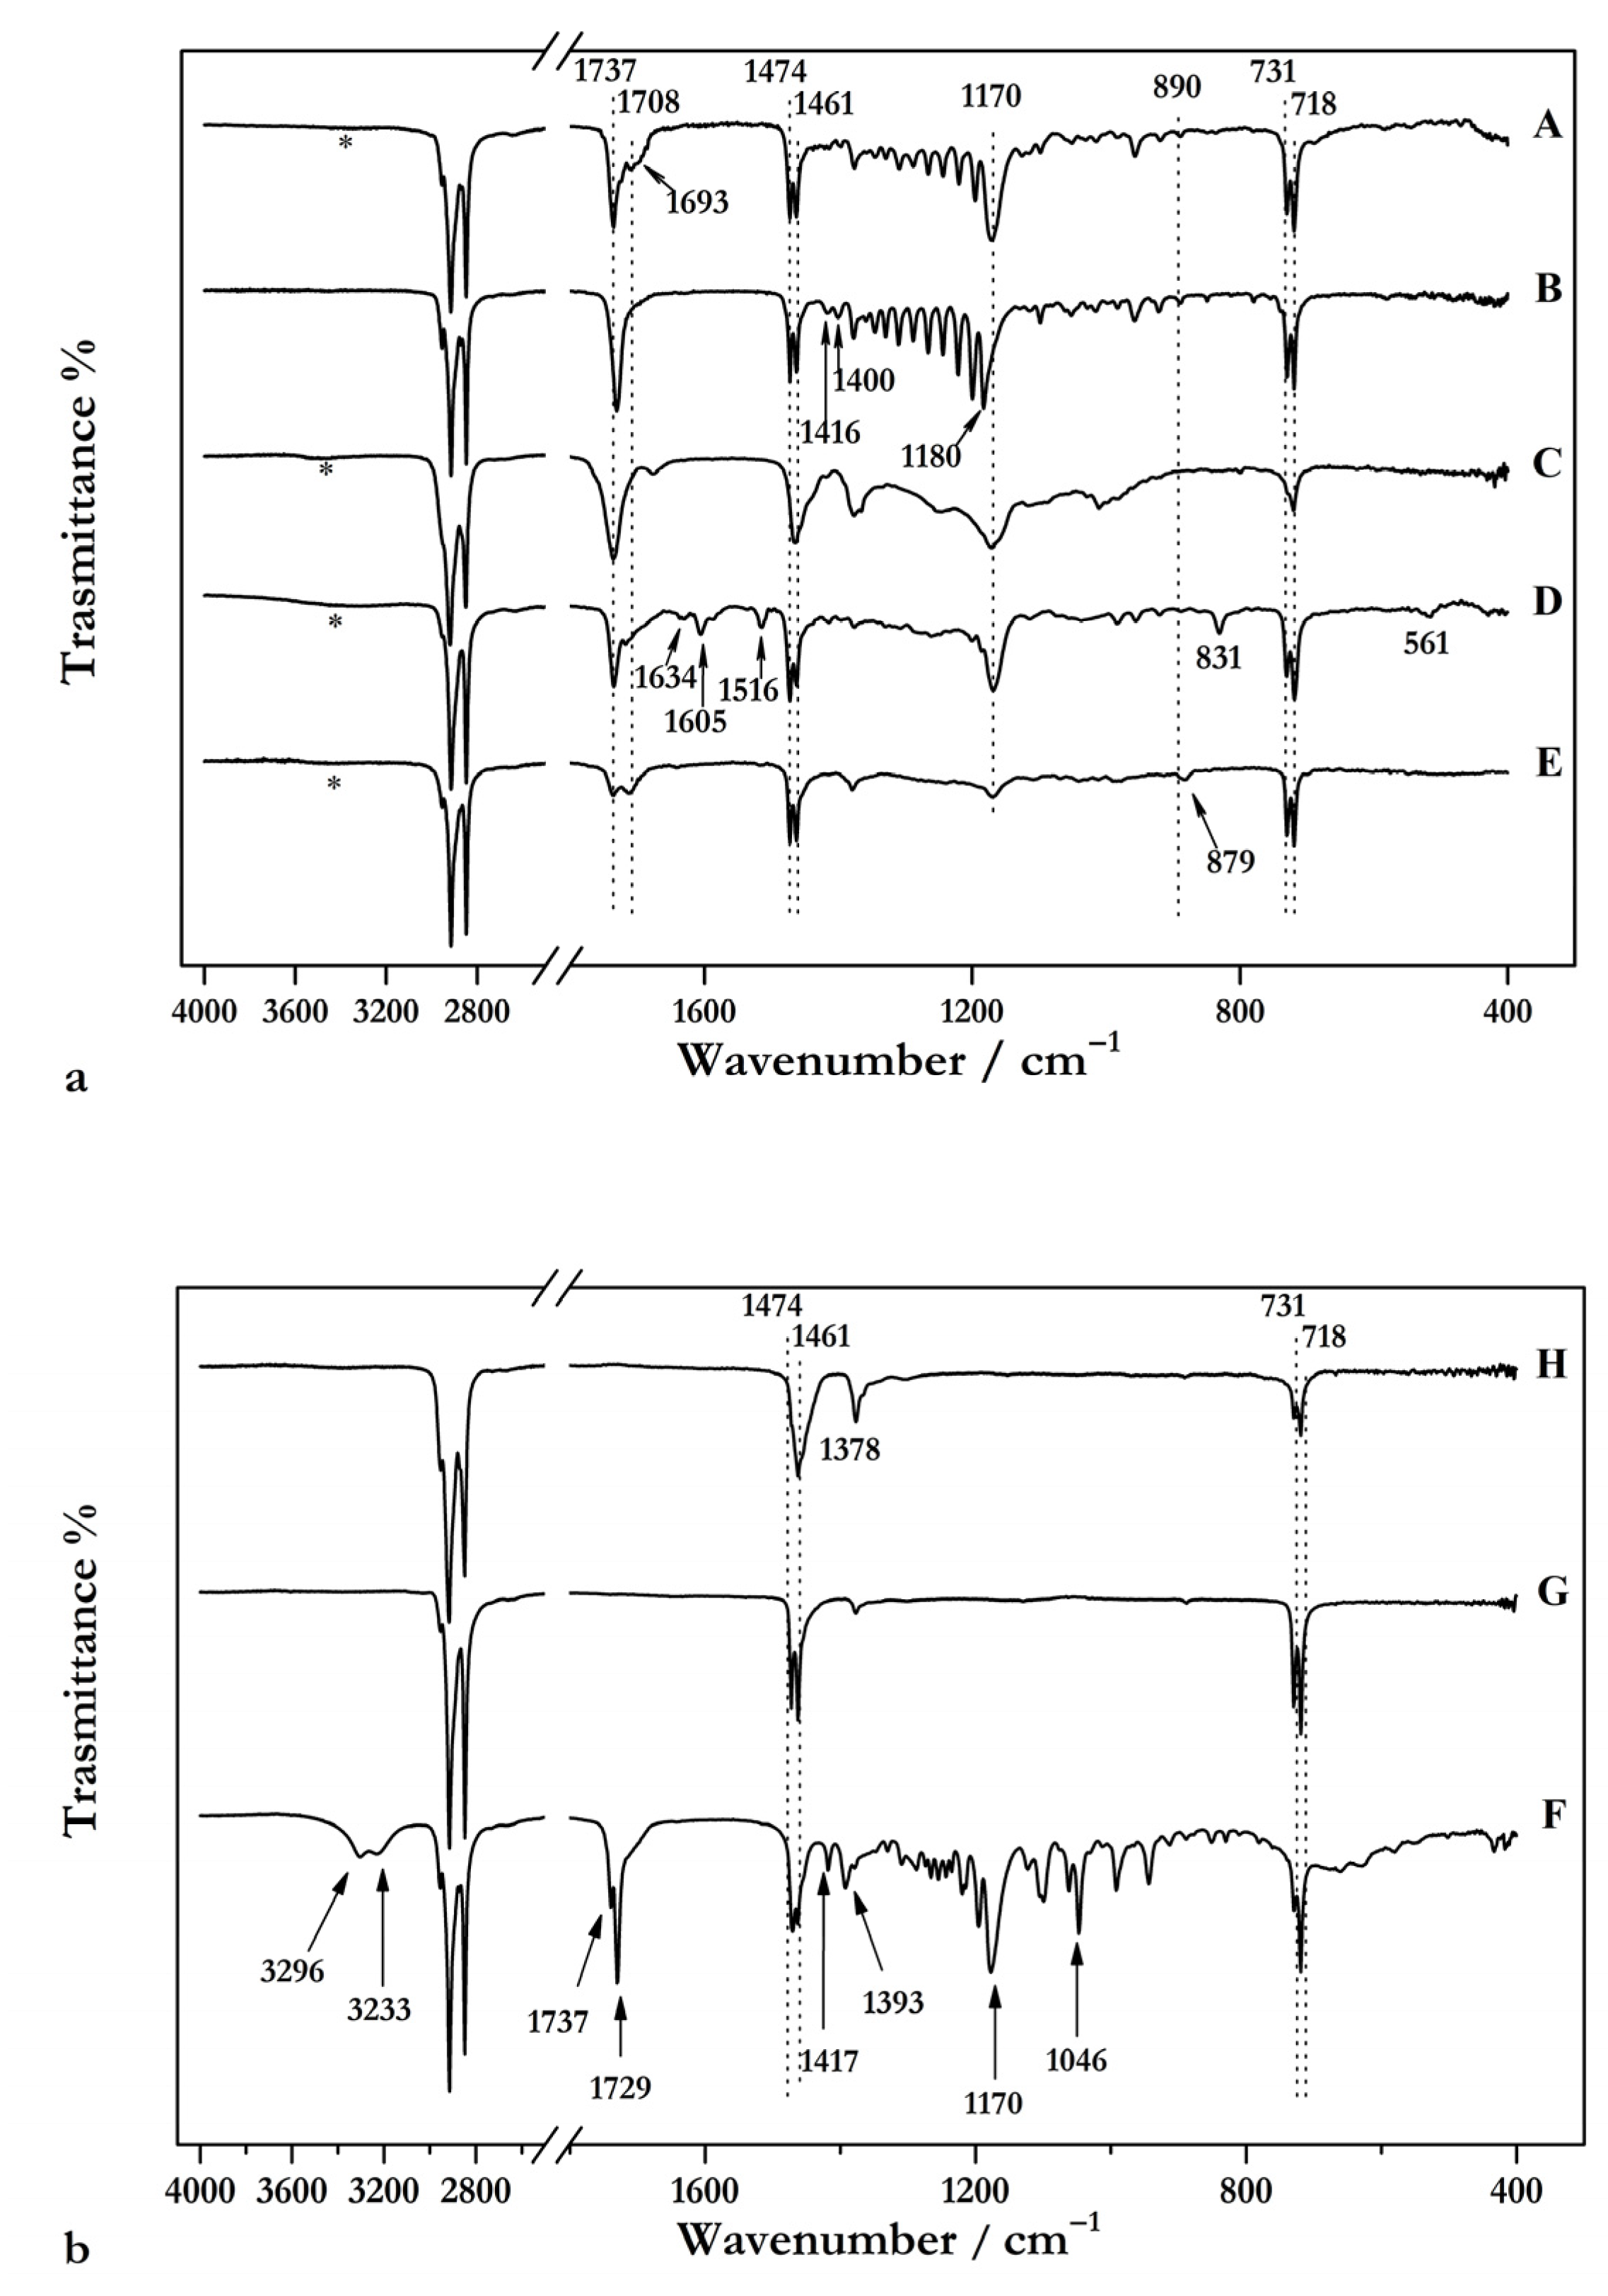
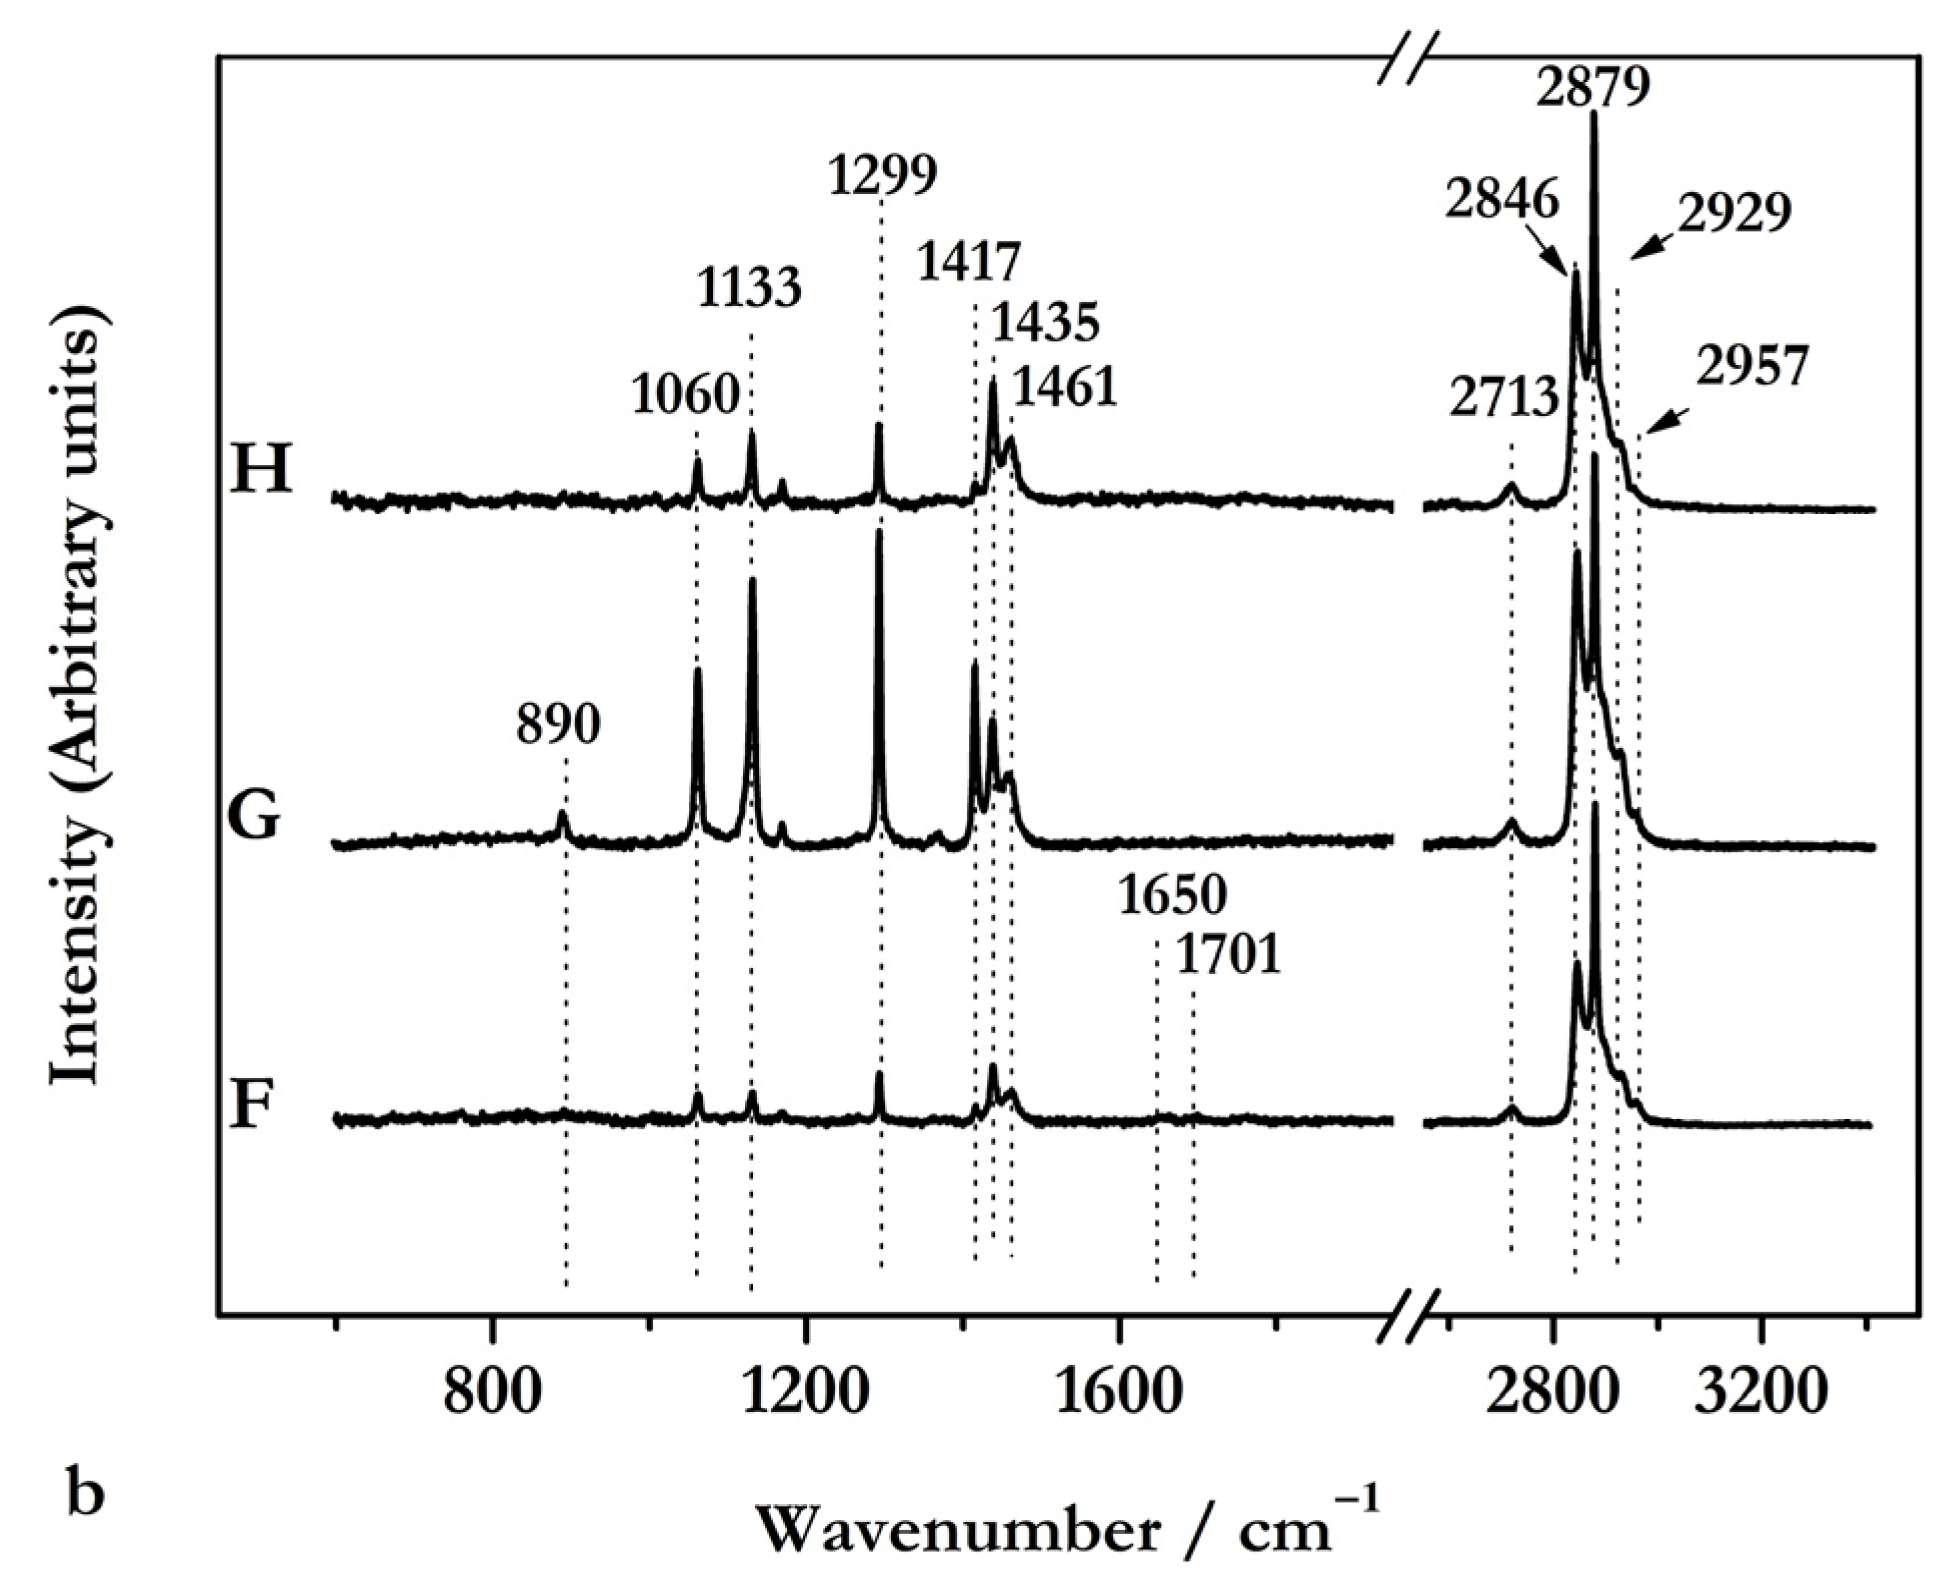
3.1.1. FTIR and Raman Spectroscopies
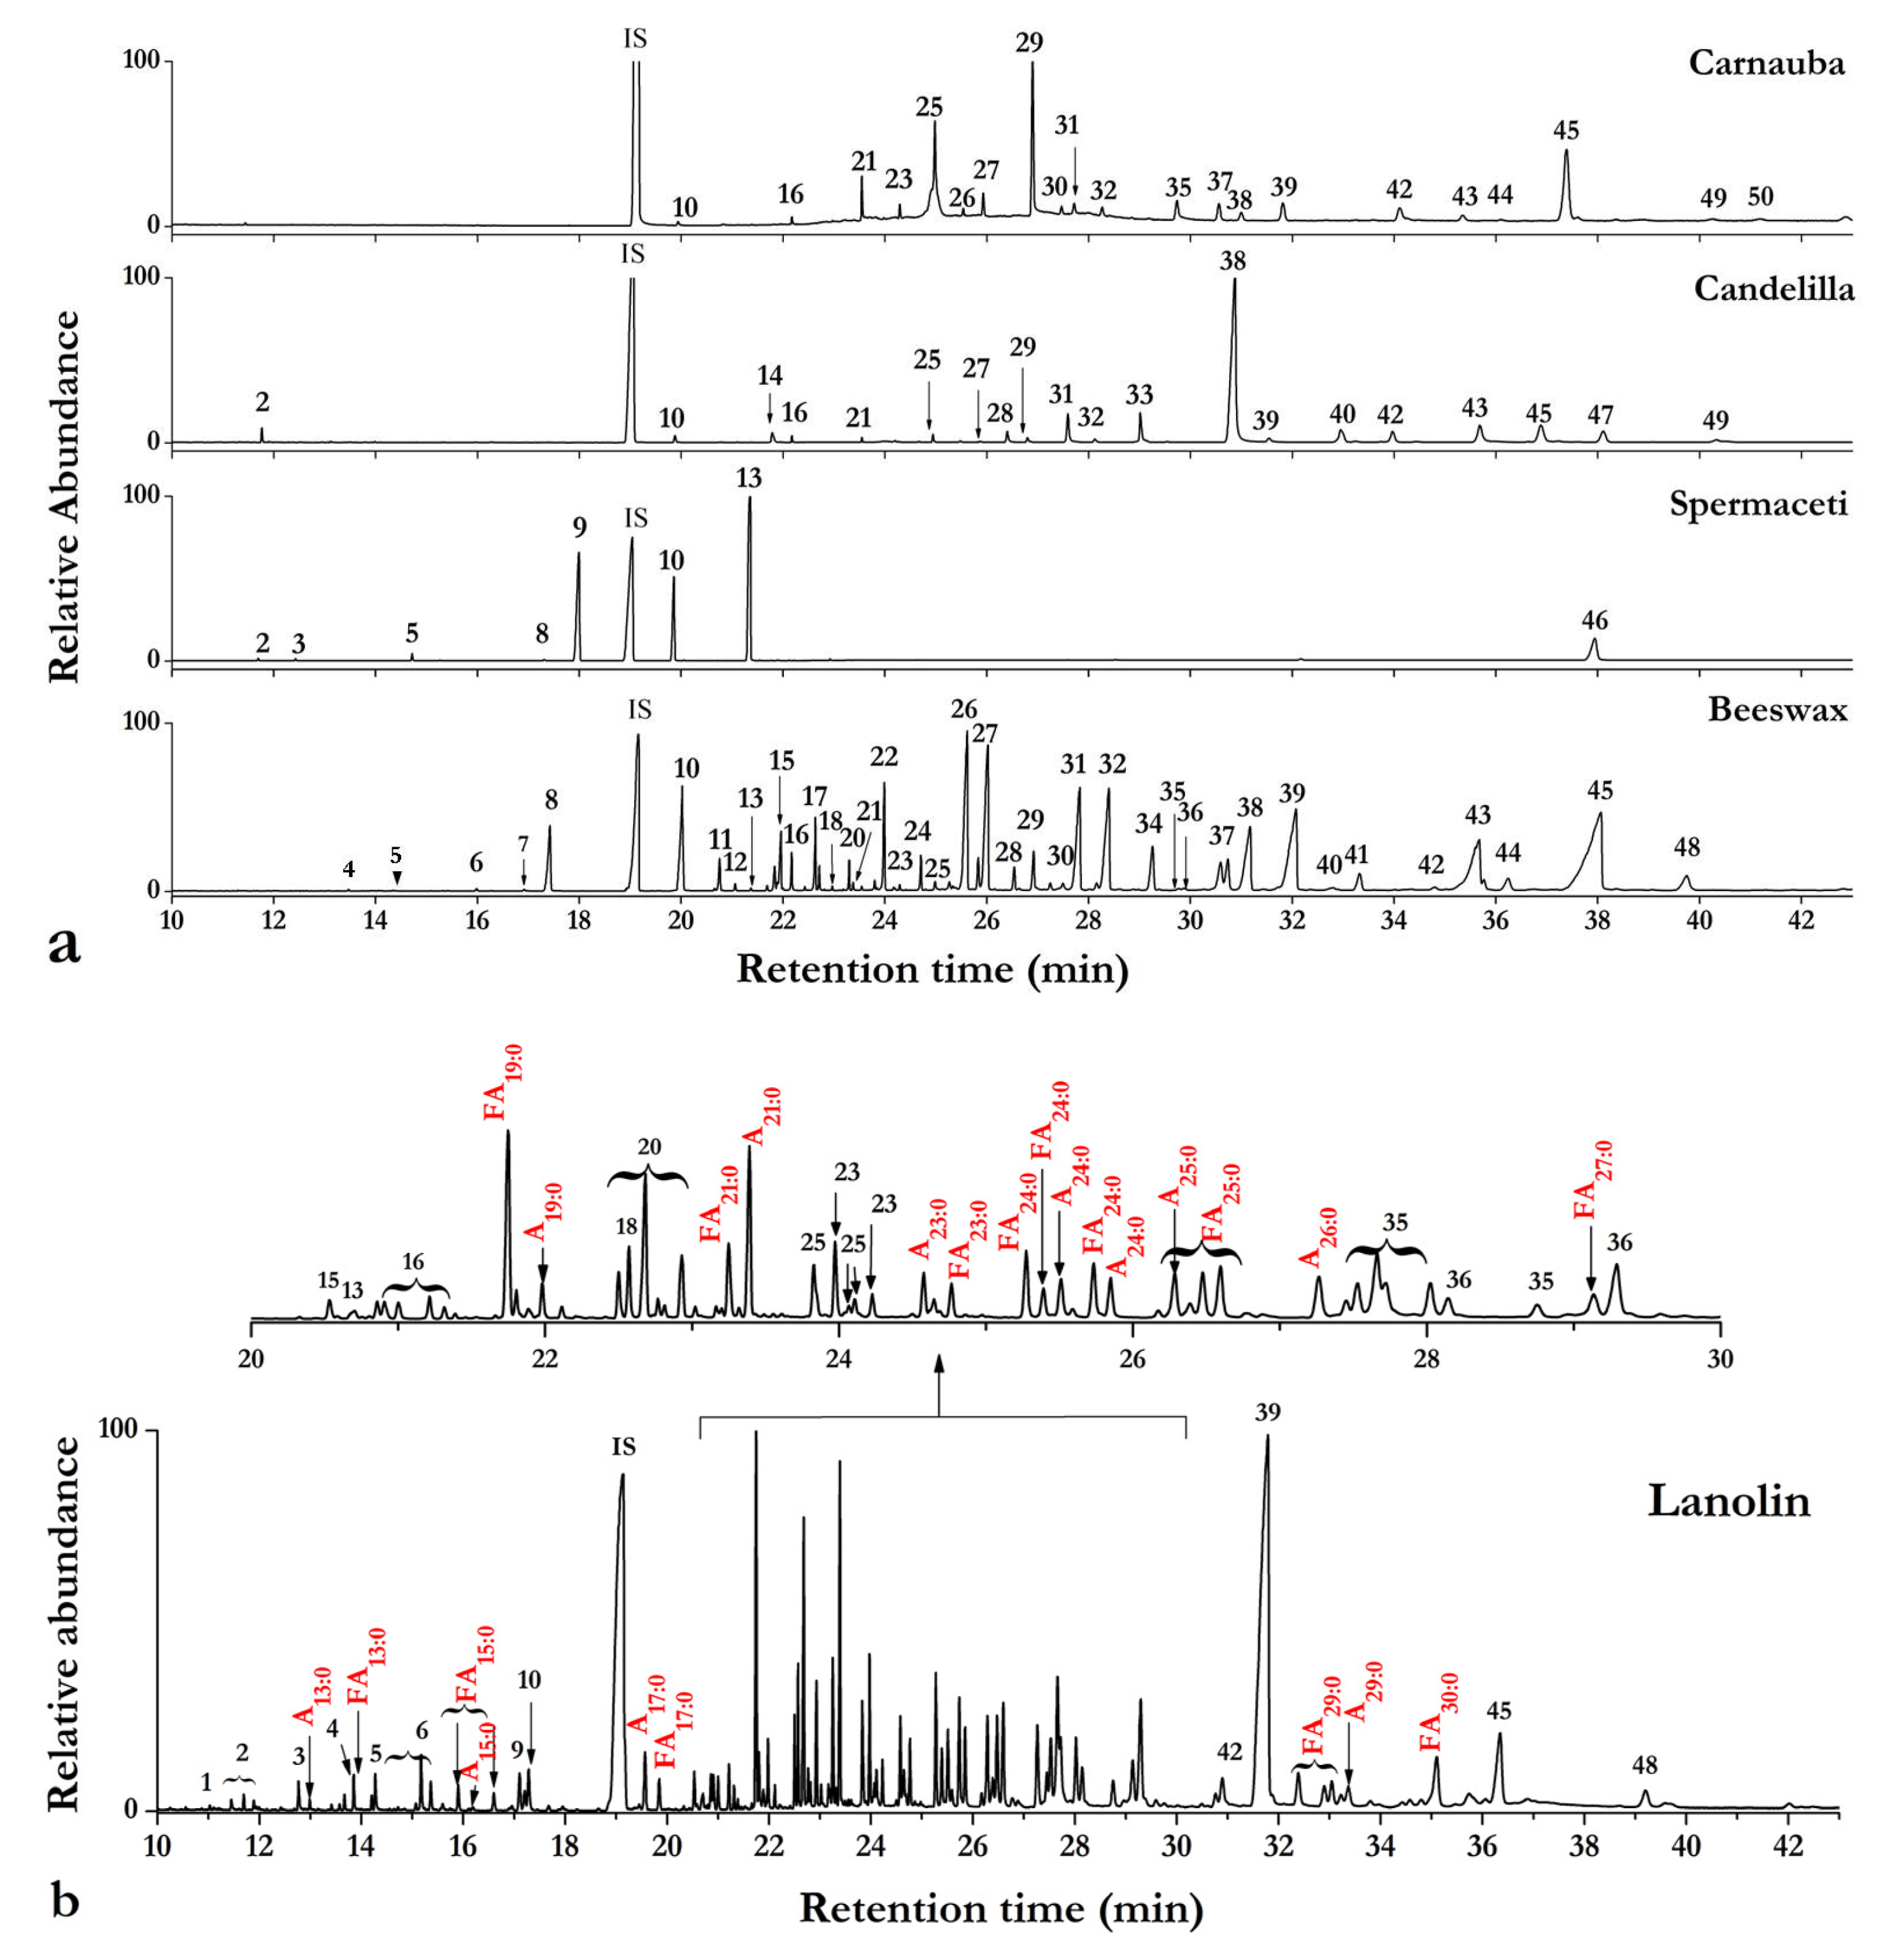
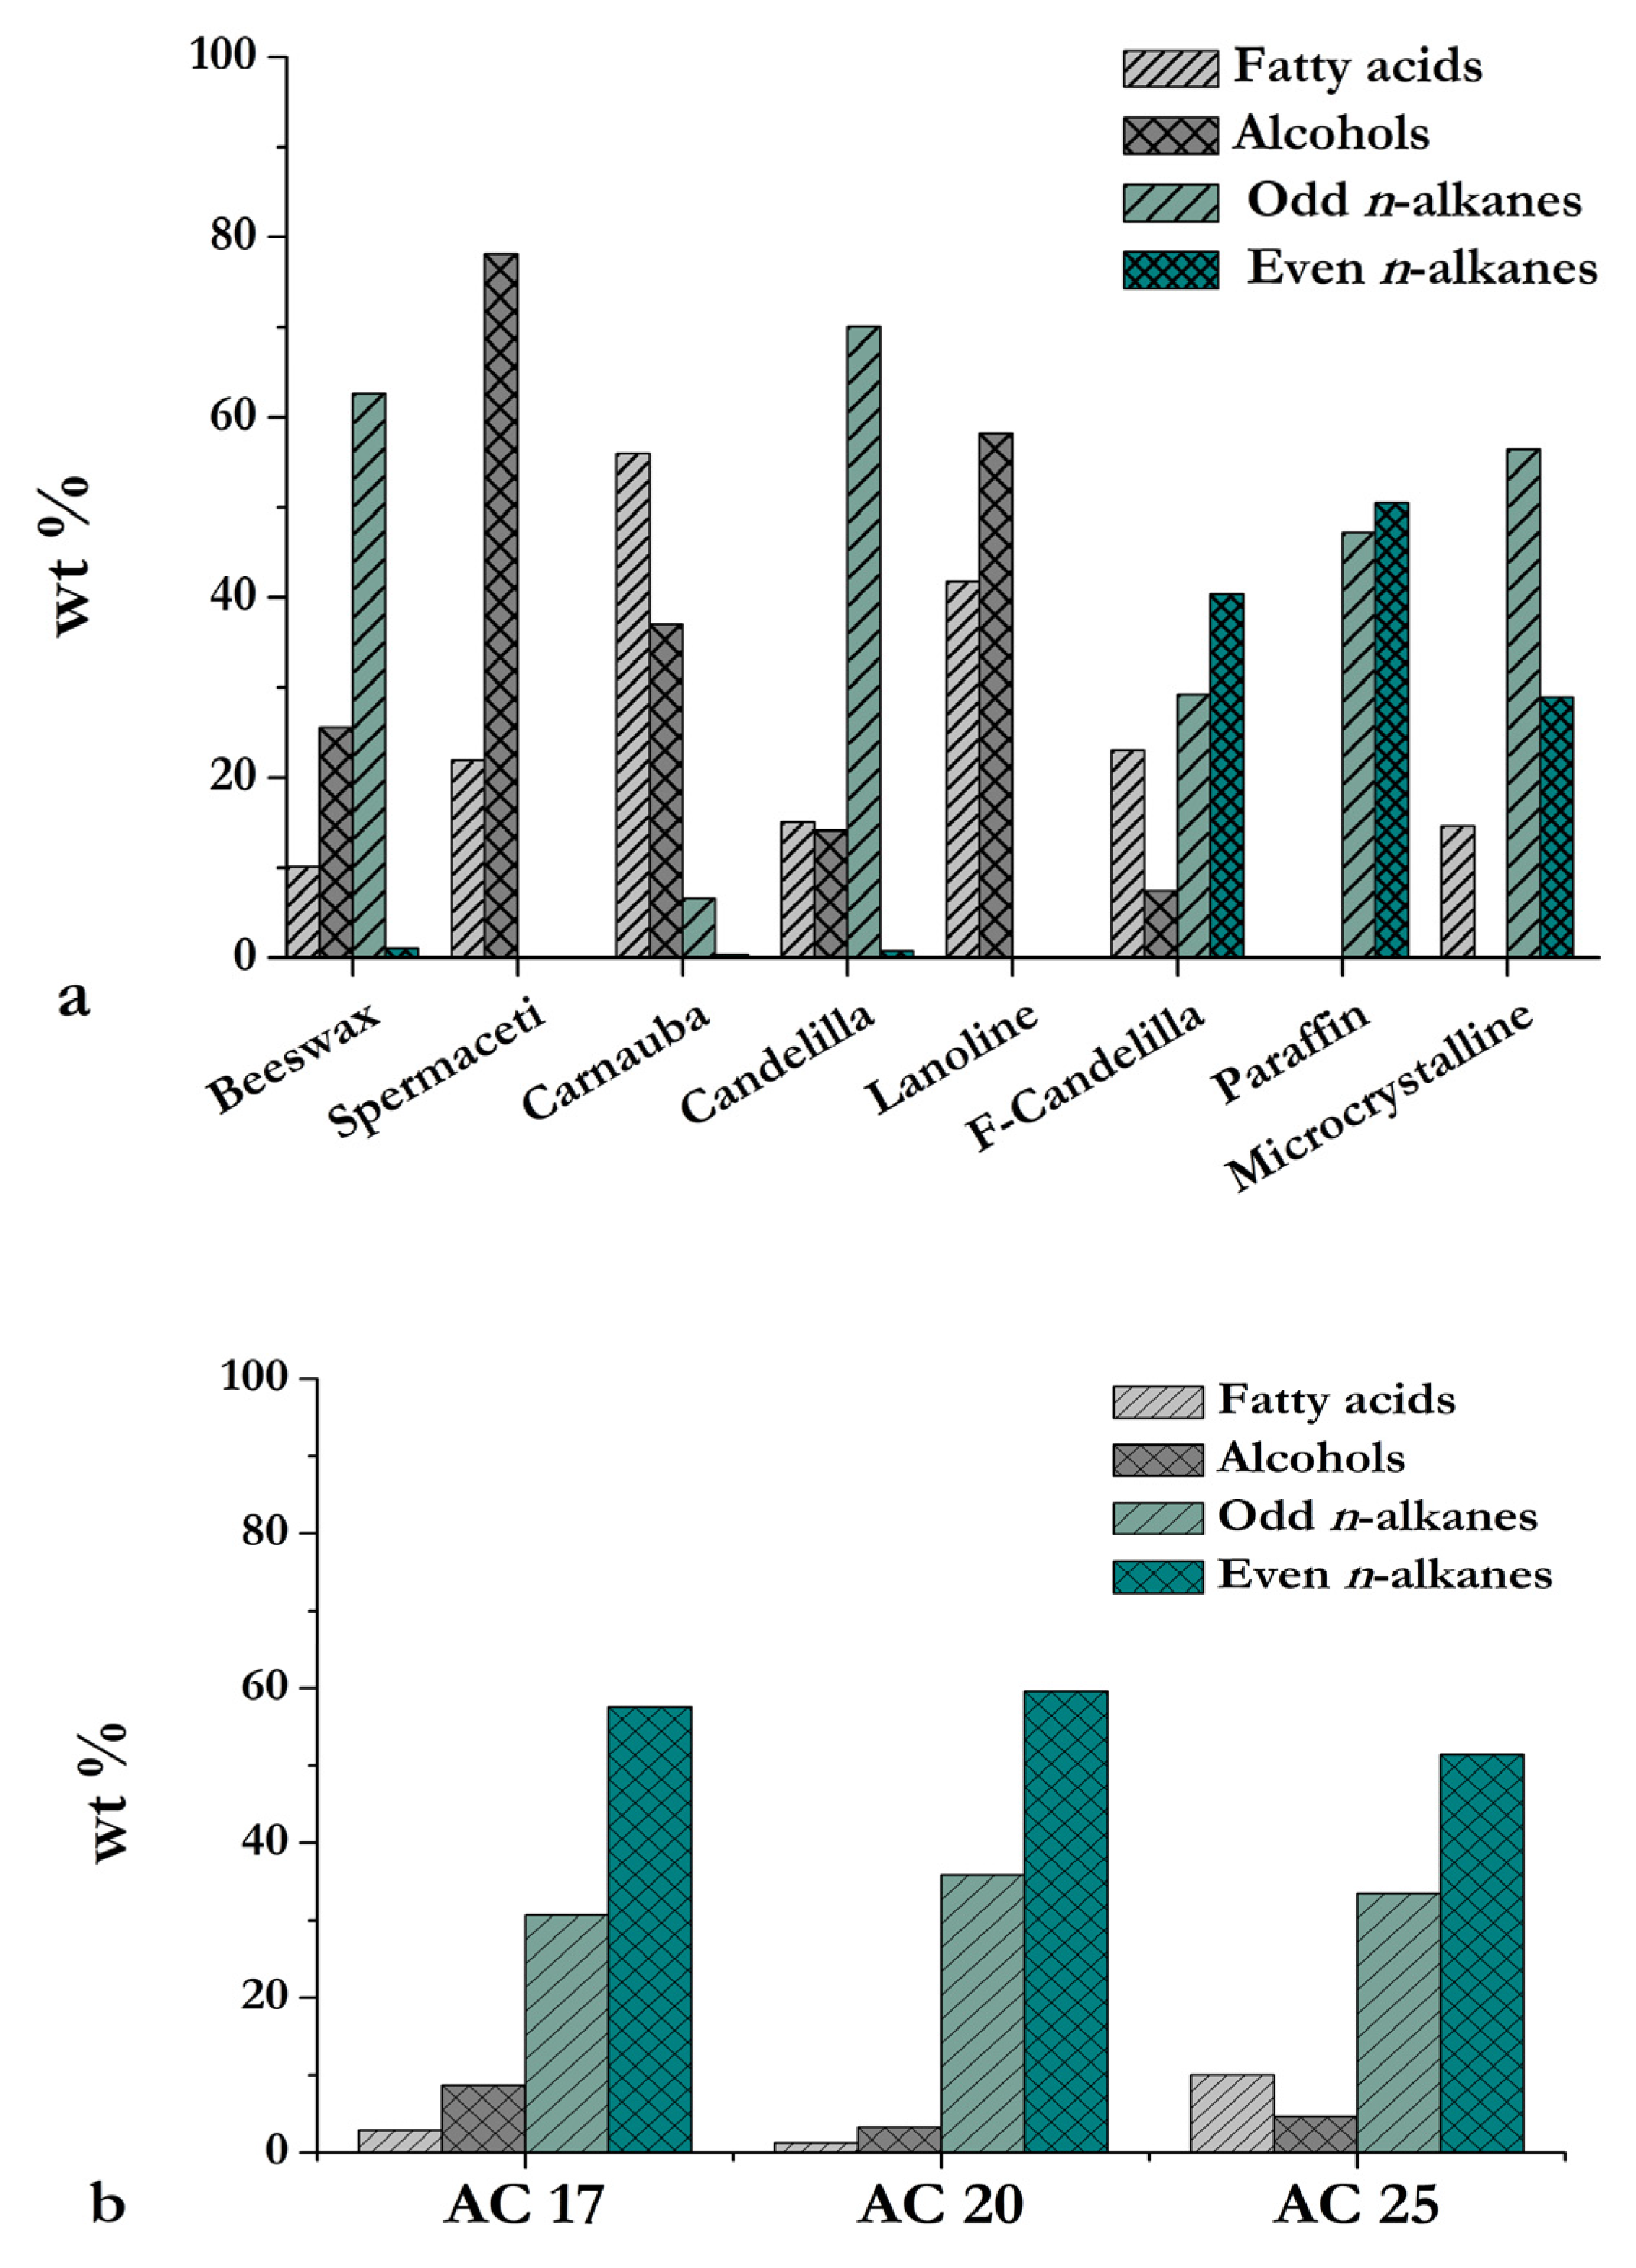
Waxes consist essentially of saturated and unsaturated long chain components (wax esters, free fatty acids, long chain alcohols, hydrocarbons, aromatic compounds): the most critical features for their identification are the CHX stretching vibration (ν(CHX), with x = 1, 2, 3) around 3000 cm−1 and the bending and rocking deformations of CHX at about 1400 cm−1 (δ(CHX)) and 700 cm−1 (ρ(CHX)), respectively. In waxes of animal and vegetal origin, the carbonyl stretching vibration (ν(C=O)) is an important feature.
In Figure 1a,b are reported the FTIR spectra of all investigated waxes. The strong doublets at 2916 and 2848 cm−1 and at 1472 and 1462 cm−1, due to the asymmetric and symmetric stretching and in-plane bending vibrations of methylene groups (CH2), respectively, and the medium strong doublet at 730 and 718 cm−1, due to the out-of-plane deformation of successive methylene groups (−(CH2)n), with n ≥ 4 [42]), are characteristic of long aliphatic chains and suggest the presence in waxes of long-chain fatty acids, esters and alkanes [43,44]. In the 1350–1200 cm−1 region, there are some sharp absorption bands assigned to C-C-C skeletal vibrational modes and to the wagging and twisting vibrations of methylene groups in the chain, one band for every two methylene groups [42,43,44,45]. These features are characteristic of long-chain acids, such as palmitic or stearic acids. The strong band at 1737 cm−1 due to carbonyl (C=O) and at 1170 cm−1 assigned to C-O-C stretching vibrations are indicative of wax ester components [30,46,47].
Some differences in the features of the waxes of different origin are clearly observable in Figure 1. Beeswax, lanolin, carnauba wax and candelilla wax (Figure 1a) show barely visible bands due to the OH stretching vibrations of alcohols, hydroxyl-esters and free fatty acids (marked by asterisks), absent in spermaceti wax. In addition, in beeswax and carnauba wax, the ν(C=O) vibrational bands at 1708 and 1693 cm−1 associated with free fatty acids [43,48] are also observed. In candelilla wax, the band at 1708 cm−1 has almost equal intensity with that of the carbonyl band, which may be due to unionized carboxyl groups [30]. Medium-weak bands, only detectable in the FTIR spectrum of carnauba wax at 1634, 1607, 1515 and 834 cm−1, are attributed to the skeletal ring breathing modes of aromatic groups [30,47]. Artificial and mineral waxes (Figure 1b) are dominated by the strong CH2 and CH3 stretching, in-plane bending and out-of-plane bending vibrations. The formulated candelilla, which is a mixture of glyceryl stearate and lesser amounts of natural waxes, also exhibits the strong and wide bands associated with the OH stretching vibrations at 3296 and 3233 cm−1 and the band due to the C-O stretching at 1046 cm−1 belonging to glyceryl stearate.
The Raman spectra of all waxes (Figure 2a,b) are dominated by the strong bands related to the CHx stretching vibrations: the bands at 2879 cm−1 and 2846 cm−1 are attributed to the symmetric stretching vibrations of methyl and methylene groups, respectively, and the weak bands at 2957 and 2929 cm−1 are assigned to the corresponding antisymmetric modes. The medium-weak peak at 2720 cm−1 is due to a combination of the stretching vibrational modes of methyl groups associated with CH2 [49,50]. Usually the CH3 and CH2 stretching vibrations are at higher wavenumber with respect to that found in waxes, but these vibrations decrease in frequency with increasing chain length [51]. The medium-strong band at 1461 cm−1 is attributed to the bending vibrations of CH2 groups of the aliphatic chain, and the strong bands at 1435 and 1417 cm−1 are due to the asymmetric and symmetric bending vibrations of CH3, respectively. The carbonyl bands, due to ester or free acid components, in the animal and vegetable waxes, are in the spectral region 1800–1600 cm−1: a weak band at about 1730 cm−1 is observable in the spectra of candelilla and spermaceti waxes. The presence of unsaturated chains in the fatty acid is highlighted by an asterisk in the beeswax Raman spectrum at 1655 cm−1 [50].
Carnauba wax is a complex mixture of the esters of fatty acids with linear long-chain alcohols and unsaturated hydrocarbons. In the region of CHx stretching vibrations, we notice the vinyl vibrations at 3068 cm−1. The C=C stretching mode occurs at 1631 cm−1 (in cis configuration) and 1610 cm−1 (isolated). The presence of the free fatty acid is confirmed by the ν (C=O) band at 1714 cm−1 (marked by a triangle) [47].
The Raman spectra of mineral waxes (paraffin and microcrystalline) show only the characteristic bands of the hydrocarbons. In formulated candelilla, one observes in addition the typical features of esters and of fatty acids.

3.1.2. GC/MS

Beeswax, spermaceti, candelilla, carnauba and lanolin wax chromatograms are shown in Figure 3a,b; paraffin, formulated candelilla wax and microcrystalline wax chromatograms are reported in Figure 4. In the neutral-fraction extract, homologous series of odd-numbered n-alkanes are the main compounds identified, while in the acidic-fraction extract, even-carbon-number saturated and unsaturated fatty acids and even-carbon-number long-chain n-alcohols, from hydrolysis process of the wax esters, were observed [8,11,13,14,15].
In beeswax (Figure 3a), odd-numbered long-chain hydrocarbon (C21–C33) and unsaturated hydrocarbons (C31:1 and C33:1) were identified. C27 is the most abundant hydrocarbon, followed by C31, C25 and C29 in decreasing order. Hydrocarbons with an even carbon number are also found in low amount. Long-chain even-carbon-number linear fatty acids (from C14 to C34) and linear alcohols (ranging from C24 to C34, myricylic alcohol being the predominant one) were also identified. Palmitic acid was the most abundant in the pure beeswax, followed by the lignoceric acid. Palmitic acid C16, n-heptacosane (C27) and nonacosane (C29) are diagnostic for beeswax [29,32,52,53]. Palmitic acid and myricylic alcohols originate from the hydrolysis of myricyl palmitate, the representative ester of beeswax.
Spermaceti (Figure 3a) wax is characterized by long-chain alcohols (ranging from C12 to C20) and no hydrocarbons being present. The main alcohols are 1-octadecanol (C18, stearyl alcohol) and 1-hexadecanol (C16, named cetyl alcohol or palmityl alcohol). In the chromatograms, with a longer retention time, the peak of cetyl palmitate (the ester of cetyl alcohol and palmitic acid, C15H31COO-C16H33), which is the characteristic component of spermaceti, is found [29,30].
The chromatographic profile of lanolin is very complex (Figure 3b), and the identification of all compounds is difficult. Lanoline is very rich in odd- and even-carbon-number fatty acids (from C10 to C29) linear and branched; their isomers are also found. The lanoline’s alcohol content varies greatly and remains high, with odd and even carbon numbers ranging from C12 to C29 showing the highest values in 1-icosanol (C20 arachidyl alcohol), 1-heneicosanol (C21) and docosanol (C22 behenyl alcohol) [52].
In candelilla wax, odd- and even-numbered long-chain hydrocarbons from C22 to C33 were found, among which C31 constituted 80%, as reported in the literature [30]. The C30 hydrocarbon was detected only in candelilla. In addition, long-chain fatty acids, from C16 to C32, the most representative being montanic acid (C28), and long-chain alcohols, from C24 to C30, were identified.
Carnauba contains saturated fatty acids with even chain length ranging from 16 to 28 carbon atoms, among which behenic acid (C22) and lignoceric acid (C24) were the main components, and long-chain alcohols (C22–C30), triacontanol being the most abundant, in agreement with the results of other authors [29,53,54].
Paraffin, formulated candelilla and microcrystalline wax (Figure 4) show very similar chromatogram profiles. They are characterized by high contents of odd- and even-carbon-number n-alkanes ranging from C22 to C33 and by very small contents of fatty acids. Paraffin and microcrystalline waxes do not contain alcohols.
Paraffin is a coal-derived wax. Generally, the paraffin’s chromatogram shows a distribution of alkanes centered on the heptacosane (C27), but slight variations in their distribution may occur, depending on the raw petroleum distilled. In microcrystalline wax, the main n-alkanes are tetracosane (C24) and pentacosane (C25), and the main acid is the docosanoic acid (C22) [55,56]. The formulated candelilla is a mixture of paraffin, glyceryl stearate (C21H42O4) and a low content of carnauba and candelilla waxes. Its chromatogram is characterized by homologous series of n-alkanes with odd and even carbon number in the range C19 to C33 (the main one is C24), such as in paraffin, a high content of palmitic and stearic acid and a low content of C16, C18 and C30 alcohols, due to the hydrolysis of glyceryl stearate and wax esters.
The compounds identified by the CG–MS analyses are summarized in Table 2.

3.2. Analyses of Archeological Samples

3.2.1. FTIR and Raman Spectroscopies

Spectroscopic FTIR and Raman analyses were carried out on the samples from Herculaneum to identify organic materials and the composition of pigments. The mineral compound identification was performed by comparison with reference spectra [42,57,58,59,60].
In the FTIR spectra of red samples AC 21, AC 23 and AC 26 (Figure 5), the characteristic peaks of iron oxide/hydroxide, probably hematite, at 568 and 478 cm−1, were identified. In addition, in all samples, calcium carbonate both in the calcite (1435 and 876 cm−1) and aragonite (1490 and 856 cm−1) phases and gypsum (3529, 3401, 1682, 1620, 1104 and 668 cm−1) were clearly visible. The characteristic bands at 1322 and 775 cm−1 (marked in figure by asterisk) of oxalates, due to degradation phenomena, were also present [60,61]. Features at 2922, 2852, 1734, 1469, 1419, 1379, 1174 and 722 cm−1 are typical of waxes [49,50,62].
The FTIR spectra, collected on the AC 18 and AC 22 samples, blue in colour, exhibited the typical absorption bands of gypsum and probably of Egyptian blue: antisymmetrical Si–O–Si stretching bands (1160, 1056 and 1008 cm−1) and symmetrical Si–O–Si stretching bands (800, 755, 664 and 595 cm−1) [63]. The main bands of Egyptian blue (1160, 1060, 1008 cm−1) overlap those of gypsum. In addition to the typical bands of waxes, in AC 22, the features of proteinaceous material (animal glue, gelatin, egg) at 3350 cm−1 and 1680 cm−1 were also identified [64].
To discriminate between the kinds of wax, we propose an empirical method (mainly used in beeswax adulteration studies [56,65]) based on the ratio between the intensities of the FTIR absorption main bands corresponding to the stretching vibrations of the C=O and CH groups. The integrated areas of ν(CHn) and ν(C=O) bands have been determined, in the 3050–2750 and 1800–1650 cm−1 ranges, respectively, by band deconvolution using pseudo-Voigt functions (i.e., linear combinations of Gaussian and Lorentzian curves) using LASPEC software [41]. The ratio values are 0.23, 0.22, 0.26, 0.16 and 0.19 for beeswax, spermaceti, lanolin, candelilla and carnauba, respectively. The results for AC 18 and AC 23 (a ratio value of about 0.23) may suggest the presence of animal wax. For AC 21, AC 22 and AC 26 (0.09, 0.07 and 0.1 ratios, respectively), it is not possible to identify the kind of wax by this method.
In all Raman spectra (Figure 6) acquired on the archaeological samples AC 18, AC 21, AC 22, AC 23 and AC 26, the typical features of waxes (indicated in figure by w) are recognizable, but it was not possible to establish the kind of wax (animal, vegetable, mineral or artificial).
In the Raman spectra of the red samples (AC 21, AC 23 and AC 26), hematite (α-Fe2O3), which is mainly responsible for the red color, at 224, 245, 291, 411, 611, 660 cm−1; calcite (CaCO3 trigonal crystal system) at 155, 281, 711, 1085 cm−1; and aragonite (CaCO3 orthorhombic system) at 703, 1085 cm−1 were identified, indicating the use by Roman artists of red ochre [66]. Furthermore, gypsum (CaSO4·2H2O) at 1008 cm−1 and quartz (SiO2) at 465 cm−1 were detected.
In the Raman spectra of AC 18 and AC 22 samples (Figure 6), the features of Egyptian blue (calcium copper silicate with formula (CaCuSi4O10)) at 432, 478, 572, 783, 1085 cm−1 [63] are clearly evident, in addition to those of calcite, quartz and gypsum. Egyptian blue is one of the oldest synthetic pigments: it is obtained by heating a mixture of siliceous sand, lime, copper compounds and a flux (soda, natron or plant ash) [67]. Its use was very common in the Roman period.
The presence of gypsum in almost all of the samples, both in the FTIR and Raman spectra, may suggest its original use as an intentional addition of the artist to lighten the pigment or as a binder in addition to lime [68]. In particular, the mixture of gypsum and aragonite (by the intentional addition of shells) was used as a binder in Roman wall paintings [69,70]. However, it cannot be excluded that the gypsum is the transformation product of calcium carbonate when exposed to a high SO2 atmosphere and a high relative humidity [71]. The presence in some samples of calcium oxalates, produced by microorganisms or by the oxidation of organic material, in particular of the lipid fraction in the binder [72,73], could indicate that both compounds (oxalate and gypsum) are due to degradation processes occurring on the surface of the paintings.

3.2.2. GC/MS

The wall painting samples AC 17, AC 20 and AC 25 were analyzed to detect, in a single gas chromatographic run, the hydrocarbons, fatty acids and alcohols, the markers chosen for the identification of waxes.
In Figure 7 are reported the chromatograms obtained by an analysis of archaeologic samples.
The presence in the chromatograms of the archaeological samples of long-chain hydrocarbons, long-chain fatty acids and alcohols suggests the presence of waxes. From the comparison with the GC pattern of the reference waxes (Figure 3a,b), it is evident that more than one type of wax is present in the samples.
The beeswax markers, odd long-chain hydrocarbons (C19–C33), with C27 the most abundant; fatty acids, among which palmitic and lignoceric acid are predominant; and C24–C30 alcohols, with prevalent triacontanol, are identified in all of the paint samples [74].
However, in the samples, there is a change in the distribution of the beeswax constituents. In all the wall paint samples, it is possible to note an increase in the content of even hydrocarbons, generally very low in natural waxes; a decrease in the characteristic odd n-alkanes, mainly pentacosane and heptacosane; and greater quantities of triacontane and dotriacontane. It cannot be disproven that the modifications of the hydrocarbon component of beeswax are due to degradation phenomena suffered over time. As reported by several authors, significant differences in the chromatographic profile of ancient beeswax compared to that of contemporary beeswax are often present: in ancient beeswax, the partial modification of the n-alkane pattern can be due to drastic heating but also to bacterial degradation [45,47,48,75]. The presence of oxalates derived by the oxidation of the lipidic fraction in organic binders, detected both by Raman and FTIR investigation, can support this hypothesis [72,73].
Triacontane (not found in beeswax) and hentriacontane, numbered 33 and 38 in Table 2, respectively, detected in large quantities in all samples, are candelilla wax identifiers. In addition, the high content of even hydrocarbons is indicative of mineral or artificial waxes. In particular, dotriacontane, found in very high quantities in the samples, is abundant in microcrystalline wax (derived from paraffin). In adulterated beeswax, in addition, the content of even hydrocarbons is considerably higher [76,77].
To better highlight these results, in Figure 8a,b are reported the weight percentage, obtained by the GC data, of the marker compounds (hydrocarbons, fatty acids, alcohols) in contemporary reference waxes and in archaeological samples, respectively. Furthermore, Table 3 shows, as an attempt to differentiate the type of waxes, the ratio between total fatty acid and alcohols and also between total odd and even n-alkanes.
As discussed above, in the contemporary natural waxes investigated, i.e., beeswax, candelilla and carnauba, the content of even hydrocarbons is very low. In mineral or artificial waxes, as clearly shown by the histograms, the even hydrocarbons constitute about 45–50% (wt %). Therefore, the odd/even alkane ratio cannot be used to distinguish the type of animal or vegetable waxes, while it allows to obtain some information on the presence of mineral or artificial waxes. Actually, in all three wall painting samples, there was a high content of even n-alkanes: the OA/EA ratio was about 0.6, compatible with the presence of formulated candelilla (a mix of glyceryl stearate, paraffin, carnauba and candelilla). On the other hand, the relative percentage ratio between total fatty acids and alcohols (Table 3), useful to identify animal and vegetable waxes, is unusable for mineral waxes that do not contain fatty acids and alcohols. The FA/A ratio found in AC 17 (House of the Skeleton) and in AC 20 (House of the Deer) was compatible with beeswax, confirming its presence, suggested also by FTIR spectroscopic analysis on the AC 18 and AC 23 samples, which were taken from the same wall painting areas as the AC 17 and AC 20 samples, respectively. Questionable results were, however, obtained on the AC 25 sample (House of the Double Atrium). Although the GC results clearly indicate the presence of beeswax and of candelilla, together with F-candelilla, the FA/A ratio does not give indisputable information. This high ratio, i.e., an increase in fatty acids, may be a result of an aging process through wax ester hydrolysis and oxidation, as documented in similar investigations [47,48,78]. The presence of oxalates, revealed by FTIR measurement, may reinforce this hypothesis.

4. Conclusions

The wall decorations of the houses of the Vesuvian area, Italy, constitute a unique historical document for the knowledge of Roman wall paintings. In this study, a multi-analytical approach by FTIR, Raman and GC/MS techniques was proposed for the detection and characterization of the waxes in the wall paintings of three Herculaneum houses: the House of the Skeleton, the House of the Deer and the House of the two Atriums.
Spectroscopic FTIR and Raman investigations, carried out on the surface of the samples, showed the characteristic bands of the waxes. It was not possible, with these techniques, to identify the type of wax.
By means of GC/MS, the characteristics of beeswax are clearly detected even if, obviously, in archaeological samples, there are variations in the distribution of the constituents of beeswax (hydrocarbons and fatty acids) with respect to contemporary beeswax, due to aging and degradation phenomena suffered over time. It is clear that the results of the GC/MS measurements do not provide information on the distribution of waxes in the samples. For this reason, the original use of beeswax by the Roman artist can neither be confirmed nor excluded. In addition to beeswax, by GC/MS, the triacontane and hentriacontane hydrocarbon markers of candelilla wax (imported in Europe after its discovery in the Americas) were found. An artificial wax, such as formulated candelilla (often used in a mixture to reinforce natural waxes), was also detected.
In light of these results, it makes sense to conclude that a mix of beeswax and candelilla (combined with formulated candelilla) has been applied over the surface as a protective layer or to enhance the brilliance of the colors. It is well known that the application of a layer of wax on painted surfaces, to make them brighter, was a widespread practice of restoration since the beginning of the archaeological excavations conducted in the Vesuvian area in the nineteenth century.
By Raman and FTIR spectroscopies, hematite and Egyptian blue were identified, confirming the high quality and value of the decorations found in the domus Herculanesis.

Author Contributions

Conceptualization, L.B. and A.C.; methodology, L.B.; validation, L.B., A.C. and P.P.L.; formal analysis, L.B., M.C. and C.G.; investigation, L.B., M.C., C.G. and G.P.; resources, A.C., C.G., P.P.L. and G.P.; data curation, L.B. and M.C.; writing–original draft preparation, L.B.; writing–review and editing, L.B., A.C. and P.P.L.; visualization, A.C. and L.B.; supervision, A.C. and P.P.L. All authors will be informed about each step of manuscript processing, including submission, revision, revision reminder, etc., via emails from our system or the assigned assistant editor. All authors have read and agreed to the published version of the manuscript.

Funding

This research received no external funding.

Institutional Review Board Statement

Not applicable.

Informed Consent Statement

Not applicable.

Data Availability Statement

The authors confirm that all data of this study are available within the article.

Acknowledgments

This work has benefited from the equipment and framework of the COMP-HUB Initiative, funded by the ‘Departments of Excellence’ program of the Italian Ministry for Education, University and Research (MIUR, 2018–2022).

Conflicts of Interest

The authors declare no conflict of interest. The funders had no role in the design of the study; in the collection, analyses, or interpretation of data; in the writing of the manuscript, or in the decision to publish the results.

References

  1. Pliny the Elder. The Elder Pliny’s Chapters on the History of Art, Eds and Trans; Jex-Blake, K., Sellers, E., Eds.; Ares Publishers: Chicago, IL, USA, 1977. [Google Scholar]
  2. Vitruvius; Morgan, M.H. (Eds.) De Architectura Libri Decem, II (Materials) and VII (Finishes and Colours); Kessinger Publishing: Whitefish, MT, USA, 2005. [Google Scholar]
  3. Cuní, J. What do we know of Roman wall painting technique? Potential confounding factors in ancient paint media analysis. Herit. Sci. 2016, 4, 44. [Google Scholar] [CrossRef] [Green Version]
  4. Mora, P.; Mora, L.; Philippot, P. La Conservazione Delle Pitture Murali; Bresciani, S.r.l., Ed.; Editrice Compositori: Bologna, Italy, 1999. [Google Scholar]
  5. Casoli, A. Research on the organic binders in archaeological wall paintings. Appl. Sci. 2021, 11, 9179. [Google Scholar] [CrossRef]
  6. Wagner, B.; Sabbatini, L.; Van der Werf, I.D. (Eds.) Chemical analysis in cultural heritage. Anal. Bioanal. Chem. 2020, 412, 7047–7048. [Google Scholar] [CrossRef]
  7. Casoli, A.; Musini, P.C.; Palla, G. Gas chromatographic-mass spectrometric approach to the problem of characterizing binding media in paintings. J. Chromatogr. A 1996, 731, 237–246. [Google Scholar] [CrossRef]
  8. Colombini, M.P.; Andreotti, A.; Bonaduce, I.; Modugno, F.; Ribechini, E. Analytical Strategies for Characterizing Organic Paint Media Using Gas Chromatography/Mass Spectrometry. Acc. Chem. Res. 2010, 43, 715–727. [Google Scholar] [CrossRef]
  9. Ribechini, E.; Modugno, F.; Colombini, M.P.; Evershed, R.P. Gas chromatographic and mass spectrometric investigations of organic residues from Roman glass unguentarla. J. Chromatog. A 2008, 1183, 158–169. [Google Scholar] [CrossRef]
  10. Jiménez, J.J.; Bernal, J.L.; del Nozal, M.J.; Martín, M.T.; Bernal, J. Sample preparation methods for beeswax characterization by gaschromatography with flame ionization detection. J. Chromatog. A 2006, 1129, 262–272. [Google Scholar] [CrossRef]
  11. Tulloch, A.P. Beeswax-composition and analysis. Bee World 1980, 61, 47–62. [Google Scholar] [CrossRef]
  12. Mills, J.S.; White, R. The Organic Chemistry of Museum Objects; Butterworth Heinemann: Oxford, UK, 1994. [Google Scholar]
  13. Hunter, J. Observation on bees. Philos. Trans. R. Soc. Lond. B Biol. Sci. 1792, 82, 128–196. [Google Scholar]
  14. Heron, C.; Nemcek, N.; Bonfield, K.; Dixon, D.; Ottaway, B.S. The chemistry of Neolithic beeswax. Naturwissenschaften 1994, 81, 266. [Google Scholar] [CrossRef]
  15. Evershed, R.P.; Vaughan, S.J.; Dudd, S.N.; Soles, J.S. Fuel for thought? Beeswax in lamps and conical cups from late Minoan Crete. Antiquity 1997, 71, 979–985. [Google Scholar] [CrossRef]
  16. Kakoulli, I. Late Classical and Hellenistic painting techniques and materials: A review of the technical literature. Stud. Conserv. 2002, 47, 56–67. [Google Scholar] [CrossRef]
  17. Buckley, S.A.; Clark, K.A.; Evershed, R.P. Complex organic chemical balms of Pharaonic animal mummies. Nature 2004, 431, 294. [Google Scholar] [CrossRef]
  18. Colombini, M.P.; Giachi, G.; Modugno, F.; Pallecchi, P.; Ribechini, E. The Characterization of paints and waterproofing materials from the shipwrecks found at the archeological site of the Etruscan and roman harbour of Pisa. Archaeometry 2003, 45, 659–674. [Google Scholar] [CrossRef]
  19. Pliny the Elder, Naturalis Historia, Liber XXXV, 122–150. Available online: https://la.wikisource.org/wiki/Naturalis_Historia/Liber_XXXV (accessed on 15 March 2022).
  20. Languri, G.M.; Boon, J. Between Myth and Reality: Mummy Pigment from The Hafkenscheid Collection. Stud. Conserv. 2005, 50, 161–178. [Google Scholar] [CrossRef]
  21. Miliani, C.; Daveri, A.; Spaabaek, L.; Romani, A.; Manuali, V.; Sgamellotti, A.; Brunetti, B.G. Bleaching of red lake paints in encaustic mummy portraits. Appl. Phys. A 2010, 100, 703–711. [Google Scholar] [CrossRef]
  22. Salvant, J.; Williams, J.; Ganio, M.; Casadio, F.; Daher, C.; Sutherland, K.; Monico, L.; Vanmeert, F.; De Meyer, S.; Janssens, K.; et al. A roman egyptian painting workshop: Technical investigation of the portraits from Tebtunis, Egypt. Archaeometry 2018, 60, 815–833. [Google Scholar] [CrossRef]
  23. Cuní, J.; Cuní, P.; Eisen, B.; Savizky, R.; Bové, J. Characterization of the binding medium used in Roman encaustic paintings on wall and wood. Anal. Methods 2012, 4, 659–669. [Google Scholar] [CrossRef]
  24. Casoli, A.; Santoro, S. Organic materials in the wall paintings in Pompei: A case study of Insula del Centenario. Chem. Cent. J. 2012, 6, 107. [Google Scholar] [CrossRef] [Green Version]
  25. D′Alconzo, P. Picturae Excisae: Conservazione e Restauro Dei Dipinti ercolanesi e Pompeiani Tra il 18° e 19° Secolo; L’Erma di Bretschneider: Roma, Italy, 2002. [Google Scholar]
  26. Duran, A.; Jimenez De Haro, M.C.; Perez-Rodriguez, J.L.; Franquelo, M.L.; Herrera, L.K.; Justo, A. Determination of pigments and binders in Pompeian wall paintings using synchrotron Radiation—high-resolution x-ray powder diffraction and conventional spectroscopy—chromatography. Archaeometry 2010, 52, 286–307. [Google Scholar] [CrossRef]
  27. Amadori, M.L.; Barcelli, S.; Poldi, G.; Ferrucci, F.; Andreotti, A.; Baraldi, P.; Colombini, M.P. Invasive and non-invasive analyses for knowledge and conservation of Roman wall paintings of the Villa of the Papyri in Herculaneum. Microchem. J. 2015, 118, 183–192. [Google Scholar] [CrossRef]
  28. Chen, J.C.T.; Amar, A.P.; Levy, M.L.; Apuzzo, M.L.J. The development of anatomical art and sciences: The ceruplastica anatomical models of la Specola. Neurosurgery 1999, 45, 883–891. [Google Scholar] [CrossRef]
  29. Regert, M.; Langlois, J.; Colinart, S. Characterisation of wax works of art by gas chromatographic procedures. J. Chromatog. A 2005, 1091, 124–136. [Google Scholar] [CrossRef]
  30. Cole, L.J.; Brown, J.B. Chromatographic isolation of the original constituents of natural waxes. The composition of ouricuri wax. J. Am. Oil Chem. Soc. 1960, 37, 359–364. [Google Scholar] [CrossRef]
  31. Colombini, M.P.; Modugno, F. Organic Materials in Art and Archaeology; John Wiley and Sons, Ltd.: Chichester, UK, 2009; pp. 3–36. [Google Scholar]
  32. Elder, R.L. Final Report on the Safety Assessment of Candelilla Wax, Carnauba Wax, Japan Wax, and Beeswax. Int. J. Toxicol. 1984, 3, 1–41. [Google Scholar] [CrossRef]
  33. Horie, C.V. Materials for Conservation. Organic Consolidants, Adhesives and Coatings; Butterworth-Heinemann: London, UK, 1987. [Google Scholar] [CrossRef]
  34. Hodge, W.H.; Sineath, H.H. The Mexican candelilla plant and its wax. Econ. Bot. 1956, 10, 134–154. [Google Scholar] [CrossRef]
  35. Rojas-Molina, R.; De León-Zapata, M.A.; Saucedo-Pompa, S.; Aguilar-Gonzalez, M.A.; Aguilar, C.N. Chemical and structural characterization of Candelilla (Euphorbia antisyphilitica Zucc.). J. Med. Plant Res. 2013, 7, 702–705. [Google Scholar] [CrossRef]
  36. Béarat, H.; Fuchs, M.; Maggetti, M.; Paunier, D. (Eds.) Material, Techniques, Analysis and Conservation. In Proceedings of the International Workshop “Roman Wall Paintings”, Fribourg, Switzerland, 7–9 March 1996; Institute of Mineralogy and Petrography: Fribourg, Switzerland, 1997. [Google Scholar]
  37. Barbet, A. La Peinture Murale Romaine: Les Styles Décoratifs Pompéiens; Picard édit.: Paris, France, 1985. [Google Scholar]
  38. Mazurek, J.; Svoboda, M.; Schilling, M. GC/MS Characterization of Beeswax, Protein, Gum, Resin, and Oil in Romano-Egyptian Paintings. Heritage 2019, 2, 1960–1985. [Google Scholar] [CrossRef] [Green Version]
  39. Pronti, L.; Romani, M.; Viviani, G.; Stani, C.; Gioia, P.; Cestelli-Guidi, M. Advanced methods for the analysis of Roman wall paintings: Elemental and molecular detection by means of synchrotron FT-IR and SEM micro-imaging spectroscopy. Rend. Fis. Acc. Lincei 2020, 31, 485–493. [Google Scholar] [CrossRef]
  40. Evershed, R.P.; Ciliberto, E.; Spoto, G. (Eds.) Modern Analytical Methods in Art and Archaeology; Wiley-Interscience: New York, NY, USA, 2000; p. 177. [Google Scholar]
  41. Bergamonti, L.; Graiff, C.; Tegoni, M.; Predieri, G.; Bellot-Gurlet, L.; Lottici, P.P. Raman and NMR kinetics study of the formation of amidoamines containing N-hydroxyethyl groups and investigations on their Cu (II) complexes in water. Spectrochim. Acta A Mol. Biomol. Spectrosc. 2017, 171, 515–524. [Google Scholar] [CrossRef]
  42. Patnaik, P. Dean’s Analytical Chemistry Handbook; McGraw-Hill Education: New York, NY, USA, 2004. [Google Scholar]
  43. Bucio, A.; Moreno-Tovar, R.; Bucio, L.; Espinosa-Dávila, J.; Anguebes-Franceschi, F. Characterization of beeswax, candelilla wax and paraffin wax for coating cheeses. Coatings 2021, 11, 261. [Google Scholar] [CrossRef]
  44. Gorce, J.P.; Spells, S.J. Structural information from progression bands in the FTIR spectra of long chain n-alkanes. Polymer 2002, 43, 4043–4046. [Google Scholar] [CrossRef]
  45. Stacey, R.J.; Dyer, J.; Mussell, C.; Lluveras-Tenorio, A.; Colombini, M.P.; Duce, C.; La Nasa, J.; Cantisani, E.; Prati, S.; Sciutto, G.; et al. Ancient encaustic: An experimental exploration of technology, ageing behaviour and approaches to analytical investigation. Microchem. J. 2018, 138, 472–487. [Google Scholar] [CrossRef]
  46. Invernizzi, C.; Rovetta, T.; Licchelli, M.; Malagodi, M. Mid and near-infrared reflection spectral database of natural organic materials in the cultural heritage field. Int. J. Anal. Chem. 2018, 16, 7823248. [Google Scholar] [CrossRef]
  47. Regert, M.; Colinart, S.; Degrand, L.; Decavallas, O. Chemical alteration and use of beeswax through time: Accelerated ageing tests and analysis of archaeological samples from various environmental contexts. Archaeometry 2001, 43, 549–569. [Google Scholar] [CrossRef]
  48. Lattuati-Derieux, A.; Egasse, C.; Regert, M.; Chung, Y.J.; Lavédrine, B. Characterization and degradation pathways of ancient Korean waxed papers. J. Cult. Herit. 2009, 10, 422–427. [Google Scholar] [CrossRef]
  49. Edwards, H.G.; Farwell, D.W.; Daffner, L. Fourier-transform Raman spectroscopic study of natural waxes and resins. I. Spectrochim. Acta A Mol. Biomol. Spectrosc. 1996, 52, 1639–1648. [Google Scholar] [CrossRef]
  50. Nyquist, R.A. Interpreting Infrared, Raman, and Nuclear Magnetic Resonance Spectra; Academic Press: Cambridge, MA, USA, 2001. [Google Scholar]
  51. Vandenabeele, P.; Wehling, B.; Moens, L.; Edwards, H.; De Reu, M.; Van Hooydonk, G. Analysis with micro-Raman spectroscopy of natural organic binding media and varnishes used in art. Anal. Chim. Acta 2000, 407, 261–274. [Google Scholar] [CrossRef]
  52. Asperger, A.; Engewald, W.; Fabian, G. Analytical characterization of natural waxes employing pyrolysis–gas chromatography–mass spectrometry. J. Anal. Appl. Pyrolysis 1999, 50, 103–115. [Google Scholar] [CrossRef]
  53. Andreotti, A.; Bonaduce, I.; Colombini, M.P.; Gautier, G.; Modugno, F.; Ribechini, E. Combined GC/MS Analytical Procedure for the Characterization of Glycerolipid, Waxy, Resinous, and Proteinaceous Materials in a Unique Paint Microsample. Anal. Chem. 2006, 78, 4490–4500. [Google Scholar] [CrossRef]
  54. Asperger, A.; Engewald, W.; Fabian, G. Thermally assisted hydrolysis and methylation–a simple and rapid online derivatization method for the gas chromatographic analysis of natural waxes. J. Anal. Appl. Pyrolysis 2001, 61, 91–109. [Google Scholar] [CrossRef]
  55. Was, E.; Szczesna, T.; Rybak-Chmielewska, H. Efficiency of GC-MS method in detection of beeswax adulterated with paraffin. J. Apic. Sci. 2016, 60, 145. [Google Scholar] [CrossRef] [Green Version]
  56. Špaldoňová, A.; Havelcová, M.; Lapčák, L.; Machovič, V.; Titěra, D. Analysis of beeswax adulteration with paraffin using GC/MS, FTIR-ATR and Raman spectroscopy. J. Apic. Res. 2021, 60, 73–83. [Google Scholar] [CrossRef]
  57. Bell, I.M.; Clark, R.J.H.; Gibbs, P.J.C. Raman spectroscopic library of natural and synthetic pigments (pre- ≈ 1850 AD). Spectrochim. Acta A Mol. Biomol. Spectrosc. 1997, 53, 2159–2179. [Google Scholar] [CrossRef]
  58. Price, B.; Pretzel, B.; Quillen Lomax, S. (Eds.) Infrared and Raman Users Group Spectral Database, 2007; IRUG: Philadelphia, PA, USA, 2009; Available online: www.irug.org (accessed on 20 June 2022).
  59. Bersani, D.; Lottici, P.P. Raman spectroscopy of minerals and mineral pigments in archaeometry. J. Raman Spectrosc. 2016, 47, 499–530. [Google Scholar] [CrossRef]
  60. Salvadori, B.; Errico, V.; Mauro, M.; Melnik, E.; Dei, L. Evaluation of gypsum and calcium oxalates in deteriorated mural paintings by quantitative FTIR spectroscopy. Spectrosc. Lett. 2003, 36, 501–513. [Google Scholar] [CrossRef]
  61. Fikri, I.; El Amraoui, M.; Haddad, M.; Ettahiri, A.S.; Falguères, C.; Bellot-Gurlet, L.; Lamhasni, T.; Lyazidi, S.A.; Bejjit, L. Raman and ATR-FTIR analyses of medieval wall paintings from al-Qarawiyyin in Fez (Morocco). Spectrochim. Acta A Mol. Biomol. Spectrosc. 2022, 280, 121557. [Google Scholar] [CrossRef]
  62. Mazzeo, R.; Prati, S.; Quaranta, M.; Joseph, E.; Kendix, E.; Galeotti, M. Attenuated total reflection micro FTIR characterisation of pigment–binder interaction in reconstructed paint films. Anal. Bioanal. Chem. 2008, 392, 65–76. [Google Scholar] [CrossRef]
  63. Bruni, S.; Cariati, F.; Casadio, F.; Toniolo, L. Spectrochemical characterization by micro-FTIR spectroscopy of blue pigments in different polychrome works of art. Vib. Spectrosc. 1999, 20, 15–25. [Google Scholar] [CrossRef]
  64. Brøns, C.; Rasmussen, K.L.; Melchiorre Di Crescenzo, M.; Stacey, R.; Lluveras-Tenorio, A. Painting the Palace of Apries I: Ancient binding media and coatings of the reliefs from the Palace of Apries, Lower Egypt. Herit. Sci. 2018, 6, 6. [Google Scholar] [CrossRef]
  65. Maia, M.; Barros, A.I.; Nunes, F.M. A novel, direct, reagent-free method for the detection of beeswax adulteration by single-reflection attenuated total reflectance mid-infrared spectroscopy. Talanta 2013, 107, 74–80. [Google Scholar] [CrossRef]
  66. Aliatis, I.; Bersani, D.; Campani, E.; Casoli, A.; Lottici, P.P.; Mantovan, S.; Marino, I.G. Pigments Used in Roman Wall Paintings in the Vesuvian Area. J. Raman Spectrosc. 2010, 41, 1537–1542. [Google Scholar] [CrossRef]
  67. Skovmøller, A.; Brøns, C.; Sargent, M.L. Egyptian blue: Modern myths, ancient realities. J. Rom. Archaeol. 2016, 29, 371–387. [Google Scholar] [CrossRef]
  68. Mazzocchin, G.A.; Minghelli, S.; Rudello, D. Pitture Parietali Romane ad Ercolano.Analisi Dei Pigmenti; Coralini, A., Ed.; Vesuviana. Archeologie a Confronto; Atti del Convegno Internazionale; Ante Quem Editoria: Bologna, Italy, 2009. [Google Scholar]
  69. Piqué, F.; MacDonald-Korth, E.; Rainer, L. Observations on Materials and Techniques Used in Roman Wall Paintings of the Tablinum, House of the Bicentenary at Herculaneum. In Beyond Iconography: Materials, Methods, and Meaning in Ancient Surface Decoration: Selected Papers on Ancient Art and Architecture; Lepinski, S., McFadden, S., Eds.; Archaeological Institute of America: Boston, MA, USA, 2015; Volume 1, pp. 57–76. [Google Scholar]
  70. Rainer, L.H.; Graves, K.; Maekawa, S.; Gittins, M.; Piqué, F. Conservation of the Architectural Surfaces in the Tablinum of the House of the Bicentenary, Herculaneum: Phase 1, Examination, Investigations, and Condition Assessment; Getty Conservation Institute: Los Angeles, CA, USA, 2017. [Google Scholar]
  71. Bersani, D.; Lottici, P.P.; Casoli, A. Case study: Micro-Raman and GC/MS of frescoes. In Raman Spectroscopy in Archaeology and Art History; Edwards, H.G.M., Chalmers, J.M., Eds.; RSC—Analytical Spectroscopy Monographs: London, UK, 2005; pp. 130–141. [Google Scholar]
  72. Sotiropoulou, S.; Sciutto, G.; Tenorio, A.L.; Mazurek, J.; Bonaduce, I.; Prati, S.; Mazzeo, R.; Schilling, M.; Colombini, M.P. Advanced analytical investigation on degradation markers in wall paintings. Microchem. J. 2018, 139, 278–294. [Google Scholar] [CrossRef] [Green Version]
  73. Cariati, F.; Rampazzi, L.; Toniolo, L.; Pozzi, A. Calcium Oxalate Films on Stone Surfaces: Experimental Assessment of the Chemical Formation. Stud. Conserv. 2000, 45, 180–188. [Google Scholar] [CrossRef]
  74. Peris-Vicente, J.; Adelantado, J.G.; Carbó, M.D.; Castro, R.M.; Reig, F.B. Characterization of waxes used in pictorial artworks according to their relative amount of fatty acids and hydrocarbons by gas chromatography. J. Chromatog. A 2006, 1101, 254–260. [Google Scholar] [CrossRef]
  75. Čížová, K.; Vizárová, K.; Ház, A.; Vykydalová, A.; Cibulková, Z.; Šimon, P. Study of the degradation of beeswax taken from a real artefact. J. Cult. Herit. 2019, 37, 103–112. [Google Scholar] [CrossRef]
  76. Bonvehi, J.S.; Bermejo, F.O. Detection of adulterated commercial Spanish beeswax. Food Chem. 2012, 132, 642–648. [Google Scholar] [CrossRef] [PubMed]
  77. Jiménez, J.J.; Bernal, J.L.; del Nozal, M.J.; Toribio, L.; Bernal, J. Detection of beeswax adulterations using concentration guide-values. Eur. J. Lipid Sci. Technol. 2007, 109, 682–690. [Google Scholar] [CrossRef]
  78. Gehad, B.; Aly, M.F.; Marey, H. Identification of the Byzantine encaustic mural painting in Egypt. Mediterr. Archaeol. Ar. 2015, 15, 243–256. [Google Scholar] [CrossRef]
Figure 1. (a) FTIR spectra of natural waxes: beeswax (A), spermaceti (B), lanolin (C), carnauba (D) and candelilla (E). (b) FTIR spectra of artificial and mineral waxes: formulated candelilla (F), microcrystalline (G) and paraffin (H).
Applsci 12 11264 g001
Figure 2. (a) Raman spectra of natural waxes: (A) beeswax; (B) spermaceti; (C) lanolin; (D) carnauba; (E) candelilla. (b) Raman spectra of artificial and mineral waxes: (F) formulated candelilla, (G) microcrystalline, (H) paraffin.
Applsci 12 11264 g002aApplsci 12 11264 g002b
Figure 3. Comparison of the GC traces of the natural waxes: (a) beeswax, spermaceti, candelilla and carnauba; (b) lanolin (in the insert, the magnification of the 20–30 min range). A = alcohol and FA = fatty acid. The peak number is reported in the first column of Table 2.
Applsci 12 11264 g003
Figure 4. Comparison of the GC traces of the mineral and artificial waxes. The peak number is reported in the first column of Table 2.
Applsci 12 11264 g004
Figure 5. FTIR spectra from wall-painting fragments AC 18, AC 21, AC 22, AC 23 and AC 26. The letters indicate features typical of: a aragonite, c calcite, Δ Egyptian blue, g gypsum, h hematite, p protein, q quartz, w wax. Asterisks indicate calcium oxalate features.
Applsci 12 11264 g005
Figure 6. Raman spectra from wall painting samples AC 18, AC 21, AC 22, AC 23 and AC 26. The letters indicate the features typical of: a aragonite, c calcite, Δ Egyptian blue, q quartz, g gypsum, h hematite, w wax.
Applsci 12 11264 g006
Figure 7. Total ion chromatogram of the wall painting samples AC 17, AC 20 and AC 25. For peak identification, see Table 2.
Applsci 12 11264 g007
Figure 8. Weight percentage of the fatty acids, alcohols and odd and even hydrocarbons, in contemporary reference waxes (a) and in archaeological samples (b).
Applsci 12 11264 g008
Table 1. Description of the collected samples from Herculaneum houses.
Sampling SiteSampling PointSample Name, Description and Analyses
House of the Skeleton
(Insula III)
Oecus 10, north wall of triclinium, apse
Applsci 12 11264 i001AC 17
Green decoration
GC/MS
House of the Skeleton
(Insula III)
Oecus 10, north wall of triclinium, apse
Applsci 12 11264 i002AC 18
Blue decoration
FTIR and Raman spectroscopies
House of the Deer
(Insula IV)
Oecus 17, East wall,
II panel, detail of painted decoration from the column
Applsci 12 11264 i003AC 20
White decoration on a red ground
GC/MS
House of the Deer
(Insula IV)
Oecus 17, East wall,
II-sn panel detail of painted decoration from the column
Applsci 12 11264 i004
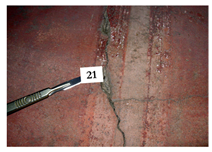
AC 21
Red decoration
FTIR and Raman spectroscopies
House of the Deer
(Insula IV)
Oecus 16, East wall,
bottom panel
Applsci 12 11264 i005AC 22
Blue paint
FTIR and Raman spectroscopies
House of the Deer
(Insula IV)
Oecus 7, Tablinum,
East wall II-sn, dark vertical band
Applsci 12 11264 i006AC 23
Red paint
FTIR and Raman spectroscopies
House of the Double Atrium
(Insula VI)
Oecus 7, East wall
Applsci 12 11264 i007AC 25
Red decoration
GC/MS
House of the Double Atrium
(Insula VI)
Oecus 7, East wall
Applsci 12 11264 i008AC 26
Red decoration
FTIR and Raman spectroscopies
Table 2. Identified compounds in the total ion chromatogram of wax samples. Reference waxes: B beeswax, L lanolin, S spermaceti, CN candelilla, CB carnauba, FC formulated candelilla, MC microcrystalline, P paraffin. Samples: AC 17, AC 20, AC 25.
Peak Identified CompoundFormulaReference WaxesSamples
1Decanol (capric alcohol)C10H22OL
2Decanoic acid (caprylic acid)C10H20O2CN, S, LAC 17, AC 20, AC 25
3Dodecanol (lauryl alcohol)C12H26OS, L
4Dodecanoic acid (lauric acid)C12H24O2B, LAC 17, AC 20, AC 25
5Tetradecanol (myristyl alcohol)C14H30OB, S, LAC 17, AC 20, AC 25
6Tetradecanoic acid (myristic acid)C14H28O2B, LAC 25
7NonadecaneC19H40B AC 17, AC 20
8Methyl hexadecanoate (methyl palmitate)C17H34O2B, S, FCAC 17, AC 20, AC 25
9Hexadecanol (cetyl alcohol, palmityl alcohol)C16H34OS, L, FC
ISEicosane (internal standard)C20H42
10Hexadecanoic acid (palmitic acid)C16H34O2B, S, LCN, CB, FCAC 20, AC 25
11HeneicosaneC21H44B, FC, MC, PAC 17, AC 25
12Methyl octadecanoate (methyl stearate)C19H38O2B, FCAC 17, AC 25
13Octadecanol (stearyl alcohol)C18H38OB, S, L, FC
14DocosaneC22H46CN, FC, MC, PAC 17, AC 20, AC 25
15Octadecenoic acid (oleic acid)C18H34O2B, L
16Octadecanoic acid (stearic acid)C18H36O2B, L, CN, CB, FCAC 20, AC 25
17TricosaneC23H48B, FC, MC, PAC 20, AC 25
18Eicosanol (arachidyl alcohol)C20H42OB, LAC 20, AC 25
19TetracosaneC24H50FC, MC, PAC 17, AC 20, AC 25
20Eicosenoic acidC20H38O2B, L
21Eicosanoic acid (arachidic acid)C20H40O2B, CN, CBAC 17
22PentacosaneC25H52B, FC, MC, PAC 17, AC 20, AC 25
23Docosanol (behenyl alcohol)C22H46OB, L, CB, FCAC 17, AC 20, AC 25
24HexacosaneC26H54B, FC, MC, PAC 17, AC 20, AC 25
25Docosanoic acid (behenic acid)C22H44O2B, L, CN, CBAC 17, AC 25
26HeptacosaneC27H56B, CB, FC, MC, PAC 17, AC 20, AC 25
27Tetracosanol (lignoceryl alcohol)C24H50OB, CN, CBAC 17, AC 20, AC 25
28OctacosaneC28H58B, CN, FC, MC, PAC 17, AC 20, AC 25
29Tetracosanoic acid (lignoceric acid)C24H48O2B, CN, CBAC 17, AC 20, AC 25
30NonacoseneC29H58B, CB
31NonacosaneC29H60B, CN, CB, FC, MC, PAC 17, AC 20, AC 25
32Hexacosanol (ceryl alcohol)C26H54OB, CN, CBAC 17, AC 20, AC 25
33TriacontaneC30H62CN, FC, MC, PAC 17, AC 20, AC 25
34Methyl hexacosanoateC27H54O2BAC 17, AC 20, AC 25
35Hexacosanoic acid (cerotic acid)C26H52O2B, L, CB
36EptacosanolC27H56OB, L
37HentriaconteneC31H62B, CB, FC
38HentriacontaneC31H64B, CN, CB, FC, MC, PAC 17, AC 20, AC 25
39Octacosanol (montanyl alcohol)C28H58OB, L, CN, CBAC 17, AC 20, AC 25
40DotriacontaneC32H66B, CN, FC, MC, PAC 17, AC 20, AC 25
41Methyl octacosanoate (cerotic acid methyl Ester)C29H58O2BAC 17, AC 20, AC 25
42Octacosanoic acid (montanic acid)C28H56O2B, L, CN, CB
43TritriaconteneC33H66B, CN, CBAC 17, AC 20, AC 25
44TritriacontaneC33H68B, CB, FC, MC, PAC 17, AC 20, AC 25
45Triacontanol (myricyl alcohol)C30H62OB, L, CN, CB, FCAC 20, AC 25
46Hexadecyl hexadecanoate (cetyl palmitate)C32H64O2S, FC
47Methyl dotriacontanoate C33H66O2CN
48Dotriacontanoic acid (lacceroic acid)C32H64O2B, L
49PentatriaconteneC35H70CN, CB
50PentatriacontaneC35H72CB, FC, MC
Table 3. Weight percentage (wt %) of fatty acids (FA), alcohols (A), odd alkanes (OA) and even alkanes (EA) and FA/A and OA/EA ratios found by GC data in wall painting samples and contemporary reference waxes.
SampleFatty Acids (FA) (wt %)Alcohols (A) (wt %)FA/AOdd Alkanes (OA) (wt %)Even Alkanes (EA) (wt %)OA/EA
AC 172.988.610.3530.8457.610.54
AC 201.263.280.3835.8759.580.60
AC 2510.014.652.1633.4751.890.65
Beeswax10.4325.870.4062.691.5860.74
Spermaceti21.0879.120.27--
Carnauba55.5137.541.486.620.3320.06
Candelilla15.0414.091.0770.080.7988.23
Lanoline41.7558.250.72--
F-Candelilla22.067.502.9428.8240.720.71
Microcrystalline14.61--56.4428.951.95
Paraffin---48.5051.600.95
Publisher’s Note: MDPI stays neutral with regard to jurisdictional claims in published maps and institutional affiliations.

