Abstract
It is difficult to adapt the traditional section margin distribution method to the power system with a high proportion of renewable energy generation (REG). This paper proposes a section margin allocation method of REG clusters considering the randomness of source and load power. Firstly, the probability density function of the predicted REG power error is estimated, the probability that REG stations meet the output command after the section margin distribution is calculated, and the output realization probability of each REG station is discussed. The typical operation mode set of the REG cluster is then obtained by clustering the REG stations according to the operation history, and the load rise space of the REG cluster under each typical operation mode is calculated. Considering the randomness of REG power and its load power, the section margin is allocated to each REG station in the REG cluster so as to ensure that each REG station reaches the highest output probability. On the premise of ensuring the safe and stable operation of the grid, this method facilitates the management of REG clusters and the accommodation capacity of the power system for REG. Simulations of the power system of IEEE 39 nodes verify the rationality and validity of the section margin allocation method.
1. Introduction
At the 26th United Nations Conference of Parties on Climate Change (COP26) in 2021, China stated that it will further reduce carbon emissions. New energy sources will maintain a continuous high rate of development, with a high proportion of new energy sources having a profound impact on grid operation and dispatch [1,2,3,4,5].
In the renewable energy power transmission channel, there is a margin in the cross section, when the transmission power of the cross section does not reach the upper limit of the transmittable power of the section. When there is a margin on the section, renewable energy generation(REG) stations with increasing output capability should be enabled to increase the active power as much as possible to make full use of the margin on the section [6,7,8]. Section margin is one of the key constraints to formulating dispatching strategies in the power system dispatching process, and plays a role in determining the upper limit of the overall transmission capacity in the process of power system dispatching [9,10,11,12]. On the premise of ensuring the safe and stable operation of the system, the reasonable configuration of the section margin can strengthen the transmission capacity of the section and improve the system’s ability to consume renewable energy.
REG clusters are one of the key components of the grid development [13]. A REG cluster includes a collection of REG stations, as well as the network topology among the stations and the loads connected on the network. The change in REG cluster topology, caused by open-loop and closed-loop operations of renewable energy generation clusters, as well as the change in load within the clusters, means that renewable energy generation clusters exist in complex and variable operation modes. The change in the operation mode will bring about changes in many parameters of the power generation cluster, which will have a great impact on the safe and economic operation of the transmission cross section [14,15]. In conventional grids, due to the relatively small proportion of renewable energy and the relatively fixed scale and direction of the power flow, the typical operation mode of the system can be selected from the peaks, valleys and normal periods in the historical data of the system [16]. The traditional method of section margin allocation normally uses manual dispatching. The dispatching department selects the limit mode of power generation cluster operation and calculates the upper limit of transmittable power for each section based on the dynamic thermal stability and voltage stability calibration values of each section [17]. The dispatcher assigns the section margin to each station according to the upper limit of the transmissible power of the section, the power generation index of the REG station and the operation of the power grid [18]. This method is only suitable for situations where there are few cross section constraints, and the adjustment objects are mainly traditional generator sets with stable and controllable power generation. However, the output of renewable energy sources, such as wind or photovoltaic, is random, and is significantly influenced by external meteorological conditions. It has large fluctuations in output and is weakly adjustable, making the traditional method of section margin allocation difficult to apply.
At present, there are some methods of section margin allocation for REG clusters. Reference [19] proposes a method of allocating section margins according to the proportion of the installed capacity of REG stations in the cluster to the total installed capacity of the REG cluster. This method is simple and fast to calculate, while ensuring the power generation of large-capacity REG stations in the cluster, reflecting the principle of prioritizing large stations. However, the above method is prone to different wind and light conditions due to the different geographical locations and natural conditions of each station. This leads to the problem that REG stations that are capable of generating more power are limited by power generation indicators and curtail wind and photovoltaic energy, and REG stations with insufficient wind and photovoltaic conditions cannot meet the established power generation indicators. Reference [20] proposes a section margin allocation method with the goal of minimizing the amount of wind and photovoltaic curtailment in clusters, reflecting the power generation priority of each REG station to reduce power curtailment. Reference [21], based on the section margin allocation method and with the goal of minimizing the amount of abandoned wind and photovoltaic in the cluster, proposes presenting the power completion status and assessment score indicators of each REG station in the form of weights, and then assigns the section margin by weighting each REG station, which reflects the principle of fair scheduling within the cluster.
On the basis of establishing the active power prediction system for each REG station, it is more and more important and common for ultra-short-term power prediction to be used in various dispatching processes of the power system as important information of new energy stations. References [22,23] propose that each REG station allocates the section margin based on an equal ratio of ultra-short-term power prediction, and considers the specific resource distribution of each REG station, which reflects the refined scheduling of REG clusters.
All of the above methods have the primary objective of making full use of the section margin and increasing the system’s capacity to consume renewable energy. However, when the load within the REG cluster rises, and when the actual output of the REG station is less than the output command after the margin allocation due to the forecast errors, it will result in the REG station being unable to complete the output command issued by the dispatch center. And the transmission power of the section cannot reach the upper limit of the transmittable power of the section, resulting in the waste of resources and reducing the overall transmission capacity of the section. At present, little research has been carried out on the impact of different operating modes of REG clusters on the section margin allocation, the probability of each REG station realizing the command in section margin allocation, and the failure of REG stations to meet the output command after margin allocation due to the forecast errors.
In response to the above problems, this paper proposes a method for allocating section margins that takes into account the randomness of REG stations’ output and load fluctuations under different operating modes on the REG cluster side. This method is based on the probability density function of the prediction error of each REG station, combined with the prediction of the active power output of the REG station, and the introduction of the output realization probability of the REG station, considering the load rise within the REG cluster under different typical operation modes. This method aims at ensuring the highest probability of output after each new energy station is able to meet the margin allocation and allocates the section margin to improve the grid’s ability to consume the renewable energy.
The rest of the paper is organized as follows: Section 2 introduces the proposed section margin allocation model. The calculation methods of the output realization probability of REG stations and load rise space are presented in Section 3 and Section 4, respectively. The simulation results of the proposed section margin allocation method are given in Section 5, and Section 6 concludes the paper.
2. Section Margin Allocation Model
Many of the existing section margin allocation methods do not take into account the probability of the REG stations realizing the power delivery instructions given by the dispatch center after the section margin allocation. If the REG stations cannot meet the output command, the power delivered from the section will not reach the upper limit of transmittable power, thus reducing the renewable energy accommodation capacity of the grid. A conceptual diagram of the renewable energy delivery cross section is shown in Figure 1.
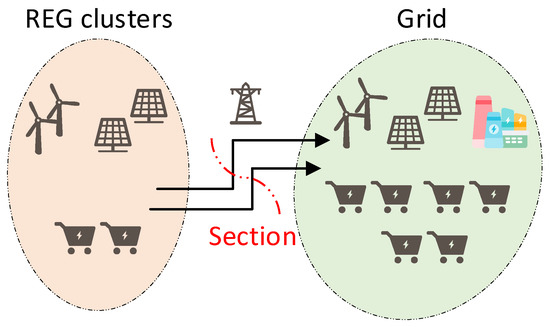
Figure 1.
Concept diagram of the renewable energy delivery cross section.
When the method in this paper is applied to REG clusters, the main role of the REG cluster is to output power to the grid. Therefore, this paper only considers the case where the cross section is in the power delivery state, and does not consider the case where the REG cluster power is in the negative value for the time being.
In this regard, the purpose of the proposed section margin allocation method in this paper is to achieve the full utilization of renewable energy by reasonably allocating the section margin so that the power delivered at the renewable energy delivery section reaches the upper limit of the power that can be delivered at the section as far as possible, provided that the relevant constraints are met.
This paper introduces an output realization probability function for an REG station. The output realization probability function is used to describe the probability that, at a given moment, the active power output of an REG station can be no less than every power value within the rated power. The output realization probability function reflects the probability that the REG station can meet the dispatch instructions after the margin allocation. The output realization probability function for an REG station i at time t is defined as:
where is the active power emitted by REG station i at moment t. is the active power output of the REG station i at moment t adjusted to the section margin requirement, taking into account the generation cluster load rise space.
The objective function of the proposed section margin allocation method is set as the probability that all REG stations in the REG cluster will be able to issue capacity orders after margin allocation, i.e., the product of the probability of achieving capacity at all REG stations.
where is the upper limit of the transmission power of the REG section. is the load power of the REG cluster at time t. N is the number of REG stations in the REG cluster that can participate in cooperative control. is the predicted active power output of the REG station i at time t for the next period. is the rated power of the REG station i; is the margin of the section at time t. is the load rise space of the REG cluster under operation mode j.
The allocation of section margins should take full account of the potential for load uplift within the REG cluster and therefore take into account the potential for load uplift in advance when allocating section margins. However, in order to avoid section transmission power exceeding the limits when actually giving orders, it is necessary to multiply by a factor.
Define the active output of the REG station i at moment t adjusted to the section margin requirement as ; then, is calculated as:
During the dispatch process, the dispatch center actually requires the active power output of the new energy station i at t + 1 of the next dispatch cycle to be:
The proposed section margin allocation process in this paper is shown in Figure 2.
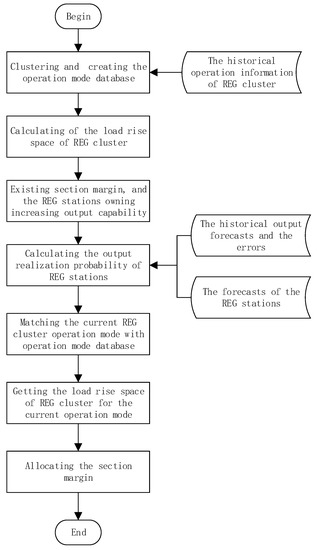
Figure 2.
Flow chart of section margin allocation for REG clusters considering the randomness of source and load power.
Step (1) Calculate the load rise space of the REG cluster under each typical operation mode. Based on the historical topology and load data of the REG clusters, a cluster analysis is performed on the operation mode of the generation clusters. A database of typical operation modes for REG clusters is obtained and the load rise of the REG clusters is calculated for each typical operation mode.
Step (2) Calculate the output realization probability. Based on the historical processing forecast data of each REG station in the REG cluster, including the historical output forecast value of the new energy station, forecast error and forecast influencing factors, the probability density of the predicted REG power error of each REG station is obtained. Combined with the predicted output of each REG station, the output realization probability of each REG station is established.
Step (3) Allocate the section margins. With the objective of maximizing the probability that each REG station in the cluster can meet the output requirements after the margin allocation, the section margin allocation function is established and the final section margin allocation scheme is obtained, taking into account the randomness of the source load.
3. Calculation of the Output Realization Probability of REG Stations
At present, various types of renewable energy power prediction systems can provide the power prediction data of REG stations over different time scales, and the prediction errors basically conform to normal distribution [22,23]. To ensure that each REG station can meet the maximum probability of output requirements, the allocation of the section margin should take into account the accuracy of each REG station’s own power forecast in order to cope with the randomness and uncertainty of renewable energy output caused by the reduction in the output, as well as the fact that the REG station cannot meet the output requirements after the section margin allocation.
Due to the different output forecasting models used by each REG station, as well as different natural conditions such as the geographical location and the meteorological characteristics of the construction, there are differences in the accuracy of the output forecasts of each REG station in the REG cluster [24,25,26,27], which in turn leads to different probability distributions of the output forecast errors of each REG station. The historical output forecasts and the errors between the forecast and the actual values are collected for each REG station, and the probability density function of the predicted REG power error is obtained. The data required to establish the probability density function is the historical forecast error of the power output of the REG station, without regard to the type of renewable energy.
Define the prediction error of the power output of the REG station i at time t as . The probability density function of the predicted REG power error of the REG station i at moment t is . From the historical forecasting information of the REG stations, the forecast errors of the REG station output are basically normally distributed.
The probability density function of the predicted REG power error is:
where is the standard deviation of the probability of prediction error for the REG station i at moment t. is the expectation of the prediction error of the REG station i at moment t. In general, = 0.
function image is shown in Figure 3.
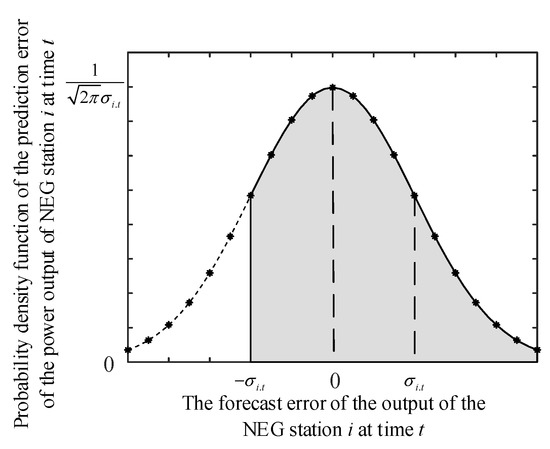
Figure 3.
Probability density function diagram of output prediction error of the REG station.
From Equation (4), the probability density function of the predicted REG power error of the REG station i at moment t is given by
If satisfies
The probability that the REG station i can achieve a power output of at this point is shown in Figure 2.
From Equations (5) and (6), it can be seen that the closer the predicted active power output of a REG station is to its rated active power output, the more accurate the predicted power is, and the greater the probability that the REG station can issue a more active power output, the greater the probability that it can meet the power output command after the margin allocation.
Combining Equations (6) and (7), the output realization probability can be obtained, and the image of the output realization probability of the REG station i to achieve power at moment t is shown in Figure 4.
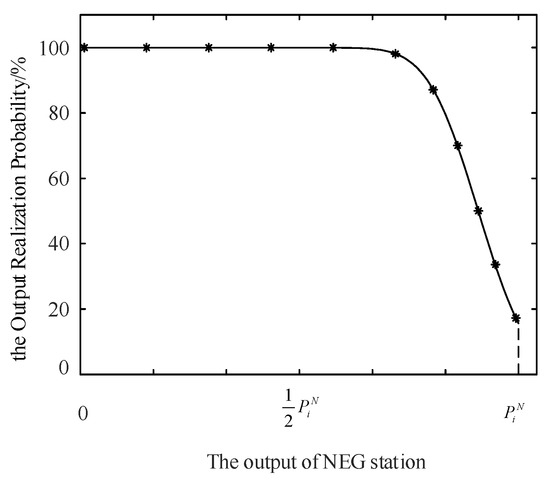
Figure 4.
The output realization probability of the REG station i at moment t.
According to the output realization probability of each REG station, the section margin is reasonably allocated to each REG station, which can ensure that each REG station has the highest probability of meeting the output power command and improve the reliability of the section power transmission.
4. Calculation of the Load Rise Space
In the REG cluster, the factors that affect the power of the delivery section of the REG cluster are the output of the REG stations and the load in the cluster [28].
When the transmission power of the delivery section of the REG cluster reaches the upper limit and the output of each REG station remain unchanged, the load within the cluster increases. This growth triggers a corresponding decrease in the transmission power of the section, and the power cannot reach the upper limit. Before the margin distribution in the next period, the dispatch center of the REG cluster should, according to the actual situation, give timely instructions to increase the power output of the capable REG stations so that the delivery section can be fully utilized and the consumption of new energy can be improved.
Considering the impact of load growth in the REG cluster on the power transmission of the delivery section, a load rise space is introduced to describe the average range of load growth in the REG cluster. The clustering analysis used to study the operation modes of the REG cluster tries to ensure that the load rise space under each type of operation mode is considered when allocating the section margin. This is to make sure that before the dispatch center allocates the margin for the next period, in order to make full use of the capacity of the delivery section, the probability of each new energy station meeting the output requirements is still at its maximum when the dispatch center asks each REG station to increase its output. This ensures that the transmission power of the delivery section meets the upper limit as far as possible and improves renewable energy consumption.
4.1. Clustering Analysis of REG Cluster Operation
The different topologies and load requirements of the REG cluster constitute the complex and variable operation modes of the clusters. According to the historical operation information of the REG cluster, the cluster analysis was carried out on the operation mode of the power generation cluster, and finally several typical operation modes were obtained as the operation mode database of the target REG cluster [29,30,31].
The Denclue clustering method based on density distribution is designed for the clustering analysis of the operation modes of the REG cluster. Considering that each operation mode in the REG cluster has a certain influence on the operation modes close to it [32], the influence of each operation mode can be described by the influence function [33]. The topology and cluster load demand in the REG cluster operation mode are used as the data points studied in the cluster analysis to obtain a two-dimensional array describing the system operation mode.
When the Denclue algorithm is applied to the clustering analysis of the REG cluster operation modes, the impact curve of each operation mode can be approximated as a normal distribution curve [34]. When used for the clustering analysis of typical operation modes of the REG clusters, the Denclue clustering analysis problem, which considers the topology of the cluster and the cluster load demand during operation, belongs to two-dimensional Denclue data. The influence function is:
where is the bandwidth calculated using the Denclue clustering method, reflecting the degree of precision in clustering the operating modes of the system. The smaller the value of , the more typical the operating modes clustered, and the more representative each typical operating mode is of all operating modes in the region. is the topology information of the REG cluster under the operation mode s. is the load of the REG cluster in the operation mode s. is calculated as:
where T is the sum of the running time of all operating modes. is the duration of the operation mode s in time T.
Then, the local density function is:
where S is the total number of operating modes present within the REG cluster during the clustering process.
is set as the identification criterion for the classification of the typical operation mode of the system, and when , the clustered segment is the typical operation mode of the REG cluster. All of the obtained typical operation modes are used as the operation mode library.
When allocating the margin section, the topology and load demand data from the actual operation of the REG fleet are matched with the operation mode database. The matched typical operation mode is selected as the basis for calculation and is involved in the subsequent section margin allocation calculation, thus improving the overall calculation speed.
4.2. Calculation of the Load Rise Space
By considering the space for load rise due to load fluctuations in the allocation of section margins, it is possible to avoid a decrease in the section’s transmission power due to untimely dispatching when the section increases in load.
The typical operation mode of the REG clusters obtained from the cluster analysis is selected, and the load rise space for each typical operation mode of the REG clusters, , is found.
where j is the typical operation mode of each cluster obtained after clustering and analyzing the operation mode of the REG cluster, and J is the total number of typical operation modes. is the load average value of the system under the operation mode j. is the value of the load in the system greater than under the operation mode j. K is the total number of occurrences of .
From Equation (11), it can be seen that the larger the value of the load rise space within the REG cluster, the greater the number and magnitude of loads above the load mean in the operation mode j, resulting in a greater likelihood that the delivery section of the REG cluster will not be able to reach the upper limit of the section’s deliverable power.
In the process of section margin allocation, the current operation mode is matched with the operation mode database to determine what typical operation mode the current operation mode belongs to. Based on the load rise space of each typical operation mode of the REG cluster calculated by Equation (11), the load rise space under the current operation mode is obtained.
In the event that the REG cluster experiences an increase in load, resulting in an underutilized section, and the dispatch center has not carried out a new round of section margin allocation, the dispatch center should quickly issue dispatch instructions to each REG station within the cluster so that the power delivered by the REG cluster to the grid still maintains the section power transmission limit.
5. Numerical Computational Analysis
This paper constructs a 220 kV grid system with a renewable energy generation cluster shown in Figure 4 based on the IEEE39 node system. The regional grid consists of five conventional power plants and four REG stations (PV1, PV2, W1 and W2).
According to the 2020 data of PV plants and wind farms in a certain area, PV1 is a photovoltaic power plant with an installed capacity of 30 MW; PV2 is a photovoltaic power plant with an installed capacity of 90 MW; W1 is a wind power plant with an installed capacity of 90 MW; W2 is a wind power plant with an installed capacity of 120 MW. Detailed data is in Appendix A. The installed capacity of each REG station within the power generation cluster is shown in Table 1.

Table 1.
Installed capacity of each new energy station.
The REG cluster can transmit power to the grid through the section, and the new energy transmission section is shown in Figure 5. The upper limit of the power transmission from the section is set at 270 MW.
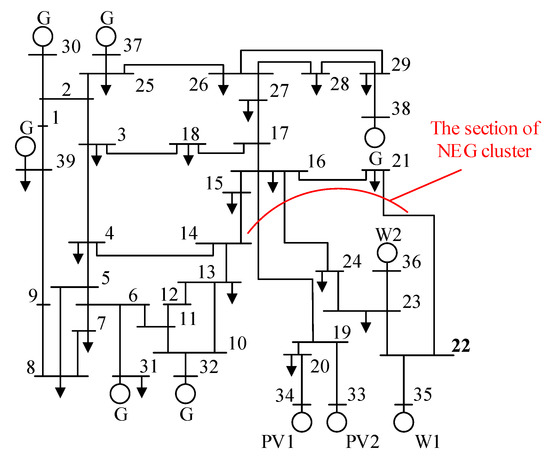
Figure 5.
A 220 kV power grid system with a new REG cluster.
In larger grids, the fluctuations in load at the nodes are relatively small. After clustering and analyzing the historical operating data of the REG cluster, a subsequent analysis was carried out for a typical operating mode in which the upside of the REG cluster load was 4 MW.
Assuming that the actual power delivered by the section is 249 MW at a certain time, the actual operating capacity of each REG station and the expected output of the next period are shown in Table 2.
Table 2.
Actual power output of each REG station/MW.
According to the prediction error model of each REG station (detailed data is in Appendix A), the probability density function of the predicted REG power error was obtained, as shown in Figure 6.
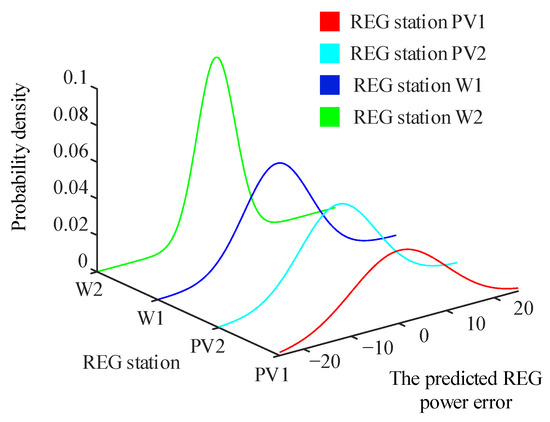
Figure 6.
Probability density function of the predicted REG power error.
According to the predicted output of each REG station and its probability density function, the output realization probability of each REG station can be obtained, as shown in Figure 7.
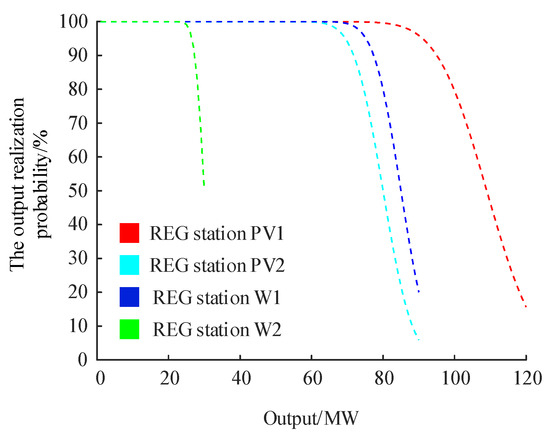
Figure 7.
Probability that each REG station can achieve the expected output.
At this point, the section margin is 21 MW. According to the section margin allocation function, the objective is to maximize the probability that all REG stations in the REG cluster can meet the output command after the margin allocation.
The active output of each REG station adjusted to the section margin requirements is calculated and the results are shown in Table 3.
Table 3.
The output of each REG station in the current and next period/MW.
At this point, the probability that the new output instructions for each REG station will be met after the section margin allocation is at its highest, allowing the section margin to be fully utilized.
We present a comparison of the method used in this paper with other section margin allocation methods.
The average allocation method is method 1.
The proportional allocation method according to the installed capacity of REG stations is method 2 [19].
The allocation method based on the principle of minimum wind and light resources abandonment is method 3 [20].
Each allocation method and the probability of all REG stations being able to complete their output orders when using each allocation method is shown in Table 4.
Table 4.
Comparison of margin allocation methods.
A comparison of the data in Table 4 shows that the section margin allocation method proposed in this paper, which considers the randomness of source and load power, has significant advantages in terms of completion probability compared to other section margin allocation methods.
We analyzed the situation where, after the allocation of section margins, the actual power transmitted by the section of the cluster due to increased load within the REG cluster is lower than the upper limit of the power that can be transmitted by the section, resulting in the section being underutilized. Under the current operation mode, the REG cluster load increase space is 4 MW, thus setting up two scenarios where the actual transmission power of the outgoing section decreases from 270 MW to 267 MW (scenario 1) and 262 MW (scenario 2) due to the increase in cluster load. We calculated the probability that the section margin allocation method proposed in this paper and other section margin allocation methods will be able to complete the output command at each REG station.
Before the dispatch center carries out the next section margin allocation, in order to solve the problem of the underutilization of the section due to the rising load of the renewable energy generation cluster, the dispatch center should, based on the difference between the actual power delivered by the section and the upper limit of the power that can be delivered by the section, give instructions to each REG station in the cluster to increase the output as soon as possible, so as to make full use of the delivery section of the REG cluster. The REG stations are dispatched according to the principle of the equal ratio of the installed capacity, which is easy to calculate, so that the REG clusters can make full use of the outward transmission section.
The probability of each margin allocation method being able to complete new dispatch instructions from the dispatch center for each REG station in response to the underutilization of the section due to cluster load growth is shown in Table 5.
Table 5.
Comparison of margin allocation methods in response to new dispatch instructions.
As can be seen from the data in Table 5, the proposed section margin allocation method in this paper still maintains a high probability in terms of the ability of each new energy site to respond to dispatch instructions compared to other methods when the actual transmission power value of the section is reduced due to the rising load of the renewable energy generation cluster and the capacity of the section is not fully utilized.
6. Conclusions
This paper proposes a section margin allocation method for new energy power generation clusters considering the randomness of source and load power. The conclusions of the study are as follows:
- The more accurate the prediction of the active power output of the new energy station during the margin allocation, the higher the probability that the new energy station can meet the power output command after the margin allocation. After the section margin allocation, the probability of the REG cluster failing to reach the section’s deliverable power limit due to increased load is positively correlated with the REG cluster load upside.
- In this paper, the utilized method takes into account the randomness of the REG station output when assigning the section margin, based on the probability density of the output prediction error of each REG station in the REG cluster and the output prediction value of the REG station. The output realization probability of each REG station is introduced as a key indicator for the section margin allocation, reflecting the accuracy of the REG station output forecast and the influence of the specific resource distribution on the margin allocation. It achieves an increased degree of refinement in the scheduling of REG clusters.
- The method in this paper considers the impact of an increase in the REG cluster load on the section margin allocation under different operation modes of the REG cluster in the process of section margin allocation. This method improves the problem that the section transmission power cannot reach the upper limit and the section cannot be fully utilized due to the increase in load within the REG cluster.
- The method used in this paper considers the load growth within a REG cluster, and aims at the highest probability of each REG station within the cluster meeting the section margin allocation result.
The power grid company should conduct in-depth research and practical application of the section margin allocation strategy for the output section of the REG cluster in order to adapt to the increasing penetration of renewable energy. The complexity of the power system imposes many requirements and constraints on the construction of the theoretical model for the section margin allocation method. The power system properties, including the generating unit ramping rate, and the impact of the large-scale connection of energy storage stations to the grid, still need to be further investigated.
Author Contributions
Conceptualization, J.Y. and C.H.; methodology, J.Y.; software, J.Y.; validation, J.Y. and Y.S.; formal analysis, J.Y. and Y.L.; investigation, J.Y.; resources, J.Y., C.H. and Y.S.; data curation, J.Y. and Y.L.; writing—original draft preparation, J.Y.; writing—review and editing, J.Y., C.H. and Y.S. All authors have read and agreed to the published version of the manuscript.
Funding
This research was funded by the Major Science and Technology Projects in Hunan Province (2020GK1010).
Institutional Review Board Statement
Not applicable.
Informed Consent Statement
Not applicable.
Data Availability Statement
The data presented in this study is available on request from the first author.
Conflicts of Interest
The authors declare that they have no conflict of interest.
Appendix A
Please click on the link to download the appendices of this paper:
Accessed on 1 November 2022.
Password: data
References
- Wu, Z.Y.; Zhou, M.; Wang, J.X.; Tang, W.Y.; Yuan, B.; Li, G.Y. Review on Market Mechanism to Enhance the Flexibility of Power System Under the DualCarbon Target. Proc. CSEE 2022, 1–18. [Google Scholar] [CrossRef]
- Gielen, D.; Gorini, R.; Wagner, N.; Leme, R.; Gutierrez, L.; Prakash, G.; Asmelash, E.; Janeiro, L.; Gallina, G.; Vale, G.; et al. Global Energy Transformation: A Roadmap to 2050, 2019th ed.; International Renewable Energy Agency: Abu Dhabi, United Arab Emirates, 2019. [Google Scholar]
- Le, H.L.; Ilea, V.; Bovo, C. Integrated European intra-day electricity market: Rules, modeling and analysis. Appl. Energy 2019, 238, 258–273. [Google Scholar] [CrossRef]
- Aigner, T.; Jaehnert, S.; Doorman, G.L.; Gjengedal, T. The Effect of Large-Scale Wind Power on System Balancing in Northern Europe. IEEE Trans. Sustain. Energy 2012, 3, 751–759. [Google Scholar] [CrossRef]
- Han, J.; Chang, H. Development and Opportunities of Clean Energy in China. Appl. Sci. 2022, 12, 4783. [Google Scholar] [CrossRef]
- Alseddiqui, J.; Thomas, R.J. Transmission expansion planning using multi-objective optimization. In Proceedings of the 2006 IEEE Power Engineering Society General Meeting, Montreal, QC, Canada, 18–22 June 2006; Volume 8. [Google Scholar] [CrossRef]
- Chung, T.S.; Lee, X.K.; Chen, G.J.; Xie, J.D.; Tang, G.Q. Multi-objective transmission network planning by a hybrid GAapproach with fuzzy decision analysis. Electr. Power Energy Syst. 2003, 25, 187–192. [Google Scholar] [CrossRef]
- Buygi, M.O.; Shanechi, H.M.; Balzer, G.; Shahidehpour, M.; Pariz, N. Network planning in unbundled power systems. IEEE Trans. Power Syst. 2006, 21, 1379–1387. [Google Scholar] [CrossRef]
- Yan, C.; Tang, Y.; Dai, J.; Wang, C.; Wu, S. Uncertainty modeling of wind power frequency regulation potential considering distributed characteristics of forecast errors. Prot. Control Mod. Power Syst. 2021, 6, 22. [Google Scholar] [CrossRef]
- Ma, Y.; Zhao, J.; Liu, Q.; Jia, C.; OuYang, L.; Wen, L. An Active Power Control Strategy for Multi-source System Considering Section Safety Constraints. In Proceedings of the 2020 IEEE 4th Conference on Energy Internet and Energy System Integration (EI2), Wuhan, China, 30 October–1 November 2020; pp. 1659–1664. [Google Scholar] [CrossRef]
- Shu, Y.; Zhang, Z.; Guo, J.; Zhang, Z.L. Study on Key Factors and Solution of Renewable Energy Accommodation. Proc. CSEE 2017, 37, 1–9. [Google Scholar]
- Li, G.; Li, G.; Zhou, M. Comprehensive evaluation model of wind power accommodation ability based on macroscopic and microscopic indicators. Prot. Control Mod. Power Syst. 2019, 4, 19. [Google Scholar] [CrossRef]
- Li, Y.; Chi, Y.; Wang, X.; Tian, X.; Jianqing, J. Practices and Challenge on Planning with Large-scale Renewable Energy Grid Integration. In Proceedings of the 2019 IEEE 3rd Conference on Energy Internet and Energy System Integration (EI2), Changsha, China, 8–10 November 2019; pp. 118–121. [Google Scholar] [CrossRef]
- Hou, Q.; Du, E.; Zhang, N.; Kang, C. Impact of High Renewable Penetration on the Power System Operation Mode: A Data-Driven Approach. IEEE Trans. Power Syst. 2020, 35, 731–741. [Google Scholar] [CrossRef]
- Ye, R.; Huang, F.; Lin, Z.; Wang, H.; Wen, B. Influence of Power System Operation Mode on Wind Power Acceptance. In Proceedings of the 2017 4th International Conference on Information Science and Control Engineering, Changsha, China, 21–23 July 2017; IEEE: Piscataway, NJ, USA, 2017; pp. 395–398. [Google Scholar]
- Wang, Y.; Fu, Y.; Yang, B.; Zhang, H.; Liu, X.; Sun, D.; Xu, X. Research on relationship between power grid operation modes and short-circuit capacity distribution. In Proceedings of the 2017 Chinese Automation Congress (CAC), Jinan, China, 20–22 October 2017; IEEE: Piscataway, NJ, USA, 2017; pp. 1516–1519. [Google Scholar]
- Denholm, P.; Hand, M. Grid flexibility and storage required to achieve very high penetration of variable renewable electricity. Energy Policy 2011, 39, 1817–1830. [Google Scholar] [CrossRef]
- Gravener, M.; Nwankpa, C. Available transfer capability and first order sensitivity. IEEE Trans. Power Syst. 1999, 14, 512–518. [Google Scholar] [CrossRef]
- Zhang, J.; Li, N.; Liu, J.; Mi, Z.; Yuan, B. An integrated analysis method for wind & solar power accommodation based on peak regulation balance principle. Electr. Power 2019, 52, 68–72. [Google Scholar]
- Zhai, B.X.; Wang, J.R.; Yang, Z.G.; Wang, Y.L.; Liu, X.M.; Li, P.Y. Active Power Control Strategy for Wind Power Considering Priorities of Power Generation with Peak Regulation Constraints. Autom. Electr. Power Syst. 2017, 41, 83–88. [Google Scholar]
- Yao, G.; Xiong, G.; Zhang, J.; Shi, K.; Wu, S. Section margin allocation strategy for regional landscape cluster. Power Syst. Prot. Control 2021, 49, 48–55. [Google Scholar]
- Mishra, A.K.; Ramesh, L. Application of neural networks in wind power (generation) prediction. In Proceedings of the 2009 International Conference on Sustainable Power Generation and Supply, Nanjing, China, 6–7 April 2009; IEEE: Piscataway, NJ, USA, 2009; pp. 1–5. [Google Scholar]
- Zhao, H.; Wu, Q.; Guo, Q.; Sun, H.; Xue, Y. Distributed Model Predictive Control of a Wind Farm for Optimal Active Power ControlPart I: Clustering-Based Wind Turbine Model Linearization. IEEE Trans. Sustain. Energy 2015, 6, 831–839. [Google Scholar] [CrossRef]
- Amjady, N.; Keynia, F.; Zareipour, H. Wind Power Prediction by a New Forecast Engine Composed of Modified Hybrid Neural Network and Enhanced Particle Swarm Optimization. IEEE Trans. Sustain. Energy 2011, 2, 265–276. [Google Scholar] [CrossRef]
- Agoua, X.G.; Girard, R.; Kariniotakis, G. Short-Term Spatio-Temporal Forecasting of Photovoltaic Power Production. IEEE Trans. Sustain. Energy 2017, 9, 538–546. [Google Scholar] [CrossRef]
- Liu, C.; Li, M.; Yu, Y.; Wu, Z.; Gong, H.; Cheng, F. A Review of Multitemporal and Multispatial Scales Photovoltaic Forecasting Methods. IEEE Access 2022, 10, 35073–35093. [Google Scholar] [CrossRef]
- Mellit, A.; Massi Pavan, A.; Ogliari, E.; Leva, S.; Lughi, V. Advanced Methods for Photovoltaic Output Power Forecasting: A Review. Appl. Sci. 2020, 10, 487. [Google Scholar] [CrossRef]
- Ma, G.; Cai, Z.; Xie, P.; Liu, P.; Xiang, S.; Sun, Y.; Guo, C.; Dai, G. A Bi-Level Capacity Optimization of an Isolated Microgrid With Load Demand Management Considering Load and Renewable Generation Uncertainties. IEEE Access 2019, 7, 83074–83087. [Google Scholar] [CrossRef]
- Yang, W.; Cao, M.; Ge, P.; Hu, B.; Qu, G.; Xie, K.; Cheng, X.; Peng, L.; Yan, J.; Li, Y. Risk-Oriented Renewable Energy Scenario Clustering for Power System Reliability Assessment and Tracing. IEEE Access 2020, 8, 183995–184003. [Google Scholar] [CrossRef]
- Wang, S.-C.; Huang, P.-H. Fuzzy c-means clustering for power system coherency. In Proceedings of the 2005 IEEE International Conference on Systems, Man and Cybernetics, Waikoloa, HI, USA, 12 October 2005; Volume 3, pp. 2850–2855. [Google Scholar] [CrossRef]
- Davodi, M.; Modares, H.; Reihani, E.; Davodi, M.; Sarikhani, A. Coherency approach by hybrid PSO, K-Means clustering method in power system. In Proceedings of the 2008 IEEE 2nd International Power and Energy Conference, Johor Bahru, Malaysia, 1–3 December 2008; pp. 1203–1207. [Google Scholar] [CrossRef]
- Xu, H.; Yu, Z.; Zheng, Q.; Hou, J.; Wei, Y.; Zhang, Z. Deep Reinforcement Learning-Based Tie-Line Power Adjustment Method for Power System Operation State Calculation. IEEE Access 2019, 7, 156160–156174. [Google Scholar] [CrossRef]
- Hinneburg, A.; Keim, D. A General Approach to Clustering in Large Databases with Noise. Knowl. Inf. Syst. 2003, 5, 387–415. [Google Scholar] [CrossRef]
- Hinneburg, A. An Efficient Approach to Clustering in Large Multimedia Databases with Noise. Proc. Int. Conf. Knowl. Discov. Data Min. 1998, 98, 58–65. [Google Scholar]


Publisher’s Note: MDPI stays neutral with regard to jurisdictional claims in published maps and institutional affiliations. |
© 2022 by the authors. Licensee MDPI, Basel, Switzerland. This article is an open access article distributed under the terms and conditions of the Creative Commons Attribution (CC BY) license (https://creativecommons.org/licenses/by/4.0/).