Abstract
Molybdenum disulfide (MoS2) is an emerging material with exciting properties. Many consider it an excellent catalyst, particularly for hydrogen evolution reaction. Currently, it is used on a larger scale as a lubricant. The size of MoS2 is a crucial parameter defining its properties. A preparation method that is easily scalable and cheap is currently being sought. A solution might be a wet chemical synthesis method carried out in an impinging jet reactor. The simple design of the reactor and the possibility of continuous operation make this method unique. In this study, the influence of the reactor was investigated using numerical simulations. The S-type reactor showed better mixing and more control over the working conditions than T-type. Therefore, the S-type reactor was chosen as better for nanoparticle synthesis. We also investigated the influence of the process conditions on the size of the precipitated MoS2 particles. The best operating conditions (i.e., Mo concentration of 0.2 mol/m3, reagent flow velocity of 20 mL/min, reaction temperature of 20 °C) were chosen to obtain the smallest particles (~200 µm). Additionally, two different reducing agents were also tested. The use of formic acid allowed obtaining smaller particle sizes but these were less stable than in the case of citric acid.
1. Introduction
The novelty and outstanding properties of two-dimensional materials have drawn significant interest in various applications. Among them, transition metal dichalcogenides (TMDCs) deserve special attention. TMDCs are layered compounds of the general formula MX2 consisting of the transition metal element M, such as Mo, Re, W, Nb, placed between two chalcogenous planes of X atoms, i.e., S, Se. So far, the most studied of these materials is molybdenum disulfide (MoS2) [1,2,3].
MoS2 has found applications in various fields. The most common is the use as a dry lubricant. It is characterized by a low friction factor due to weak van der Waals forces between layers, and therefore its monolayers can easily slide over each other [4]. Moreover, with its ability to operate in critical conditions such as low or very high temperatures and an oxygen-poor environment, MoS2 is desirable for space and aerospace applications [5,6]. Its lamellar structure also allows using MoS2 in other lubrication applications. There are various oils and greases on the market with improved lubricating properties due to the addition of MoS2. However, the problem to overcome is its tendency to agglomerate [4,7,8,9]. The nanosized particles have better access to rubbing parts and, therefore, better tribological properties. For this purpose, different approaches have been proposed, for example, reducing its size by exfoliation or obtaining nanosized particles by using supports for the MoS2 deposition [4,10].
Depending on the number of layers and crystal structure, MoS2 presents different properties. Unlike bulk MoS2, its nanoparticles exhibit good catalytic activity. Nanosized MoS2 has been broadly studied as a catalyst for several reactions, particularly towards hydrogen evolution reaction [11,12,13,14]. Therefore, as in the case of lubricating applications, the size of MoS2 is a vital aspect [15]. Moreover, research has been undertaken on various forms of molybdenum disulfide to obtain the best catalytic properties. The 1T form with octahedral coordination can be distinguished, presenting improved properties over its more common forms, i.e., 2H or 3R. The higher catalytic activity is due to the fact that both the edge and base planes are catalytically active [16,17]. The use of an amorphous MoS2 is also a substantial approach. Its high catalytic activity and stability have aroused great interest. Moreover, crystalizing MoS2 is an expensive process demanding critical operating conditions. Therefore, maintaining an amorphous form of MoS2 allows obtaining high catalytic activity at relatively low costs [18]. There is also a possibility to combine MoS2 with other materials, such as carbon nanomaterials [11,19,20]. There are many methods of producing MoS2-based materials [21,22,23,24]. Some of these methods, such as chemical vapor deposition and hydrothermal methods, are very expensive or not scalable. However, among them, wet chemical synthesis can be distinguished.
The wet chemical synthesis involves reactions carried out in an aqueous solution at proper experimental conditions. As a result of precipitation in an oversaturated solution, amorphous MoS2 is formed [25]. Moreover, it is possible to add to the synthesis support for MoS2 growth. While maintaining good mixing conditions, heterogeneous nucleation occurs in the entire volume of the reaction mixture, thanks to which MoS2 particles are formed evenly over the whole support’s surface. The obtained product is contaminated and should be cleaned by filtration or centrifugal methods and then by annealing. Depending on the annealing temperature, it is possible to control the degree of crystallinity of the obtained product [26]. This method is relatively inexpensive and facile, not requiring special apparatus or process conditions, making it very attractive for the industrial market. The wet chemical synthesis can also be carried out in an impinging jet reactor. Jet reactors are characterized by good mixing conditions, simple design, and the possibility of working in continuous flow [25]. This method’s simplicity, price, and easy scalability make it very competitive in relation to the currently used methods of MoS2 synthesis on a larger scale.
The aim of this study was to refine the method of synthesizing MoS2 particles. For this purpose, the influence of various process parameters (initial concentration of reagents, substrate flow velocity, process temperature, reducing agent) on the properties of synthesized molybdenum disulfide was investigated. Since the average size is crucial, the particle size distribution (PSD) was studied to choose the best process conditions. Numerical simulations were also performed to investigate the impact of the type of reactor on the mixing conditions. The PSD was studied at every stage of the preparation procedure, i.e., after synthesis, purification, and annealing.
2. Materials and Methods
2.1. Numerical Methodology
The finite volume method in ANSYS Fluent 2022 R1 software performed numerical simulations of substrates mixing in jet reactors. Mixing conditions were analyzed for inlet flow ranges 20, 40, and 60 mL/min, T- or S-type reactors, and citric acid (CA) or formic acid (FA). The geometries of the investigated reactors are presented in Figure 1. The simulations were conducted in a 3D model representing the reactors divided into two inlets (one for ammonium sulfide, AS, and the other for CA/FA), an outlet, and a center where bulk mixing occurs. The mesh on the inlets and outlet was generated by a sweep method using quad\tri mesh type. Tetrahedrons created the center mesh (Figure 2). The mesh consists of approx. 450,000 elements, of which the center itself approx. 120,000. It has been proved that an increase in the number of calculation cells does not affect the quality of the calculations.
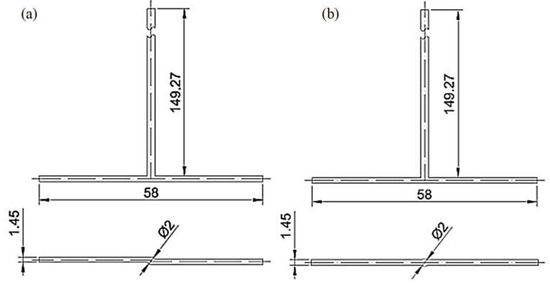
Figure 1.
(a) S-type and (b) T-type reactors with their dimensions.
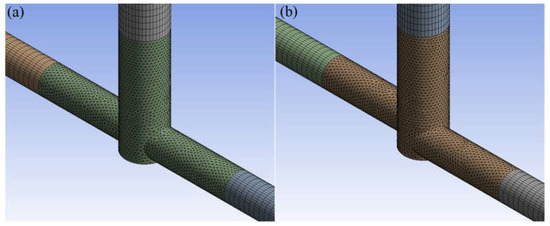
Figure 2.
Mesh of (a) T-type and (b) S-type reactors.
Despite the laminar flow with a parabolic velocity profile in the inlet channels, the wall boundary layer y was determined (Equations (1)–(3)) due to the turbulent flow in the mixing and outlet area. The maximum velocity used was assumed for further calculations.
where u is the mean velocity; u* is dynamic velocity; u+ is dimensionless velocity; y+ is dimensionless length; ν is kinematic viscosity; Q is inlet flow rate; d is the diameter; ρ is density; µ is dynamic viscosity.
For flow simulation, the Standard k-epsilon model was chosen. The reagent mixing was simulated by the Species Transport model, where the mixture’s density and viscosity (Table 1) were determined with volume and mass-weighted mixing laws. Mass diffusivity was assumed to be 10−9 m2/s. Inlet boundary conditions were exported from separate simulations to obtain velocity profiles of reagents. Simulations were computed with First Order Upwind discretization and then with Second Order Upwind discretization to increase the accuracy of the solution.

Table 1.
Physicochemical parameters of reagents used [27].
Based on CFD results, turbulence intensity I was determined (Equation (4)). In addition, the zones above 70% of the maximum value of the mixing intensity were designated for both types of reactors.
where u′ is the root-mean-square of the turbulent velocity fluctuations; U is the mean velocity (Reynolds averaged).
2.2. Effect of Substrate Concentration
Ammonium molybdate tetrahydrate (HMA) (Merck SA, Darmstadt, Germany) and ammonium sulfide (AS) (Sigma Aldrich, Saint Louis, MO, USA) were used as reaction substrates and citric acid (Sigma Aldrich, USA) as a reducing agent for the reactions (Equations (5) and (6)). The molar concentrations of the substrates were in a Mo:S:CA ratio of 1:2:2, and the molybdenum concentrations in the HMA-CA aqueous solution varied from 0.2 M to 0.8 M. To prepare the HMA-CA solution, 1.766 g of solid HMA was dissolved in a small amount of distilled water in a 50 mL volumetric flask by stirring it on a magnetic stirrer at 90 °C. Subsequently, 3.842 g of solid CA was added to the stirring solution. Then, distilled water was added up to 50 mL and mixed for the next 30 min until a clear solution was obtained. Next, 50 mL of AS solution was obtained by diluting 3.8 mL of a concentrated ammonium sulfide solution (20 wt.%) with distilled water. The impinging jet reactor (1) (S-type) and volumetric flasks with the reagents (5 and 6) were kept in a thermostat (2) at a temperature of 20 °C. During the synthesis, the syringe pump (3) was operated with a constant flow of 20 mL/min. To avoid heterogeneous nucleation on the impurities, the reactants initially flowed through filters (4) with pore sizes in the following order: 1.00; 0.45; 0.22 μm. One of the inlets was fed with a mixture of HMA-CA and the second with AS solution. The brown slurry product was collected into a separate container (8). The scheme of the used system is shown in Figure 3.
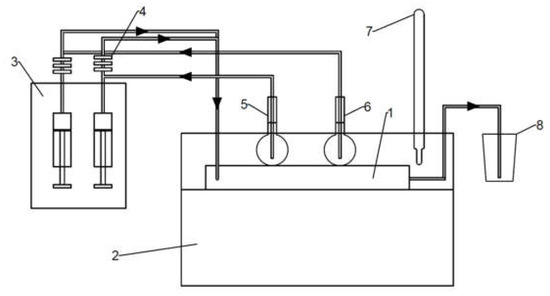
Figure 3.
The system used for the synthesis of MoS2 (1—impinging jet reactor, 2—thermostat, 3—syringe pump, 4—filter set, 5—flask with HMA-CA, 6—flask with AS, 7—thermometer, 8—product container).
2.3. Effect of Substrate Flow Velocity
The same methodology as in Section 2.2 was used to study the influence of the substrate flow velocity, with the difference that the synthesis was carried out for a Mo concentration equal to 0.2 M, and the flow rate of the reactants was successively set at 10, 20, and 40 mL/min.
2.4. Effect of Process Temperature
The same methodology as in Section 2.2 was used to study the effect of the temperature process. The synthesis was carried out for a Mo concentration equal to 0.2 M, and the system was thermostated successively at temperatures of 10, 15, 20, and 25 °C.
2.5. Effect of Reducing Agent
The same methodology as in Section 2.2 was used to study the effect of reducing agents with the difference that instead of citric acid, formic acid (FA) (Sigma Aldrich, Saint Louis, MO, USA) was used. The HMA-FA solution was obtained by dissolving the HMA in 30 mL of water in a 50 mL volumetric flask, and, while continuously stirring on a magnetic stirrer, 15 mL of FA (85%) was added dropwise.
2.6. Purification
The synthesis product is the suspension of amorphous MoS2, byproducts, and non-reacted reagents. The synthesis suspension was purified 3 times through centrifugation with a relative centrifugal force of 21,390. The purified precipitate was dried at 50 °C overnight. Then, the material was annealed at 550 °C under inert gas flow [11].
2.7. Physicochemical Characterization
The particle size is a crucial parameter for MoS2 since its properties change with the number of layers. The particle size distribution (PSD) of the obtained particles was measured using an LS 13 320 Particle Size Analyzer from Beckman Coulter, which enables high-resolution measurements using polarization intensity differential scattering (PIDS) technology. The PSDs by number, surface, and volume were carried out for the product suspension after synthesis from Section 2.2, Section 2.3, Section 2.4 and Section 2.5 and after each stage of the preparation procedure (Section 2.6). The specific sizes L10 (arithmetic mean), L32 (surface-weighted mean size), and L43 (volume-weighted mean size) were determined based on the method of moments (Equations (7) and (8)).
where m is the moment of distributions; k is the moment rank; and f(L) is the number PSD function.
Raman analysis of the final products synthesized using both citric and formic acids was performed. Raman spectra made it possible to determine the difference in the purity of the synthetic materials. The analysis was performed using an inVia Raman microscope from the Renishaw system with a 633 nm laser (at 5% laser power and 1% as lower power was used); each measurement consisted of 10 counts for 10 s. The presented Raman spectra are shown as received. No normalization of the spectra was performed.
The scanning electron microscopy (SEM) images were presented to check the particle morphology and to compare the size of the obtained materials. For this purpose, a Hitachi S5500 microscope with a resolution of 0.4 nm was used. The STEM images were obtained in the secondary electrons (SE) mode and the bright-field scanning transmission electron microscopy (BF-STEM).
3. Results and Discussion
3.1. Numerical Simulations
Figure 4 shows contour profiles of the dimensionless fraction of tracer in the T-reactor. It can be seen that the difference in the mixing of citric and formic acid in the T-type reactor is hardly discernible as both acid mixtures have similar densities and viscosities. As the flow velocity of the reactants increases, the agitation rate does not increase. The difference in mixing citric acid and formic acid in the S-type reactor is almost imperceptible (Figure 5). As the reactor flow rate increases, the agitation rate increases significantly in contrast to the T-reactor. This is a positive effect as the S-type reactor allows the process to be controlled by the reactor flow rate.
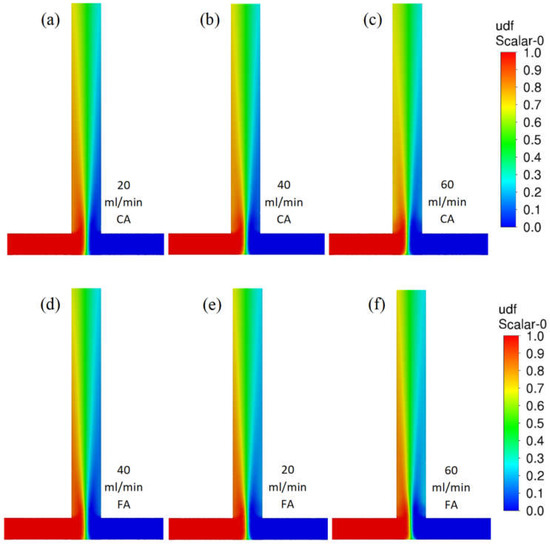
Figure 4.
Contour profiles of dimensionless fraction of tracer in the T-reactor with citric acid (scale from 0 to 1) for various flow velocities (a) 20, (b) 40, and (c) 60 mL/min and for formic acid for flow velocities (d) 20, (e) 40, and (f) 60 mL/min.
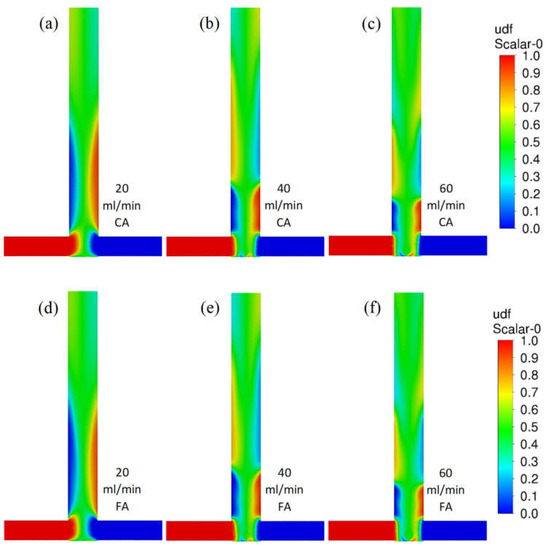
Figure 5.
Contour profiles of the dimensionless fraction of tracer in the S-reactor for citric acid (scale from 0 to 1) for various flow velocities (a) 20, (b) 40, and (c) 60 mL/min and for formic acid for flow velocities (d) 20, (e) 40, and (f) 60 mL/min.
The homogeneous precipitation of molybdenum disulfide is an almost instantaneous process [28,29]. Therefore, to limit secondary precipitation and agglomeration processes, intensive mixing of the inlet streams is required. In order to demonstrate the difference between T-type and S-type reactors, we decided to determine areas of high mixing intensity, defined as areas above 70% of the maximum value for turbulence intensity. The volume of these areas is shown in Table 2 and their shape in Figure 6.
Table 2.
The volume of mixing zones with the highest intensity and maximum intensity of turbulence for T- and S-type reactors.
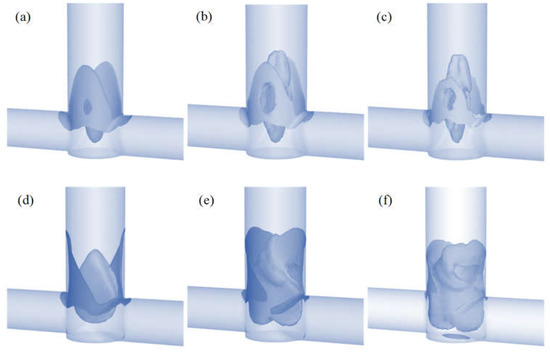
Figure 6.
Mixing zones with turbulence intensity above 70% in the T-reactor for various flow velocities of CA (a) 20, (b) 40, and (c) 60 mL/min and in the S-reactor for (d) 20, (e) 40, and (f) 60 mL/min.
The maximum value of the turbulence intensity is equal in both reactors (Table 2). Only the sizes of the zones where mixing is most intense differ. A comparison of these values shows that in the S-reactor the volume of high mixing intensity is 27% greater than in the T-reactor for the lowest flow and increases by up to 228% for the highest flow. Figure 6 shows these zones for both T- and S-type reactors for different flow velocities.
Differences in the shape of these areas can be clearly observed. In the T-type reactor, the maximum turbulence intensity values occur in the collision area of the inlet streams and in the outlet pipe axis (especially for higher flows). The situation is different in the S-type mixer, where the shift of the inlet tubes creates a vortex that intensely mixes the streams and creates a zone that is difficult for the inlet fluid elements to bypass. These conclusions are consistent with the literature [30,31,32]. The effect discussed can be clearly seen in Figure 5, where there is a faster homogenization of the tracer concentration in the S-reactor than in the T-reactor.
Due to the lack of significant differences between FA and CA, the results are presented only for citric acid. Therefore, the S-type reactor was found to be better for the synthesis of nanoparticles and was used in further research.
3.2. Effect of Process Conditions on Particle Size Distribution
Figure 7 presents how the particle mean diameter changes depending on the process conditions. The PSD results revealed that the process conditions strongly influence the precipitation process in the impinging jet reactor. With increasing initial molybdenum concentration, the particle mean size also increases (Figure 7a). The specific sizes were determined on the basis of the entire PSD, including agglomerates and aggregates. The higher Mo concentration resulted in a greater precipitation rate, thus a higher concentration of the MoS2 primary particles, which promotes the formation of agglomerates and aggregates. For nanoparticle production, arithmetic mean L10 is the most important. The best results were obtained for Mo concentration equal to 0.2 M, which is the minimum concentration for the proper course of the reaction [25].
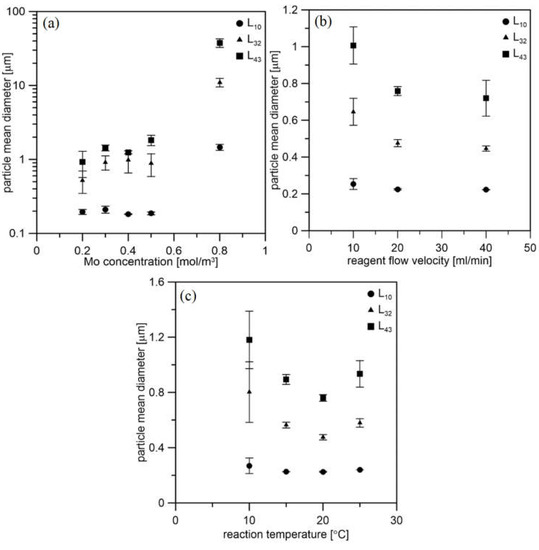
Figure 7.
Effect of the process conditions on particle mean size. (a) Initial molybdenum concentration at 20 °C and with flow velocity of 20 mL/min, (b) reagent flow velocity at 20 °C and with Mo concentration of 0.2 mol/m3, (c) reaction temperature with flow velocity of 20 mL/min and with Mo concentration of 0.2 mol/m3.
The velocity of the inlet streams does not have as much of an effect on the PSD as the concentration (Figure 7b). The smallest particles are obtained for higher speeds. This is due to the greater turbulence dissipation rate in the mixing area. However, one of the synthesis products is hydrogen sulfide. Due to the rapid release of this dangerous gas, 20 mL/min was considered the best flow velocity. The effect of the temperature is presented in Figure 7c.
The smallest particle sizes are obtained at 20 °C. As the temperature increases, the viscosity of the liquids decreases, and thus there is greater mobility of the particles. Therefore, as the temperature drops, the specific particle size increases slightly. However, at 25 °C, an insignificant increase in the mean size of the particles was observed. This can be explained as this temperature is close to the flash point of AS, which is 32 °C. Therefore, ammonium sulfide vapor pressure is higher, and less sulfur precursor is in the reacting solution, promoting particle growth over the nucleation and formation of Mo-oxides. Thus, the temperature of 20 °C was considered the best. Table 3, Table 4 and Table 5 present specific sizes for all cases. The L10 dimension shows that the particles obtained for an initial concentration of 0.2 M with a reagent flow of 20 mL/min at 20 °C are in the size range of 0.190–0.226 µm.
Table 3.
Mean sizes depending on the initial molybdenum concentration.
Table 4.
Mean sizes depending on the substrate flow velocity.
Table 5.
Mean sizes depending on the process temperature.
3.3. Effect of Reducing Agent on Particle Size Distribution after Each Stage of Preparation
The product’s particle size distribution by number (Figure 8a) directly after synthesis using citric acid showed two fractions. Bimodal distribution can result from the formation of primary particles, agglomerates, and reaction by-products. The final synthesis product is purified and annealed MoS2. The smallest particles may have been removed in the centrifuge during purification. Additionally, the particles grew as a result of the heat treatment. Therefore, the specific size of particles increases after purification and annealing. The PSDs by surface area and volume (Figure 8c,e) also showed the presence of larger agglomerates. However, they appeared in a small amount, which results from the numerical distribution. The PSD for the product synthesized using formic acid looks quite different (Figure 8b,d,f). The particles after synthesis are much more significant. This is probably due to the agglomerate formation during the synthesis. However, as a result of purification, these agglomerates were broken down, and the particles became nanosized. Since formic acid has smaller molecules, it is easier to remove. Although it initially caused agglomerates, after its removal in a centrifuge the resulting particles had a smaller size than in the case of citric acid. However, as with CA, particles grow due to the heat treatment. The final products synthesized using CA and FA mean sizes are 0.769 and 0.413 µm, respectively.
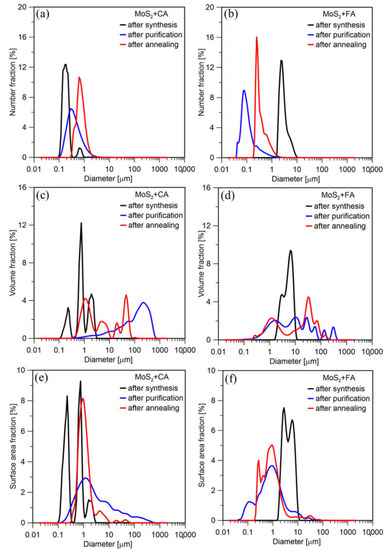
Figure 8.
PSD (a) by number, (c) surface area, (e) volume of particles synthesized using citric acid; PSD (b) by number, (d) surface area, (f) volume of particles synthesized using formic acid.
3.4. Material Characterization
The Raman spectroscopy measurements were performed for the qualitative analysis of the samples to check if the prepared samples were MoS2. The spectra presented in Figure 9 were taken at 5% of laser power for the CA sample and 1% of laser power for the FA sample. Both spectra of MoS2 samples show similar vibrational modes. The main peaks can be seen at ∼383 and ∼408 cm−1 corresponding to the E12g and A1g vibrational modes of bulk MoS2, respectively. Other peaks located at ~188, ~230, ~456, and ~629 cm−1 are attributed to the typical stretching vibrations of MoS2 [33].
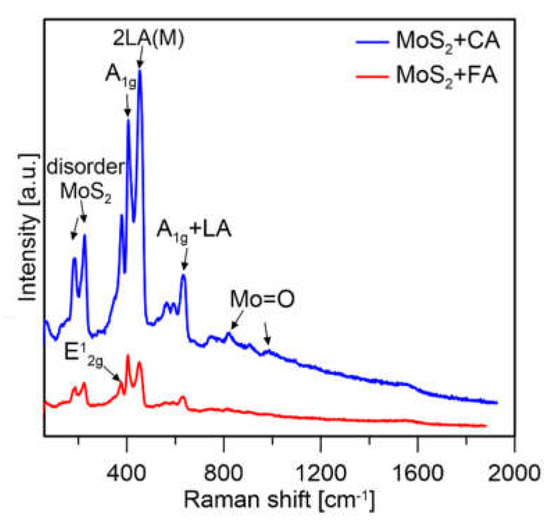
Figure 9.
Raman spectra of MoS2 prepared with citric (CA) and formic acid (FA).
At the beginning of the measurement for both samples, the same conditions were applied (i.e., laser power, illumination time, and number of counts). Measurements for particles synthesized using FA and CA were performed under the same conditions (same laser power (5%), same number of counts, same measurement area, and same length of exposure) and spectra are shown in Figure 10. It was observed that for the sample prepared with formic acid, peaks mainly from molybdenum oxides were visible, while for the citric acid sample, mainly MoS2 was present.
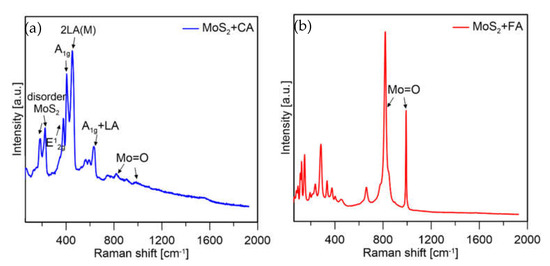
Figure 10.
Raman spectra of MoS2 prepared with (a) CA and (b) FA at 5% laser power.
Based on these results, it was decided to decrease the laser power used to check if the oxides formed on the formic acid sample were due to the measurement conditions or were formed during precipitation. For both samples, again the same measurement conditions were applied (spectra shown in Figure 11).
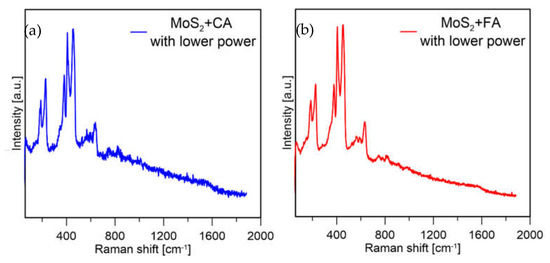
Figure 11.
Raman spectra of MoS2 prepared with (a) CA and (b) FA at 1% laser power.
It can be observed that for the formic acid sample, when a lower laser power was used the signal from molybdenum oxides disappeared, and mainly peaks from MoS2 were visible. The sample prepared with citric acid in both measurement conditions mainly showed peaks from MoS2. From this experiment, it was assumed that MoS2 prepared with formic acid is less stable because with the same measurement conditions, the particles are more easily oxidized (which might also be connected to their smaller size). The sample prepared with CA showed much lower susceptibility to laser oxidation; however, the sample was not homogeneous, and Mo-oxides were visible at most of the points where the measurements were taken (a spectrum of the sample obtained with CA in a different spot is presented in Figure 12).
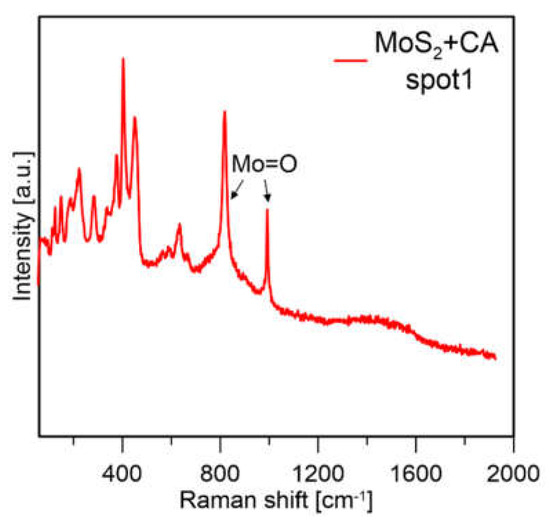
Figure 12.
Raman spectra of MoS2 prepared with CA and FA at 1% laser power.
The SEM images are presented in Figure 13. Comparing the SEM pictures of both samples, it can be seen that the particles obtained with the use of formic acid are smaller, and their structure has more wrinkles which have higher electron beam transmittance compared to particles obtained with citric acid. This might suggest that the thickness of the particles obtained with formic acid is lower, and the material looks more fragile. The sample obtained with citric acid looks denser and thicker.
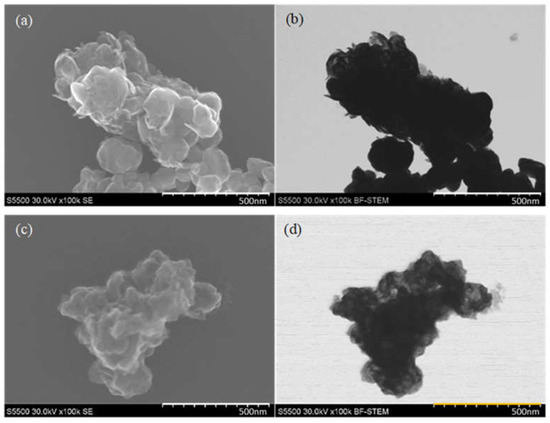
Figure 13.
SEM images in (a) SE mode and (b) BF-STEM mode of MoS2 particles obtained with the use of CA; (c) SE mode and (d) BF-STEM mode of MoS2 particles obtained with the use of FA.
4. Conclusions
In this study, the influence of the various process conditions on MoS2 preparation via wet chemical synthesis was investigated. Based on numerical simulations, it appears that the S-reactor is better for the preparation of MoS2 particles obtained by wet chemical synthesis. The S-reactor allows for controlling the process through the reactor flow rate. Moreover, the size of the zone, in which agitation is most intense, is much more significant in the case of the S-reactor. The difference in these values is up to 128%. Various process parameters of MoS2 synthesis (initial concentration of reagents, substrate flow velocity, process temperature, and reducing agent) were investigated. The best operating conditions were: −0.2 M initial concentration, 20 mL/min reagent flow, and 20 °C temperature. For these conditions, the L10 specific size of the MoS2 particles after synthesis is in the range of 0.190–0.226 µm. Particles obtained with the use of formic acid are much smaller than in the case of citric acid. The specific sizes of the final products synthesized using CA and FA are 0.769 and 0.413 µm, respectively. However, the obtained particles show lower stability, which was confirmed by Raman spectroscopy.
Author Contributions
Conceptualization, Z.B. and Ł.M.; methodology, Z.B., M.M.-P. and Ł.M.; validation, Z.B. and Ł.M.; formal analysis, Z.B.; investigation, Z.B., M.M., M.M.-P. and Ł.M.; writing—original draft preparation, Z.B., M.M., Ł.M.; writing—review and editing, Ł.M.; visualization, M.M., Z.B. and Ł.M.; supervision, Ł.M.; project administration, Z.B.; funding acquisition, Z.B. All authors have read and agreed to the published version of the manuscript.
Funding
This research was funded by the National Science Centre through the project [No 2021/41/N/ST8/03764].
Institutional Review Board Statement
Not applicable.
Informed Consent Statement
Not applicable.
Data Availability Statement
The data presented in this study are available on request from the corresponding author. The data are not publicly available due to time and technical limitations.
Conflicts of Interest
The authors declare no conflict of interest.
References
- Pi, L.; Li, L.; Liu, K.; Zhang, Q.; Li, H.; Zhai, T. Recent Progress on 2D Noble-Transition-Metal Dichalcogenides. Adv. Funct. Mater. 2019, 29, 1904932. [Google Scholar] [CrossRef]
- Fu, Q.; Han, J.; Wang, X.; Xu, P.; Yao, T.; Zhong, J.; Zhong, W.; Liu, S.; Gao, T.; Zhang, Z.; et al. 2D Transition Metal Dichalcogenides: Design, Modulation, and Challenges in Electrocatalysis. Adv. Mater. 2021, 33, e1907818. [Google Scholar] [CrossRef] [PubMed]
- Cordeiro, N.J.A.; Gaspar, C.; De Oliveira, M.J.; Nunes, D.; Barquinha, P.; Pereira, L.; Fortunato, E.; Martins, R.; Laureto, E.; Lourenço, S.A. Fast and Low-Cost Synthesis of MoS2 Nanostructures on Paper Substrates for Near-Infrared Photodetectors. Appl. Sci. 2021, 11, 1234. [Google Scholar] [CrossRef]
- Bojarska, Z.; Kopytowski, J.; Mazurkiewicz-Pawlicka, M.; Bazarnik, P.; Gierlotka, S.; Rożeń, A.; Makowski, L. Molybdenum disulfide-based hybrid materials as new types of oil additives with enhanced tribological and rheological properties. Tribol. Int. 2021, 160, 106999. [Google Scholar] [CrossRef]
- Serles, P.; Gaber, K.; Pajovic, S.; Colas, G.; Filleter, T. High Temperature Microtribological Studies of MoS2 Lubrication for Low Earth Orbit. Lubricants 2020, 8, 49. [Google Scholar] [CrossRef]
- Vazirisereshk, M.R.; Martini, A.; Strubbe, D.A.; Baykara, M.Z. Solid Lubrication with MoS2: A Review. Lubricants 2019, 7, 57. [Google Scholar] [CrossRef]
- Lu, G.; Shuai, C.; Liu, Y.; Yang, X. Synergistic effect of single-wall carbon nanotubes and MoS2 on tribological performance of polyether MDI polyurethane elastomer. J. Mech. Sci. Technol. 2022, 36, 179–185. [Google Scholar] [CrossRef]
- Makowski, L.; Bojarska, Z.; Rożeń, A. Rheological Properties of Engine Oil with Nano-Additives Based on MoS2 Materials. Nanomaterials 2022, 12, 581. [Google Scholar] [CrossRef]
- Yan, Y.; Jiang, C.; Huo, Y.; Li, C. Preparation and Tribological Behaviors of Lubrication-Enhanced PEEK Composites. Appl. Sci. 2020, 10, 7536. [Google Scholar] [CrossRef]
- Uzoma, P.; Hu, H.; Khadem, M.; Penkov, O. Tribology of 2D Nanomaterials: A Review. Coatings 2020, 10, 897. [Google Scholar] [CrossRef]
- Bojarska, Z.; Mazurkiewicz-Pawlicka, M.; Gierlotka, S.; Makowski, L. Production and Properties of Molybdenum Disulfide/Graphene Oxide Hybrid Nanostructures for Catalytic Applications. Nanomaterials 2020, 10, 1865. [Google Scholar] [CrossRef] [PubMed]
- Meng, C.; Chen, X.; Gao, Y.; Zhao, Q.; Kong, D.; Lin, M.; Chen, X.; Li, Y.; Zhou, Y. Recent Modification Strategies of MoS2 for Enhanced Electrocatalytic Hydrogen Evolution. Molecules 2020, 25, 1136. [Google Scholar] [CrossRef] [PubMed]
- Ding, Q.; Song, B.; Xu, P.; Jin, S. Efficient Electrocatalytic and Photoelectrochemical Hydrogen Generation Using MoS2 and Related Compounds. Chem 2016, 1, 699–726. [Google Scholar] [CrossRef]
- Yang, L.; Liu, P.; Li, J.; Xiang, B. Two-Dimensional Material Molybdenum Disulfides as Electrocatalysts for Hydrogen Evolution. Catalysts 2017, 7, 285. [Google Scholar] [CrossRef]
- Ghanashyam, G.; Jeong, H.K. Size Effects of MoS2 on Hydrogen and Oxygen Evolution Reaction. J. Electrochem. Sci. Technol. 2022, 13, 120–127. [Google Scholar] [CrossRef]
- Tang, Q.; Jiang, D.-E. Mechanism of Hydrogen Evolution Reaction on 1T-MoS2 from First Principles. ACS Catal. 2016, 6, 4953–4961. [Google Scholar] [CrossRef]
- Vedhanarayanan, B.; Shi, J.; Lin, J.-Y.; Yun, S.; Lin, T.-W. Enhanced activity and stability of MoS2 through enriching 1T-phase by covalent functionalization for energy conversion applications. Chem. Eng. J. 2021, 403, 126318. [Google Scholar] [CrossRef]
- Wu, L.; Longo, A.; Dzade, N.Y.; Sharma, A.; Hendrix, M.M.R.M.; Bol, A.A.; de Leeuw, N.H.; Hensen, E.J.M.; Hofmann, J.P. The Origin of High Activity of Amorphous MoS2 in the Hydrogen Evolution Reaction. ChemSusChem 2019, 12, 4383–4389. [Google Scholar] [CrossRef] [PubMed]
- Xu, X.; Liu, L. MoS2 with Controlled Thickness for Electrocatalytic Hydrogen Evolution. Nanoscale Res. Lett. 2021, 16, 137. [Google Scholar] [CrossRef] [PubMed]
- Zhang, X.; Zhang, Y.; Yu, B.-B.; Yin, X.-L.; Jiang, W.-J.; Jiang, Y.; Hu, J.-S.; Wan, L.-J. Physical vapor deposition of amorphous MoS2 nanosheet arrays on carbon cloth for highly reproducible large-area electrocatalysts for the hydrogen evolution reaction. J. Mater. Chem. A 2015, 3, 19277–19281. [Google Scholar] [CrossRef]
- Liu, H.F.; Wong, S.L.; Chi, D.Z. CVD Growth of MoS2-based Two-dimensional Materials. Chem. Vap. Depos. 2015, 21, 241–259. [Google Scholar] [CrossRef]
- Li, W.-J.; Shi, E.-W.; Ko, J.-M.; Chen, Z.-Z.; Ogino, H.; Fukuda, T. Hydrothermal synthesis of MoS2 nanowires. J. Cryst. Growth 2003, 250, 418–422. [Google Scholar] [CrossRef]
- Feng, X.; Tang, Q.; Zhou, J.; Fang, J.; Ding, P.; Sun, L.; Shi, L. Novel mixed-solvothermal synthesis of MoS2 nanosheets with controllable morphologies. Cryst. Res. Technol. 2013, 48, 363–368. [Google Scholar] [CrossRef]
- Reshmi, S.; Akshaya, M.V.; Satpati, B.; Roy, A.; Basu, P.K.; Bhattacharjee, K. Tailored MoS2 nanorods: A simple microwave assisted synthesis. Mater. Res. Express 2017, 4, 115012. [Google Scholar] [CrossRef]
- Wojtalik, M.; Bojarska, Z.; Makowski, Ł. Experimental studies on the chemical wet synthesis for obtaining high-quality MoS2 nanoparticles using impinging jet reactor. J. Solid State Chem. 2020, 285, 121254. [Google Scholar] [CrossRef]
- Bojarska, Z.; Mazurkiewicz-Pawlicka, M.; Mierzwa, B.; Płociński, T.; Makowski, L. Effect of the carbon support on MoS2 hybrid nanostructures prepared by an impinging jet reactor for hydrogen evolution reaction catalysis. J. Environ. Chem. Eng. 2022, 10, 108038. [Google Scholar] [CrossRef]
- Green, D.W.; Perry, R.H. (Eds.) Perry’s Chemical Engineer’s Handbook, 8th ed.; McGraw-Hill: New York, NY, USA, 2008. [Google Scholar]
- Wojtalik, M.; Orciuch, W.; Makowski, L. Nucleation and growth kinetics of MoS2 nanoparticles obtained by chemical wet synthesis in a jet reactor. Chem. Eng. Sci. 2020, 225, 115814. [Google Scholar] [CrossRef]
- Wojtalik, M.; Wojtas, K.; Gołębiowska, W.; Jarząbek, M.; Orciuch, W.; Makowski, L. Molybdenum Disulphide Precipitation in Jet Reactors: Introduction of Kinetics Model for Computational Fluid Dynamics Calculations. Molecules 2022, 27, 3943. [Google Scholar] [CrossRef]
- Wojtas, K.; Orciuch, W.; Makowski, L. Comparison of Large Eddy Simulations and κ-ε Modelling of Fluid Velocity and Tracer Concentration in Impinging Jet Mixers. Chem. Process Eng. 2015, 36, 251–262. [Google Scholar] [CrossRef]
- Wojtas, K.; Orciuch, W.; Makowski, L. Large Eddy Simulations of Reactive Mixing in Jet Reactors of Varied Geometry and Size. Processes 2020, 8, 1101. [Google Scholar] [CrossRef]
- Wojtas, K.; Makowski, L.; Orciuch, W. Barium sulfate precipitation in jet reactors: Large eddy simulations, kinetics study and design considerations. Chem. Eng. Res. Des. 2020, 158, 64–76. [Google Scholar] [CrossRef]
- Gołasa, K.; Grzeszczyk, M.; Bożek, R.; Leszczyński, P.; Wysmołek, A.; Potemski, M.; Babiński, A. Resonant Raman scattering in MoS 2—From bulk to monolayer. Solid State Commun. 2014, 197, 53–56. [Google Scholar] [CrossRef]


Publisher’s Note: MDPI stays neutral with regard to jurisdictional claims in published maps and institutional affiliations. |
© 2022 by the authors. Licensee MDPI, Basel, Switzerland. This article is an open access article distributed under the terms and conditions of the Creative Commons Attribution (CC BY) license (https://creativecommons.org/licenses/by/4.0/).