Article

Functionality Analysis of Derailment Containment Provisions through Full-Scale Testing—I: Collision Load and Change in the Center of Gravity

1
R&D Laboratory, Road Kinematics Co., Ltd., Cheonan 31094, Korea
2
Chungnam Railway Research Institute, Chungnam National University, Daejeon 34134, Korea
3
Department of Civil Engineering, Chungnam National University, Daejeon 34134, Korea
*
Author to whom correspondence should be addressed.
Appl. Sci. 2022, 12(21), 11297; https://doi.org/10.3390/app122111297
Submission received: 17 October 2022 / Revised: 31 October 2022 / Accepted: 2 November 2022 / Published: 7 November 2022

Abstract

:
In order to reduce the large damage caused by train derailment, protective facilities of various shapes and conditions can be installed on railroad tracks. These protective facilities are referred to as derailment containment provisions (DCPs) and three different types are used worldwide. However, there are no clear standards for DCP design such as installation location, size, and design load, and the performance verification of DCPs installed in the actual railway field is not sufficiently performed. In this paper, the functionality of DCP type I was analyzed experimentally. A method for estimating the collision (impact) load acting on the DCP was proposed. In addition, the containment effect of DCP type I according to the change in the vehicle’s center of gravity was identified through a comparative analysis of the dynamic motion such as roll, pitch, and yaw.

1. Introduction

A derailment accident of a high-speed train causes a lot of social and economic problems because the damage is very significant. Therefore, many countries are taking preventive measures and countermeasures to minimize damage for train derailment accidents. It is difficult to 100% prevent derailment accidents because there are always unpredictable derailment triggers, such as defects in trains and tracks, human error, and natural disasters. Therefore, rather than preventing derailment, reducing the significant damage caused by derailment can be a more practical and realistic countermeasure. In other words, a method to prevent the train from excessive lateral deviation from the track when derailing is a very important measure to minimize the risk of death. A method of controlling the lateral movement of a derailed train can be classified into two types: installing a special device on the vehicle’s bogie frame and installing a protection facility around the track. This latter method can be categorized as derailment containment provisions [1,2]. In order to reduce the significant damage caused by train derailment, protective facilities of various shapes and conditions can be installed on railroad tracks. These protective facilities are referred to as derailment containment provisions (DCPs) and three different types are used worldwide as shown in Figure 1 [3]. In particular, in DCP Type III, the wheel of the derailed train is primarily controlled by the running rail in the derailing direction and then additionally controlled by the secondary collision with the DCP. In South Korea, DCP Type III is being installed on railway bridges as shown in Figure 2 [4]. It is mandatory for railway lines with a speed of 200 km/h or higher. However, there are no clear standards for DCP design such as installation location, size, and design load, and the performance verification of DCPs installed in the actual railway field is not sufficiently performed.
After Nadal’s research [5] on the derailment coefficient was conducted in 1896, many studies have been conducted on the derailment mechanism. However, to date, the precise identification of the derailment mechanism is insufficient, and an effective and accurate method for preventing the derailment of railway vehicles has not been found [6]. Therefore, the study of ways to restrain the derailed train within the intended area based on the understanding of the behavioral characteristics of the train after derailment has become particularly meaningful.
It is necessary to understand the dynamic motion of a derailed vehicle in order to obtain an effective method for restraining the lateral movement and thereby constraining the vehicle within the intended area. A lot of research has been completed on the post-derailment behavior. Barbie et al. [7,8,9,10] developed a more comprehensive 3D post-derailment dynamic model (multi-body system module) and established a simplified wheel–sleeper contact model to obtain the impact force with a concrete sleeper. Wu et al. [6] proposed a post-derailment dynamic model of half-car considering all kinds of contact and verified it through half-car derailment experiments performed in the laboratory. Wu et al. [11,12] developed a post-derailment dynamic model of a high-speed train on a bridge and studied the behavior of a high-speed train derailed on a bridge during an earthquake. Ling et al. [13] presented the formulation of the train–track–bridge interaction model to study the derailment mechanism caused by the collision of a passenger train running on a bridge. Guo et al. [14] conducted a low-speed full-scale derailment experiment to analyze the effect of track type on the post-derailment behavior. Diana et al. [15] analyzed sensor signals and data processing algorithms and criteria for detecting derailment through full-scale derailment tests on freight wagons.
On the other hand, only a few studies have attempted to control derailed trains to their intended domains. The research related to the method of installing a special device on the vehicle’s bogie frame is as follows. Kajitani et al. [16] developed an “L-shaped Guide” that can be attached to a bearing box to control the lateral movement of a derailed train and installed it on a shinkansen train, etc. Sunami et al. [17,18] developed a post-derailment stopper which is attached to the bogie frame. Moreover, a vehicle dynamics model was developed to analyze the post-derailment behavior of a bogie frame with a stopper attached. Wu et al. [19] developed a device to control derailed vehicles and verified their performance through experiments.
The research related to the method of installing a protection facility around the track has mainly been conducted by Bae et al. [1,2,20]. Bae et al. [1] developed a finite element model for derailment and collision analysis using the LS-Dyna program and evaluated the containment capacity and crashworthiness of the DCP installed in South Korea. Bae et al. [2] analyzed the effect of containment after derailment for various DCP types and suggested the range of possible collision loads for each type. Through such a series of papers, Bae et al. proposed that installation of derailment containment provisions as robust blocks within track gauge (DCP Type I) has many advantages in terms of economics, durability, and efficiency due to the reduction in lateral collision load in comparison with a DCP on the outer side of the track (DCP Type II, III). The finite element model developed by Bae et al. [1,2] is an effective method for simulating the derailment/collision phenomenon of a vehicle, but it has the disadvantage of consuming huge computational cost and time. Therefore, Bae et al. [20] and Song et al. [21] developed a simplified FE model that can evaluate the dynamic behavior after derailment without significant errors compared to complex vehicle models. Moreover, this simplified vehicle model was verified through the full-scale tests on bogies and flat wagons running on a concrete track where DCP type I was installed. However, it is difficult for these FE models to perfectly reproduce the behavior of the full vehicle (colliding with DCP and motion after collision). Therefore, a collision test with various DCPs should be performed on an experimental vehicle that can show full vehicle effects such as the center of gravity, connection between cars, etc. The FE model should be improved through these additional experimental studies. Moreover, in order to develop the design specification of DCPs, functionality analysis such as collision (impact) load, collision energy, installation location, size, and containment effect should be performed experimentally and analytically.
Therefore, the present research team conducted a functionality analysis of DCPs through the full-scale derailment test firstly. Then, based on the improved simplified FE model, a design specification for DCP was developed. This result will be introduced in the future. In this paper, the functionality of DCP type I was analyzed experimentally. The derailment test cars were a flat wagon and container wagon, and a robust concrete block structure in the form of DCP type I was installed on a concrete track. A method for estimating the collision (impact) load acting on the DCP was proposed. In addition, the containment effect of DCP type I according to the change of the vehicle’s center of gravity was identified through a comparative analysis of the dynamic motion for a flat wagon and container wagon such as roll, pitch, and yaw. In the companion paper, the results of the comparative analysis of the functionality of DCP type I and III are presented for a connected vehicle that reflects the connection effect between the cars.

2. Experimental Conditions and Methods

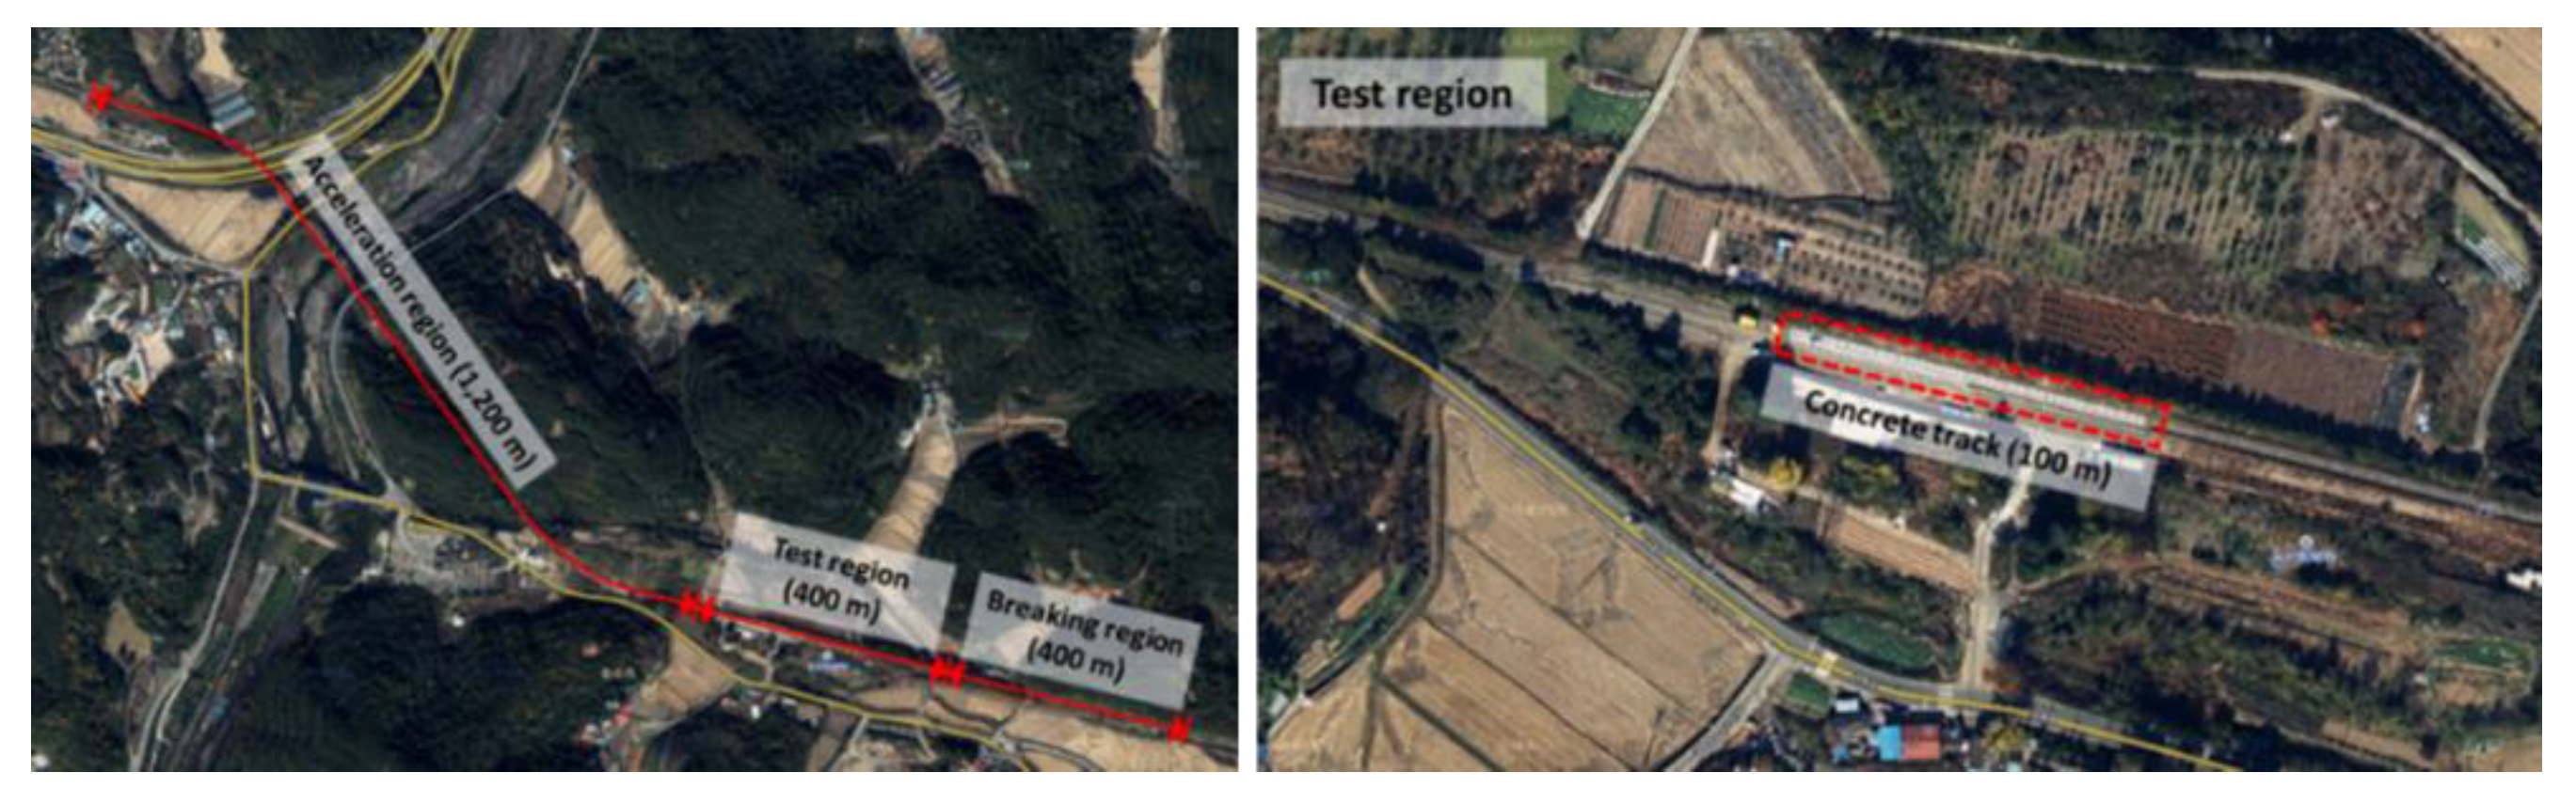
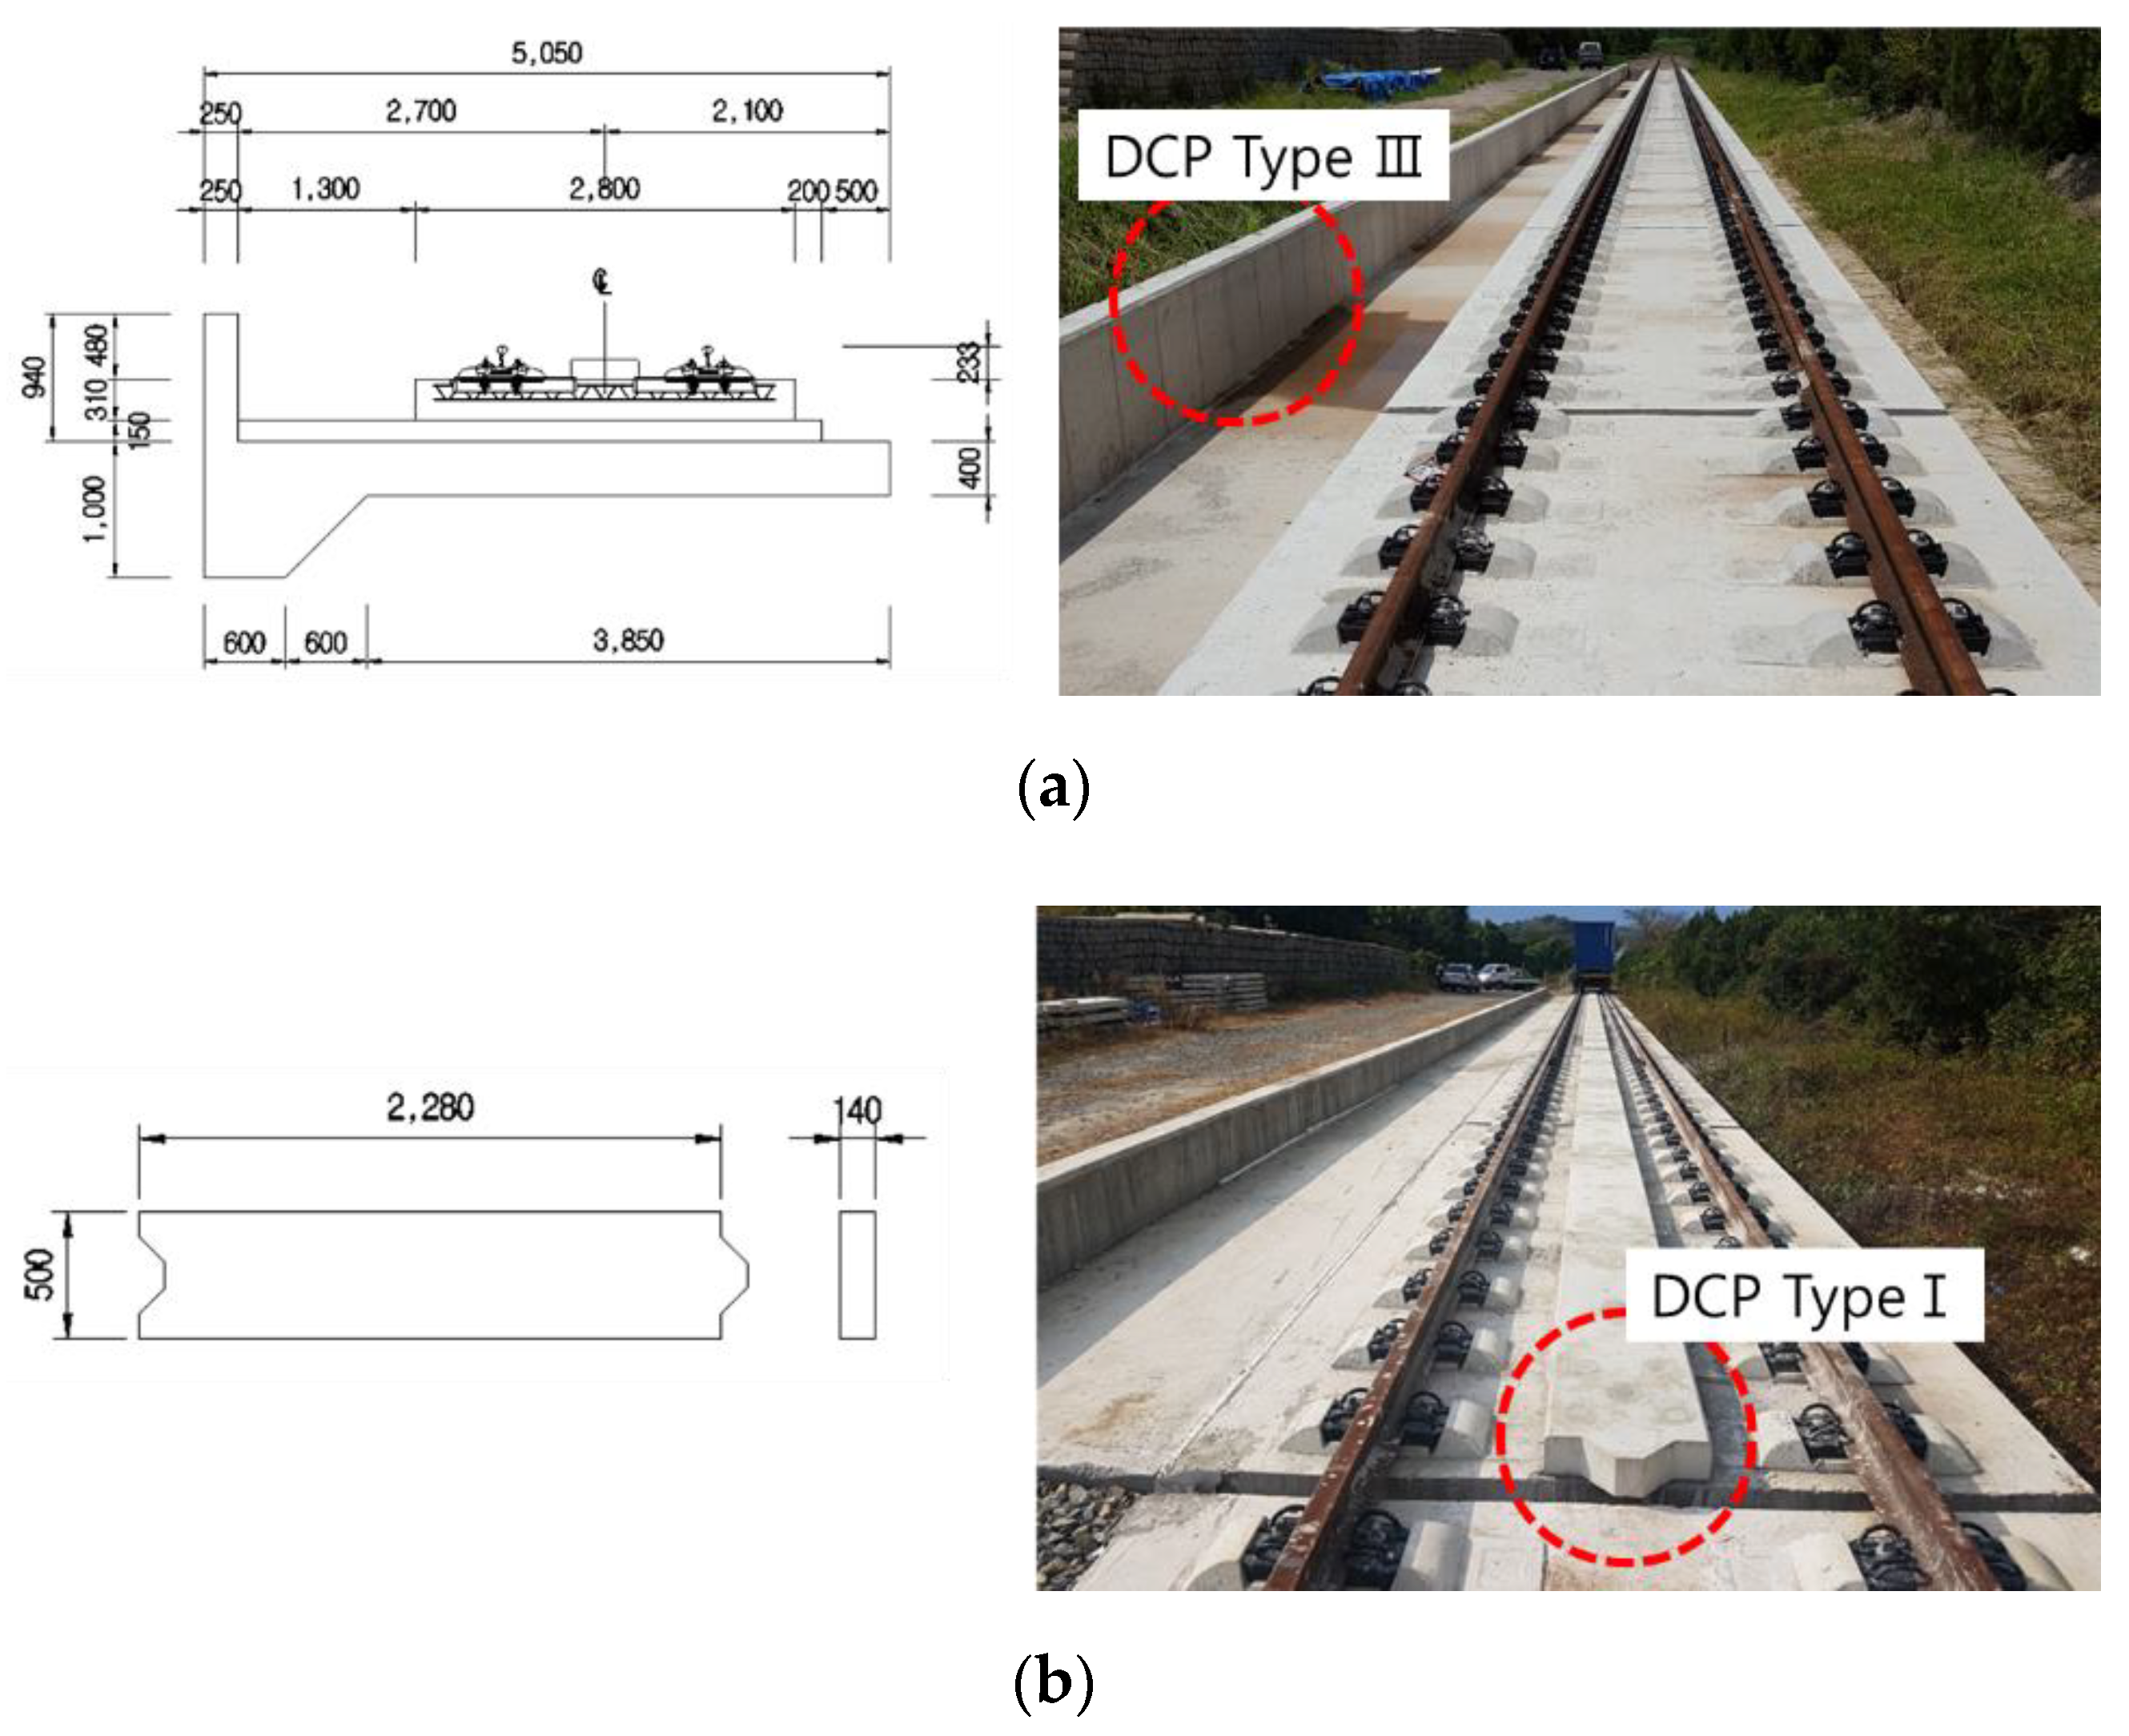
2.1. Real-Scale Test Site

In order to consider the actual conditions of the railway track, a part of the closed railway line within the Gyeongjeon line of the Korean railroad was created as a test site [20]. The test site was constructed in three regions as shown in Figure 3.
A test concrete track with the same structure and dimension of the Rheda 2000 track on the bridge was installed in the 100 m section of test region as shown in Figure 4a and Table 1. The robust precast concrete block structure in the form of DCP type I was installed on a 50 m test concrete track. The length, width, and height of one unit of this precast concrete block were 2280 mm, 500 mm, and 140 mm, respectively, as shown in Figure 4b and Table 1. Each precast concrete block was fixed to the TCL (track concrete layer) using anchors. Moreover, the additional concrete wall in the form DCP type III shown in Figure 4a was added 2700 mm away from the center of the track to ensure safety in the case where a DCP type I was not installed within the track gauge.

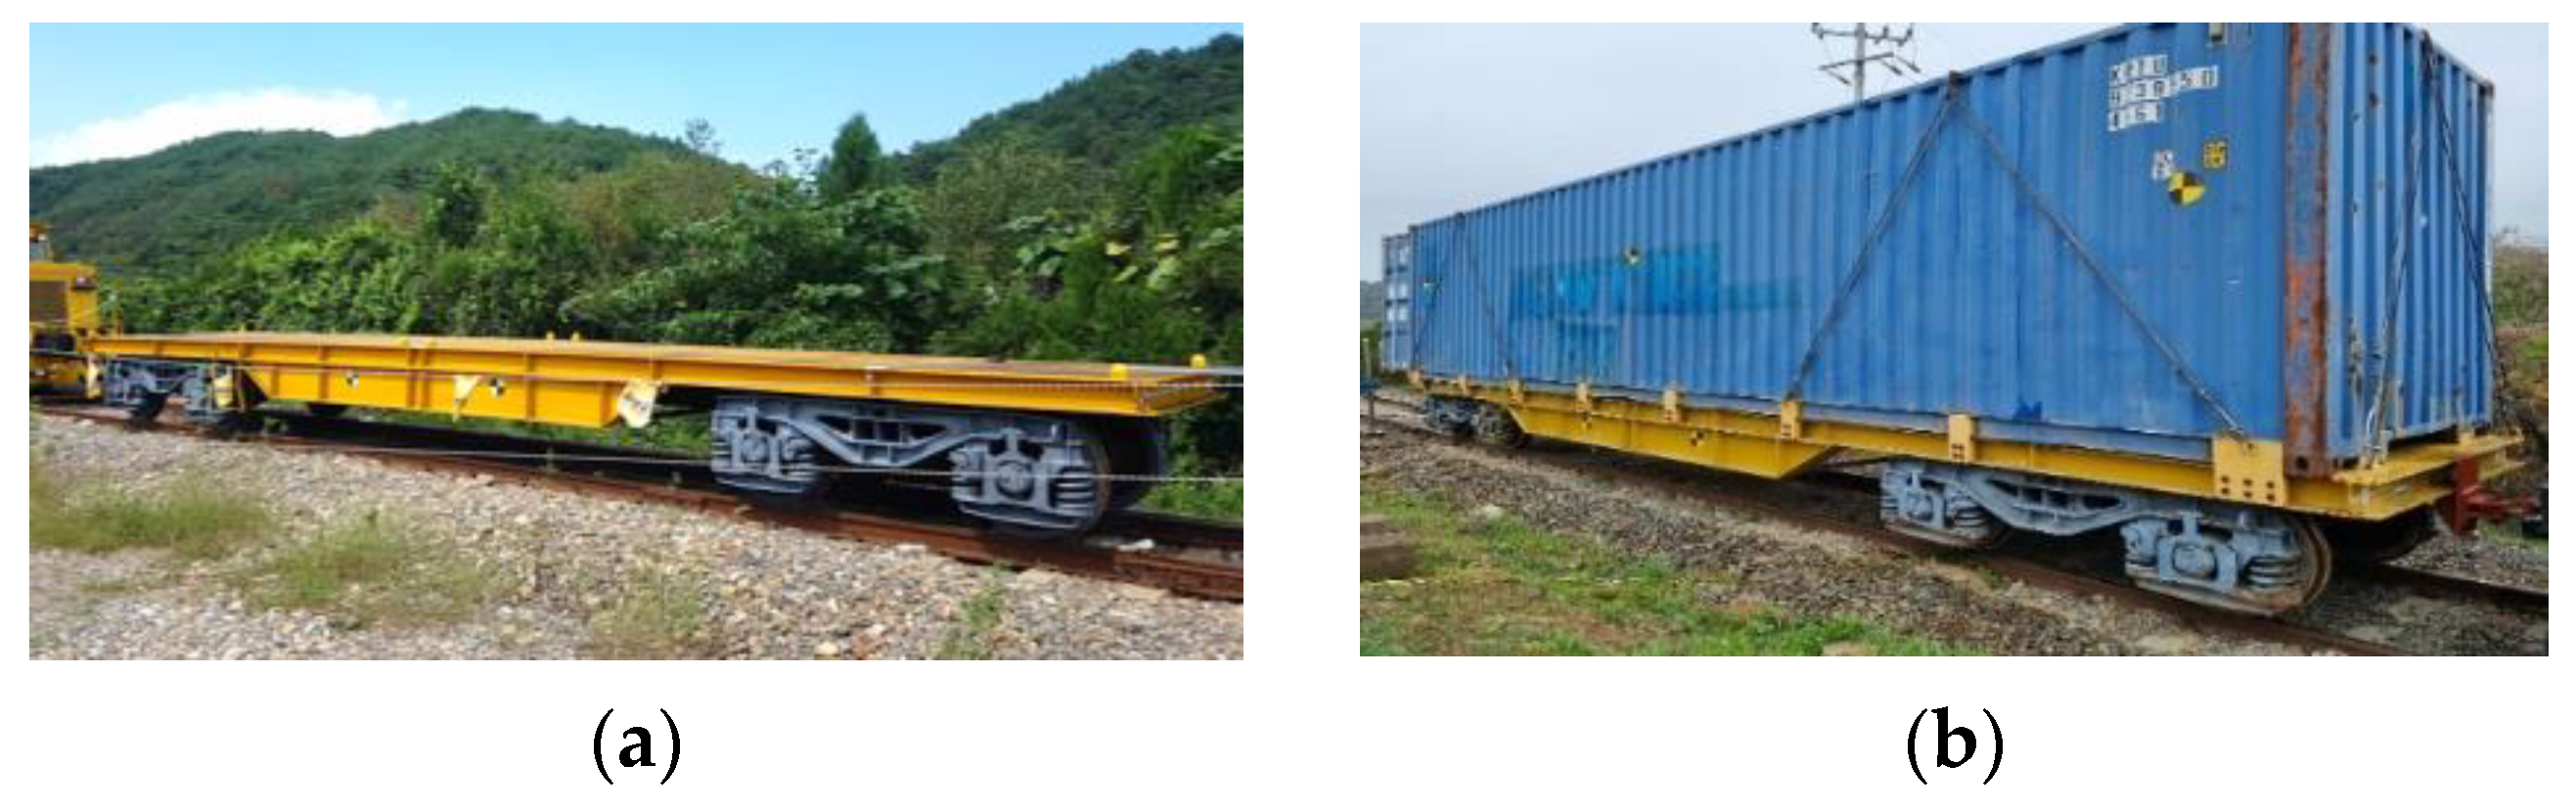
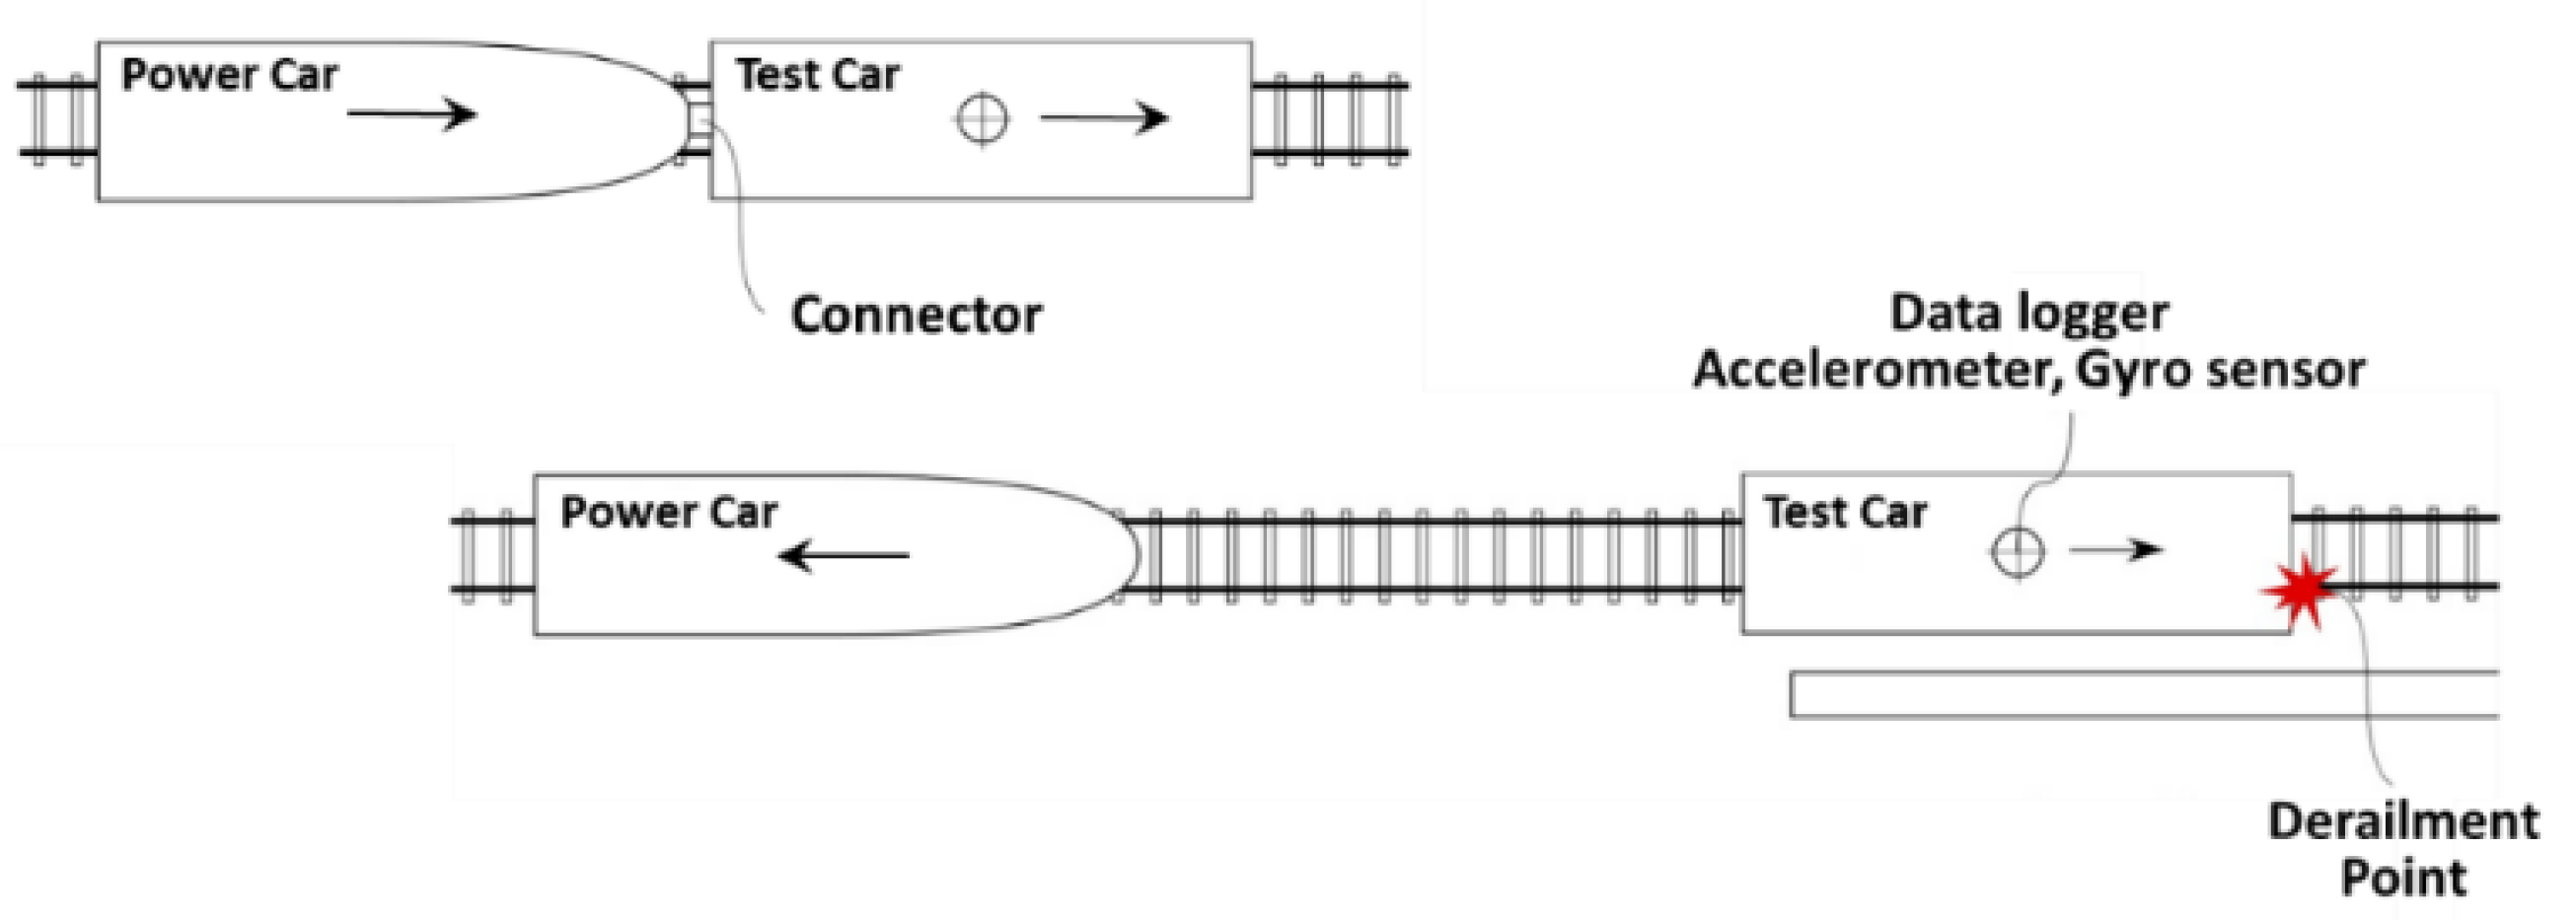
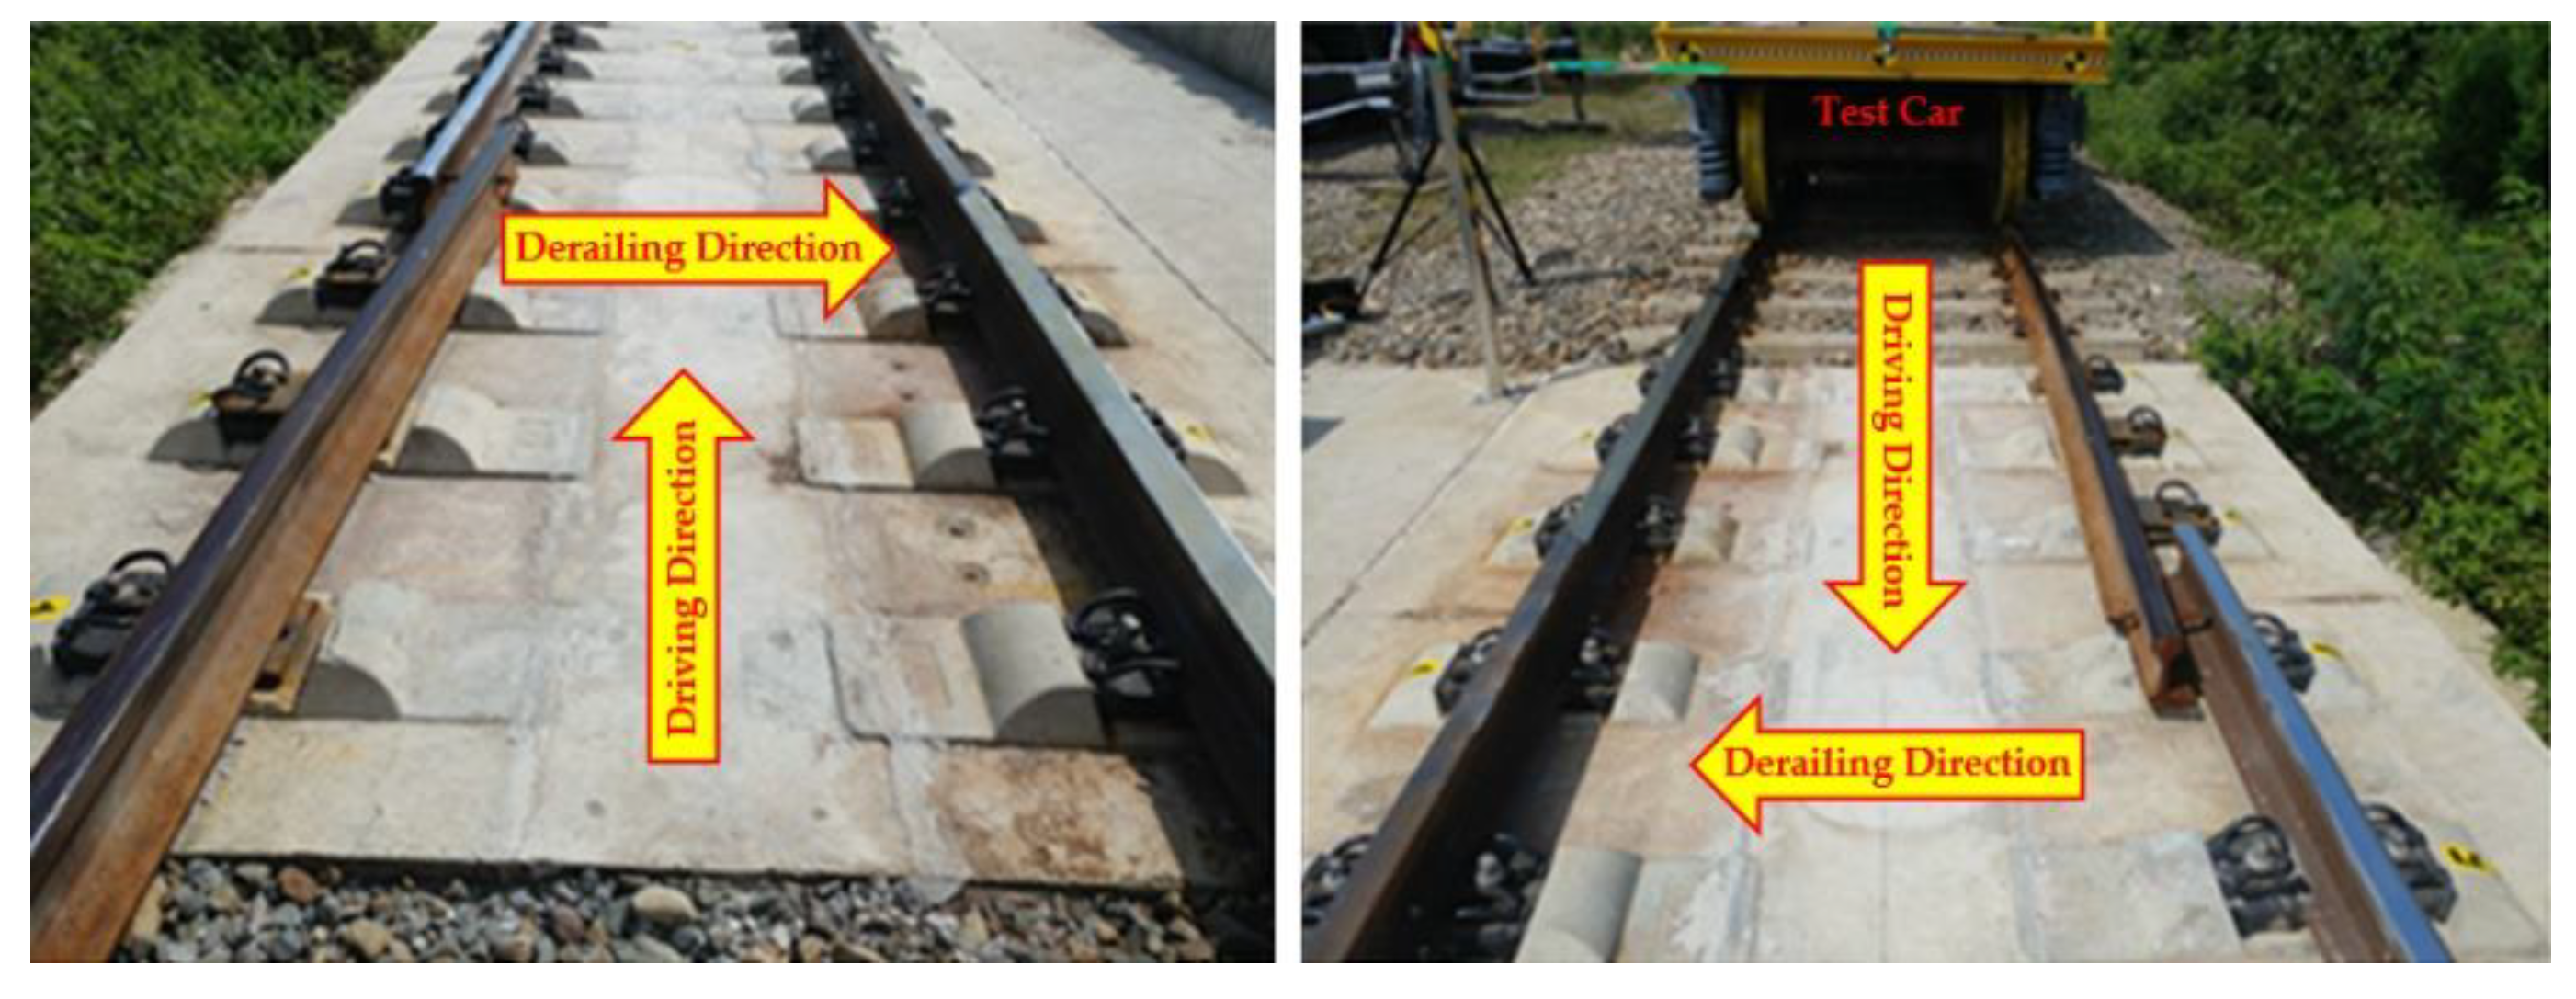
2.2. Test Car and Acceleration Method

The test freight car units used in this study were a flat wagon and a container wagon as shown in Figure 5. In our previous research [20], experiments were conducted on bogies. However, it was determined that the bogie model could not completely represent the behavior of the actual vehicle, so a wagon was selected as the test car. Moreover, in order to evaluate the effect of the change of mass and the center of gravity, flat and container wagons were selected. The specifications of the flat and container wagons are shown in Table 2.
A push system was used to accelerate the test car, as shown in Figure 6. A detailed description of this push system can be found in [20].

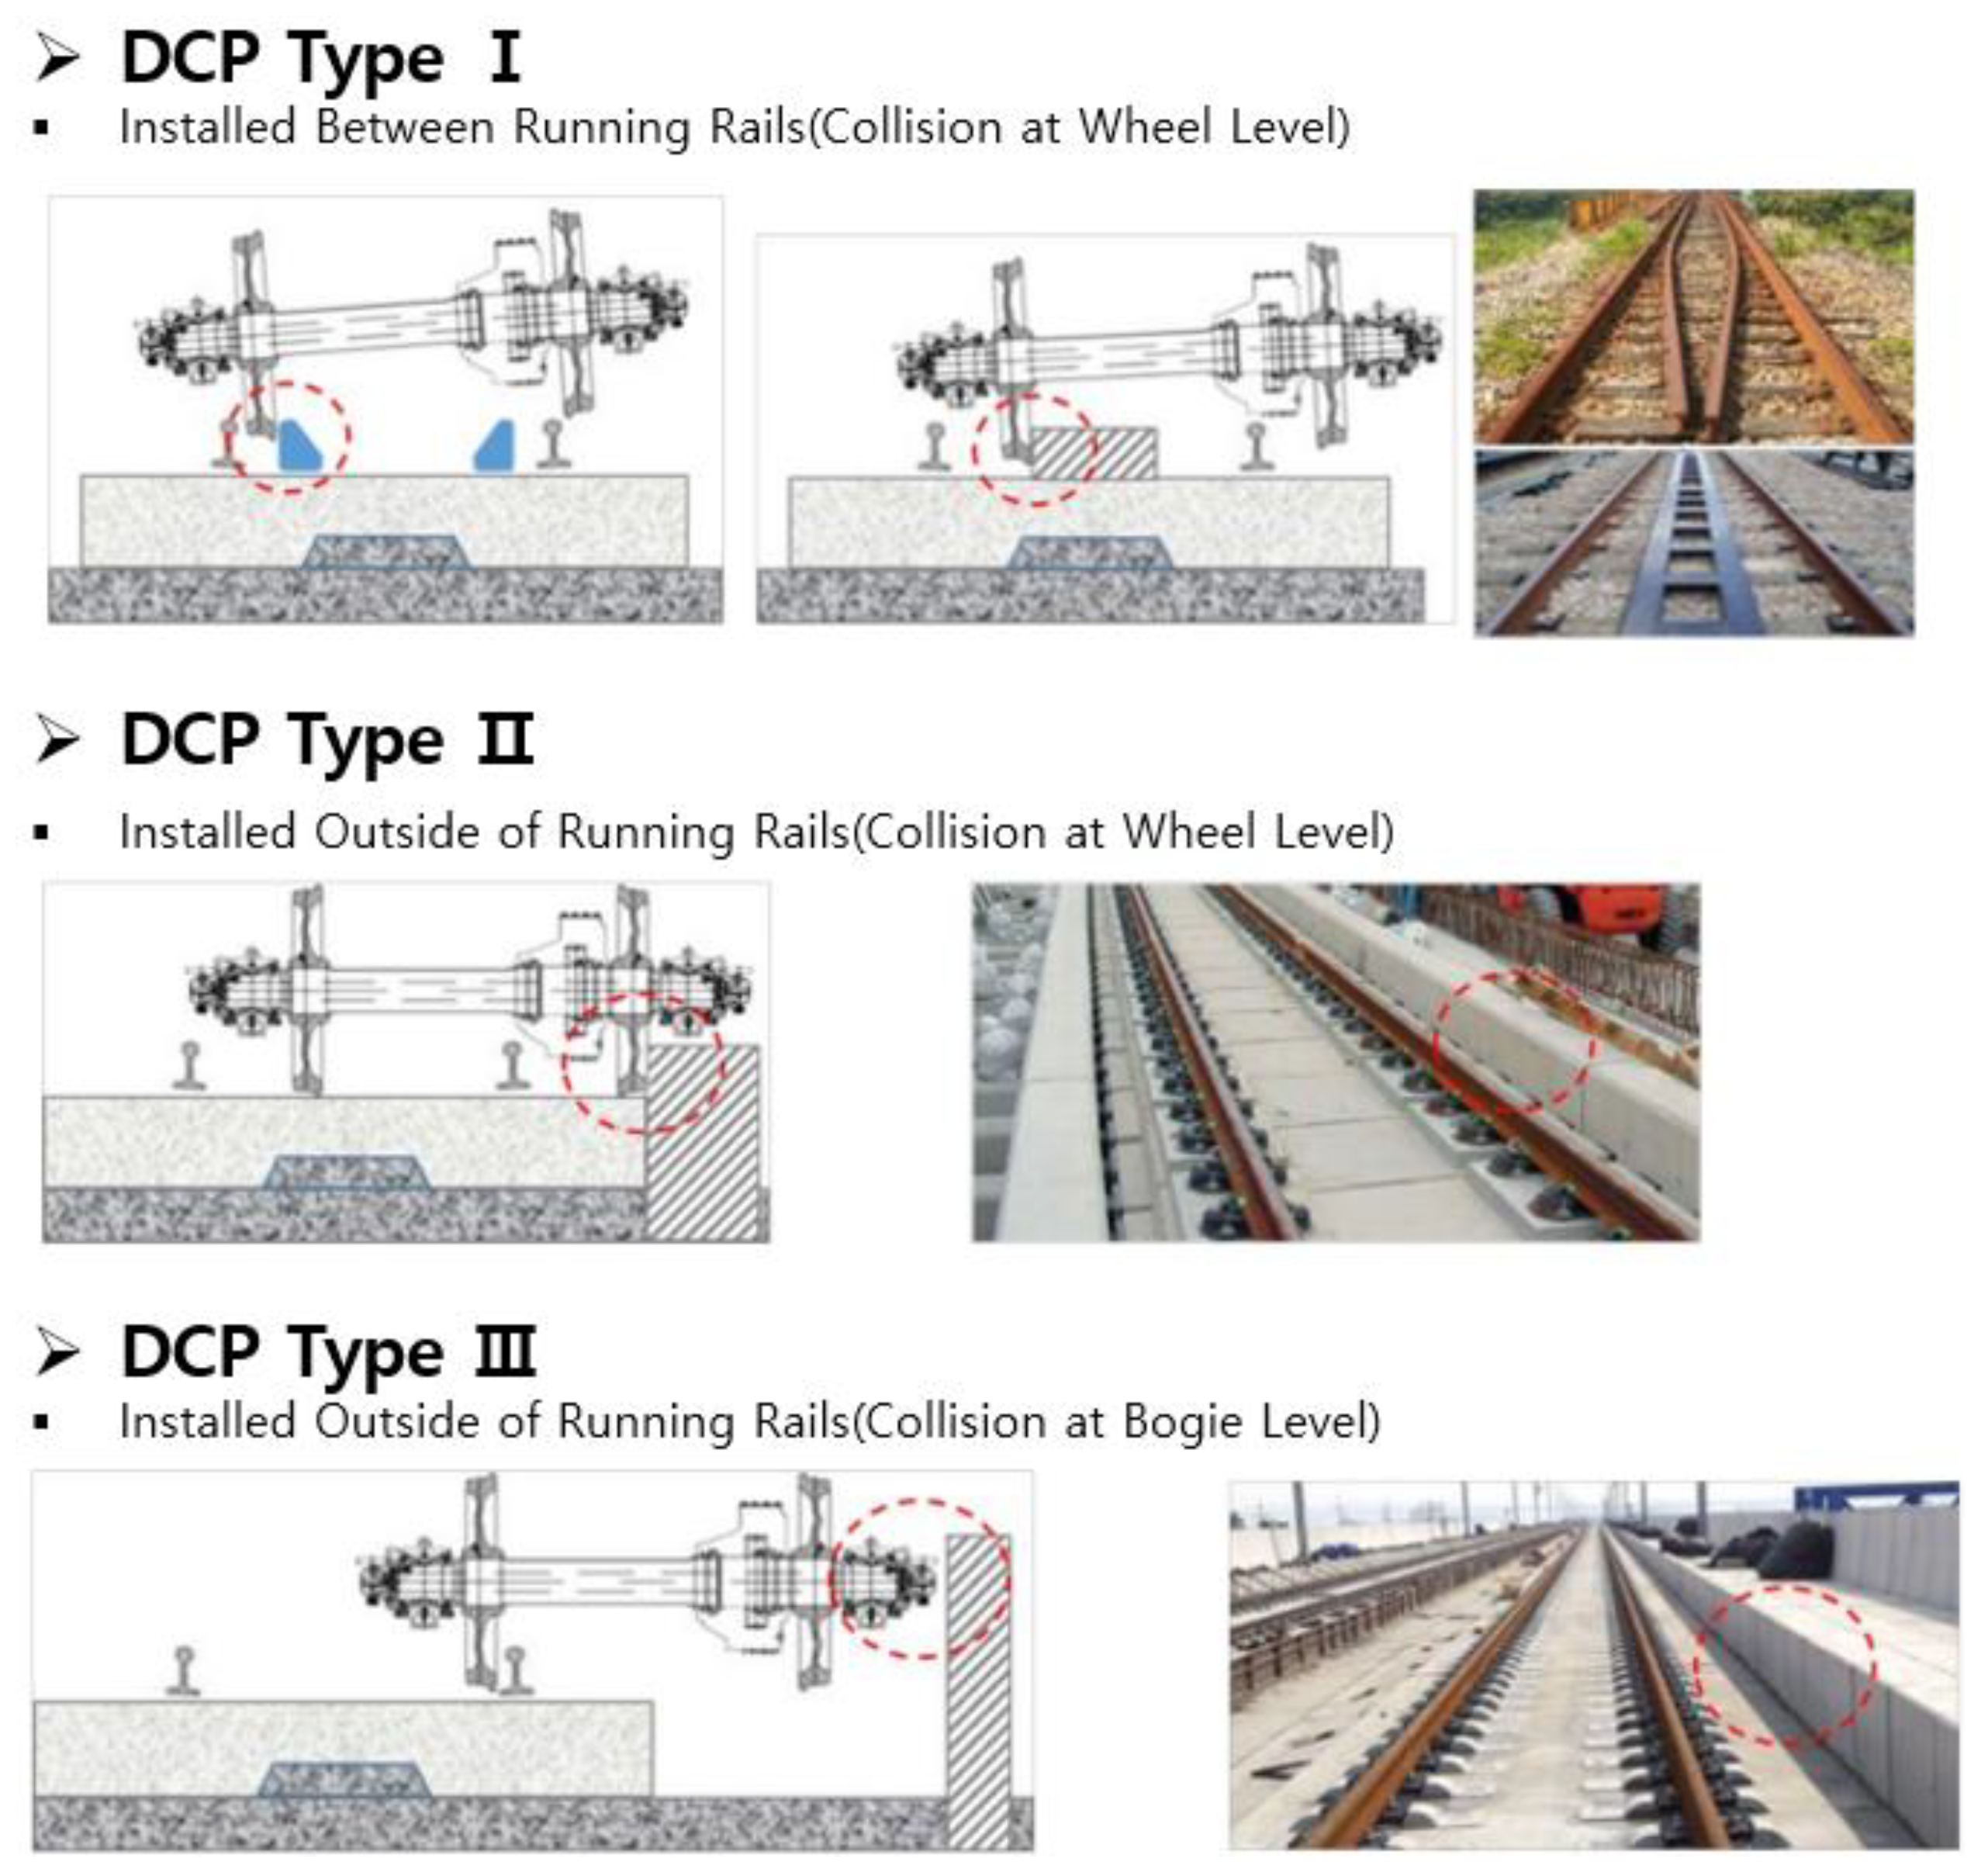
2.3. Derailer System

In this study, the derailment guidance system was designed to forcibly derail the test car by wheel-climbing. The track gauge was forcibly reduced by bending the left rail in the direction of vehicle travel to the inside of the track as shown in Figure 7. Due to the reduced track gauge, the flange of the right wheel of the test car strongly adheres to the head of the right rail in the running direction, and if the friction limit is exceeded, the test car is derailed. In order to make this wheel-climbing easier, the head of the right rail in the running direction was trimmed and oil was applied.

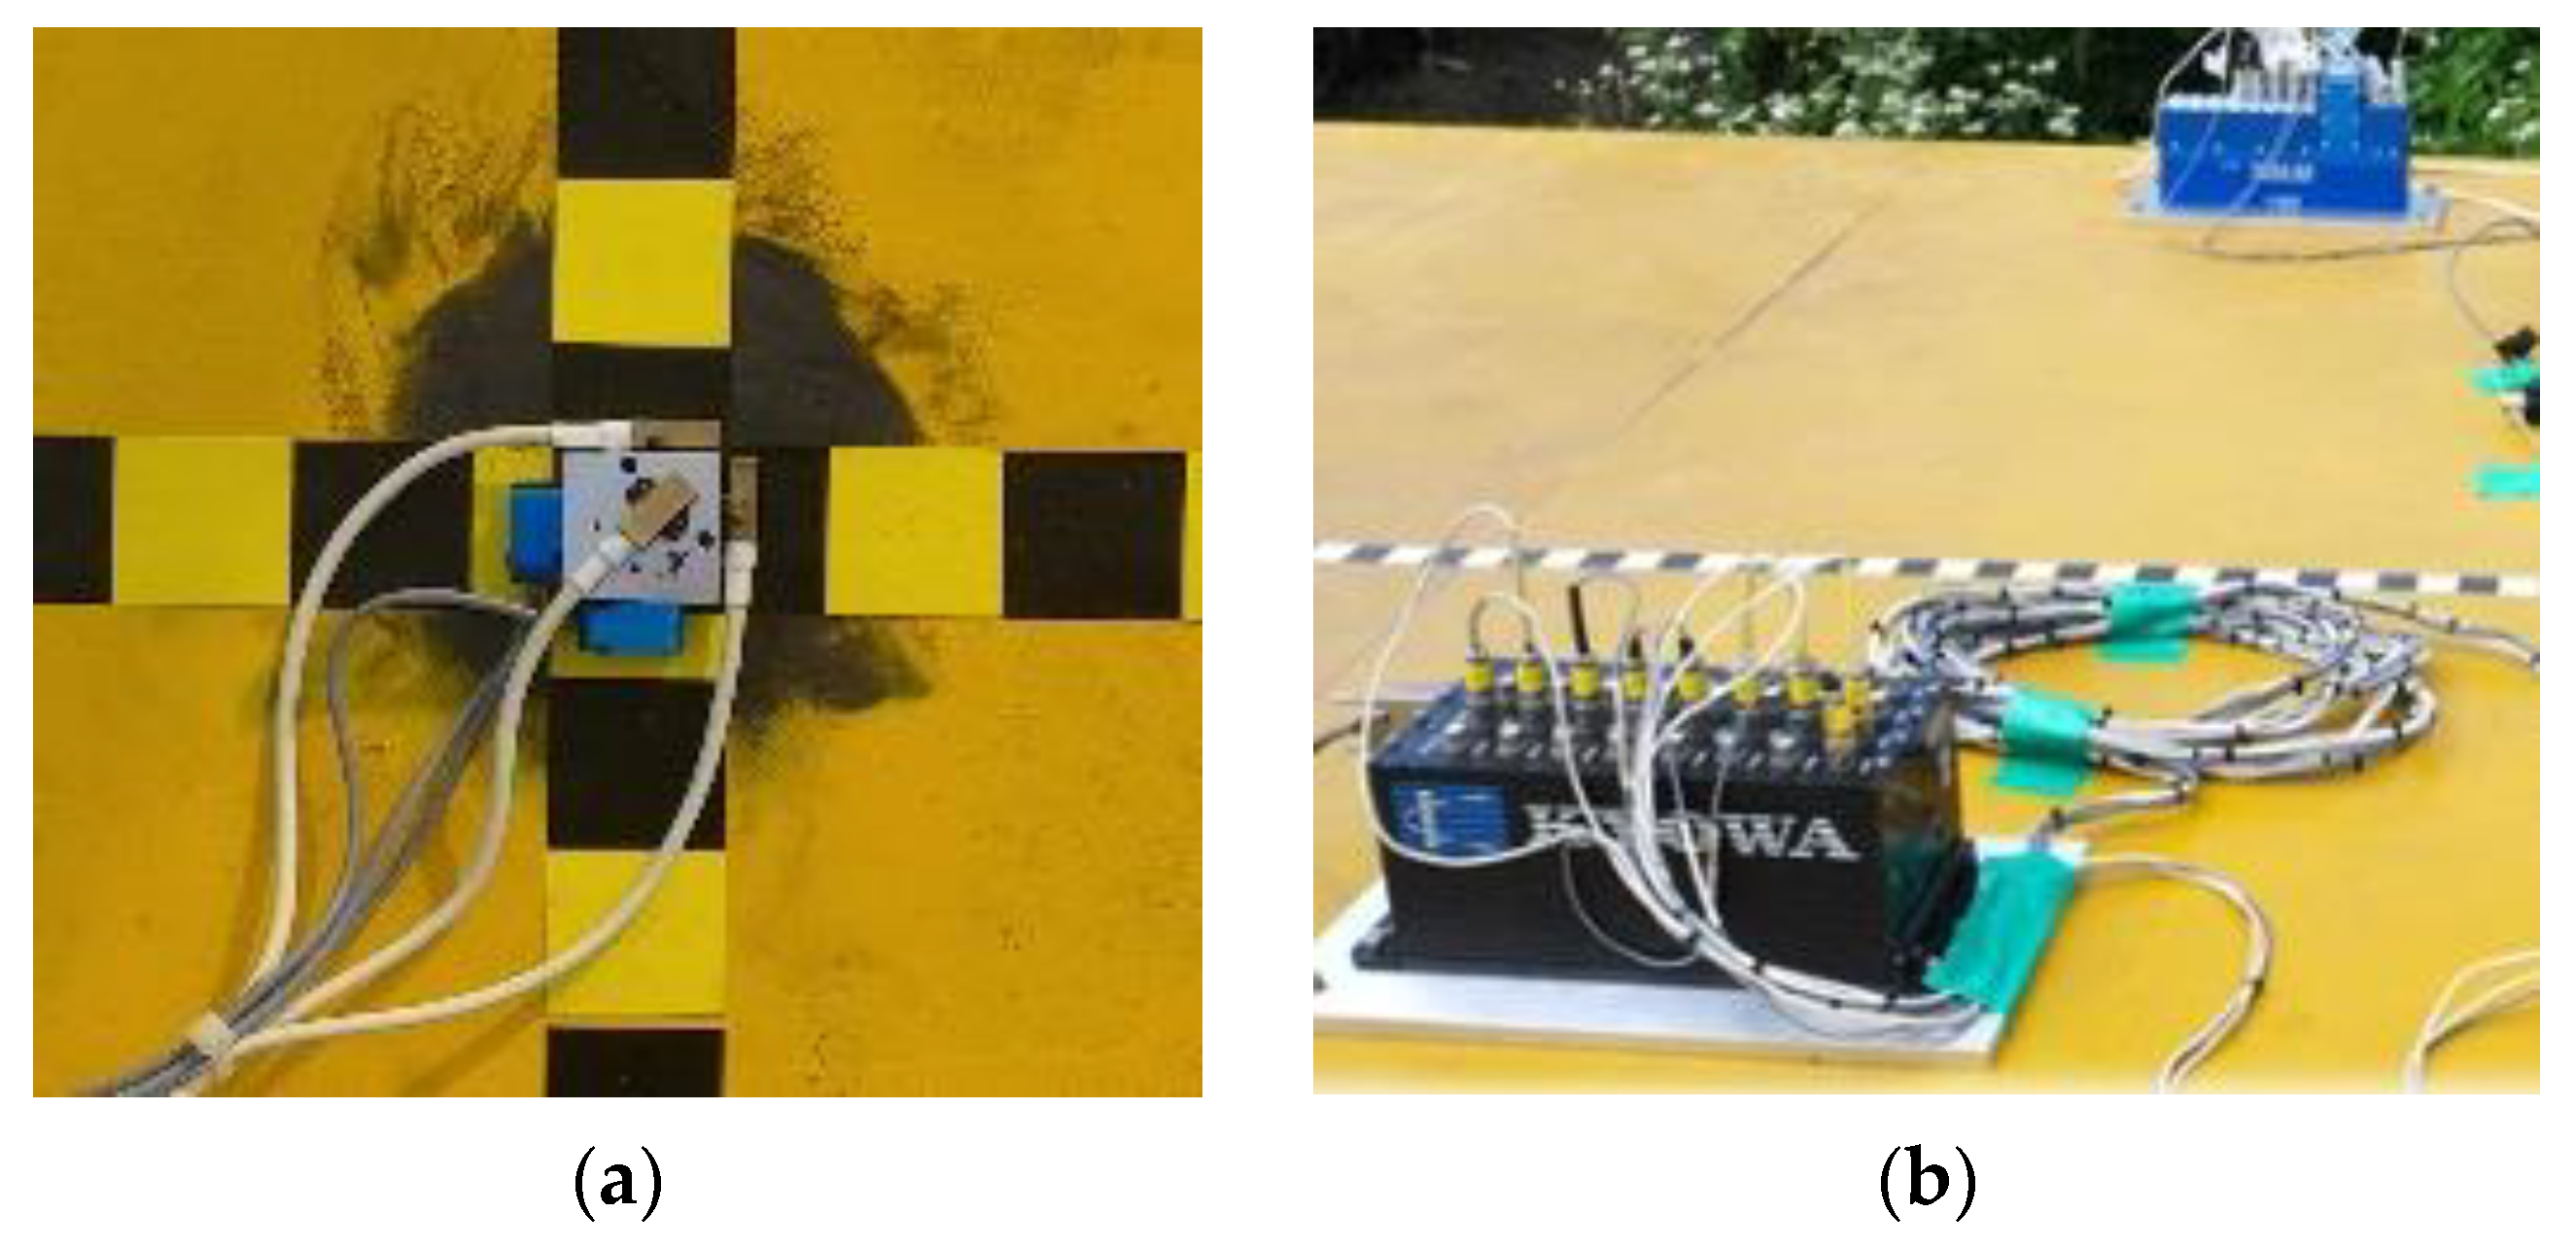
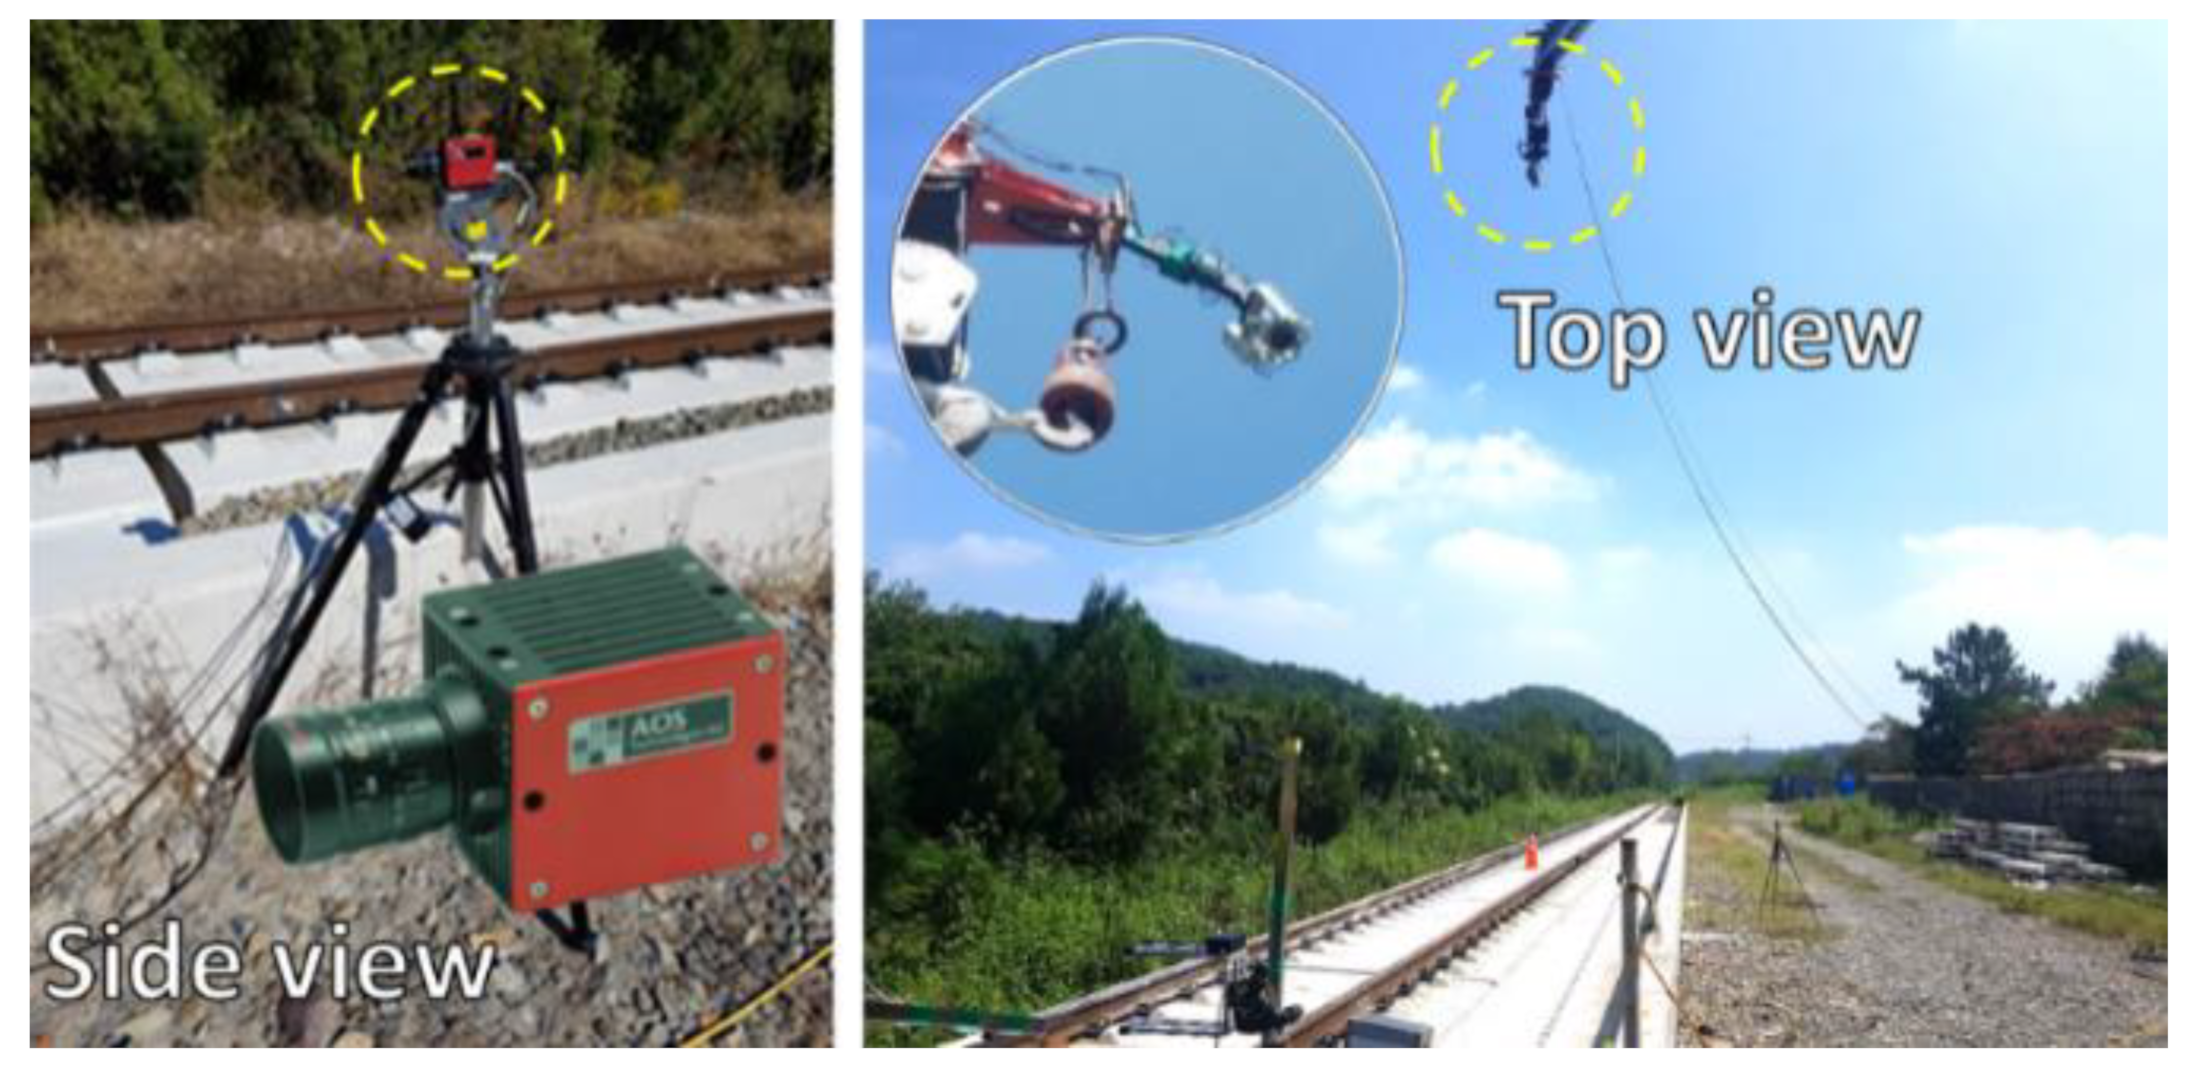
2.4. Data Acquisition System

The accelerometer, gyro sensors, and shock-resistant datalogger as shown in Figure 8 were installed on the top surface of the wagon body frame. Detailed specifications for the sensor and logger are given in [20].
Three high-speed cameras as shown in Figure 9 were used to accurately analyze the train’s behavior. One of the cameras was used with a crane to capture the top view, whereas the other two were used to capture the views from either side. A total of 1000 frames were obtained per 1 s (1000 fps).

3. Experimental Results
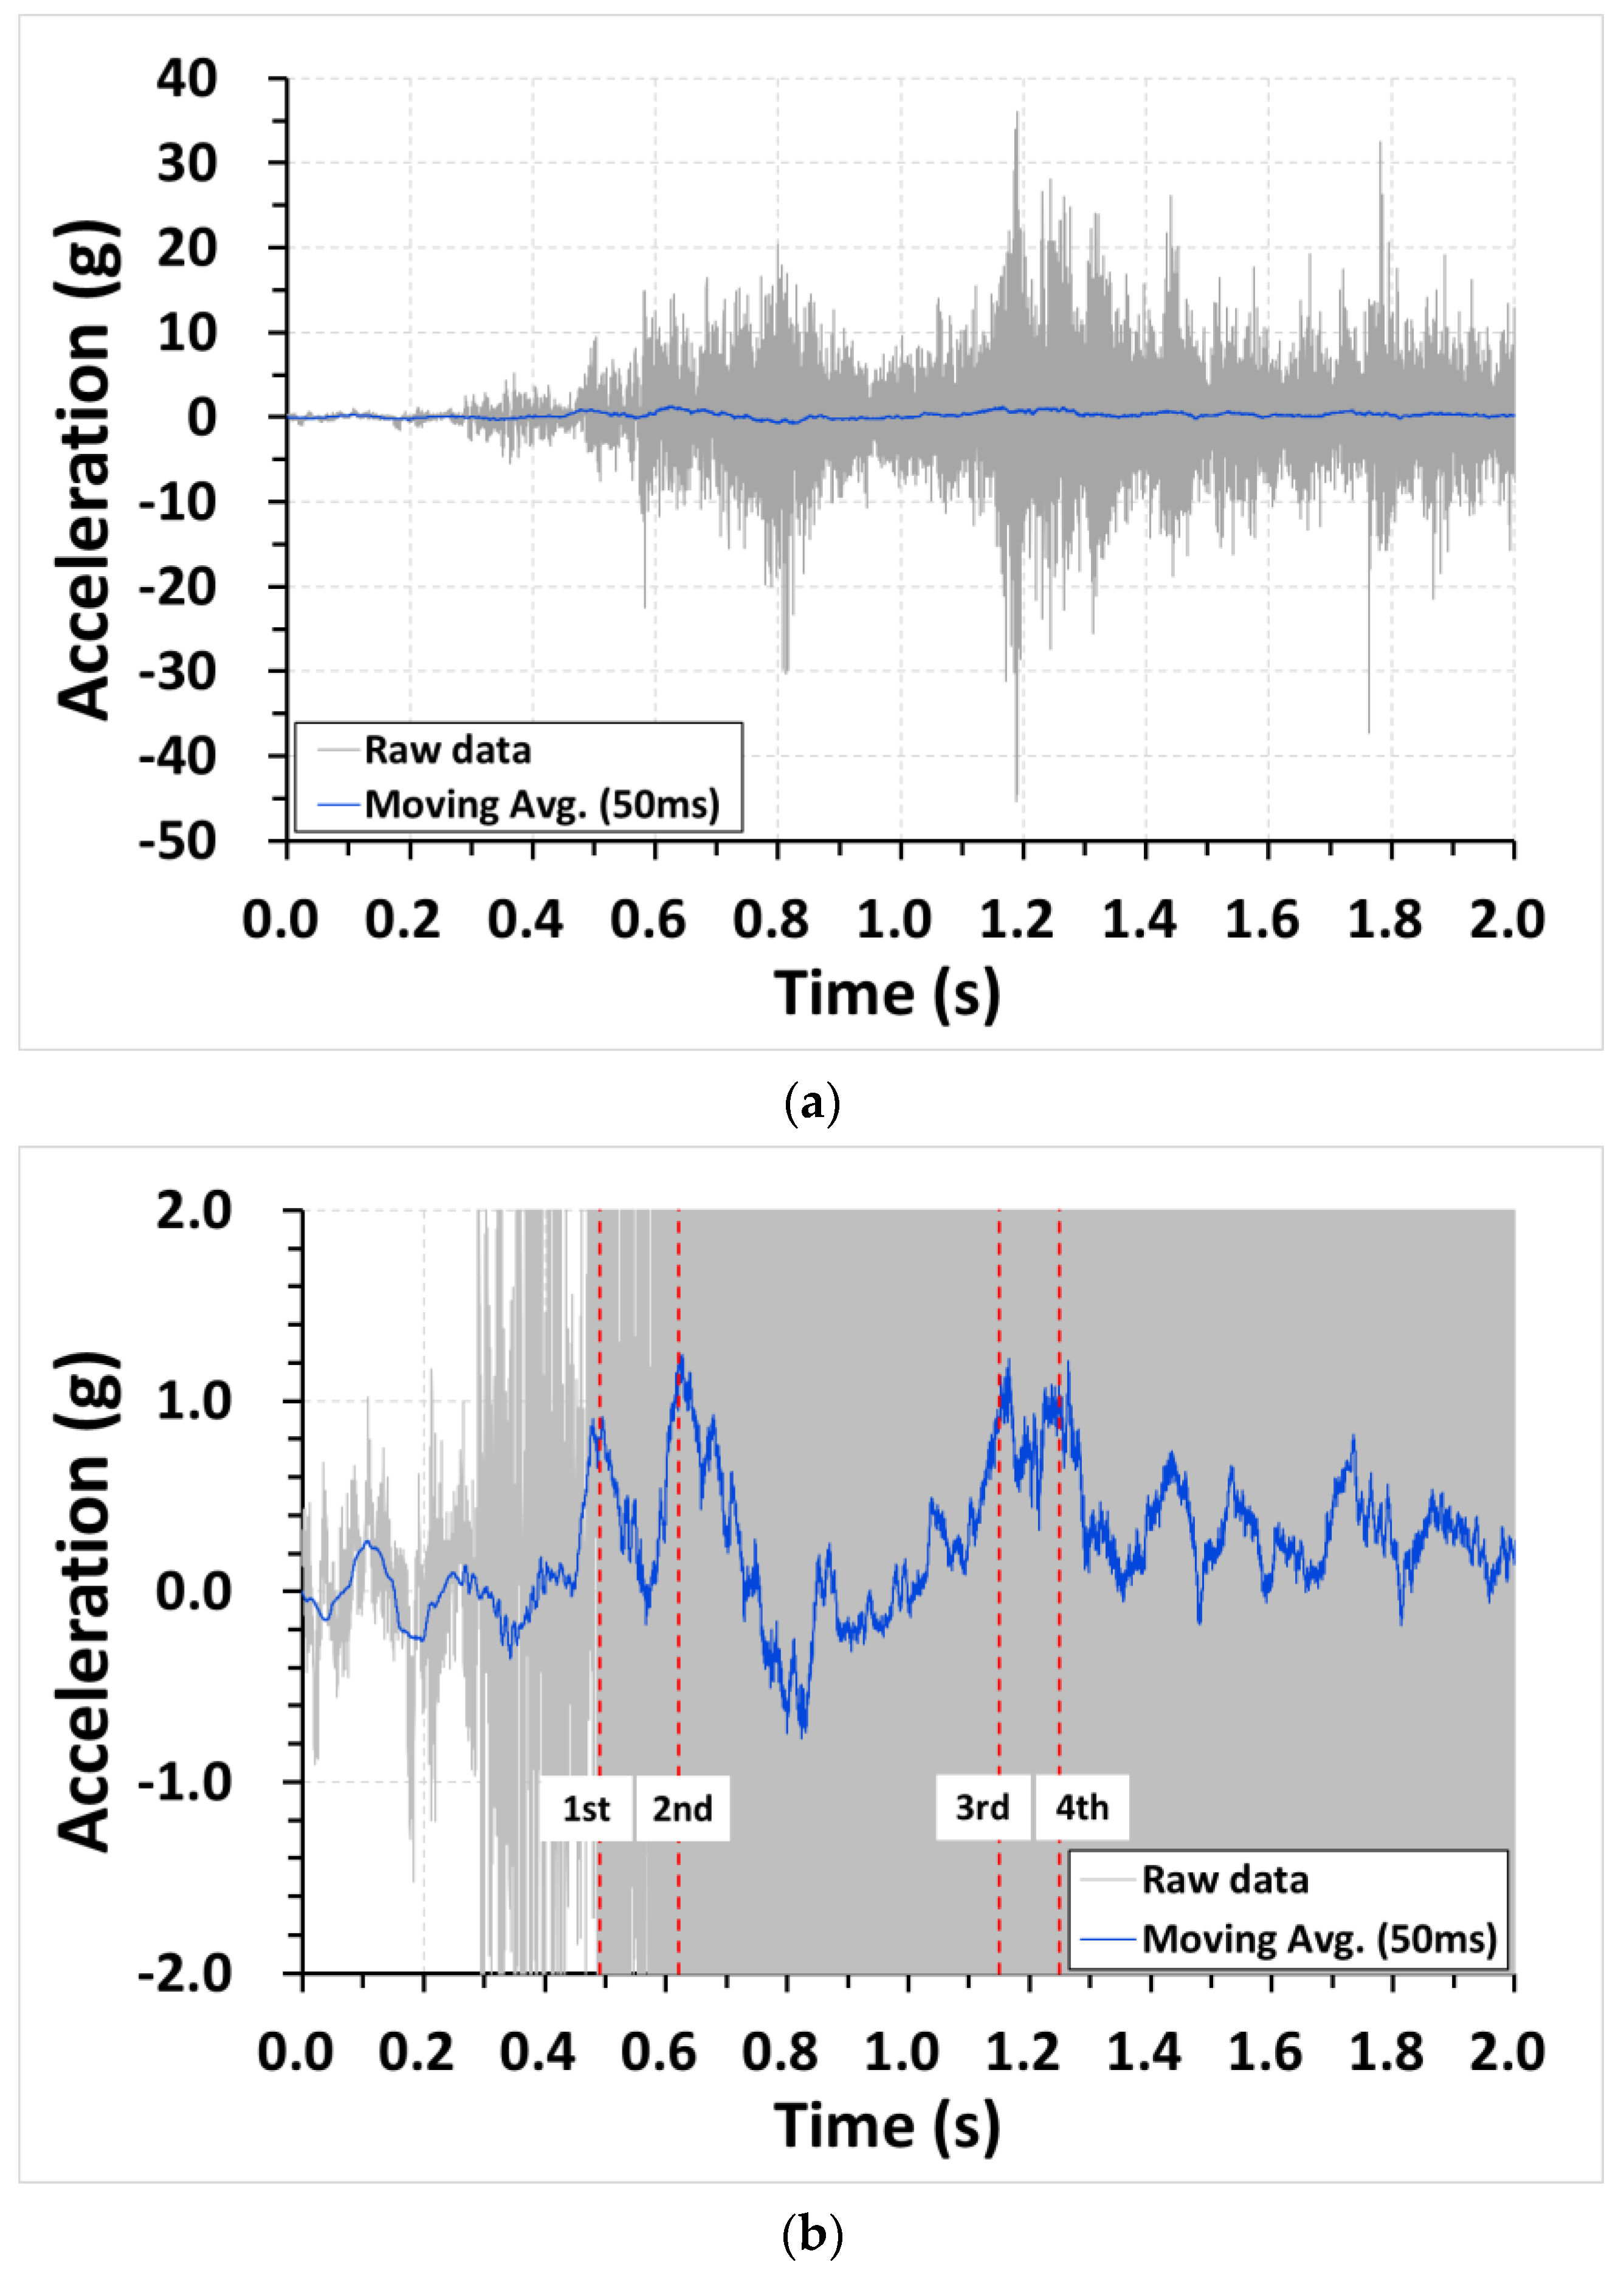
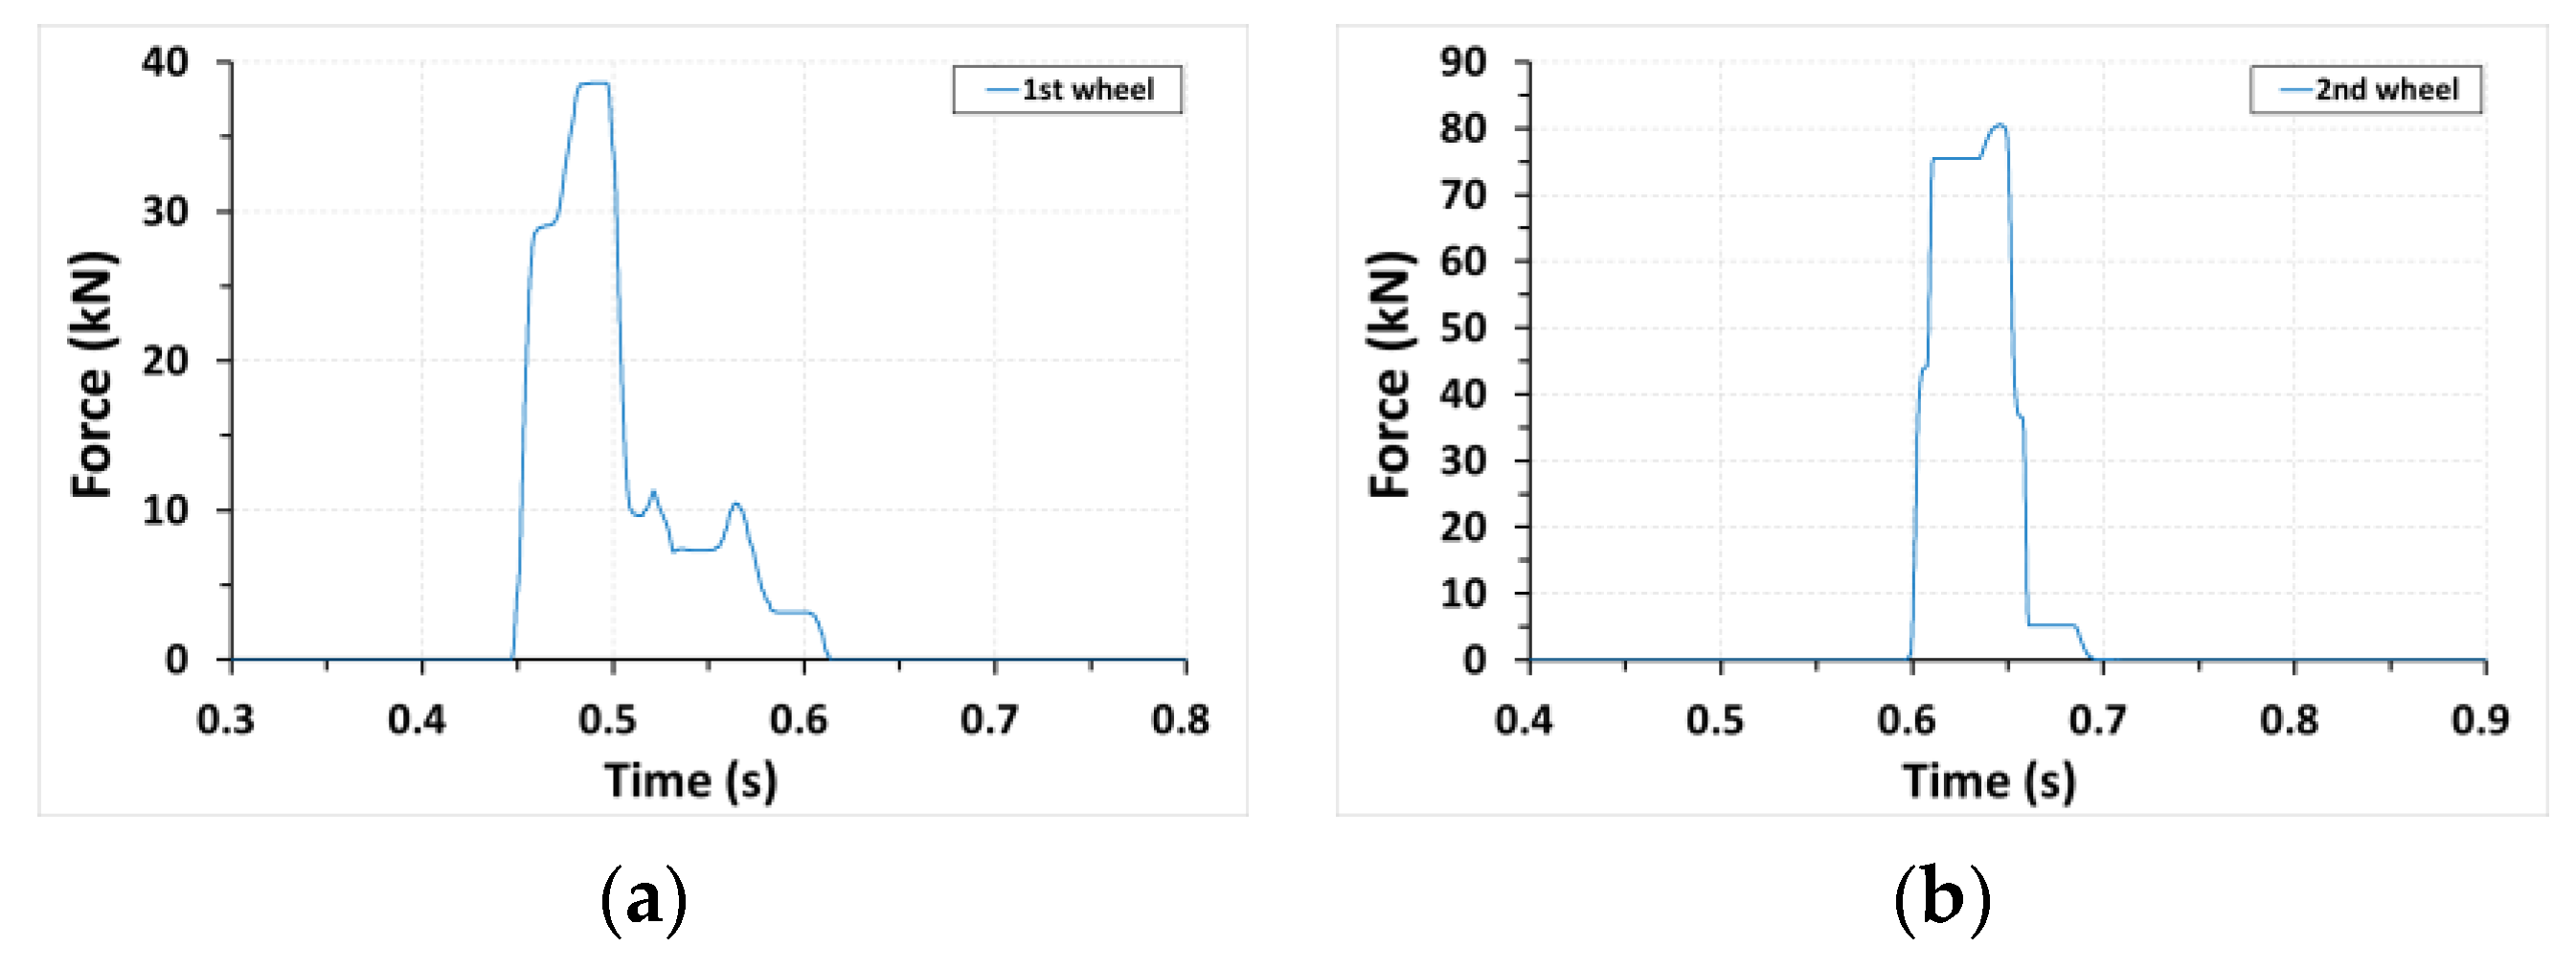
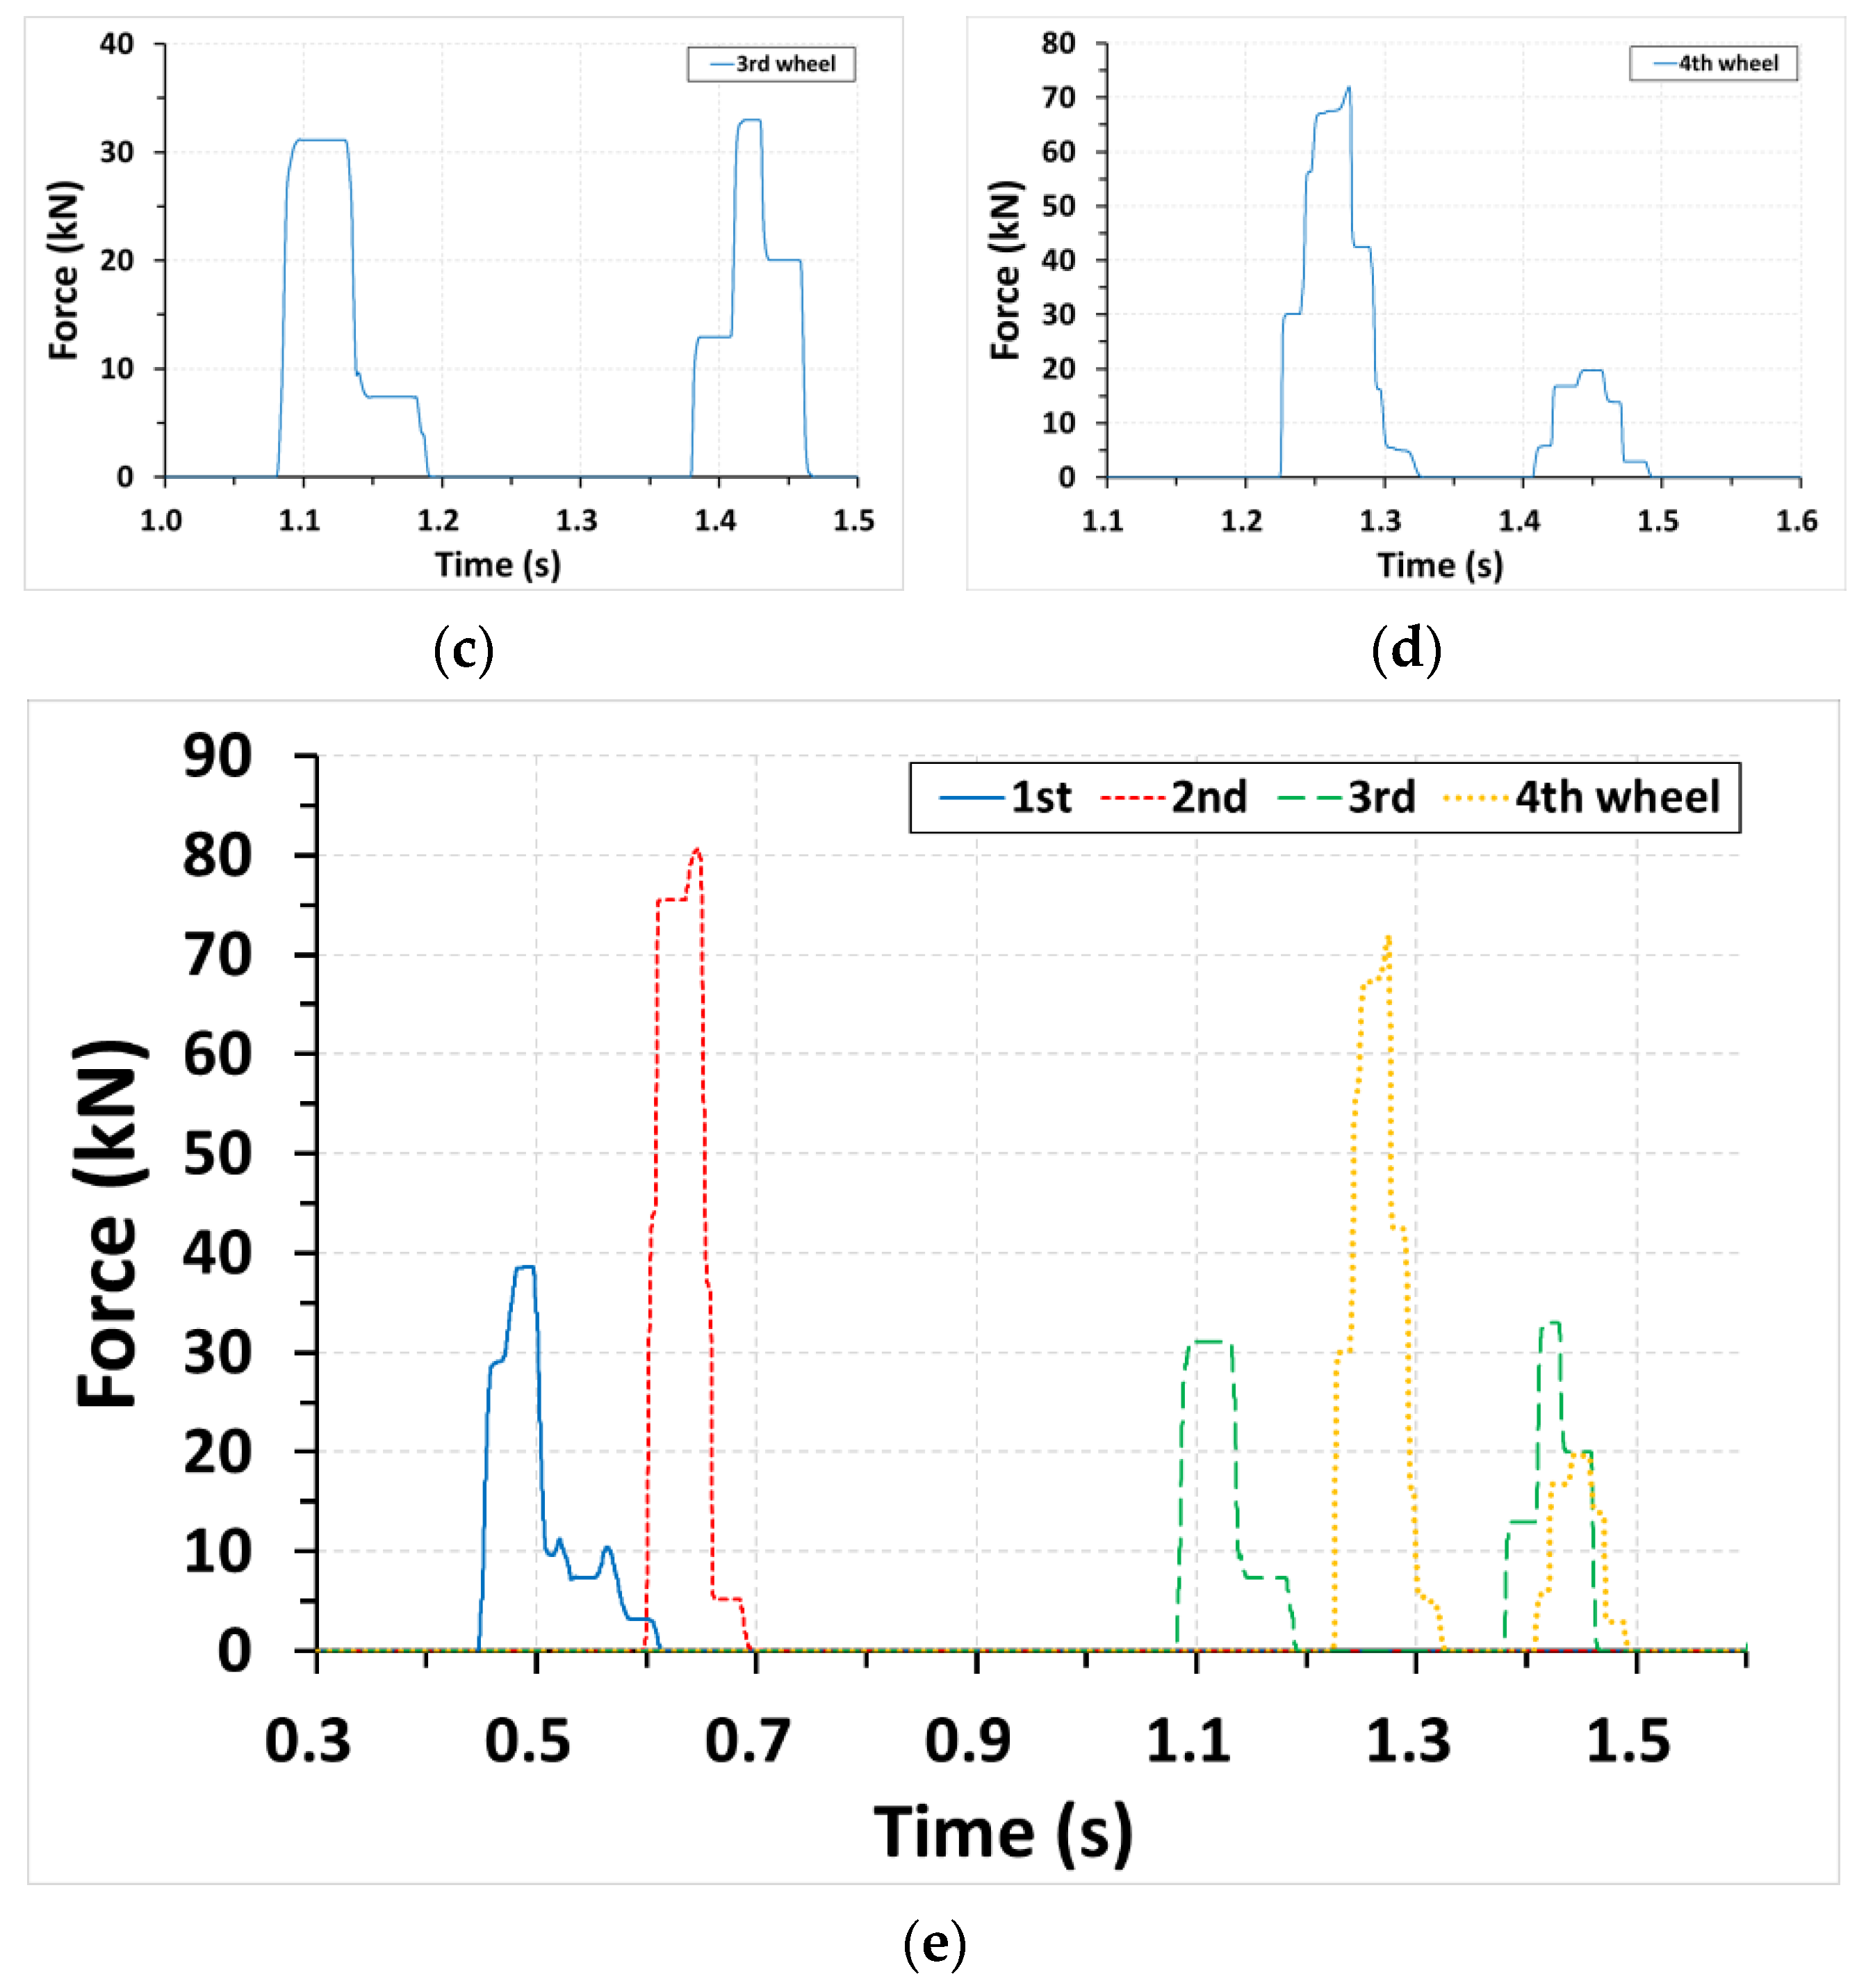
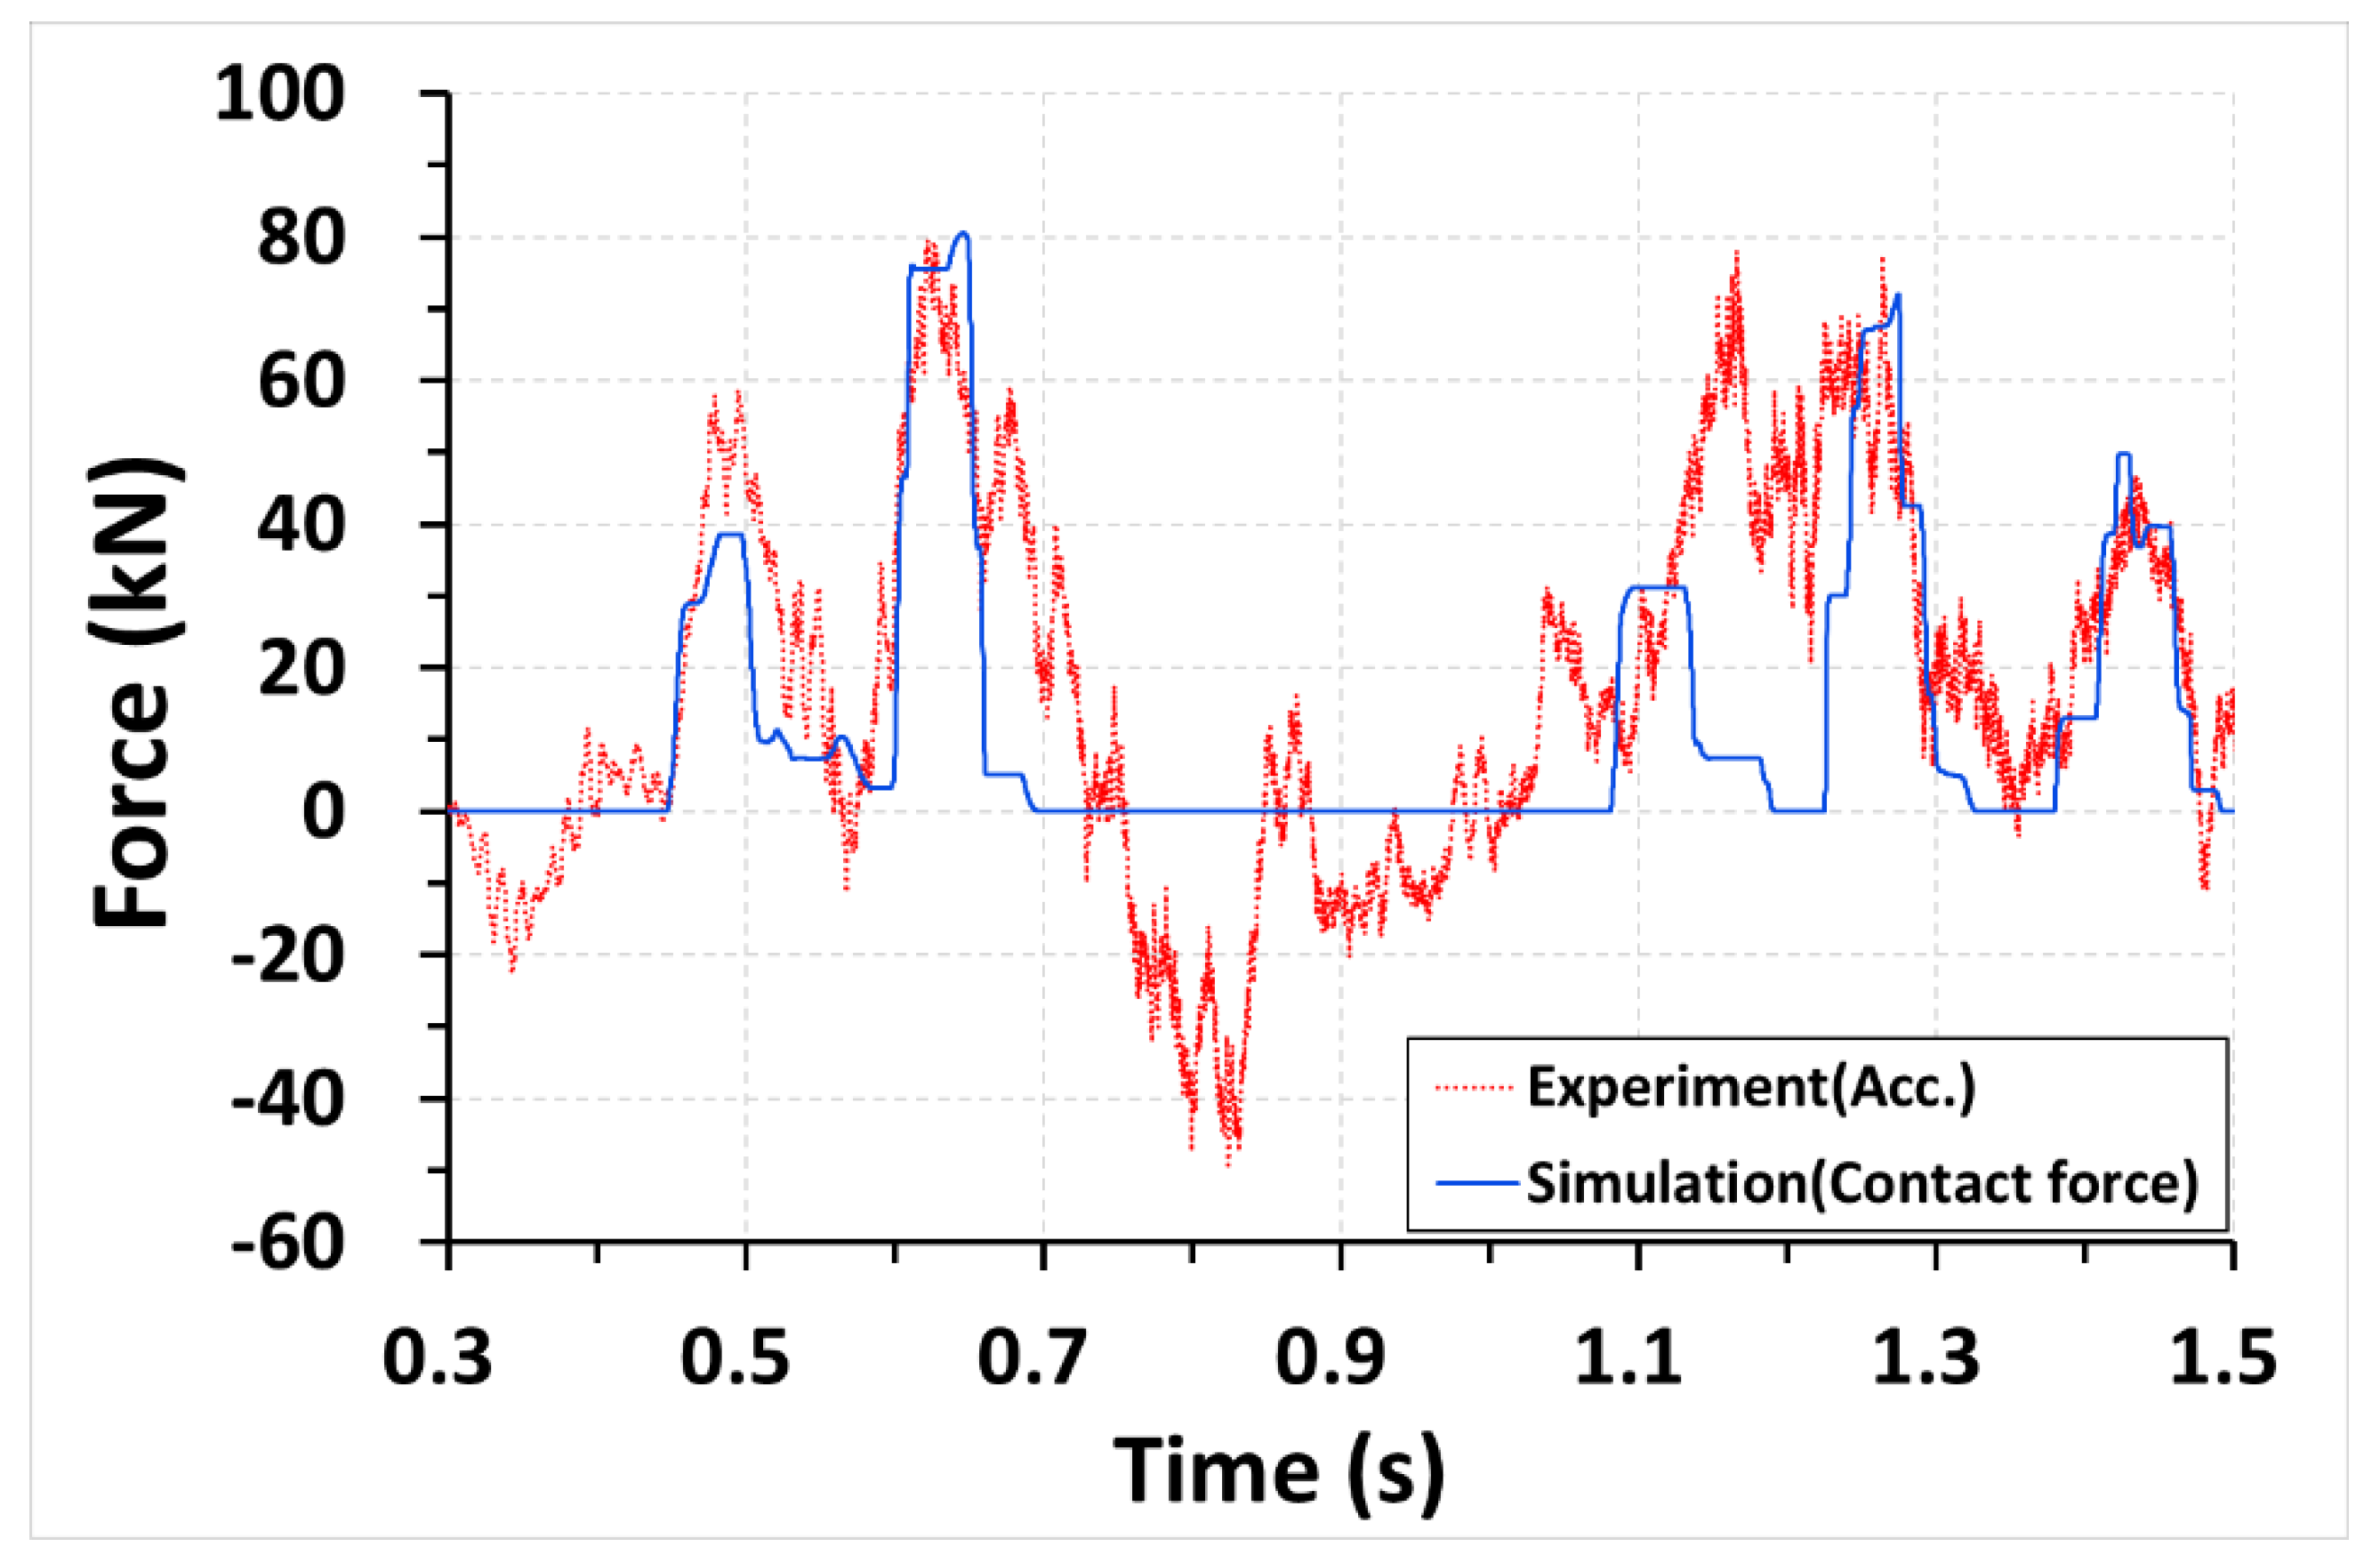
The target driving speed immediately before derailment of the test cars was 45–50 km/h. The testing was performed on a flat wagon with DCP type I installed within the track gauge. Moreover, the additional testing was performed on a container wagon with an increased weight and higher center of gravity under the condition that the same DCP was installed to compare the difference in behavior with the flat wagon.
In order to analyze data such as acceleration measured in an experiment, it was necessary to filter the raw data with unexpected noise. The moving average method was applied as a representative data filtering method. In particular, in the previous study [22], it was found that the 50 ms moving average method is very suitable not only for the smoothing of the raw data but also for deriving the equivalent static design load of the vehicle collision protection facility. Therefore, the measurement raw data obtained at a 10,000 Hz frequency were analyzed by adopting the 50 ms moving average method.

3.1. Collision Load

In order to analyze the functionality of DCP, it was necessary to evaluate whether the course of the derailed train was intentionally controlled and whether it robustly resisted the impact load caused by the collision with the derailed train. The speed of the flat wagon measured just before the derailment was 51.16 km/h. The derailed wheels collided with the sleeper humps of the concrete track immediately after derailment. Subsequently, the inner wheels continuously collided with the DCP, thereby containing lateral movement, as shown in Figure 10. Through the top-view high-speed camera image, Figure 11 shows more clearly that it prevented the derailed vehicle by DCP installed within track gauge from deviating excessively in the lateral direction.
The collision (impact) load through the experiment can be calculated by Newton’s second law. In the results of the actual vehicle collision test conducted in previous studies [22], it was analyzed that the magnitude of the collision (impact) load estimated by the vehicle acceleration data may have been overestimated. This was because, in the case of a long vehicle such as a trailer, only a portion of the total mass is reflected in the collision load calculation. The collision load through the simulation can be calculated by Newton’s second law or from the contact force between the wheel and DCP.
In order to verify the method for calculating the collision load between the derailed train and DCP, the collision load according to Newton’s second law and the contact force by the simulation were compared and analyzed. The contact force by the simulation was estimated using the analysis method and simulation model developed and verified in the previous paper [21].
The raw and filtering data using the 50 ms moving average method for the lateral acceleration of the flat wagon through experiments are shown in Figure 12. At 0.49 s, the first wheel of the front bogie collided with the DCP, and at 0.62 s, the second wheel of the front bogie collided with the DCP. The lateral contact force for each wheel obtained through the simulation results is shown in Figure 13. It can be seen that the maximum lateral acceleration and lateral contact force were generated when the second wheel of the front bogie collided with the DCP.
In the case of the test flat wagon in this study, when the second wheel of the front bogie collided with the DCP after derailing, the rear bogie was still on the rail, so it can be assumed that 50% of the total mass was involved in the collision load. Table 2 shows the comparison of the contact force (simulation result) generated when the second wheel of the front bogie collided with the DCP and the collision load (experimental result) using Newton’s second law. In Table 3 and Figure 14, it can be seen that the collision load by the experiment considering only 50% of the total mass agreed well with the contact force by the simulation. That is, when the front bogie of a derailed railway car collides with the DCP, if the rear bogie has not yet derailed, it can be seen that the mass contributing to the maximum collision load at this time is 50% of the mass.

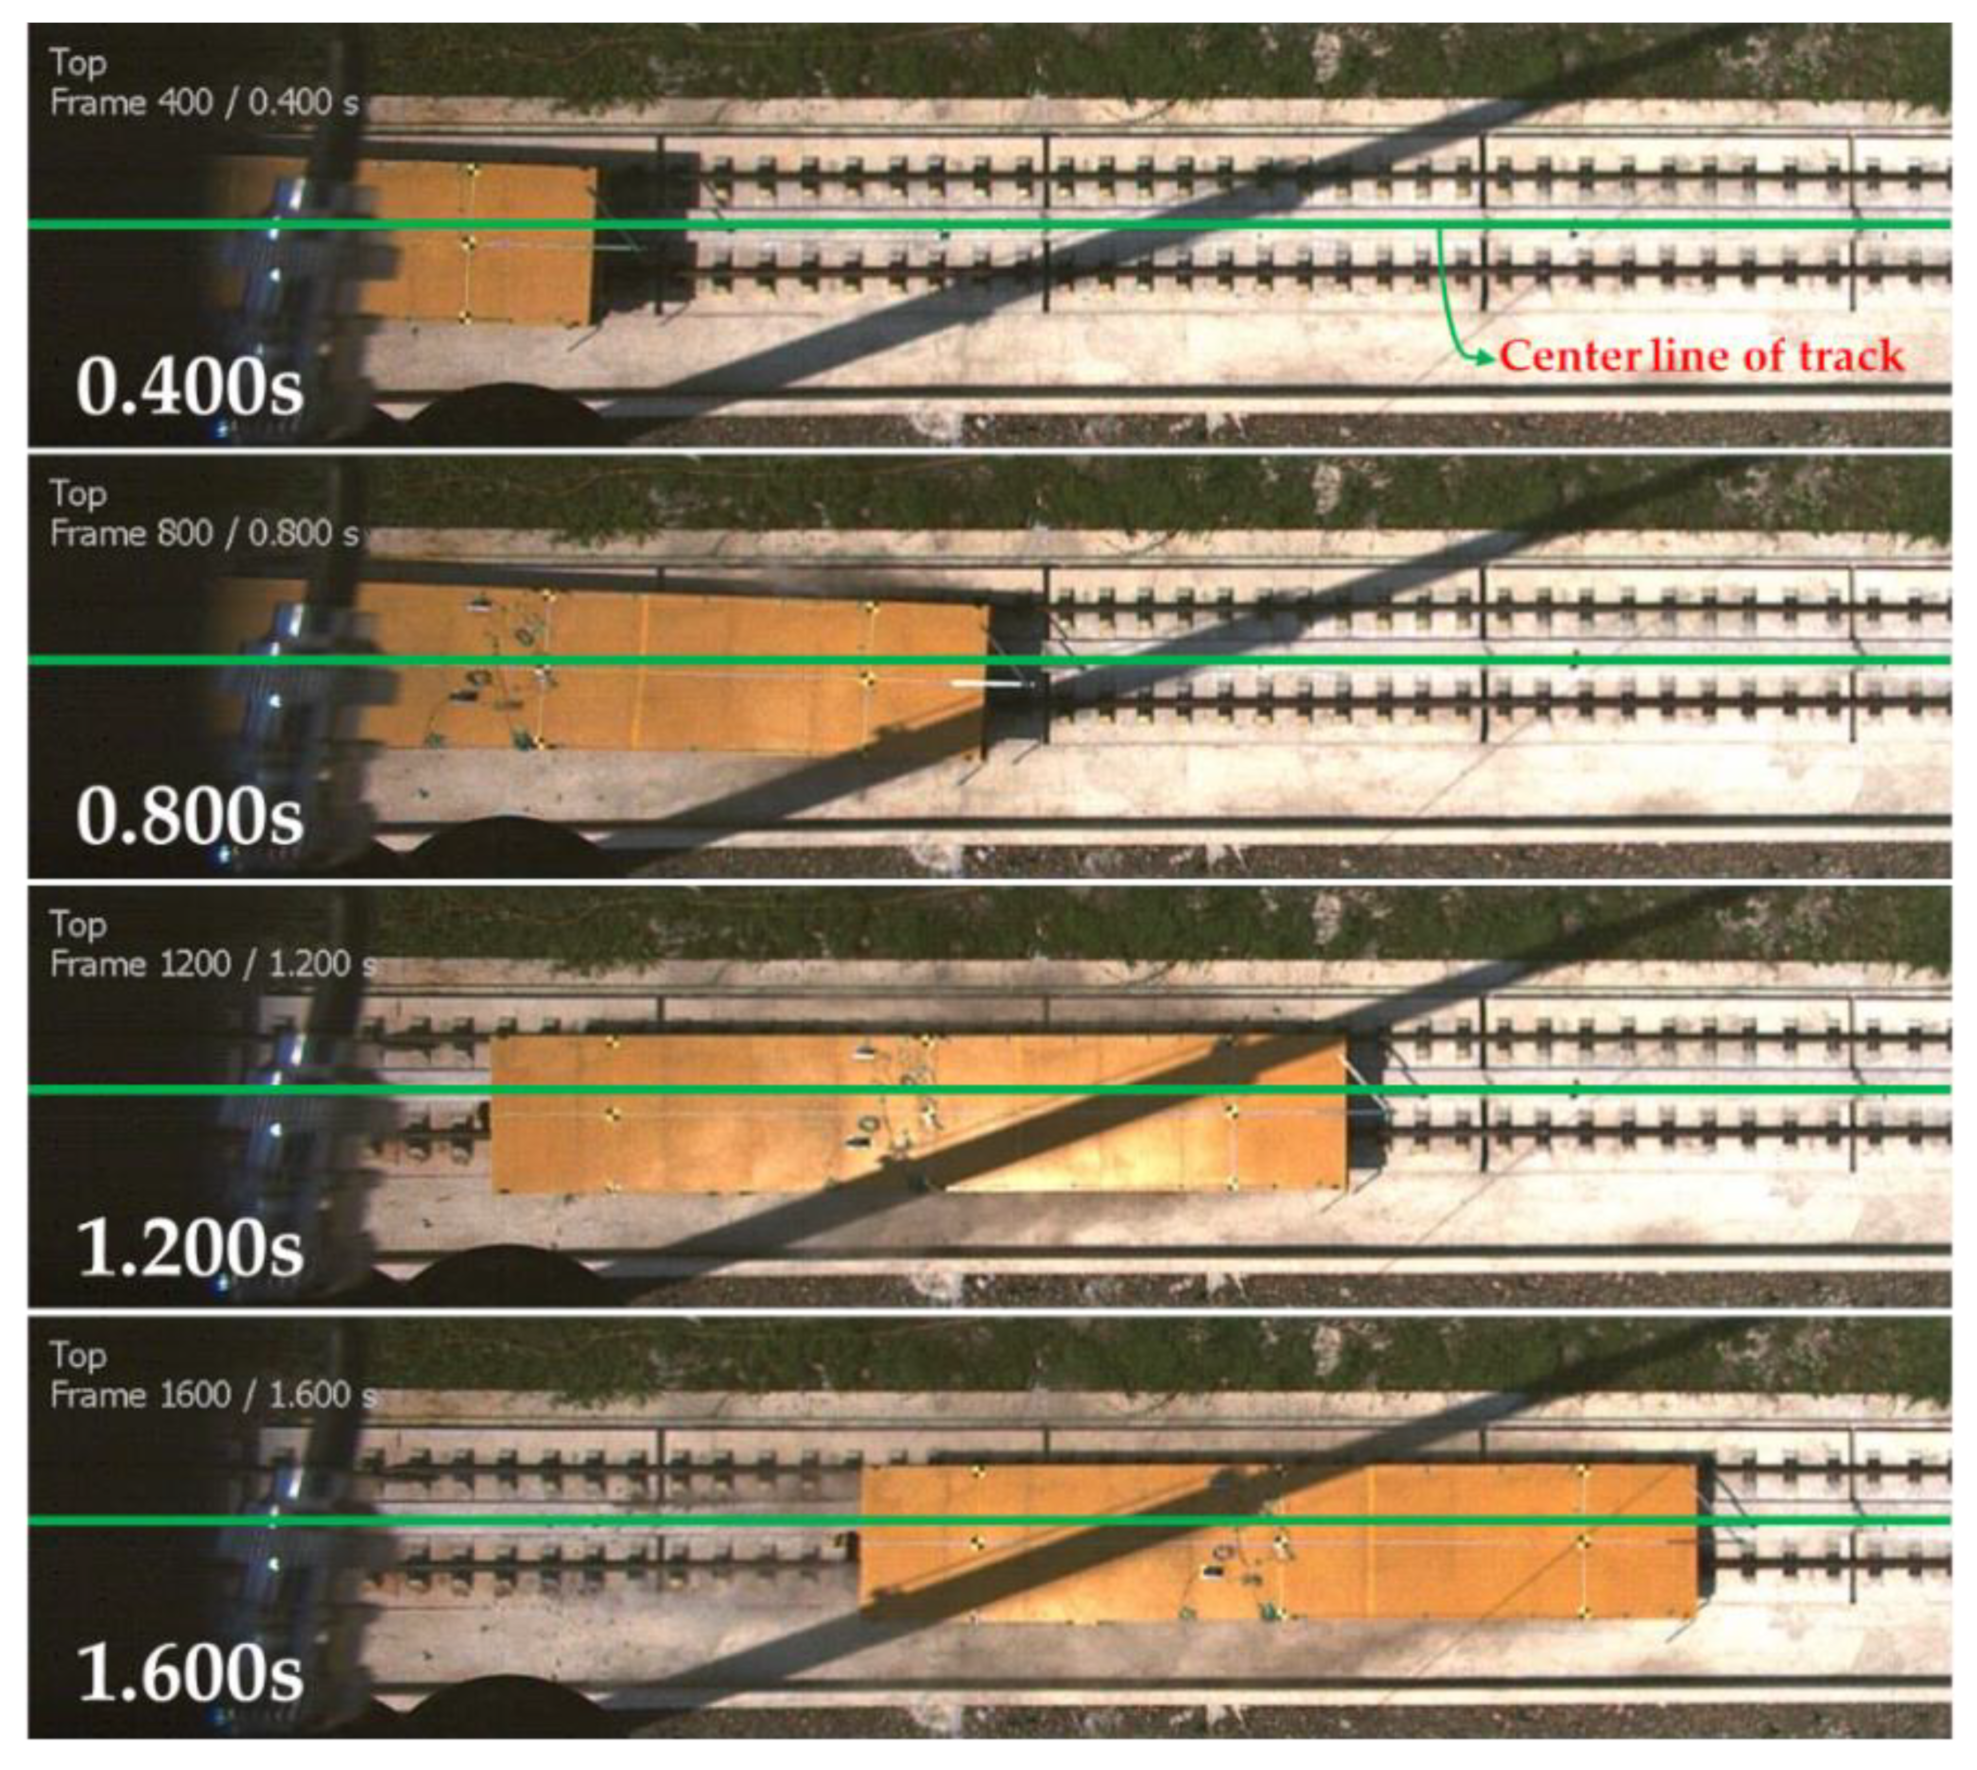
3.2. Change in Center of Gravity

In order to evaluate the effectiveness of the DCP function according to the increase in the vehicle’s center of gravity, the additional experiment was conducted with a container wagon. The container wagon weighed 42 kN more than the flat wagon and had a center of gravity 407 mm higher than the flat wagon.
The speed of the container wagon measured just before the derailment was 46.69 km/h. As shown in Figure 15, the wheels were effectively guided by the DCP within the track gauge after derailment and were running within the track area. Figure 16 shows the damage condition of DCP at the point of derailment, and although some components at the edges of the DCP side were damaged, we conclude that the DCP effectively performed lateral deviation guiding of the derailed wheels without significant issues. In rare cases, however, if the subsequent train causes continuous repeated collisions at the same damage location, the degree of breakage may be greater, which may lead to a reduction in the DCP containment performance. In order to cover the concerns related to these rare events, additional protection facilities such as DCP type II or III are required. In addition, after a derailment accident occurs, it is recommended to evaluate the condition of the damaged DCP panel and replace some damaged DCP panels according to the result.
In order to evaluate the effectiveness of the DCP function according to the increase in the center of gravity, the behavioral characteristics of the flat wagon and the container wagon after derailment were compared. For comparison, the dynamic behavior of the test car considered rolling, pitching, and yawing as shown in Figure 17.
Figure 18 shows the angle change of the flat and container wagon after derailment. The vehicle angle can be obtained by integrating the angular velocity data measured during the experiment. Figure 18a shows the rolling angle of a flat wagon and a container wagon. Through the analysis of the rolling behavior, it was possible to determine whether the wagon’s overturning phenomenon occurred due to a collision with the DCP. The rolling behavior of the container wagon was larger than that of the flat wagon as it swung in the left and right directions of the running direction, but it can be seen that it gradually stabilized without the overturning phenomenon.
The pitching angle of a flat and container wagon is shown in Figure 18b. The derailed flat wagon oscillated up and down as it continuously collided with track structures such as sleepers. However, the container wagon, which was heavier than the flat wagon, showed a stabilized pitching behavior even after derailment.
The yawing angle is shown in Figure 18c. The overall length of the container and flat wagon was the same, so when the front bogie collided with the DCP, the yaw angle was equal to about 2.8 degrees. After the derailment of the rear bogie, the yaw angle of the flat and container wagon converged to almost 0 degrees. The slight difference in angle is believed to have been due to the speed and weight difference.

4. Conclusions

In this paper, we analyzed the functionality of DCPs installed within a track gauge through the full-scale derailment testing of freight wagon. The main conclusions drawn from this study are as follows:
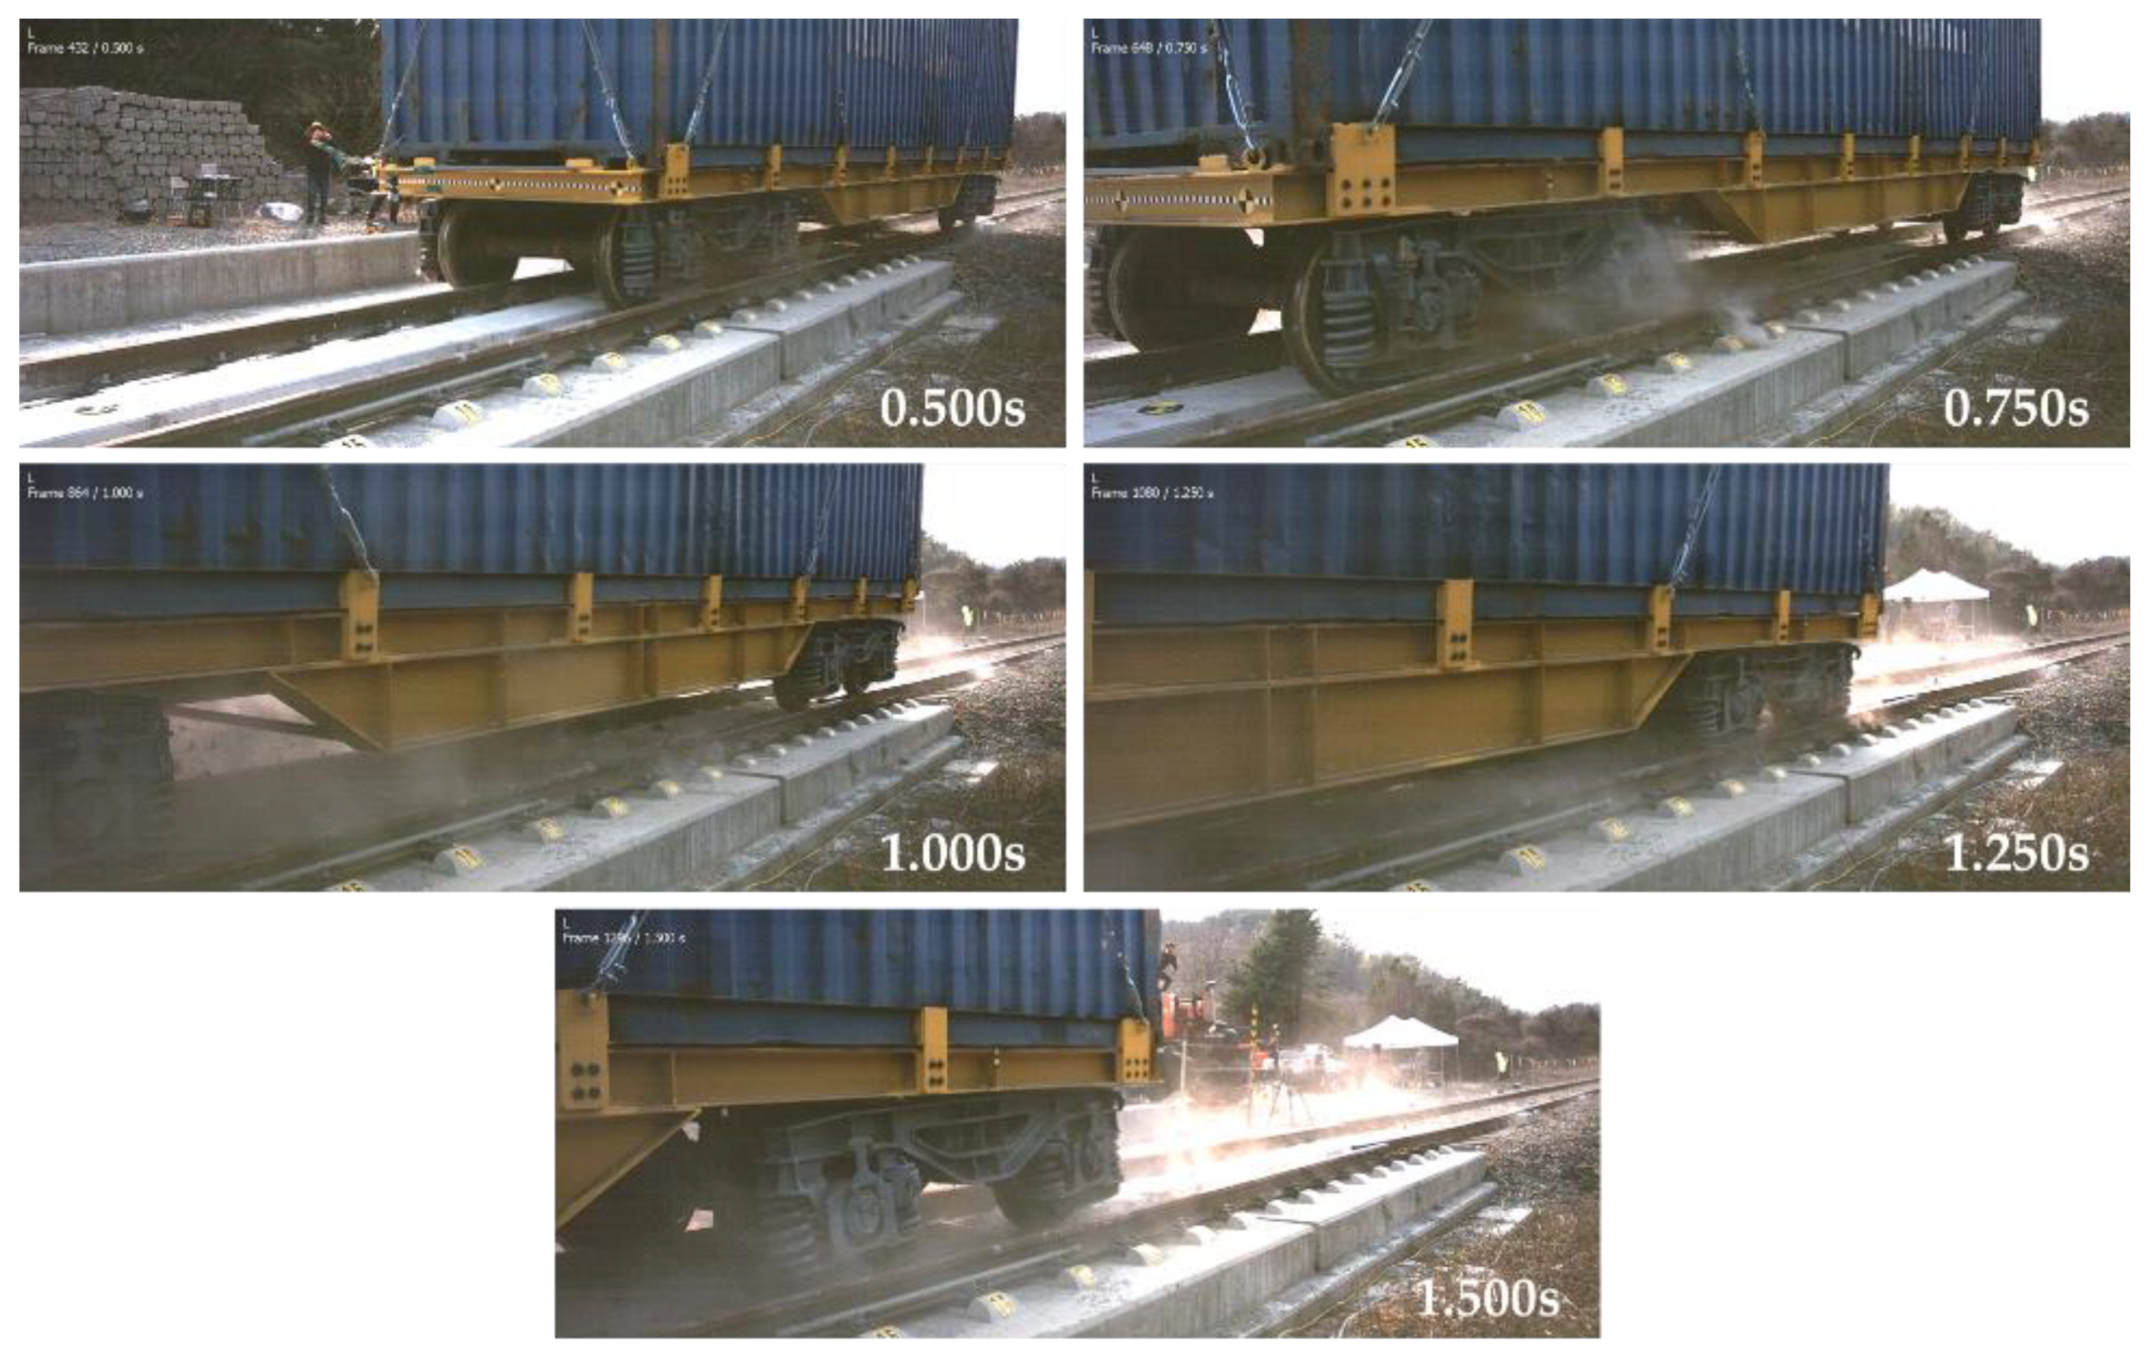
  • The derailment/collision tests showed that both the flat and container wagon continued to run along the track after derailing. That is, even if the sprung mass increases and the center of gravity position rises, the DCP type I can effectively restrain the derailed vehicle into the intended area;
  • In the case of a long vehicle such as a trailer (railway car), the collision load when the first bogie collided with the DCP was calculated from Newton’s second law applying 50% of the total car mass and lateral car acceleration data;
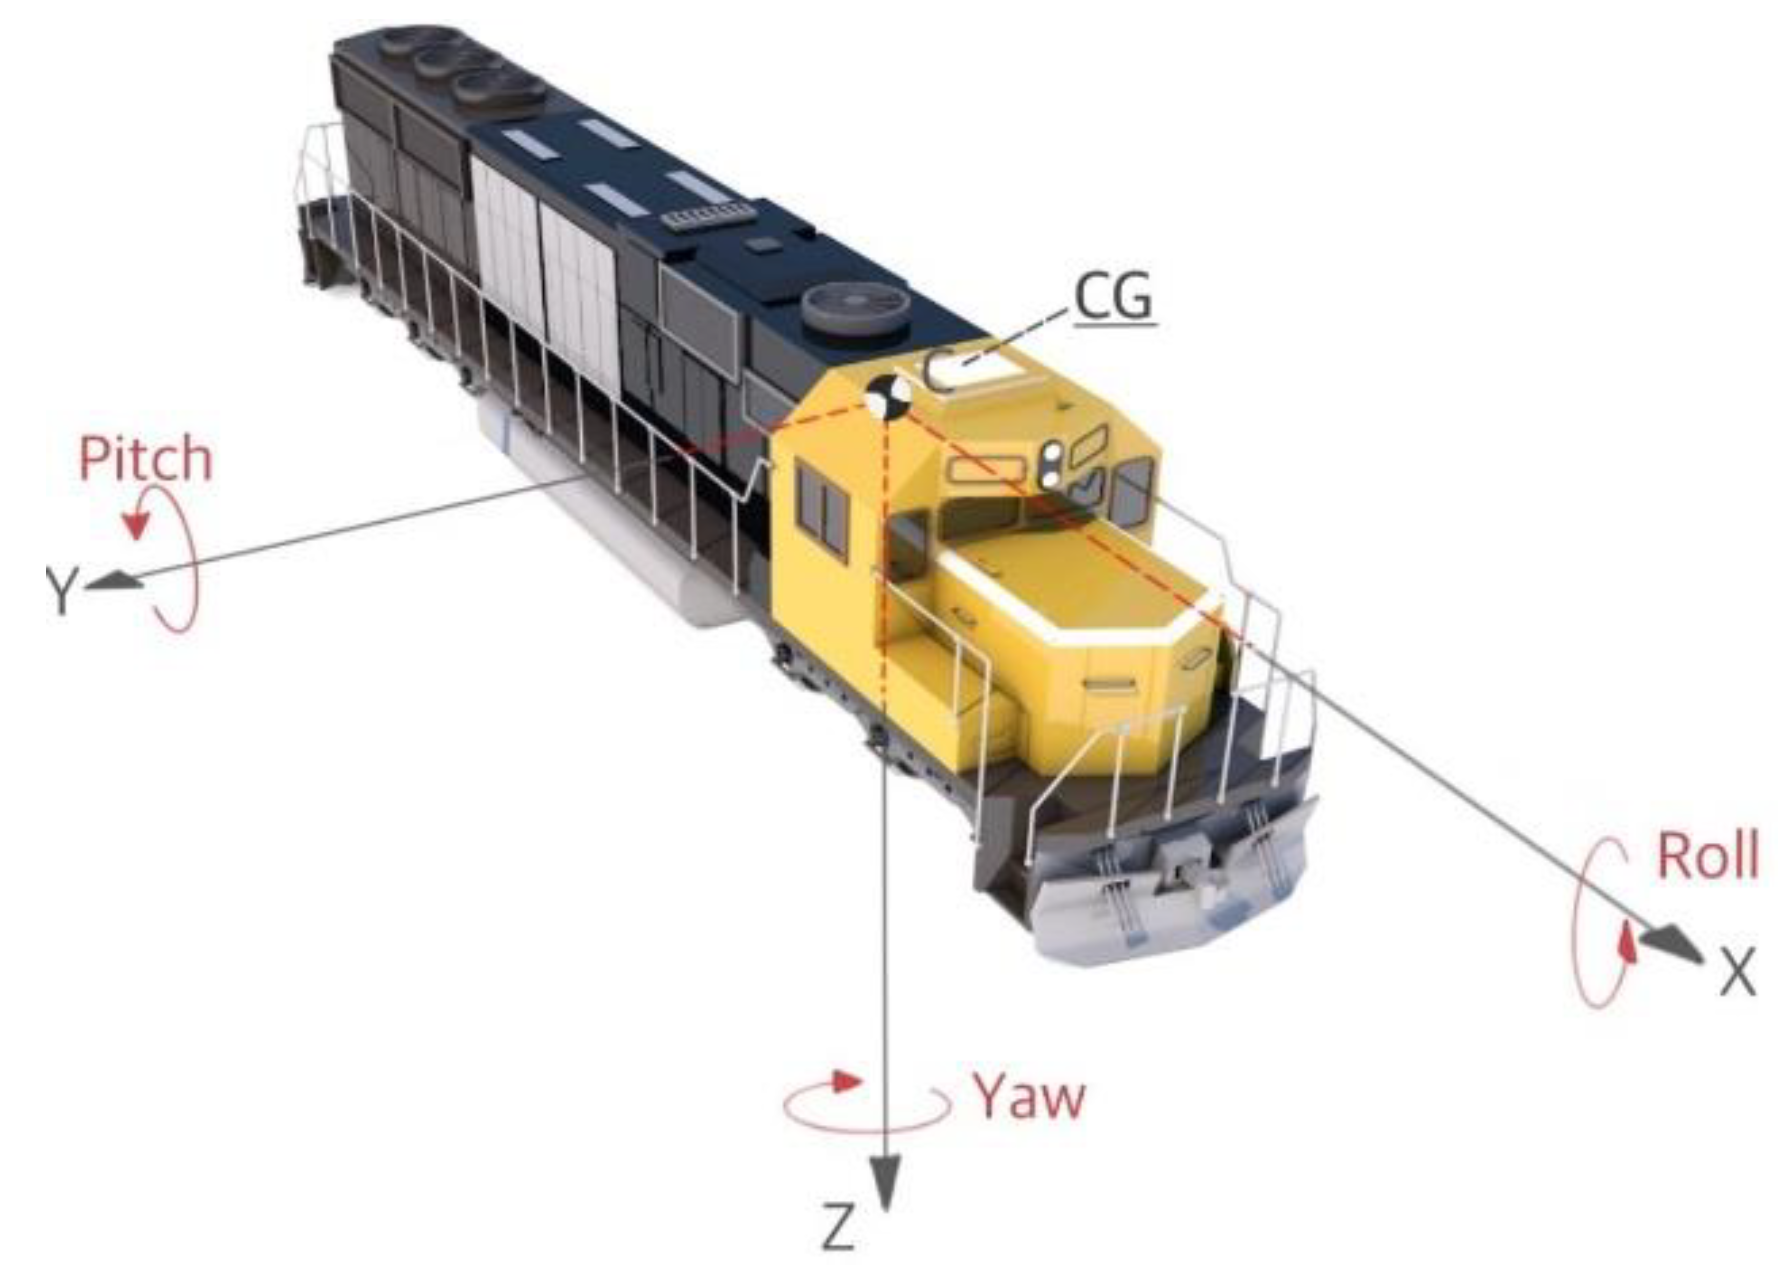
  • The dynamic motion of the derailed vehicle was analyzed by integrating the angular velocity data obtained from the gyro sensors on the mass center of the vehicle. As the sprung mass increased (such as the difference between container wagon and flat wagon), the vehicle body behavior (roll, pitch, and yaw) after derailment was different. This was due to the change in mass and center of gravity;
  • Through the analysis of rolling behavior, it was possible to check whether the overturning phenomenon of the test car was caused by collision with DCP. Similar to a container wagon, if the total mass increases and the position of the center of gravity rises, the risk of overturning due to collision with the DCP type I may be increased compared to a flat wagon. The rolling behavior of a container wagon generated a larger rolling angle value and a larger wavelength than that of a flat wagon, but stabilized over time after collision with DCP. As a result of comparative analysis of the rolling behavior, it was judged that the DCP’s function to restrain the derailed train even if the center of gravity position rises was sufficiently exhibited without any risk of overturning (rollover accident);
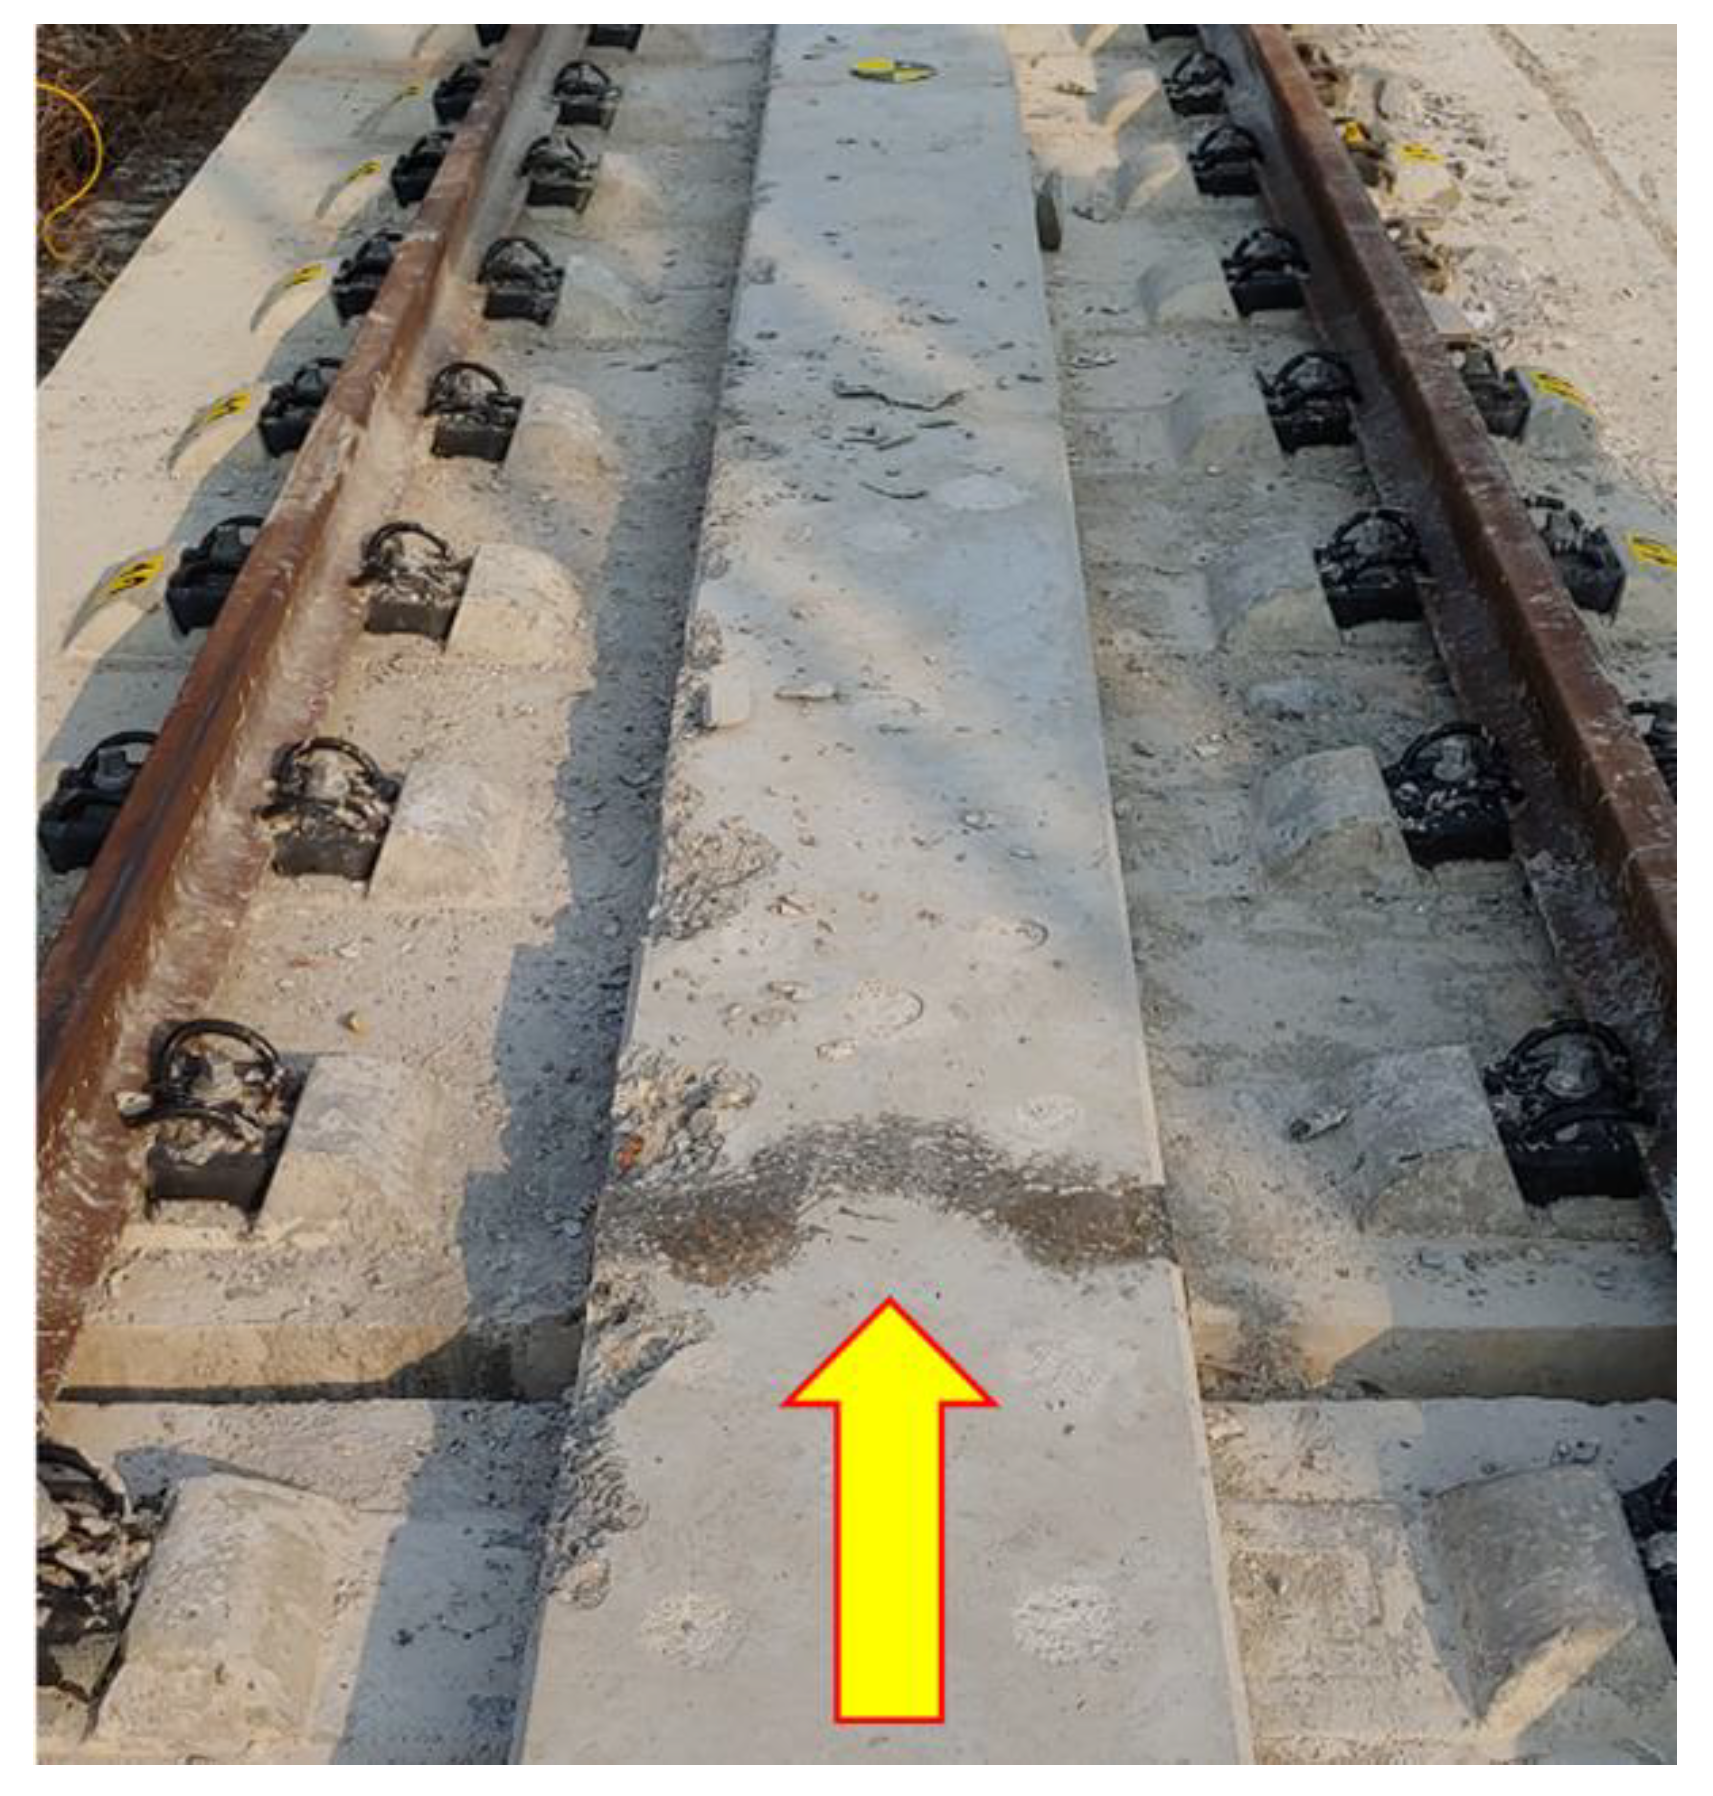
  • The stabilization state of the test car’s vertical behavior was confirmed through the pitching behavior analysis. The overall pitching angle trend between the two wagons was similar, but it can be seen that the relatively light flat wagon’s behavior in the vertical direction was unstable due to collisions with track components such as the fastener, sleeper hump, etc.;
  • Through yawing behavior analysis, it was possible to check the test car’s derailment angle and to determine whether the driving direction of the derailed vehicle deviated from the intended area. Since the two wagons had the same length and width, the maximum yaw angle (derailment angle) was evaluated to be almost identical. Then the yawing angles of both wagons quickly approached zero. That is, it can be seen that the derailed vehicle gradually moved along the track due to the restraint effect of the DCP type I.
Our research team plans to verify the previously developed simplified FE model based on the experimental results of this and companion papers, and we intend to develop the design specification for DCPs.

Author Contributions

Conceptualization, N.-H.L.; Data curation, H.-U.B. and K.-J.K.; Funding acquisition, N.-H.L.; Investigation, H.-U.B., K.-J.K., S.-Y.P., J.-J.H. and J.-C.P.; Project administration, N.-H.L.; Supervision, N.-H.L.; Validation, N.-H.L.; Writing—original draft, H.-U.B. and N.-H.L.; Writing—review & editing, N.-H.L. All authors have read and agreed to the published version of the manuscript.

Funding

This research was supported by a grant (RS-2021-KA163289) funded by the Ministry of Land, Infrastructure, and Transport of the Korean government.

Institutional Review Board Statement

Not applicable.

Informed Consent Statement

Not applicable.

Data Availability Statement

Not applicable.

Conflicts of Interest

The authors declare no conflict of interest.

References

  1. Bae, H.U.; Yun, K.M.; Lim, N.H. Containment capacity and crashworthiness estimation of derailment containment wall on high-speed train. Proc. Inst. Mech. Eng. Part F J. Rail Rapid Transit 2018, 232, 680–696. [Google Scholar] [CrossRef]
  2. Bae, H.U.; Yun, K.M.; Moon, J.; Lim, N.H. Impact force evaluation of the derailment containment wall for high-speed train through a collision simulation. Adv. Civ. Eng. 2018, 2018, 2626905. [Google Scholar] [CrossRef] [Green Version]
  3. Booz Allen Hamilton. Report on the Findings of: Current Practice and Effectiveness of Derailment Containment Provisions on High Speed Lines; HSL-Zuid Organisation: Zoetermeer, The Netherlands, 2004. [Google Scholar]
  4. Korea Rail Network Authority. Railway Design Guideline and Handbook—Subsidiary and Safety Facilities for Main Lined; KR C-02060; Korea Rail Network Authority: Daejeon, Korea, 2017. [Google Scholar]
  5. Nadal, M.J. Theorie de la stabilite des locomotives—Part II. Movement de Lacet. Ann. Mines 1896, 10, 232–255. [Google Scholar]
  6. Wu, X.; Chi, M.; Gao, H. The study of post-derailment dynamic behavior of railway vehicle based on running tests. Eng. Fail. Anal. 2014, 44, 382–399. [Google Scholar] [CrossRef]
  7. Brabie, D.; Andersson, E. Dynamic simulation of derailments and its consequences. Veh. Syst. Dyn. 2006, 44, 652–662. [Google Scholar] [CrossRef]
  8. Brabie, D. Wheel-sleeper impact model in rail vehicles analysis. J. Syst. Des. Dyn. 2007, 1, 468–480. [Google Scholar] [CrossRef]
  9. Brabie, D.; Andersson, E. Post-derailment dynamic simulation of rail vehicles—Methodology and applications. Veh. Syst. Dyn. 2008, 46, 289–300. [Google Scholar] [CrossRef]
  10. Brabie, D.; Andersson, E. High-speed train derailments—Minimizing consequences through Innovative design. In Proceedings of the 8th World Congress of Railway Research (WCRR 2008), Seoul, Korea, 19–21 May 2008; Union Internationale Des Chemins De Fer (UIC): Paris, France, 2008. [Google Scholar]
  11. Wu, X.; Chi, M.; Gao, H. Post-derailment dynamic behavior of a high-speed train under earthquake excitations. Eng. Fail. Anal. 2016, 64, 97–110. [Google Scholar] [CrossRef]
  12. Wu, X.; Chi, M.; Gao, H.; Ke, X.; Zeng, J.; Wu, P.; Zhu, M. Post-derailment dynamic behavior of railway vehicles travelling on a railway bridge during earthquake. Proc. Inst. Mech. Eng. Part F J. Rail Rapid Transit 2016, 230, 418–439. [Google Scholar] [CrossRef]
  13. Ling, L.; Dhanasekar, M.; Wang, K.; Zhaia, W.; Weston, B. Collision derailments on bridges containing ballastless slab tracks. Eng. Fail. Anal. 2019, 105, 869–882. [Google Scholar] [CrossRef]
  14. Guo, L.; Wang, K.; Lin, J. Study of the post-derailment safety measures on low-speed derailment tests. Veh. Syst. Dyn. 2016, 54, 943–962. [Google Scholar] [CrossRef]
  15. Diana, G.; Sabbioni, E.; Somaschini, C.; Tarsitano, D.; Cavicchi, P.; Di Mario, M.; Labbadia, L. Full-scale derailment tests on freight wagons. Veh. Syst. Dyn. 2022, 60, 1849–1866. [Google Scholar] [CrossRef]
  16. Kajitani, Y.; Kato, H.; Asano, K. Development of an L-shaped guide to prevent deviation from rails. JR-EAST Tech. Rev. 2010, 15, 53–56. [Google Scholar]
  17. Sunami, H.; Morimura, T.; Ishikawa, S.; Adachi, M.; Sakanoue, K.; Minami, Y.; Watanabe, Y.; Soda, Y. Experiment on test track for preventing the derailed vehicle from veering off the track. Trans. Jpn. Soc. Mech. Eng. 2010, 76, 2462–2463. [Google Scholar] [CrossRef] [Green Version]
  18. Sunami, H.; Morimura, T.; Terumichi, Y.; Adachi, M. Model for analysis of bogie frame motion under derailment conditions based on full-scale running tests. Multibody Syst. Dyn. 2012, 27, 321–349. [Google Scholar] [CrossRef]
  19. Wu, X.; Chi, M.; Gao, H.; Zhang, D.; Zeng, J.; Wu, P.; Zhu, M. The study of post-derailment measures to limit the extent of a derailment. Proc. Inst. Mech. Eng. Part F J. Rail Rapid Transit 2016, 230, 64–76. [Google Scholar] [CrossRef]
  20. Bae, H.U.; Moon, J.; Lim, S.J.; Park, J.C.; Lim, N.H. Full-Scale Train Derailment Testing and Analysis of Post-Derailment Behavior of Casting Bogie. Appl. Sci. 2020, 10, 59. [Google Scholar] [CrossRef] [Green Version]
  21. Song, I.H.; Kim, J.W.; Koo, J.S.; Lim, N.H. Modeling and Simulation of Collision-Causing Derailment to Design the Derailment Containment Provision Using a Simplified Vehicle Model. Appl. Sci. 2020, 10, 118. [Google Scholar] [CrossRef]
  22. Beason, W.L.; Hirsch, T.J.; Campise, W.L. Measurement of Heavy Vehicle Impact Forces and Inertia Properties; Final Report, FHWA/RD-89/120; Texas Transportation Institute: College Station, TX, USA, 1989. [Google Scholar]
Figure 1. Types of DCPs and their characteristics.
Applsci 12 11297 g001
Figure 2. DCPs for high-speed railway bridges in South Korea.
Applsci 12 11297 g002
Figure 3. Real-scale test site.
Applsci 12 11297 g003
Figure 4. Railway track and DCPs in the test region: (a) Rheda 2000 concrete track and (b) concrete track with DCP type I.
Applsci 12 11297 g004
Figure 5. Test freight car units: (a) flat wagon and (b) container wagon.
Applsci 12 11297 g005
Figure 6. Concept of the push system.
Applsci 12 11297 g006
Figure 7. Derailer system.
Applsci 12 11297 g007
Figure 8. Data acquisition system for the test car: (a) accelerometers and gyro sensors for the 6-DOF and (b) shock-resistant datalogger.
Applsci 12 11297 g008
Figure 9. High-speed cameras.
Applsci 12 11297 g009
Figure 10. Post-derailment behavior of the flat wagon (1st wheels of front bogie).
Applsci 12 11297 g010
Figure 11. Post-derailment behavior of the flat wagon (top view).
Applsci 12 11297 g011
Figure 12. Lateral acceleration of the flat wagon: (a) raw and filtering data and (b) the point at which the wheels collided with the DCP.
Applsci 12 11297 g012
Figure 13. Lateral contact force for each wheel by simulation: (a) 1st wheel, (b) 2nd wheel, (c) 3rd wheel, (d) 4th wheel, and (e) all wheels.
Applsci 12 11297 g013aApplsci 12 11297 g013b
Figure 14. Collision load of the wheels of the flat wagon.
Applsci 12 11297 g014
Figure 15. Post-derailment behavior of the container wagon (side view).
Applsci 12 11297 g015
Figure 16. Damage status of DCP after collision.
Applsci 12 11297 g016
Figure 17. Dynamic behavior of the vehicle.
Applsci 12 11297 g017
Figure 18. Comparison of vehicle angles after derailment: (a) rolling behavior, (b) pitching behavior, and (c) yawing behavior.
Applsci 12 11297 g018
Table 1. The dimension information of the concrete track and DCP.
Track Concrete LayerDCP Panel
Segment length6000 mm2280 mm
Width2800 mm500 mm
Height310 mm140 mm
Installation length≈100 m (17 EA)≈50 m (22 EA)
Table 2. The specification of the flat and container wagons.
Flat WagonContainer Wagon
Mass
Weight
13,030 kg
127.82 kN
17,320 kg
169.91 kN
Length12,590 mm12,590 mm
Width2330 mm2330 mm
Height906 mm3542 mm
Center of gravity (vertical)598 mm1005 mm
Table 3. Collision load of the 2nd wheel of the front bogie.
Total
Mass
Lateral
Acceleration
Collision Load
Using 100% Mass
Collision Load
Using 50% Mass
Contact Force
by Simulation
13,030 kg1.242 g158.79 kN79.40 kN80.57 kN
Publisher’s Note: MDPI stays neutral with regard to jurisdictional claims in published maps and institutional affiliations.

