Article

Clustering Method of Large-Scale Battlefield Airspace Based on Multi A * in Airspace Grid System

1
Air Traffic Control and Navigation College, Air Force Engineering University, Xi’an 710051, China
2
State Key Laboratory of Air Traffic Management System and Technology, Nanjing 210007, China
3
Unit 95910 of the People’s Liberation Army, Jiuquan 735018, China
*
Author to whom correspondence should be addressed.
Appl. Sci. 2022, 12(22), 11396; https://doi.org/10.3390/app122211396
Submission received: 21 October 2022 / Revised: 4 November 2022 / Accepted: 7 November 2022 / Published: 10 November 2022

Abstract

:
Aiming at the problem of the wide range and great difficulty in the future of battlefield airspace control, based on the unique advantages of an airspace grid system in an airspace grid representation and time–space binary computing, this paper designs a pre-clustering method for mission airspace based on airspace location correlation under the condition of future large-scale air combat missions in order to realize the block control of battlefield airspace. This method reduces the whole 3D battlefield space projection to a 2D plane and regards the task airspace projection as “obstacles” in the task area; Multi-A * algorithm is used to generate the airspace clustering line surrounding the task airspace, and the airspace association clustering problem is transformed into a multiple “start point-end point” path planning problem with autonomous optimization. Through the experiment, it was found that clustering the airspace can effectively improve the management and control efficiency of large-scale battlefield airspace.

1. Introduction

The English prototype of the word “Airspace”, which is defined in the Oxford Dictionary as “the part of the sky where planes fly, usually the part above partial country that is legally controlled by that country”. Here, airspace is literally translated into the air space of aircraft flight, which also makes the academic world view that airspace as equivalent to the air space above the land [1,2]. The International Civil Aviation Organization (ICAO) also divides airspace into seven categories according to different airworthiness rules and flight conditions of aircraft, namely, A, B, C, D, E, F, and G [3]. However, as an important public natural resource and carrier of air transportation, airspace resources not only have certain economic value and public service functions [4], but also are core strategic resources [5,6,7] It is an important carrier to realize various complex combat tasks [8,9,10,11], and it is also the support and guarantee of various combat operations [12]. Only with efficient and smooth battlefield airspace control capability can we truly master the lifeline to win the battlefield. The airspace mentioned in this paper mainly refers to the middle- and high-altitude airspace above the battlefield. In this narrow airspace, there are often dense airspace users ranging from various artillery shells, rockets, and missiles to unmanned aerial vehicles, helicopters, fighter jets, bombers, and other airspace users. These factors are converging, leading to an increasingly complex battlefield airspace environment, and the probability of accidental injury and collision between airspace users is greatly increased; it seriously restricts the improvement of airspace control efficiency and combat effectiveness.
In order to simplify the control area and reduce the difficulty of control, inspired by the concept of an “airspace control sector” [13,14,15,16] in civil aviation, this paper takes advantage of the unique advantages of the airspace grid system [17,18,19,20] in an airspace grid representation and time–space binary computing to divide the vast battlefield airspace into multiple mission airspace clusters based on appropriate segmentation criteria. The goal is to reduce the burden of airspace control through airspace clustering control and improve the accuracy and efficiency of battlefield airspace control. Through experimental comparison, it is verified that the A * algorithm [21,22,23,24] is more efficient and faster than other traditional path planning algorithms in generating clustering edge lines, and it has a high degree of integration and better fit with the grid system. At the same time, the key link of airspace conflict detection [25] in airspace management and control is selected as the experimental object, and the speed and accuracy of airspace conflict detection before and after clustering are compared according to the experimental simulation to evaluate the role of airspace clustering in improving the overall effectiveness of airspace management and control. The experiment shows that after clustering the whole airspace, the detection efficiency can be improved by at least 1.6% and at most 30.25% on the premise of ensuring the detection accuracy.
The following contents are organized as follows: Section 2 analyzes the key issues of airspace association clustering, as well as the possibility and feasibility of organic integration of current battlefield airspace clustering and path planning intelligent algorithm, and combs out the basic process of airspace cluster division based on Multi A * under grid system; In Section 3, the theoretical and technical foundations of airspace reference grid generation system and airspace sector division are introduced; Section 4 introduces the method in detail, and gives an example calculation for each step. In Section 5, the experimental simulation is carried out under the background of the assumed task and preliminary conclusions are obtained. Section 6 sorts out the conclusions of this method, summarizes the deficiencies and looks forward to the future development direction.
The main contributions of this paper are as follows. First, the method of grid voxelization to represent airspace domain is introduced. Second, the specific steps of an airspace correlation clustering method are described under the airspace grid system; the third is to compare and evaluate the effects of different intelligent planning algorithms on the airspace association clustering.

2. Analysis of Key Problems

This paper plans to break through the traditional battlefield airspace management and control mode in two aspects: the method and technology of battlefield airspace management and control. On the technical level, in recent years, grid technology [17,19,20] has become an emerging research field. On the basis of the grid division system [18,26,27], experts and scholars have designed corresponding geo-airspace data organization methods [28,29] and generated unique grid structures [30]. Because of its unique advantages in airspace grid representation and space–time binary computing [26,31], it has been widely used in the field of airspace model representation and establishment. For a long time, the civil aviation field has been faced with the problem of sharp contradiction between the demand and supply of airspace resources and great pressure on air flow control. In order to reasonably allocate and plan airspace resources and improve public traffic management capabilities, the relevant departments of air traffic control have introduced the concept of an “airspace control sector” [13,14], which has improved the safety and efficiency of airspace operations, and it has also provided a new idea for the efficient control of battlefield airspace in blocks.
As a special airspace, the battlefield airspace has the characteristics of narrower airspace scope and more concentrated activity space compared with the ordinary airspace, In the process of battlefield airspace management and control, airspace management and control personnel will not only participate in the whole process, but also spread evenly in every corner of the battlefield, without complex factors such as traffic flow relationship and controller load. Therefore, the geometric division method [32,33,34,35] may be more suitable for battlefield airspace segmentation. If the battlefield airspace is projected to the geodetic two-dimensional plane, the problem of airspace segmentation will be transformed into a problem of two-dimensional image segmentation. The so-called image segmentation refers to dividing the image into several disjoint regions according to the characteristics of gray, color, airspace texture, geometric shape, etc., so that these features show consistency or similarity in the same region, and show obvious differences between different regions, at present, there are many mature image segmentation algorithms, such as threshold based segmentation methods [36,37,38,39], edge detection based segmentation methods [40,41], and image segmentation methods based on wavelet analysis and wavelet transform [42]. However, these methods can only separate the task airspace from the “background” environment, but they cannot divide one or more eligible airspace into an airspace cluster according to different task instructions. Due to the poor adaptability between traditional image direct segmentation methods and battlefield airspace clustering targets, this paper considers adopting an indirect airspace clustering method of “point-line-cluster”; that is, first find the points on the edge line of the airspace cluster, and then connect the points to form the edge line of the airspace cluster. Finally, these edge lines of the airspace cluster interweave with each other, and the entire battlefield airspace is divided into multiple clusters. Following this idea, the task airspace is regarded as an obstacle in this paper, and the airspace clustering problem is successfully transformed into a path planning problem in the free airspace under the known obstacle environment (task airspace) in the airspace grid system. At present, there are also many intelligent path planning algorithms, such as A * algorithm [22,23], D * algorithm [43], fast expanding random tree algorithm [44], and random road map algorithm. These algorithms have their own advantages and disadvantages. A * and D * algorithms have high adaptability to the grid system. A * algorithm is suitable for static environments and has high planning efficiency; D * algorithm is applicable to path planning in dynamic environment with high accuracy of planning results. Considering that different path planning algorithms may affect the airspace clustering results, this paper first plans the airspace clustering process based on multiple A * algorithms, and compares multiple path planning algorithms in the experimental part to evaluate the speed and effect of different algorithms. The overall process method is divided into three steps:
(1)
The core problem is abstractly likened to a path planning problem with multiple starting points/endpoints, that is, the airspace projection projected onto a two-dimensional plane is approximately regarded as a ground obstacle. Using the Multi A * algorithm, by setting a relatively reasonable starting point and endpoint for many times, multiple clustering lines without contact and conflict with the obstacle (task airspace) can be planned. These clustering lines combine to divide the entire task area into multiple airspace clusters.
(2)
On the basis of the first step, the airspace objects and path data are coded using the grid system, and the path-path intersection points (i.e., the vertices of each airspace cluster) are calculated through grid coding.
(3)
Finally, the number of the cluster where the center of the airspace is located is judged by “Angle Addition”, and the airspace clustering result is finally obtained.

3. Introduction to Theoretical Basis

In recent years, with the growing maturity of the geographical grid, more and more experts and scholars at home and abroad have integrated the airspace characteristics of the airspace with the geographical grid, designed a multi style airspace grid system and explored the airspace management based on the airspace grid system. In terms of airspace planning and representation, in 2021, Zhu Yongwen [45] summarized the airspace gridding methods of plane grid model and airspace grid model [46], and summarized the research on airspace gridding application of airspace gridding methods. On this basis, he comprehensively analyzed the research focus and development trend of airspace gridding and digitization [47]. However, none of the three papers have specifically explained the application of airspace conflict detection and resolution under the airspace grid system. Inspired by Yousefi’s use of grid system to describe two-dimensional sectors, Rafal Kicinger [48] characterized three-dimensional airspace with a stack combination of element grids of fixed size and specific height range, which broke away from the limitation of traditional airspace sector boundaries and was more simple and efficient in airspace characterization. Li Jun [49] and his team expanded the time dimension of global discrete airspace grid technology, established a global unified spatio-temporal grid model, and verified the scientificity and feasibility of establishing airspace management system based on this model. Sun Guoyi [50] and others proposed an airspace grid modeling algorithm based on the GeoSOT [51,52,53,54] global subdivision model to solve the problem that the current airspace modeling method is relatively rough and the degree of refinement of the internal modeling of the airspace is low. The four neighbor and six neighbor grid models are used to completely express the interior and boundary of the airspace. Shu Ping [55] and his team proposed a three-dimensional grid model for refined analysis of airspace resources based on the Beidou grid location code, designed the calculation method of three-dimensional airspace grid model and explored the application scenario, which made it possible for refined management of airspace. Xu Xinyu [29] proposed an airspace grid representation method based on GeoSOT grid, which provides a new technical means and practical ideas for airspace representation. Shi Hongfang [56] established a refined management system of airspace resources based on the Beidou grid location code, studied the calculation and analysis methods of the spatio-temporal grid model, and the application methods of airspace resource gridding, providing possibilities for the refined management of airspace resources and the optimal allocation of resources.
An airspace sector division refers to dividing a whole airspace into multiple airspace sectors according to the flow relationship and mission characteristics. In the area of airspace sector division, experts and scholars in the field of civil aviation have made a lot of efforts. At present, there are three common methods to divide the airspace sector. One is to use geometric division method to divide the whole area according to the distribution characteristics of air traffic flow with the main airport or main navigation facilities (such as VOR/DME) as the center, which is also called the horizontal quadrant division method. The second is to select the altitude definition value in the area according to the ascending, descending and overflying altitude, and determine the altitude range of airspace sector near the value. The last method is to comprehensively divide sectors according to the busy degree of routes, routes, use properties, and flight characteristics. The plane geometry quadrant division method is mainly based on geometric analysis tools such as Voronoi diagram [57,58], hexagon grid [59], and tyson polygon, and it is combined with some constraints [60] and algorithms [61] to divide the sector. At present, there are few researches on sector division by high separation. The literature [62] introduces the method of sector division by high separation. At present, there are many studies on the method of comprehensive sector division, mainly from the perspectives of controller workload [63,64], machine workload, aircraft trajectory clustering [65], traffic flow prediction [66], and airspace topological relationship modeling [67], and many effective airspace sector division methods have been proposed.

4. Airspace Clustering Steps Based on Multi-A * Algorithm

4.1. Construct Airspace Security Bounding Box

The method of building bounding boxes for polygons is mainly an effective method to solve the problem of polygon intersection in the horizontal dimension. A bounding box with a slightly larger area and relatively simple geometric features is used to approximately describe more complex polygons. Because the intersection test of bounding boxes is relatively simple, the time consumption is very small compared with the accurate conflict detection between polygons. The application in the field of battlefield airspace management and control mainly has two functions: first, by setting the size and width of the bounding box, the airspace can reach the specified airspace safety separation distance. Second, it is convenient to judge the conflict of task airspace and improve the efficiency of battlefield airspace management and control. For bounding boxes, the following two constraints are generally required:
(1)
Simplicity: The bounding box itself should be a simple geometric figure relative to the surrounded polygons. In addition, the intersection test of the bounding box should be relatively simple, otherwise it will affect the efficiency.
(2)
Tightness: The bounding box should be as close to the polygon as possible, and closely enclose the polygon.
Common bounding boxes mainly include spherical bounding box (SBB) [68], aligned axis bounding boxes (AABB) [69,70], and oriented bounding boxes (OBB) [71,72,73], as shown in Figure 1.
The construction method of spherical bounding box and AABB is simple, but the disadvantage is that the compactness is not strong. If there is a large amount of airspace in a region, both the bounding balls and AABB in the airspace are easy to overlap, resulting in no significant reduction in the number of airspace pairs that require refined polygon intersection testing. The OBB bounding box is more flexible in direction selection than the bounding sphere and AABB due to its compact enclosure. It is widely used by researchers and can relatively accurately eliminate the airspace pairs that do not overlap on the horizontal plane. In this paper, the airspace is abstracted as regular polygons, so the overall effect of axial bounding box and directional bounding box is similar, this article mainly introduces the construction method of the direction bounding box. The smallest rectangle containing the polygon and arbitrary relative to the coordinate axis direction. Its direction is not fixed, so we can find an optimal surrounding polygon with relatively tight direction through calculation. The direction of the OBB should be able to contain most of the polygon information. This section uses Principal Component Analysis (PCA) to construct the OBB. OBB generation steps based on principal component analysis (PCA) are as follows:
Suppose the polygon has m vertices in total, and the coordinates of the i vertex are expressed as ( x i , y i ), where 1 i m .
Step 1: Construct vertex coordinate matrix: m vertex coordinates are formed into matrix A m × 2 , and each matrix A represents the coordinates of a vertex;
Step 2: Zeroing mean value: calculate the mean value of each column vector of matrix A , and subtract the mean value of this column vector from each column vector element to obtain the zeroing mean value matrix X ;
Step 3: Find the covariance matrix C of the zeroing average matrix X , where C = 1 m X T X .
Step 4: Find the eigenvector of the covariance matrix. The directions of the two eigenvectors n 1 and n 2 are the two axes of the OBB bounding box, and the eigenvector matrix N 2 × 2 , N = n 1 , n 2 is constructed.
Step 5: Coordinate rotation transformation. The projection coordinates of polygon vertex coordinates on two axes of OBB bounding box are obtained to form matrix B , B m × 2 = A m × 2 × N 2 × 2 . The maximum and minimum values of each column of matrix B are obtained, that is, the maximum and minimum projection coordinates x max , x min , y max , y min of polygon original vertex coordinates on two axes of OBB are obtained.
Step 6: Calculate the length, width, and center coordinates of the OBB bounding box.
Assume that the length of OBB bounding box is L 1 , the width is L 2 , and the central coordinates are ( x c , y c ), then
L 1 = max ( x max x min , y max y min ) L 2 = min ( x max x min , y max y min )
[ x c , y c ] = [ x max + x min 2 , y max + y min 2 ] × N 1
Through the above steps, a special direction bounding box is built for each mission airspace, and in the later method discussion process, the bounding box and mission airspace fusion is considered as the overall object of the mission airspace.

4.2. Airspace Projection Image Preprocessing

4.2.1. Mission Airspace Projection

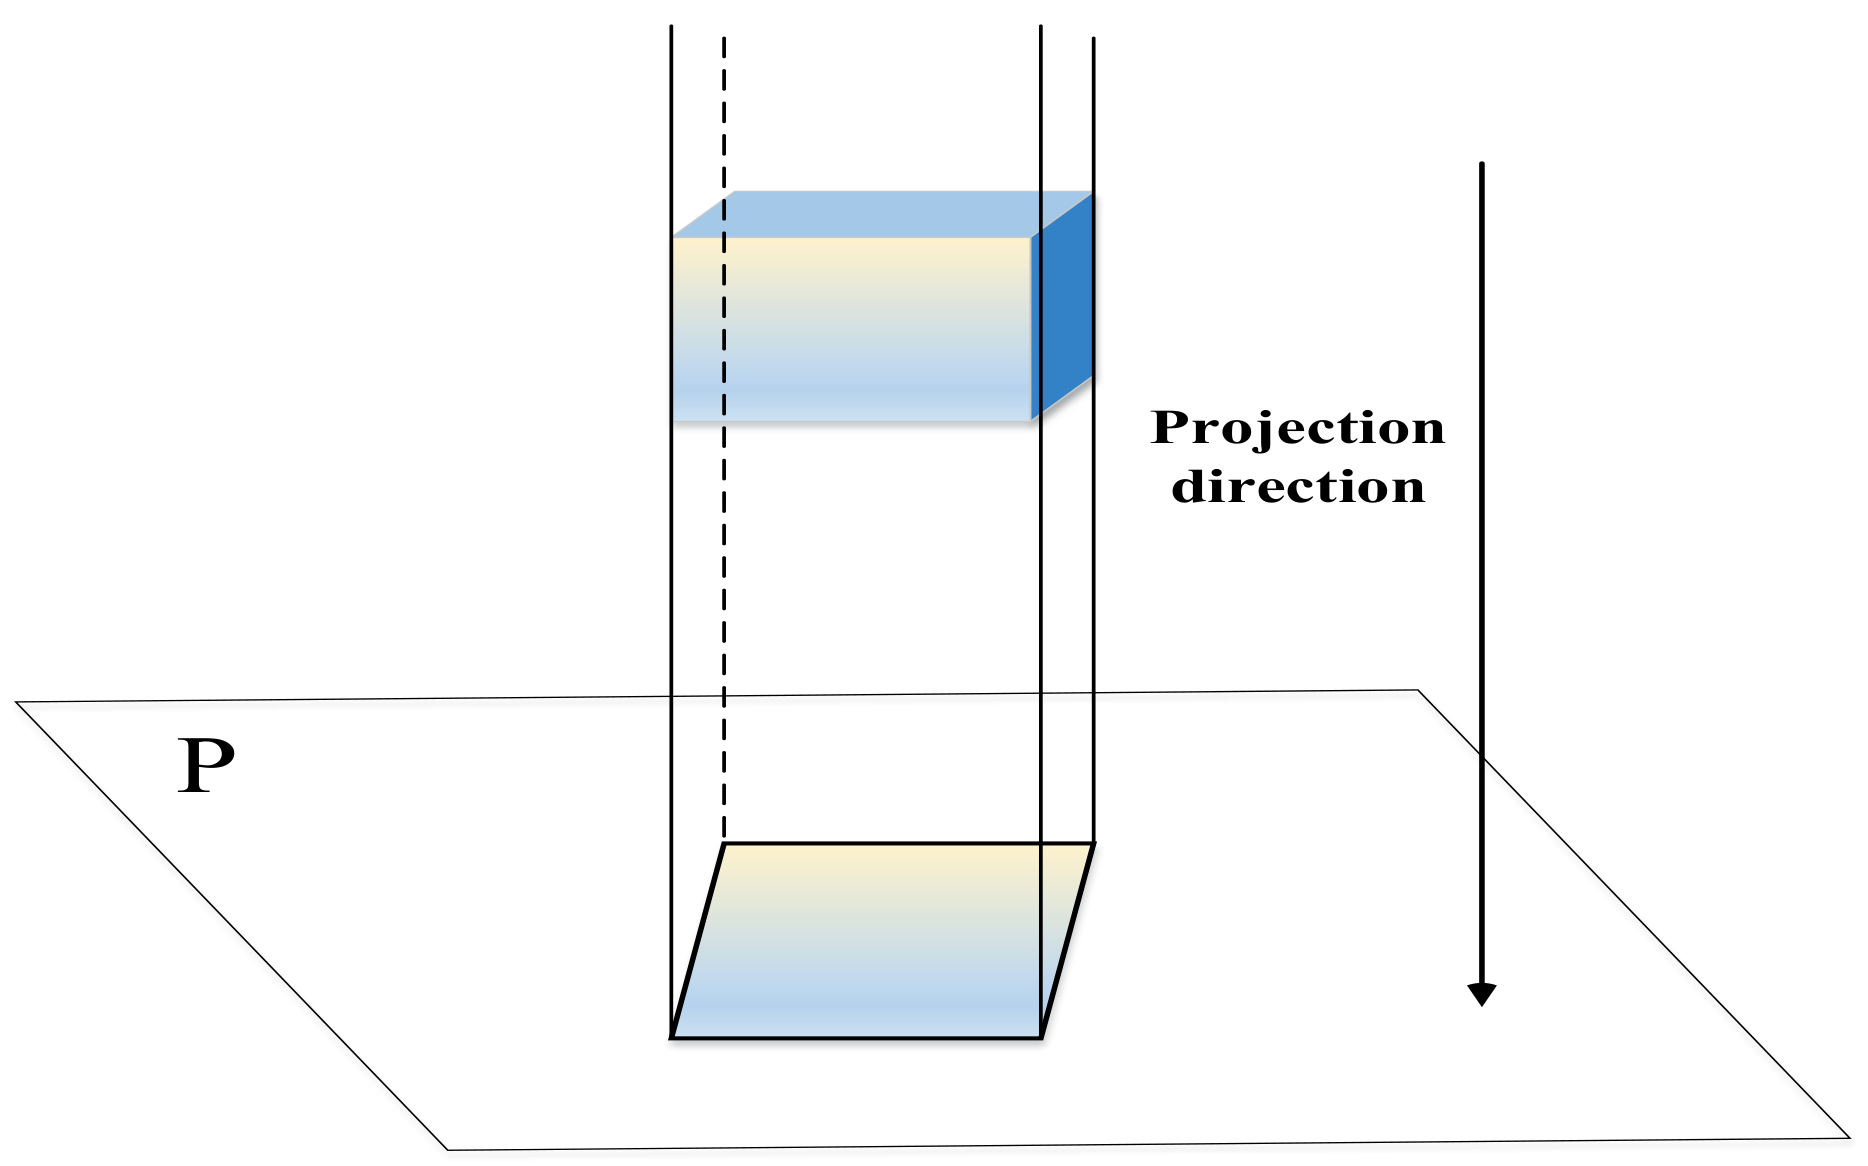
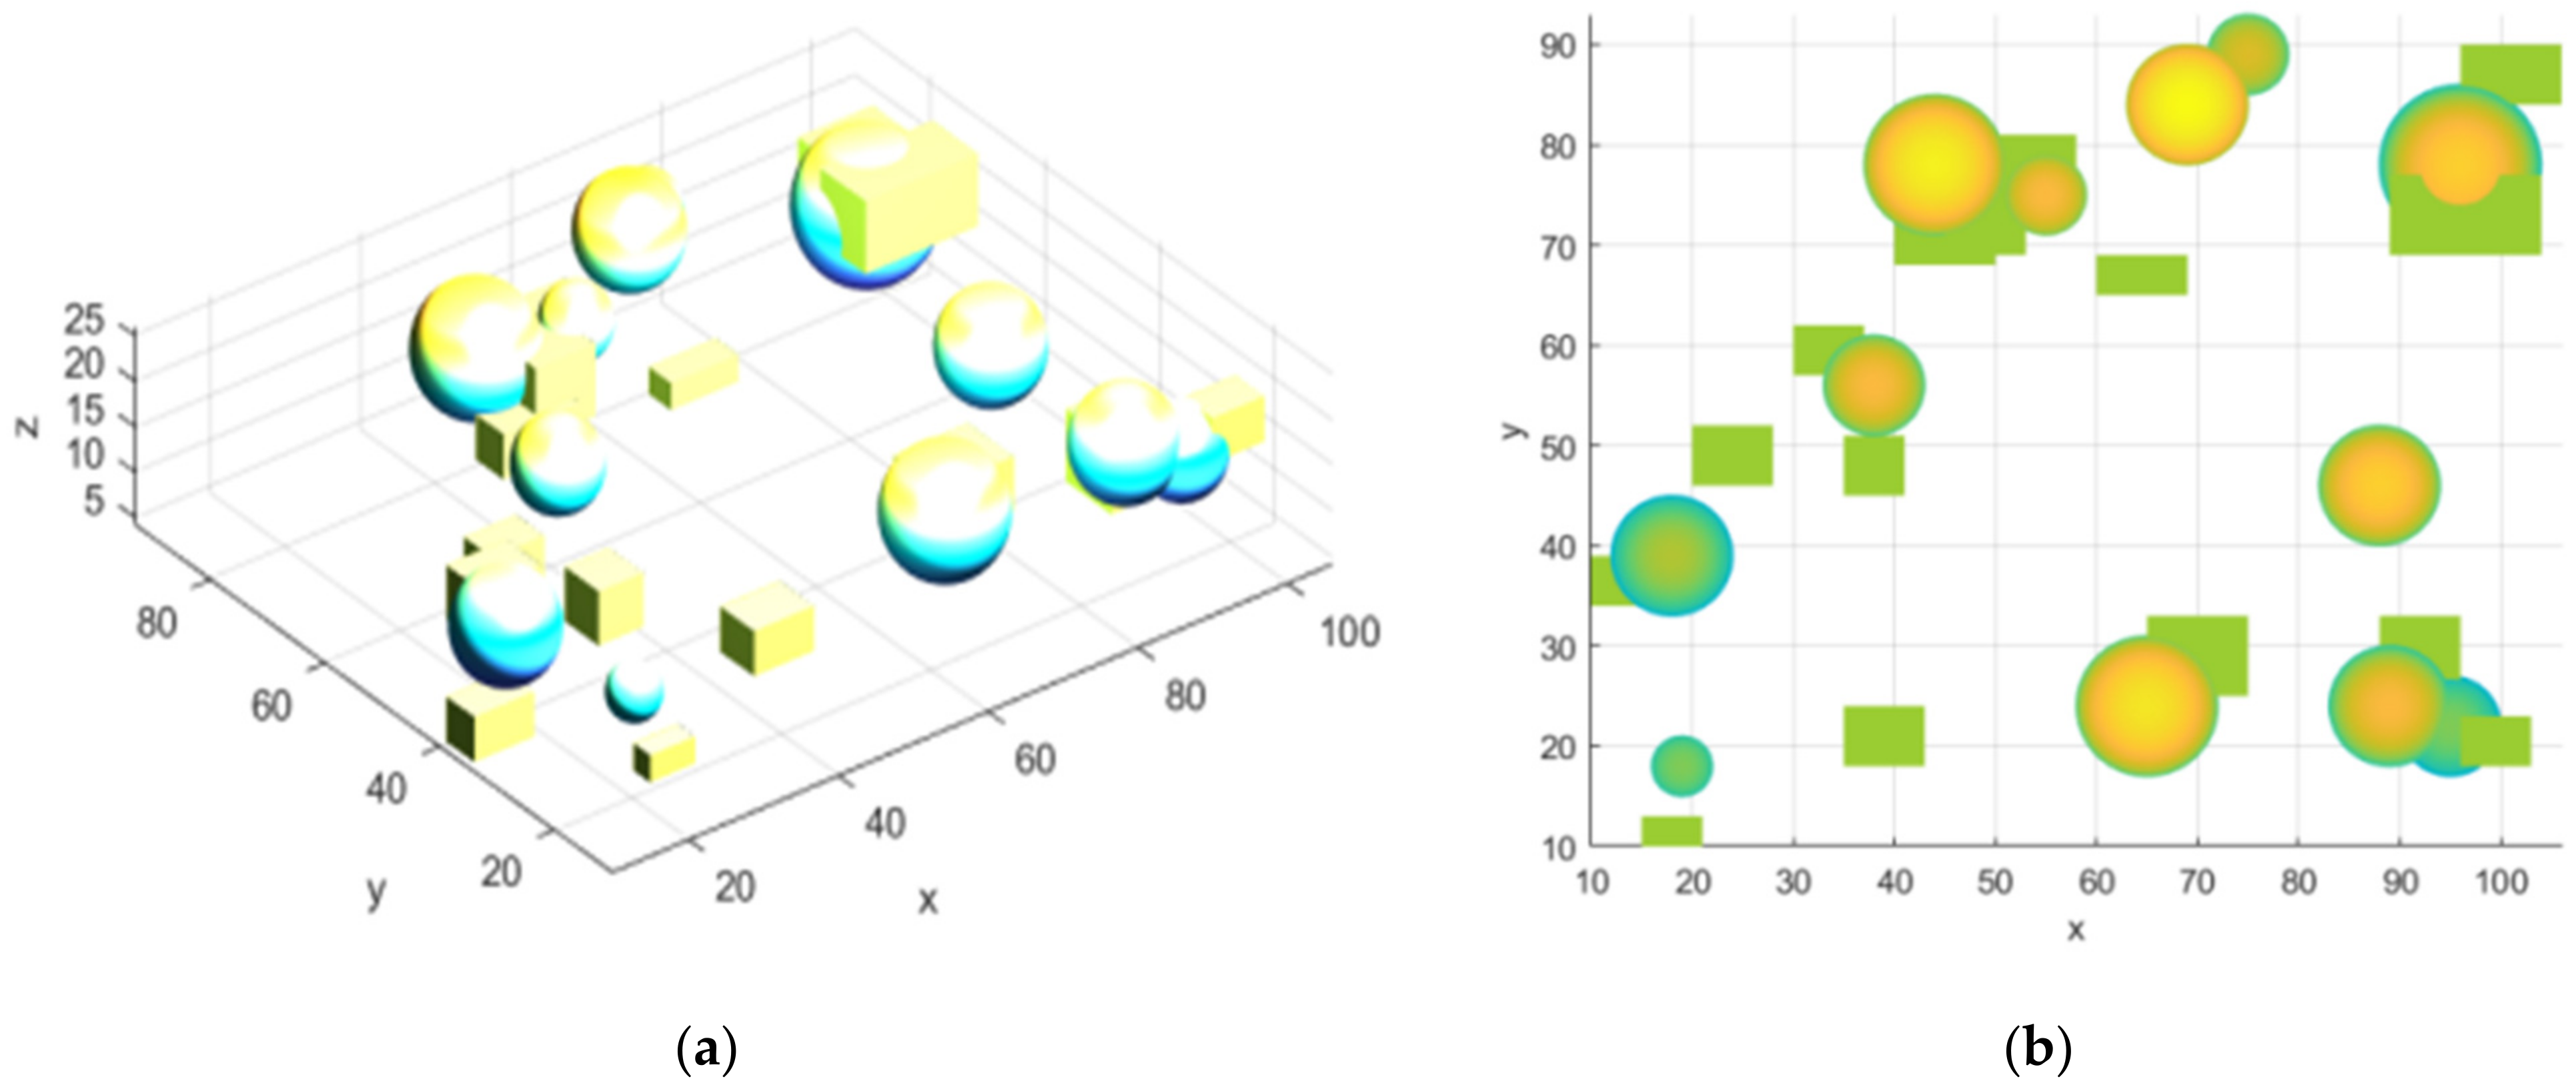
First, the three-dimensional problem in three-dimensional space is transformed into a more intuitive and concise two-dimensional plane problem through projection. In this paper, the orthogonal projection method is adopted to project the space onto the two-dimensional plane of the earth. The orthogonal projection is also called orthogonal view. In this projection mode, no matter the distant and near objects look the same size, the projection imaging makes people feel different from the human eye observation effect (as shown in the Figure 2). Orthogonal projection is very useful in the modeling process. It provides a more “technical” vision of the scene, making it easy to draw and judge the scale. Obviously, by reducing the dimension of the battlefield space, the battlefield data not only has the opportunity to express more clearly and intuitively, but also can be sorted and processed orderly, which is more conducive to extracting the required effective information to assist decision-making. It is undeniable that, due to the limitations of the two-dimensional plane in the expression of information elements, the reduction of dimension battlefield space is realized at the cost of losing some battlefield airspace information. For example, the projected two-dimensional battlefield plane cannot display the respective altitude action range of airspace and the altitude level configuration relationship between airspace. The lost airspace information is also an important part of the composition and description of airspace properties. In particular, the altitude parameter of airspace is one of the three core elements of airspace, which plays an important role in the description and representation calculation of airspace properties. However, for the airspace clustering problem studied in this paper, the single dimension altitude configuration relationship between airspace can be carried out through simple and direct comparison of altitude parameters, It can be used as the pre preparation or end screening of two-dimensional airspace plane association clustering. This paper mainly studies the problem of airspace association clustering in the more complex two-dimensional space. Part of the lost airspace information is not in the key area of this paper, so it has no impact on the final clustering results and efficiency. By projecting the projection line perpendicular to the ground, you can obtain a two-dimensional airspace projection plan (as shown in the Figure 3).
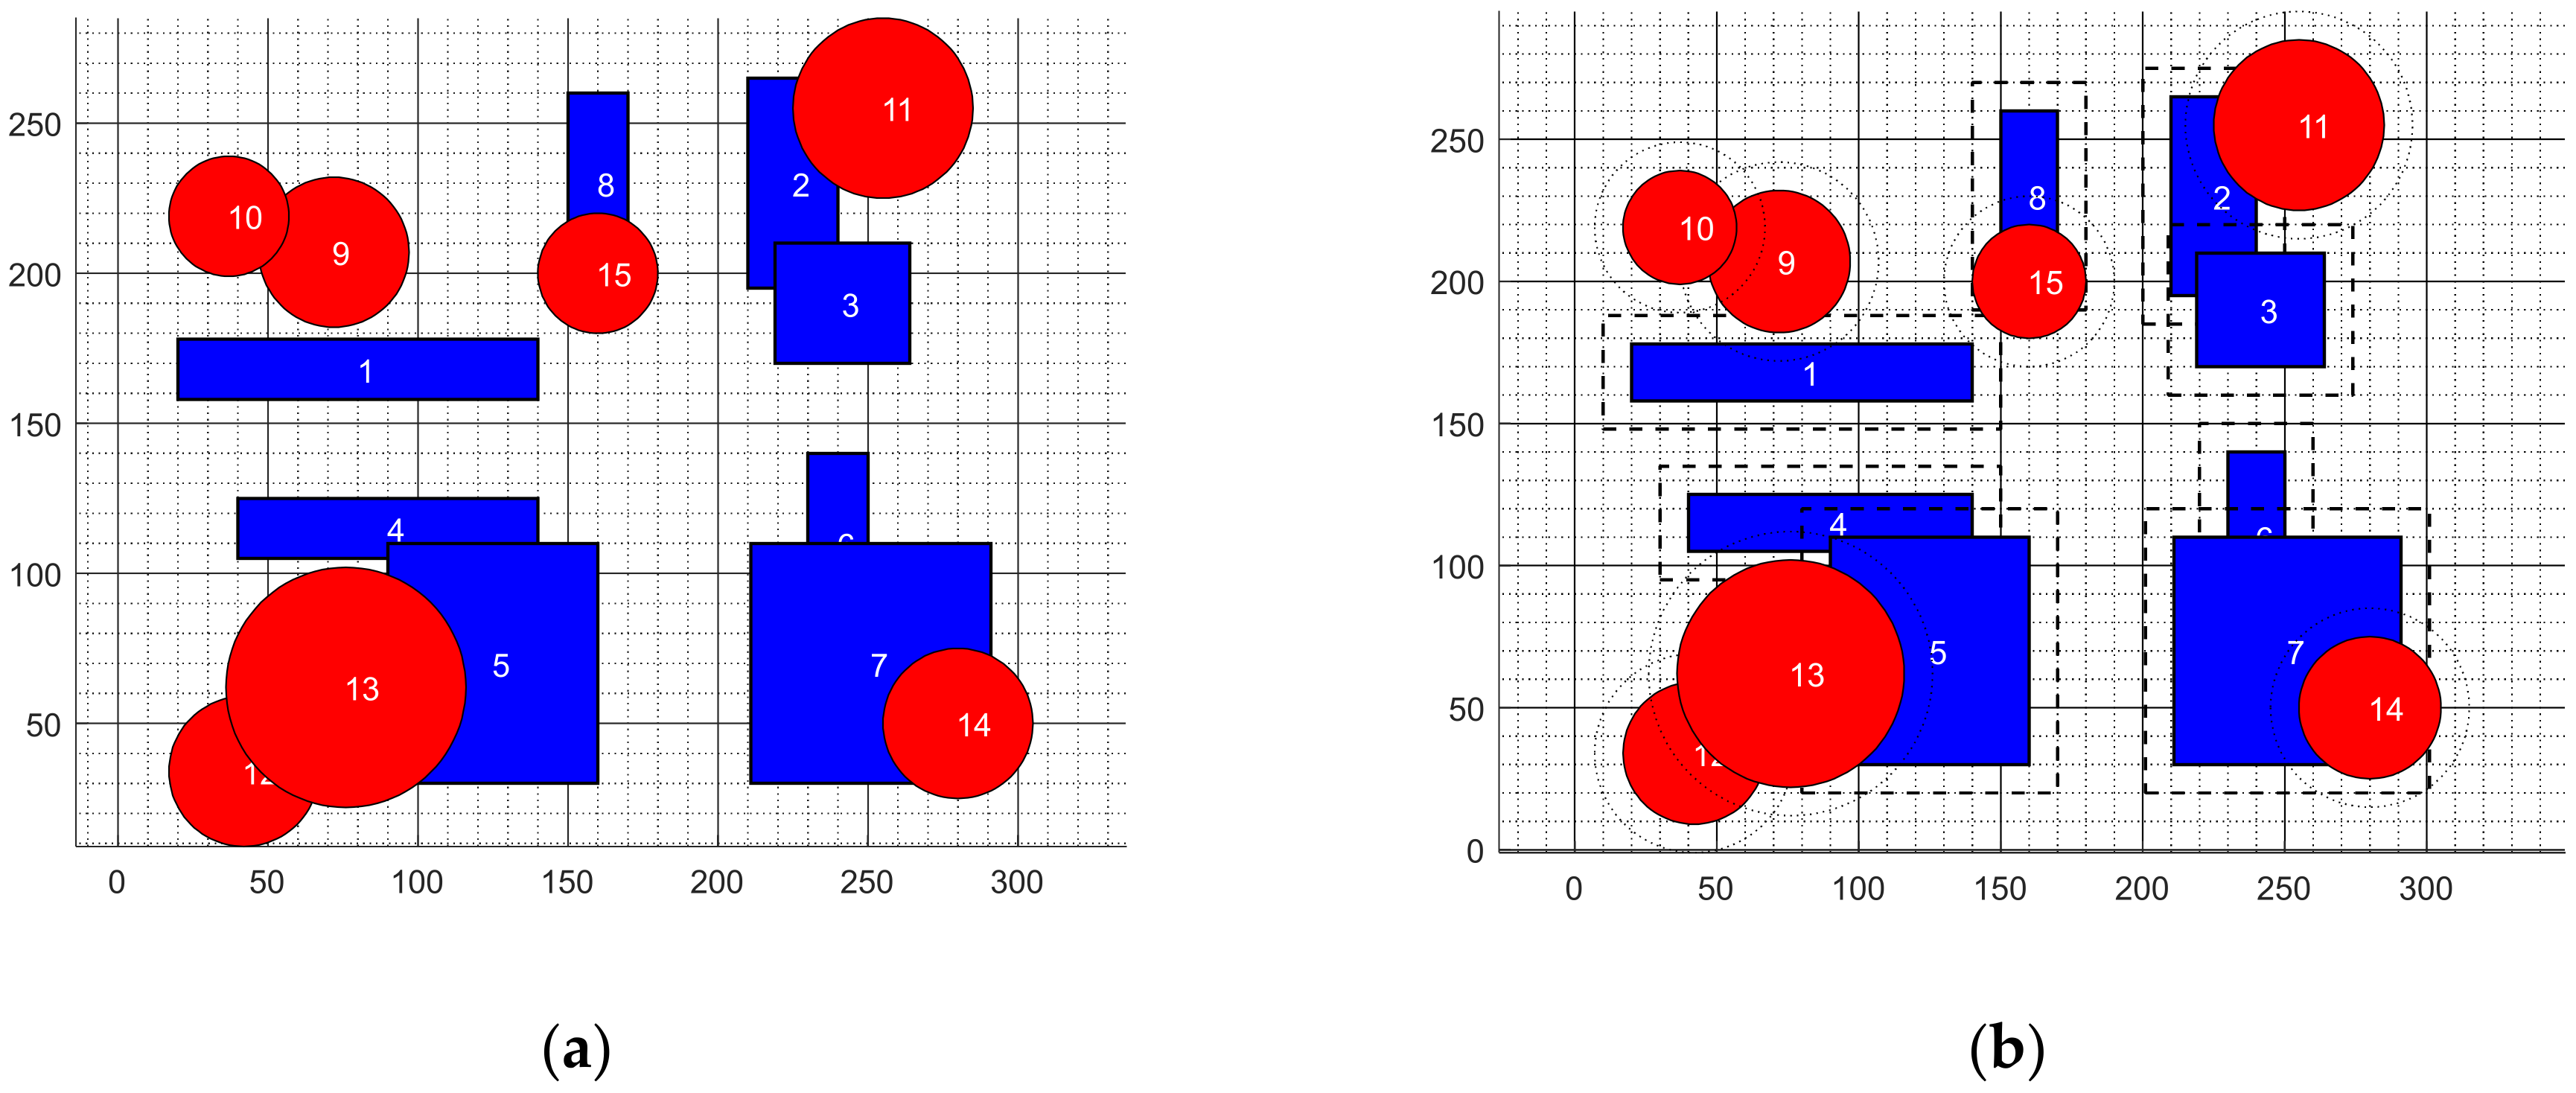
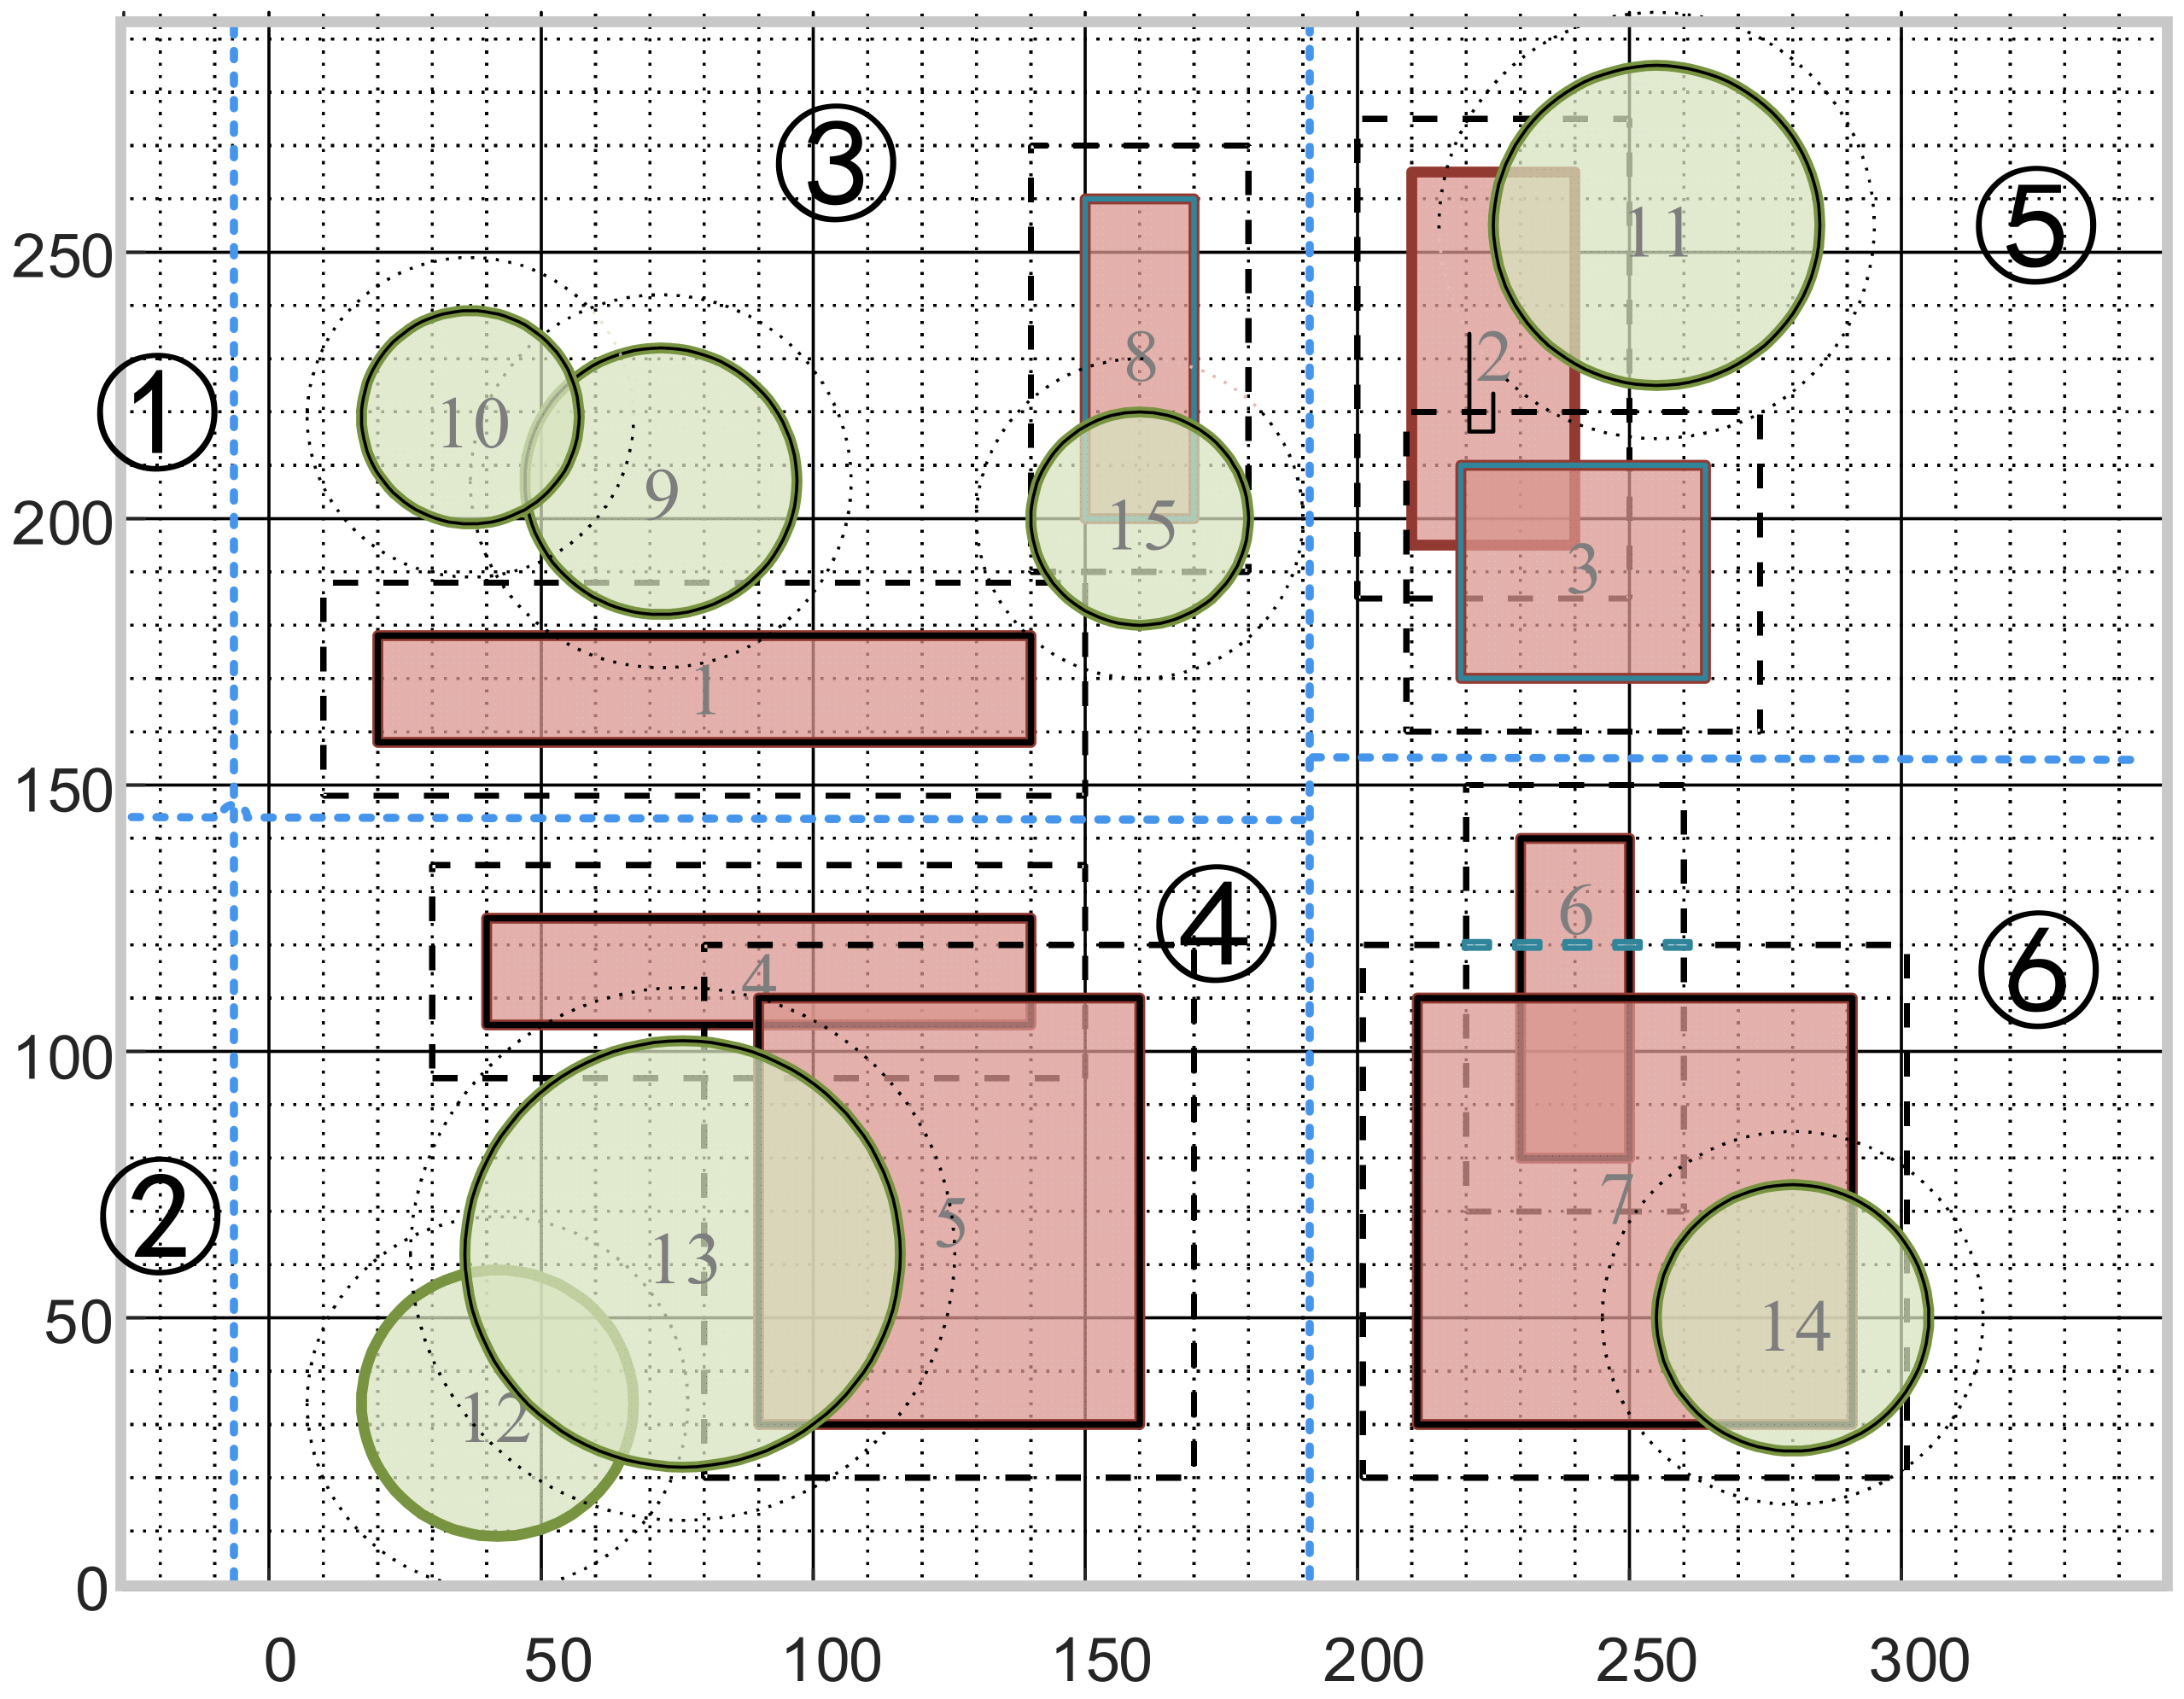
In order to show the airspace clustering methods and steps more clearly and intuitively, this paper simulates a 300 battlefield airspace and sets 15 task airspace above it. The specific distribution is shown in the Figure 4a. At the same time, a security bounding box with a width of 10 is constructed for each mission airspace, and the airspace is projected to obtain the mission airspace projection map (as shown in the Figure 4b).

4.2.2. Projection Image Processing

In order to highlight the target area of the airspace projection, increase the visual contrast and transform the airspace projection map into a digital coordinate matrix that can represent the airspace location information. In this paper, the color projection two-dimensional plan is converted into gray image. The conversion method is mainly used to calculate the gray value I g r a y of each pixel in the R G B image through G a m m a correction. The calculation formula is as follows:
I g r a y x , y = I R x , y 2.2 + 1.5 I G x , y 2.2 + 0.6 I B x , y 2.2 1 + 1.5 2.2 + 0.6 2.2
By giving each pixel of the original image a new R G B value, a two-dimensional grayscale image of airspace projection is generated (as shown in the Figure 5a). The gray level equalization can also be used to further process the gray image, which can make the gray image contrast more intense, and the proportion of each gray level tends to be the same. The processed image is shown in the Figure 5b.
In order to further process and analyze the two-dimensional airspace projection plan and obtain effective airspace location information, its gray image needs to be binarized. In this way, the collection property of the obtained image is only related to the position of the point whose pixel value is 0 or 255, and it does not involve the multi-level value of the pixel, making the processing simple and the amount of data processing and compression small. The basic method of binarization processing is to determine all pixels whose gray level is greater than or equal to the threshold as belonging to a specific object, and the gray value is 255, otherwise these pixels are excluded from the object area, and the gray value is 0. In this paper, the adaptive threshold is calculated by subtracting the average value of the neighborhood pixel values within the radius around any pixel to realize the binary processing of gray image. The calculation formula of adaptive threshold is as follows:
T x , y = s = r r t = r r f x + s , y + t 2 r + 1 2 C
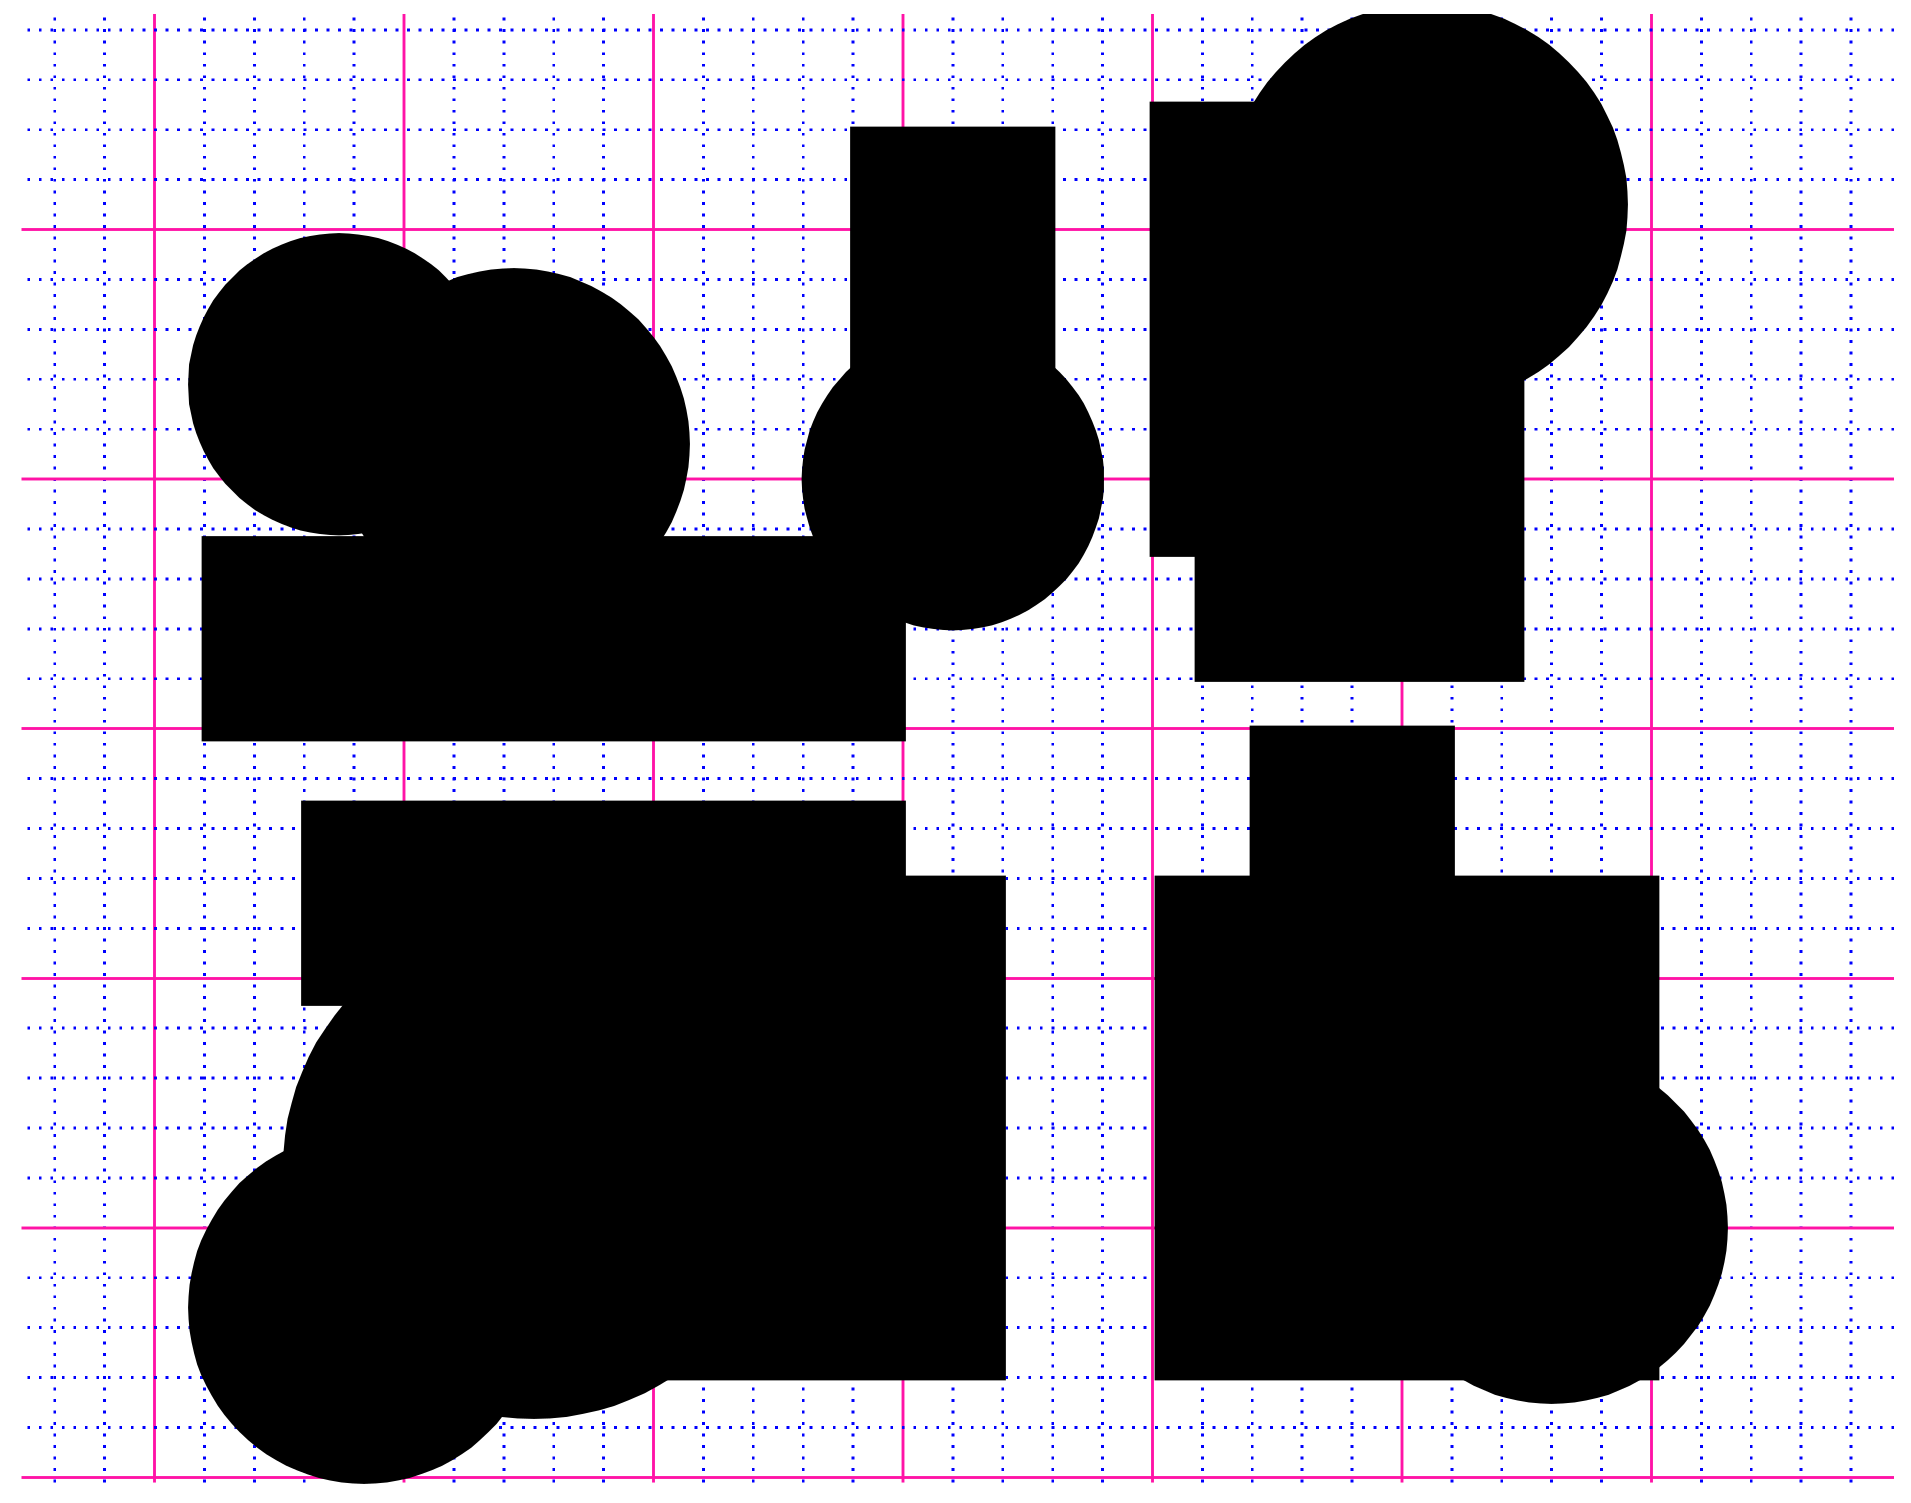
The airspace projection gray scale image after binary processing is shown in the Figure 5. At the same time, through the Matlab “imread” function to read the binary image, you can obtain the binary matrix of the airspace location information, and make the necessary data preparation for the subsequent clustering processing. Perform basic image processing on the task airspace projection in the example in the previous section to obtain the black and white binary projection image as shown in the following Figure 6.

4.2.3. Grid Representation of Projected Image

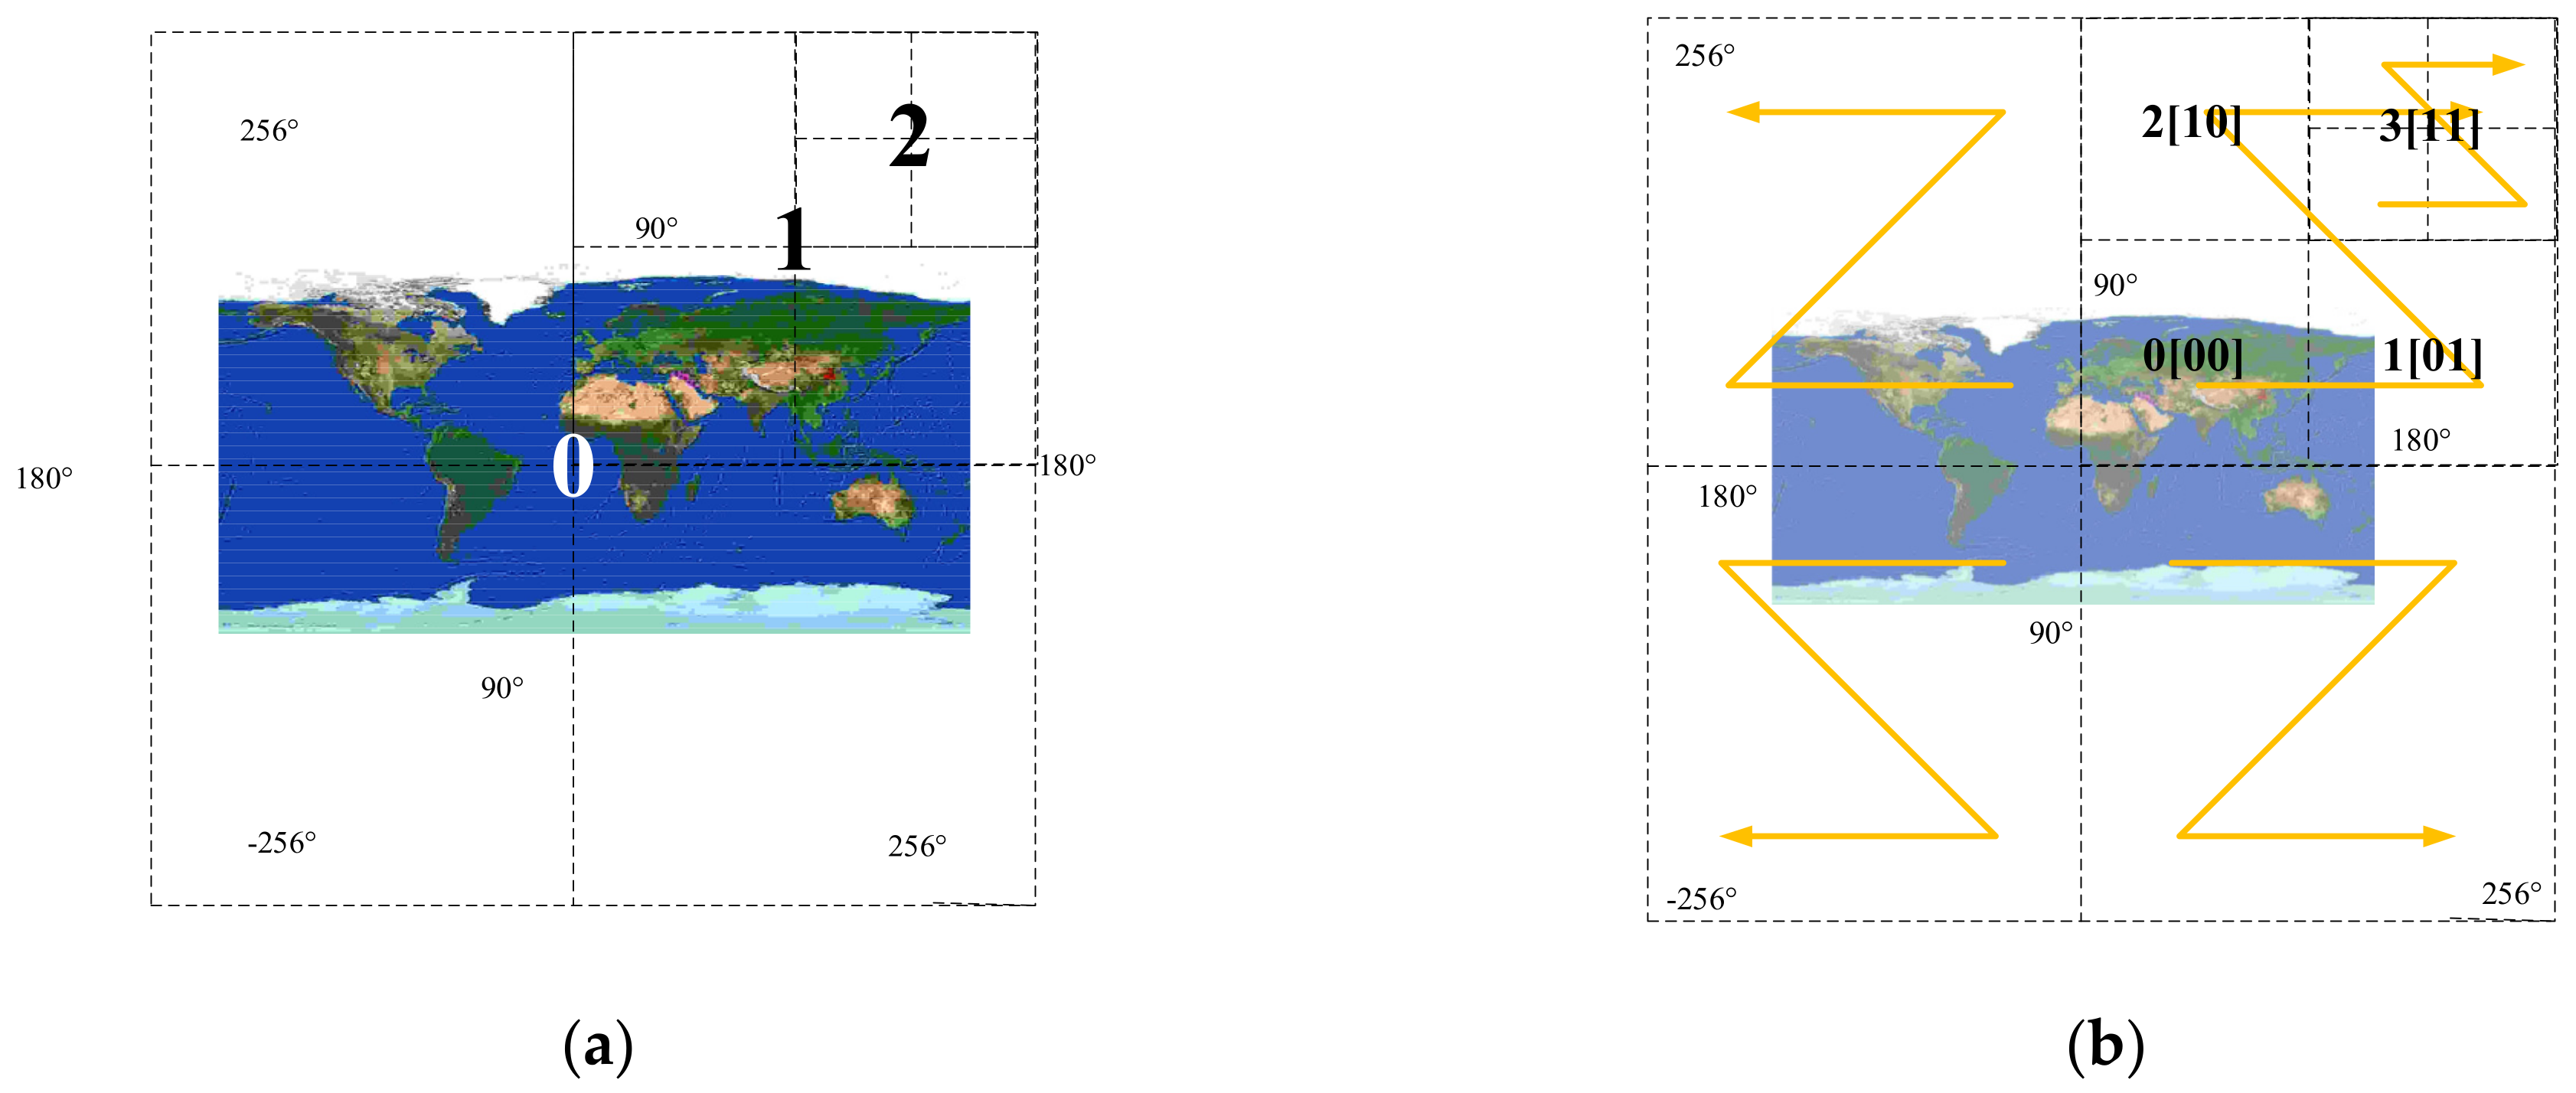
Through the processing of the projection image in the previous section, a binary matrix containing airspace location and other parameters are obtained. Next, the airspace grid generation framework is used as the organizational basis to grid the airspace projection image. In the process of characterization, the method of combining the longitude latitude coordinate grid and the rectangular coordinate grid can be adopted. The longitude latitude coordinate grid faces a large range (global or national), and it is suitable for the application of more roughly representing the distribution of information and rough positioning. The rectangular grid is oriented to a small area (province or city), which is suitable for the distribution of more detailed information and the application of relatively accurate positioning. The GeoSOT generation framework defines the 512 × 512 grid with the intersection of the equator and the prime meridian as the center point as the level 0 grid. The first level grid is divided into four equal parts on the basis of the first level grid, and the size of each first level grid is 256 × 256 . The second level grid is further quartered on the basis of the first level grid. The size of each second level grid is 128 × 128 . The following grids are divided according to the quadtree division principle (as shown in the Figure 7a). GeoSOT grid coding model adopts Z -order coding. As shown in the Figure 7b, the starting point of coding is 0 , 0 , so the z-order directions of the four hemispheres are different. The next grid is coded in Z -order on the basis of the previous grid; Each level of grid is assigned a value 0 , 1 , 2 , 3 in Z -order, which is converted into a binary code of 00 , 01 , 10 , 11 . Each level of grid code occupies 2 bits, and the level 32 grid code occupies 64 bits.
Taking the longitude and latitude coordinates ( 39 54 20   N , 116 25 29   E ) of Tian’anmen Tower in Beijing, China as an example, the transformation method between longitude and latitude coordinates and GeoSOT grid coding is explained. Since the longitude value 116 25 29   E is less than 256 and 128 , the first two bits of the grid code are both 0. At the same time, if 116 25 29 / 64 = 1 is more than 116 25 29 / 64 = 1 , the third bit is coded as 1. Then, divide the grid into the fourth level with a size of 32°. If 52 25 29 / 32 = 1 is more than 20 25 29 , the fourth bit code is also 1, and so on. Finally, under the grid precision of the 16th level 32 × 32 , the binary longitude code is 0011101000110010 . Similarly, the binary latitude code is 0001001111101100 . Cross the latitude code and longitude code to get the one-dimensional binary code of the 16th level grid where the Tian’anmen Gate Tower is located as G 00000111010011101010110110100100 , and convert it into the one-dimensional quaternary code as G 001310322 2312210 .
When characterizing small objects, the rectangular coordinate grid in the region can be used. The rectangular coordinate grid adopts the Gauss Kruger projection rectangular coordinate system (as shown in the Figure 8), which takes 100 km as the basic unit and expands step by step. The minimum grid spacing can reach the “meter” level. The code is composed of four types of elements: the code of the Northern and Southern Hemisphere, the Gauss Kruger projection zone code (hereinafter referred to as the projection zone code), the 100 km grid code, and the coordinate grid code. The coding rules are southern and northern hemisphere codes, and 1-digit alphabetic codes are adopted. The southern hemisphere is represented by “S” and the northern hemisphere is represented by “N”. The projection band code is represented by a 3-digit code. When 6 zones are divided, 60 zones in the world. Use 0 to make up 3 digits before the projection zone number. The projection zone number codes are 001 to 060 respectively; When 3 zones are divided, there are 120 zones in the world. The projection zone number is increased by 100, and the projection zone number codes are 101 to 220 respectively. The 100 km grid code adopts the mixed coding of 1 character and 2 digits. When 6 zone is adopted, it is represented by one character (A–H) every hundred kilometers from west to east. When a 3 zone is adopted, it is represented by one character (C–F) every hundred kilometers from west to east. From south to north, every hundred kilometers is represented by two digits (00–90).
To illustrate the coding method, if a point is located in ( 39 55 14   N , 116 30 25   E ), its 6 band projection band number is 20, its ordinate value is 4420.4   km , and its abscissa value is 457.3   km , then its rectangular grid codes are as shown in the Table 1.
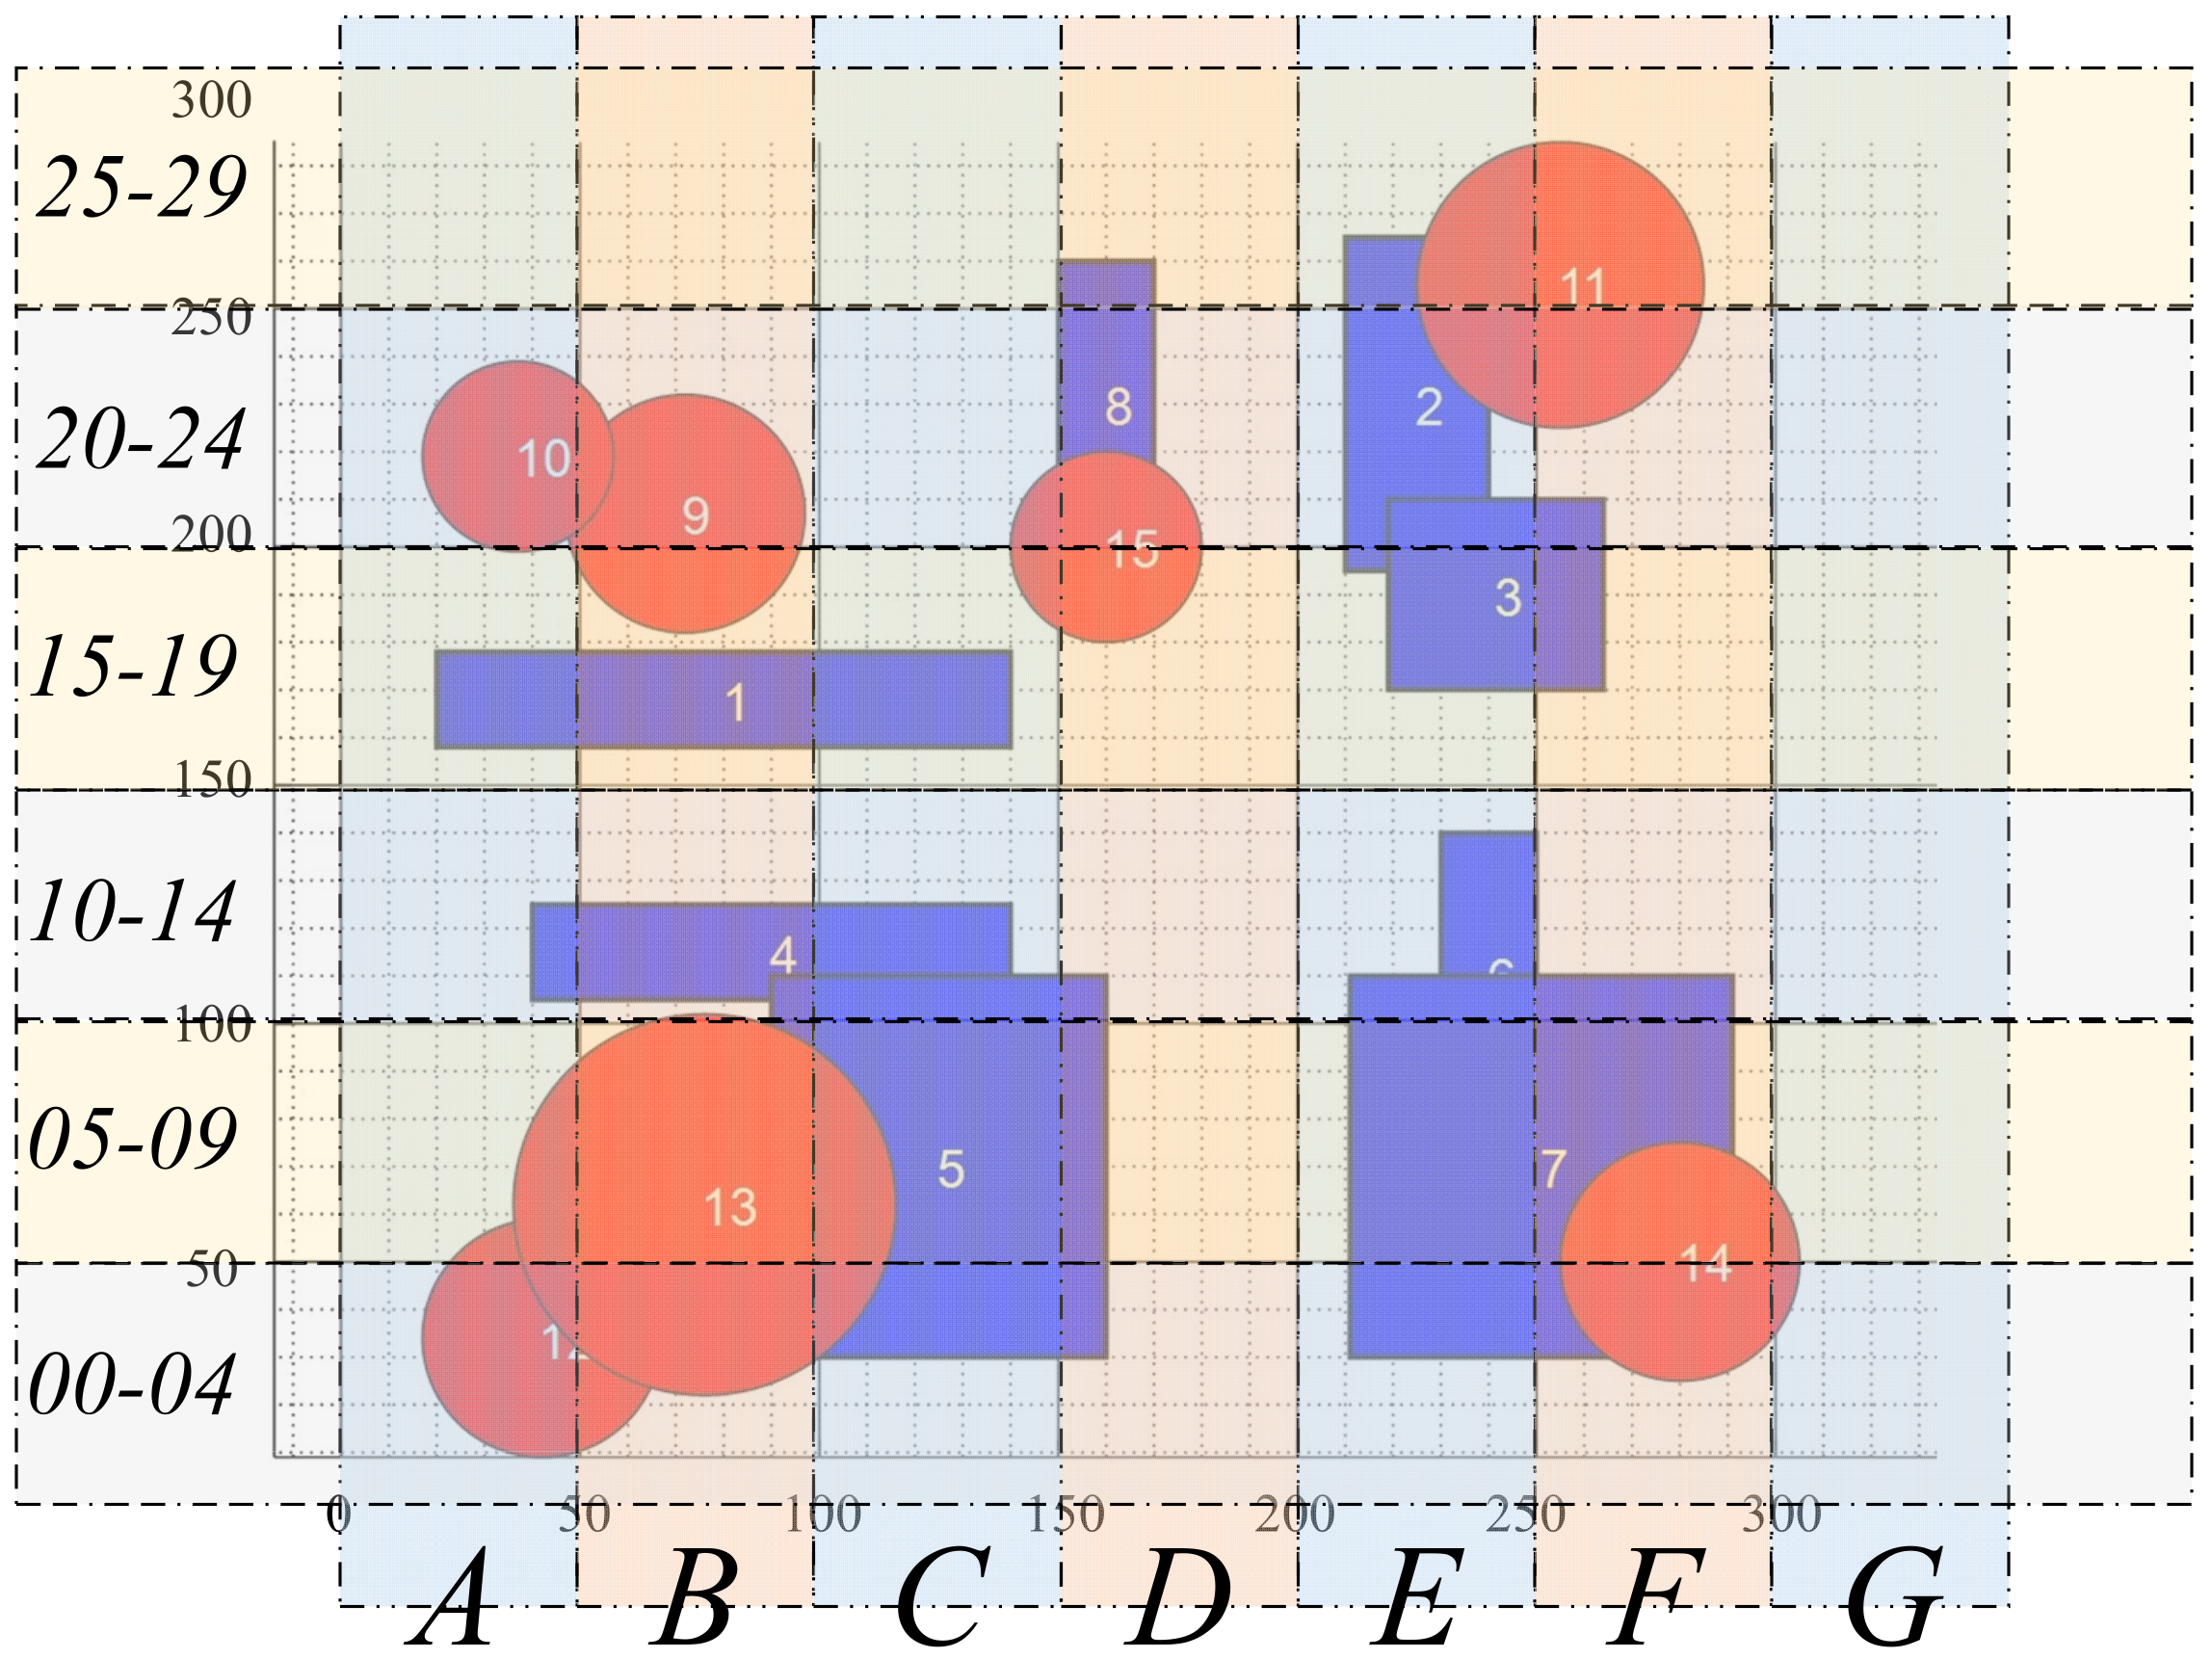
The 300   km × 300   km battlefield airspace set in Section 4.2.1 belongs to a small range of airspace objects, so the whole battlefield airspace and task airspace can be characterized by local rectangular coordinate grid. In this section, a small range of battlefield airspace coding rules is designed (as shown in the Figure 8), which is from west to east. Every 50 km is set as a mission belt, which is represented by one character (A–G). Each mission zone is further divided into five action areas, which are represented by a digit from west to east (0–4). From south to north, each kilometer is represented by 3 digits (000–299). The schematic diagram of battlefield airspace planning results is shown in the Figure 9. In the schematic diagram, the square airspace is marked in blue, and the circular airspace is marked in red. Different kinds of airspace are distinguished by different colors.
Using the battlefield airspace coding rules, the geographic locations of 15 airspace are coded. When representing the position of the task airspace, this paper uses the grid coordinates of the central position of the task airspace, and it assists in characterizing the airspace with airspace parameters. Then, the characteristics parameters of the task airspace are characterized as shown in the Table 2.

4.3. Using Multi A * Algorithm to Generate Edge Cluster Lines

Compared with the D i j k s t r a algorithm, the A * algorithm is more “heuristic”, reducing the search for points with less possibility of passing through, and improving the efficiency of computing. Before the algorithm operation, the initialization parameters such as the starting point, the ending point and the obstacles need to be clear. The core of the algorithm is the heuristic function F that drives the grid path generation:
F = G + H
where G is the mobile generation value (grid quantity value) that moves from the starting point to a specific node, and the value depends on the information of known nodes; H is the estimated cost of a specific node moving to the target point, which is usually calculated by the estimation method. The value comes from the estimation of the information of unknown points. By constantly updating the comparison parameter values, it is determined to save the node grid and generate the required path by connecting the node grids. The Multi A * algorithm proposed in this paper retains the operation logic and the core heuristic function F of the traditional A * algorithm. Through the idea of finding points first, then connecting lines, and finally generating airspace clusters, it meets the different accuracy requirements of airspace clustering by setting multiple groups of “starting points—ending points”.
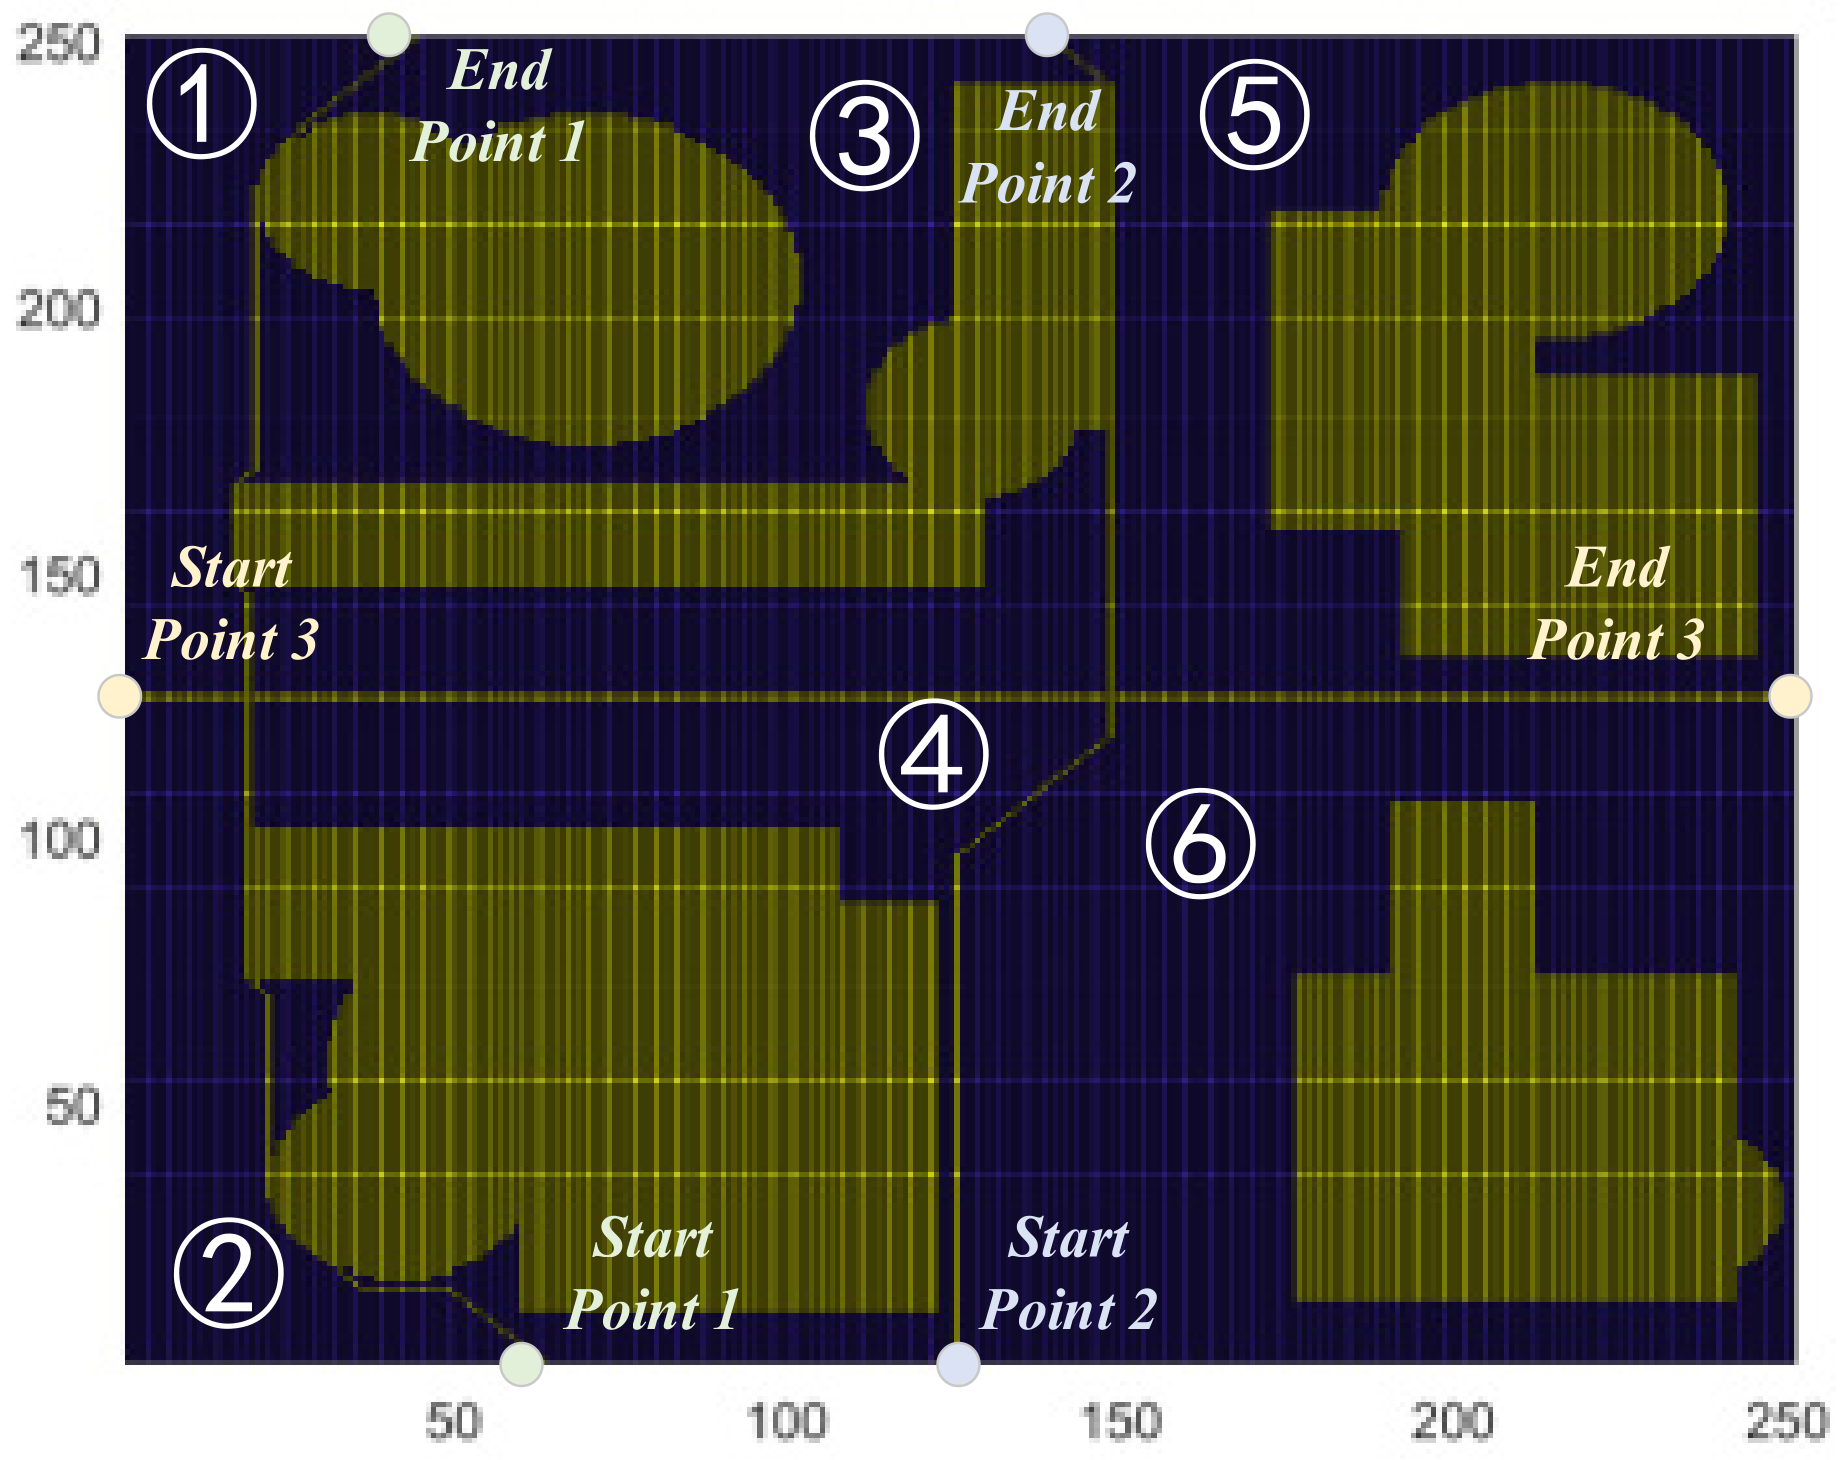
The specific process of A * algorithm to generate clustering edge lines is omitted here. Set the number of target clusters m = 6, and the battlefield airspace clustering diagram can be preliminarily obtained (as shown in the Figure 10). The final airspace clustering results are recorded shown in the Table 3.

4.4. Clustering Data Processing

In Section 4.3, the preliminary clustering results have been obtained by observing the airspace clustering map. However, in the specific implementation process, the computer cannot directly observe the image to obtain the results, but needs to store, calculate, and compare the data to obtain the final results. Therefore, the images and information after the initial clustering need to be sorted and processed. Airspace clustering data processing is mainly divided into two parts: one is grid representation of clustering lines, and the other is definition of elements in each cluster. The following describes the methods and steps of clustering data processing based on the battlefield airspace case.

4.4.1. Airspace Clustering Line Marking

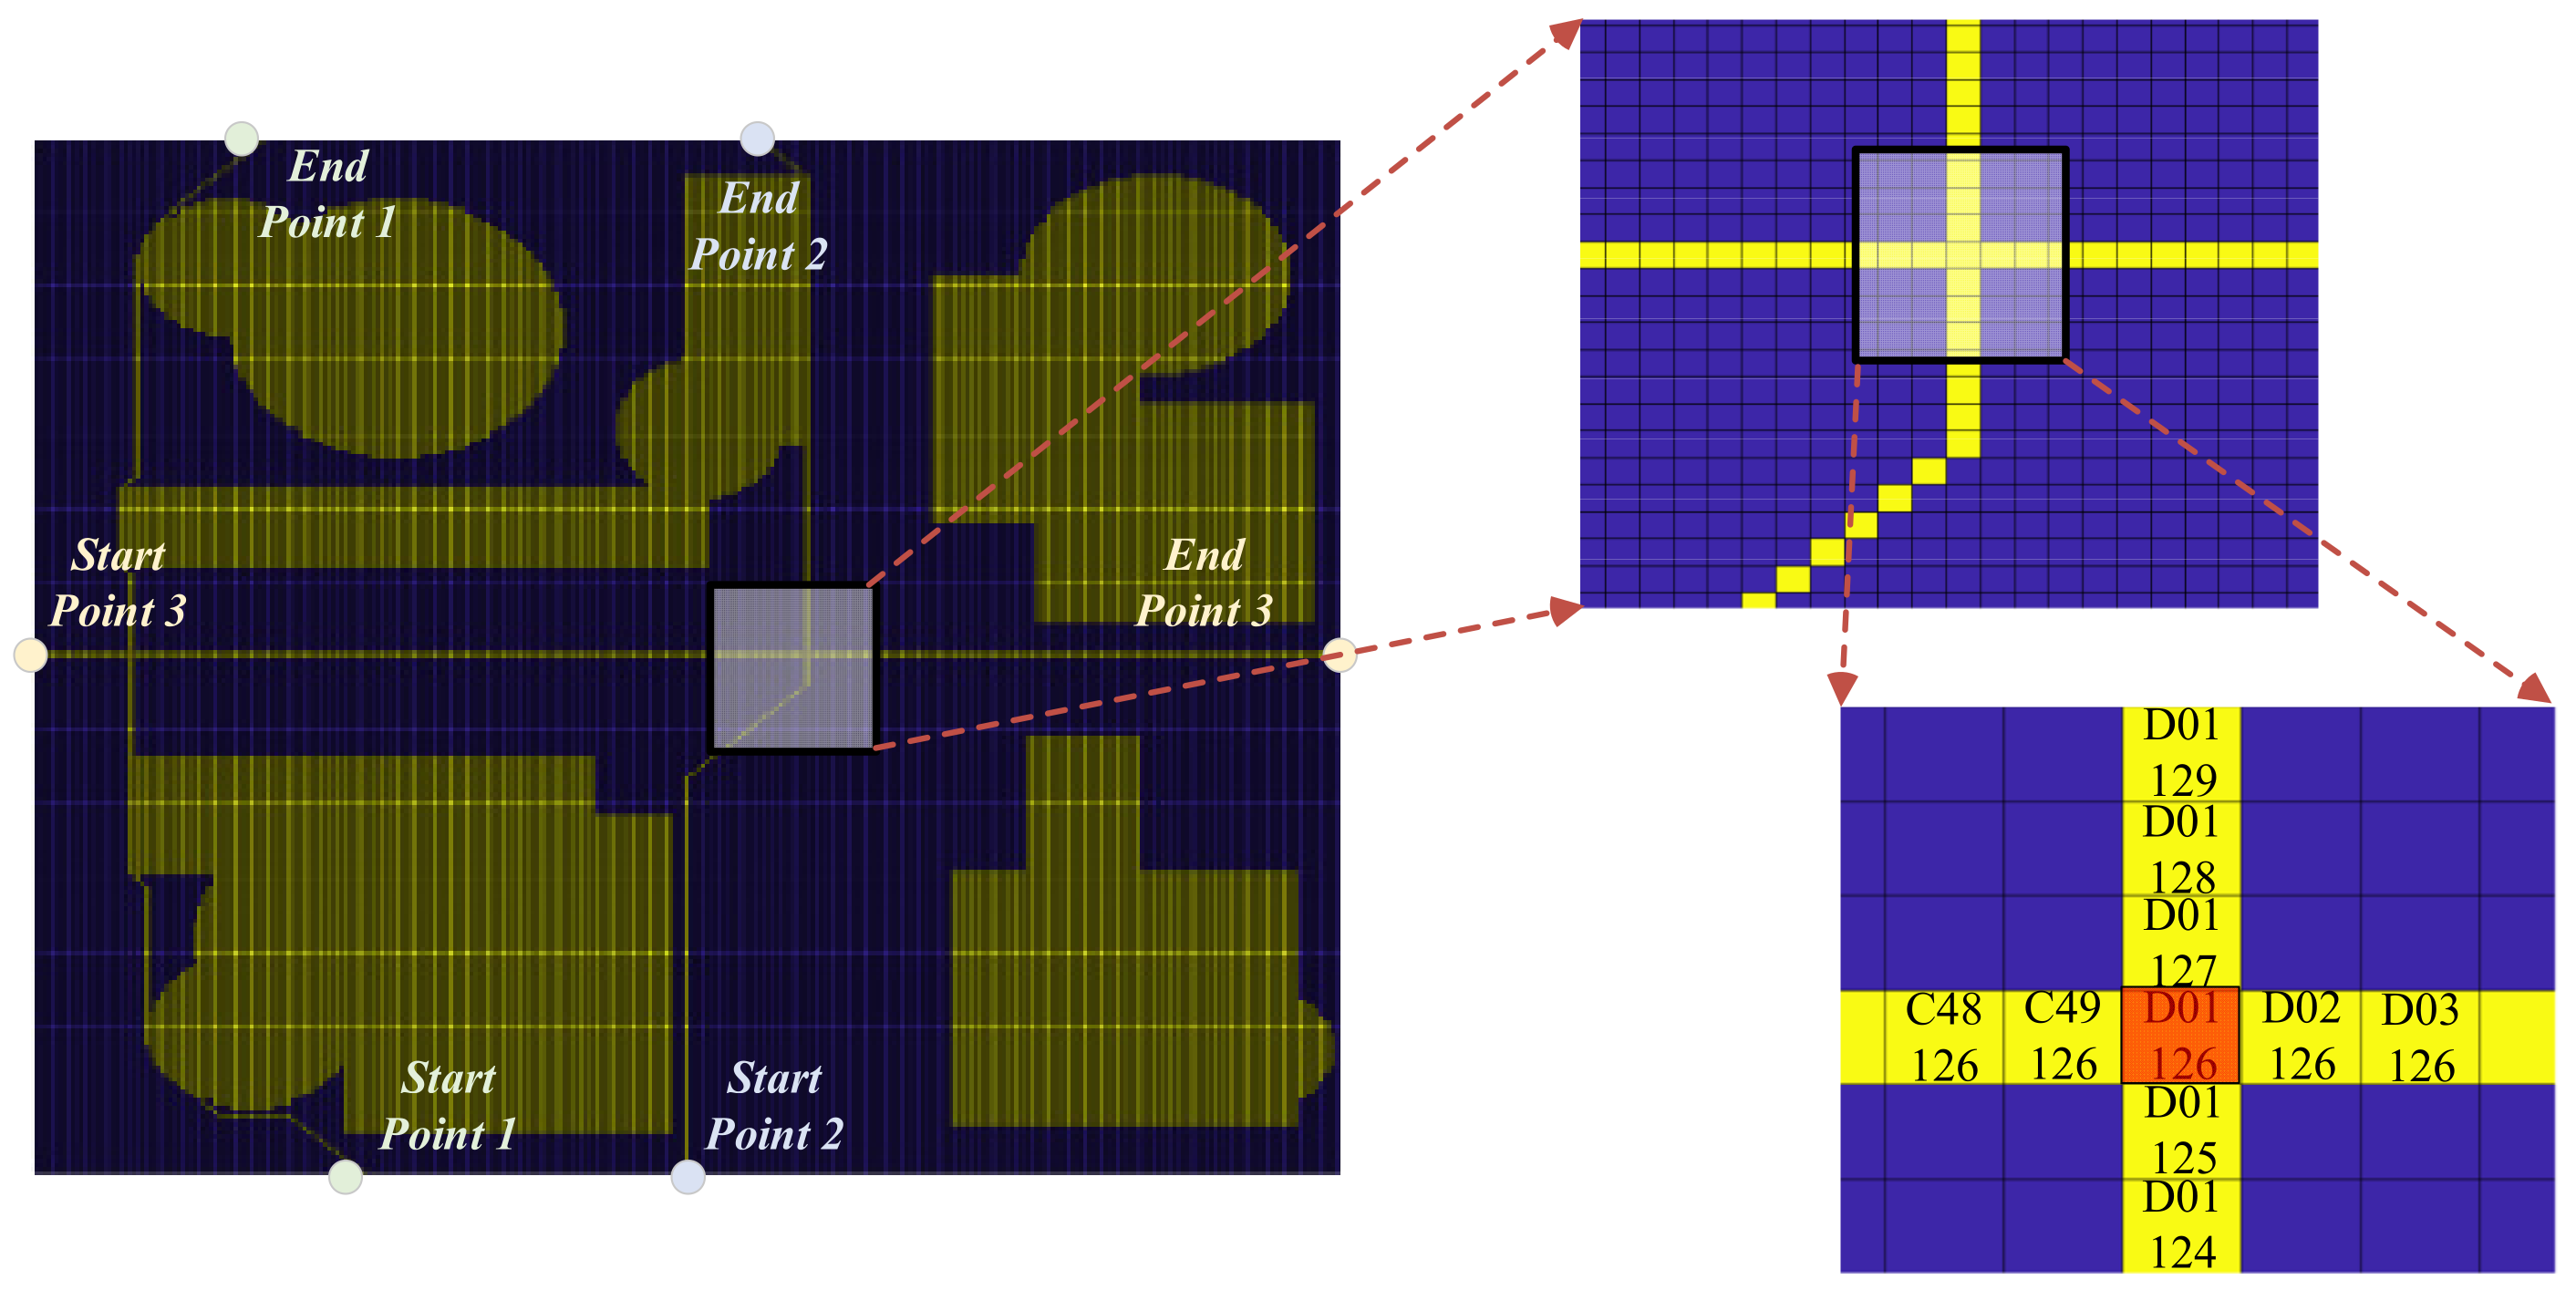
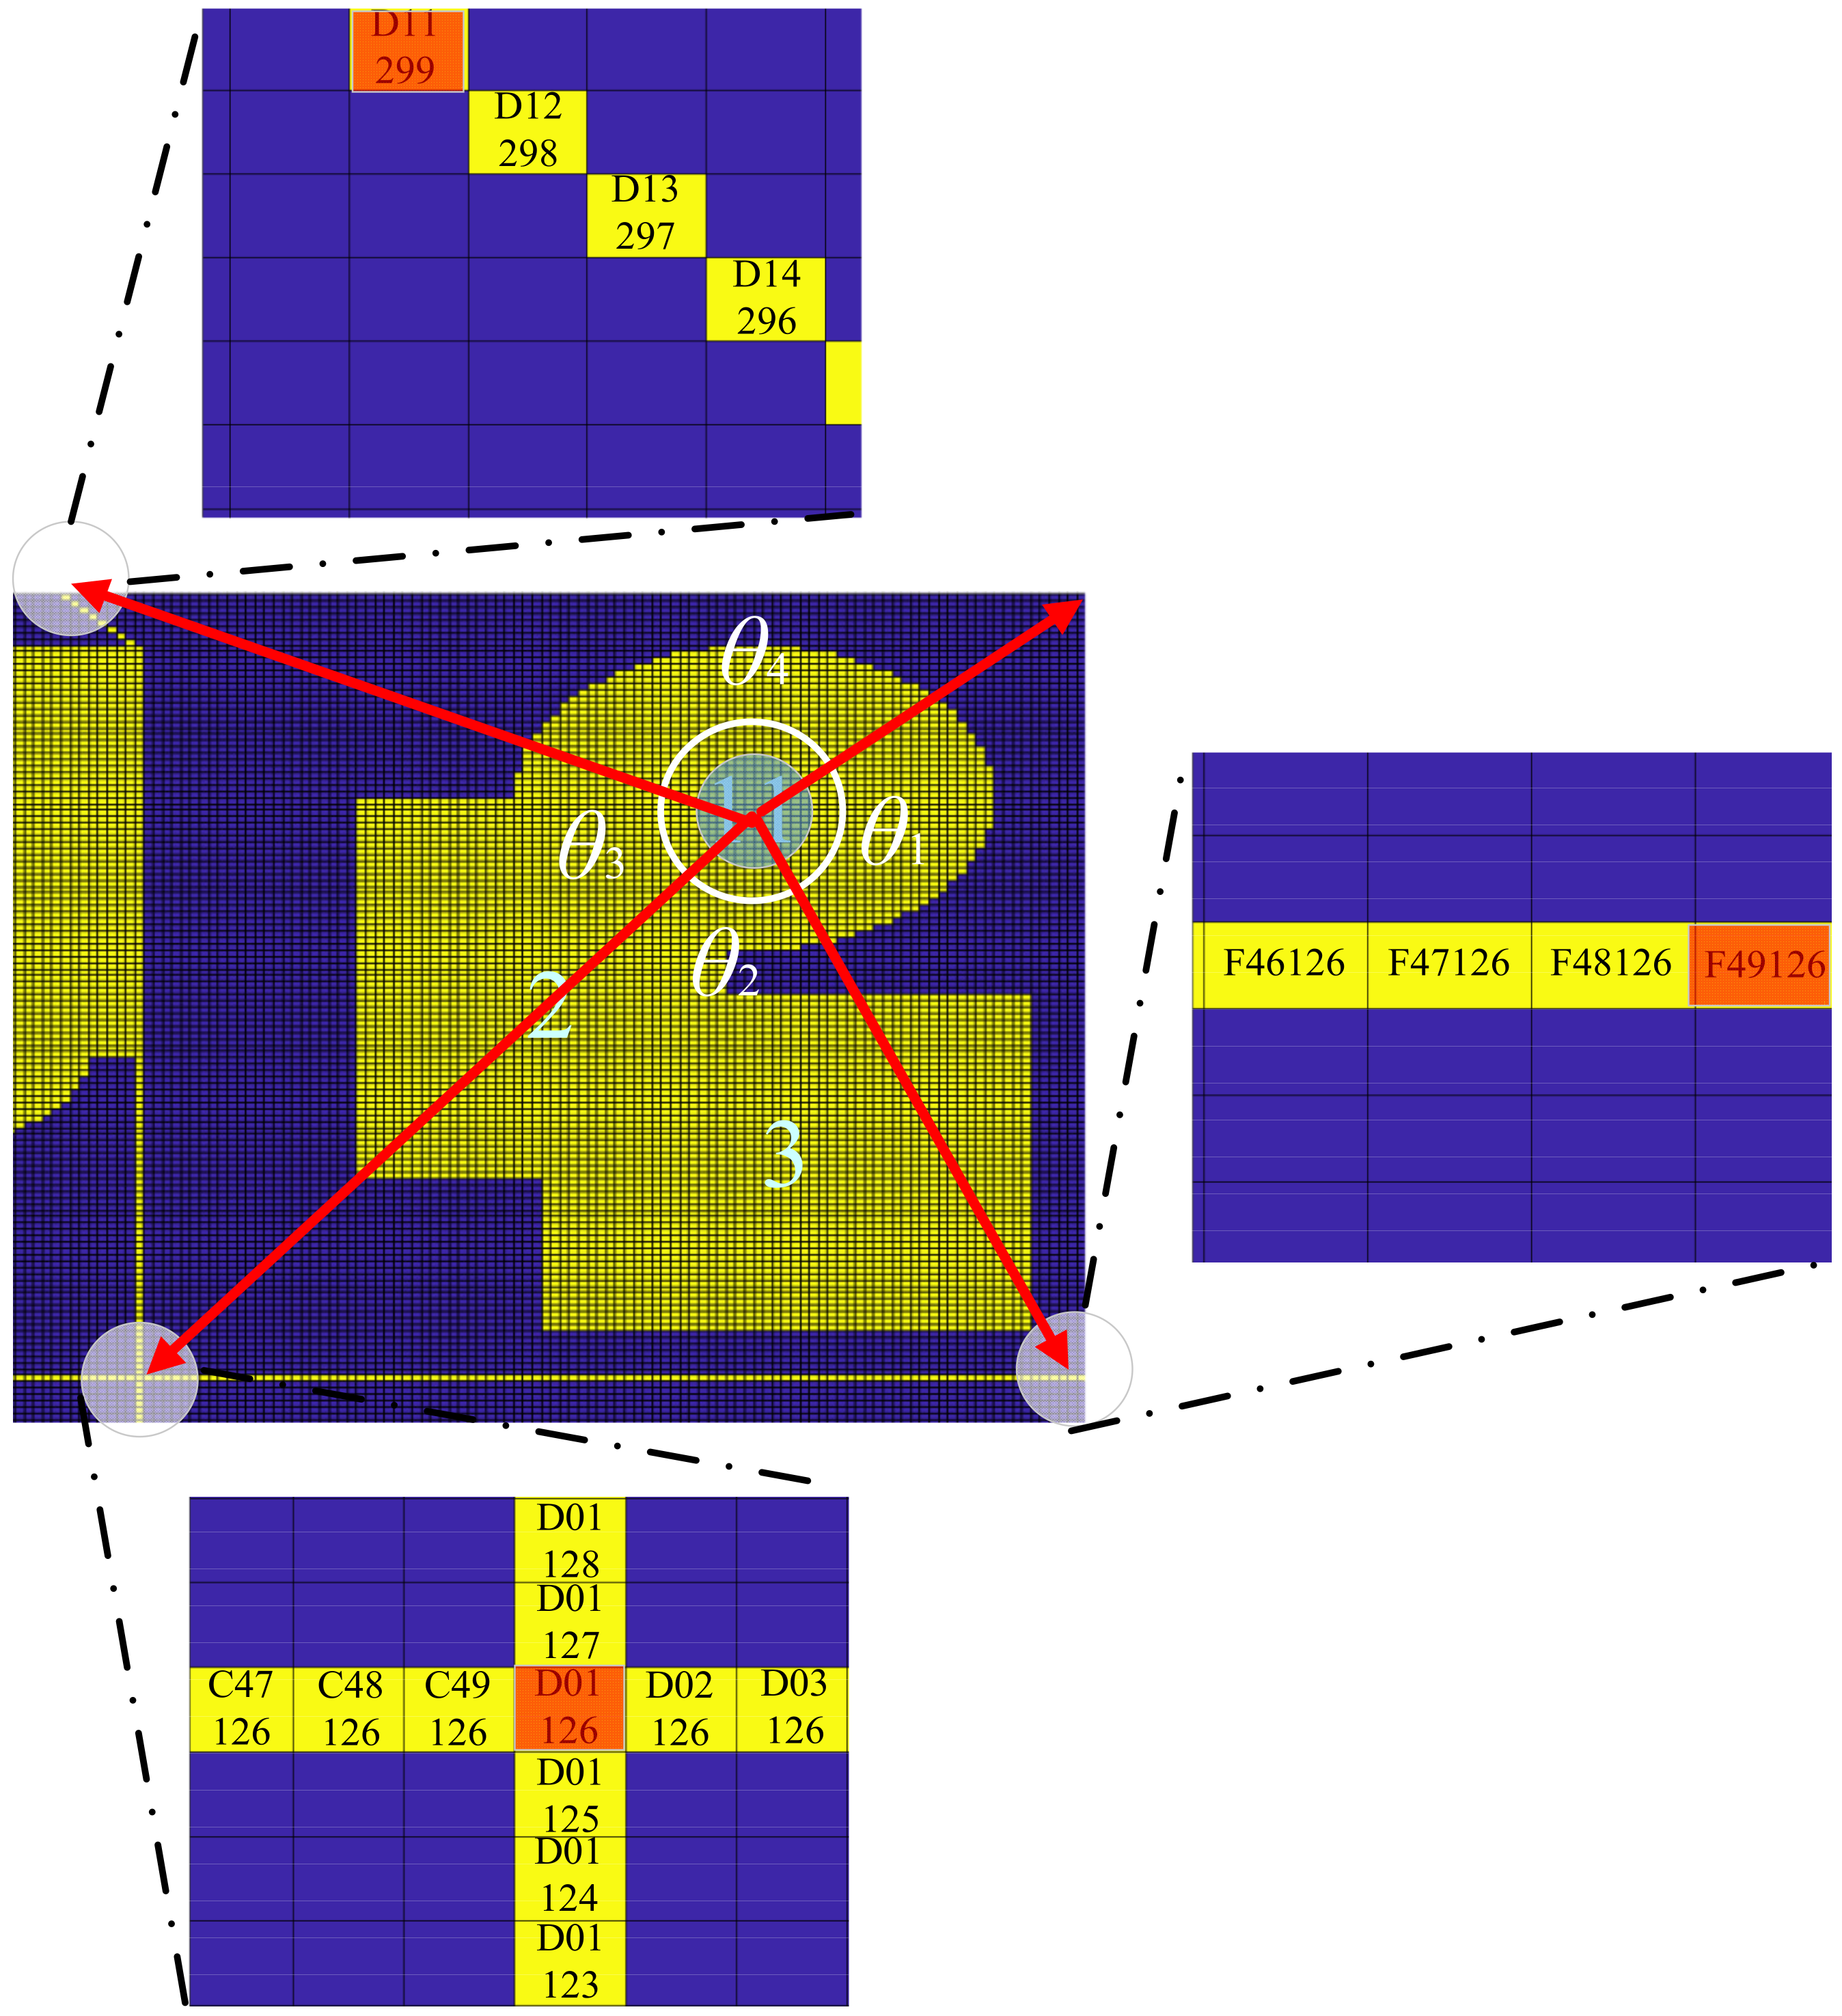
According to the idea of airspace clustering method, the whole battlefield airspace is divided into multiple airspace clusters through the intersection of multiple airspace clustering lines. It can be considered to find the key nodes where multiple airspace clusters intersect, and then it marks the boundaries of each airspace cluster through the grid coding combination of the edges and intersections of the clustering lines. Computing the intersection of edge lines of airspace clusters mainly involves the method of grid overlap detection. First, the airspace clustering map generated in the previous section is enlarged at the intersection node of airspace clustering lines (as shown in the Figure 11).
In the process of grid overlap conflict detection, the grid code data structure in the following Table 4 is used, where C o d e _   I D is grid code, L 1 _   S e t is the object grid coding set in clustering line, and L 1 , L 2 _   S e t is the set of object grid codes in clustering line L 2 .
First, the encoding data in L 1 _   S e t and L 2 _   S e t are imported into C o d e _   I D , then the grid object in C o d e _   I D is listed as the detection object, and if it is occupied by L 1 or L 2 , it is assigned a value of 1. If none of them are occupied, the value is 0. If it is occupied twice, it is assigned a value of 2. Taking the above scenario as an example, as shown in the Figure 12, two cluster lines intersect, and an airspace-overlapping grid is detected.
Through airspace grid overlap detection, the grid code of intersection nodes of airspace clustering lines is obtained. In the above example, the grid code of intersection nodes of clustering lines L 1 and L 2 is “ D 01126 ”. According to this method, the intersection nodes of the airspace clustering lines can be represented by grid coding, and the combination of the intersection nodes of the points on the clustering lines can complete the grid representation of the airspace clustering lines.

4.4.2. Internal Element Identification of Airspace Cluster

The main task of the internal identification of airspace clusters is to identify which airspace is contained in each airspace cluster, gather the task airspace in the same cluster and match the corresponding airspace cluster. It can be confirmed that after clustering, any part of each airspace can be guaranteed to be in the cluster. Using this feature, this section selects the center point of each airspace to represent the entire airspace. Finally, the airspace cluster to which each airspace belongs is determined by judging the position relationship between the center point of the airspace and the vertex of the airspace cluster. Each airspace cluster is composed of multiple vertices, which can be connected to form an irregular polygon. The above problem can be abstracted as judging the position relationship between the center point of the airspace domain and the vertex polygon. There are many methods to judge the positions of points and polygons, including ray intersection method [74] (as shown in the Figure 13a), circle number method [75] (as shown in the Figure 13b) and angle addition method [76] (as shown in the Figure 14). In essence, the ray intersection method and the circle number method both use the target point as the origin of the ray, and they judge the position relationship between the point and the polygon by judging the number of intersections between the ray and the polygon. This method has to go beyond the convexity and convexity of the polygon and has poor applicability. The angle addition method sets the target point as the starting point of the ray, and constructs multiple rays with the vertex of the airspace cluster as a point on the ray. If the sum of the ray angles is 360°, the target point is inside the polygon; otherwise, the target point is outside the polygon. This method has low requirements on the shape and concavity of the polygon, and is more suitable for solving the problems in this paper.
Take the airspace cluster ⑤ of the airspace clustering diagram in the case as an example, judge the affiliation between airspace 11 and airspace cluster ⑤, and introduce the methods and steps of element identification inside the airspace cluster. First, locally enlarge the part of airspace clustering diagram about airspace cluster ⑤, and at the same time, grid identify the corner points of the clustering line and the geometric center points of mission airspace 11, as shown in the Figure 15.
It is not difficult to find θ 1 + θ 2 + θ 3 + θ 4 = 360 ° through calculation, and then it can be judged that the geometric center of mission 11 airspace is located in airspace cluster ⑤, and it can further be inferred that mission 11 airspace belongs to airspace cluster ⑤. According to the above steps, we can judge the ownership relationship of all airspace clusters to get the final airspace clustering result, as shown in the Figure 16.

5. Experimental Simulation and Analysis

This experiment is mainly divided into two parts. The first part is to compare the results and efficiency of various intelligent path planning algorithms for airspace clustering and evaluate the algorithm with the highest adaptability to the grid system. The second experiment is to explore the effect of airspace clustering on improving the speed of airspace conflict detection.

5.1. Algorithm Comparison Experiment

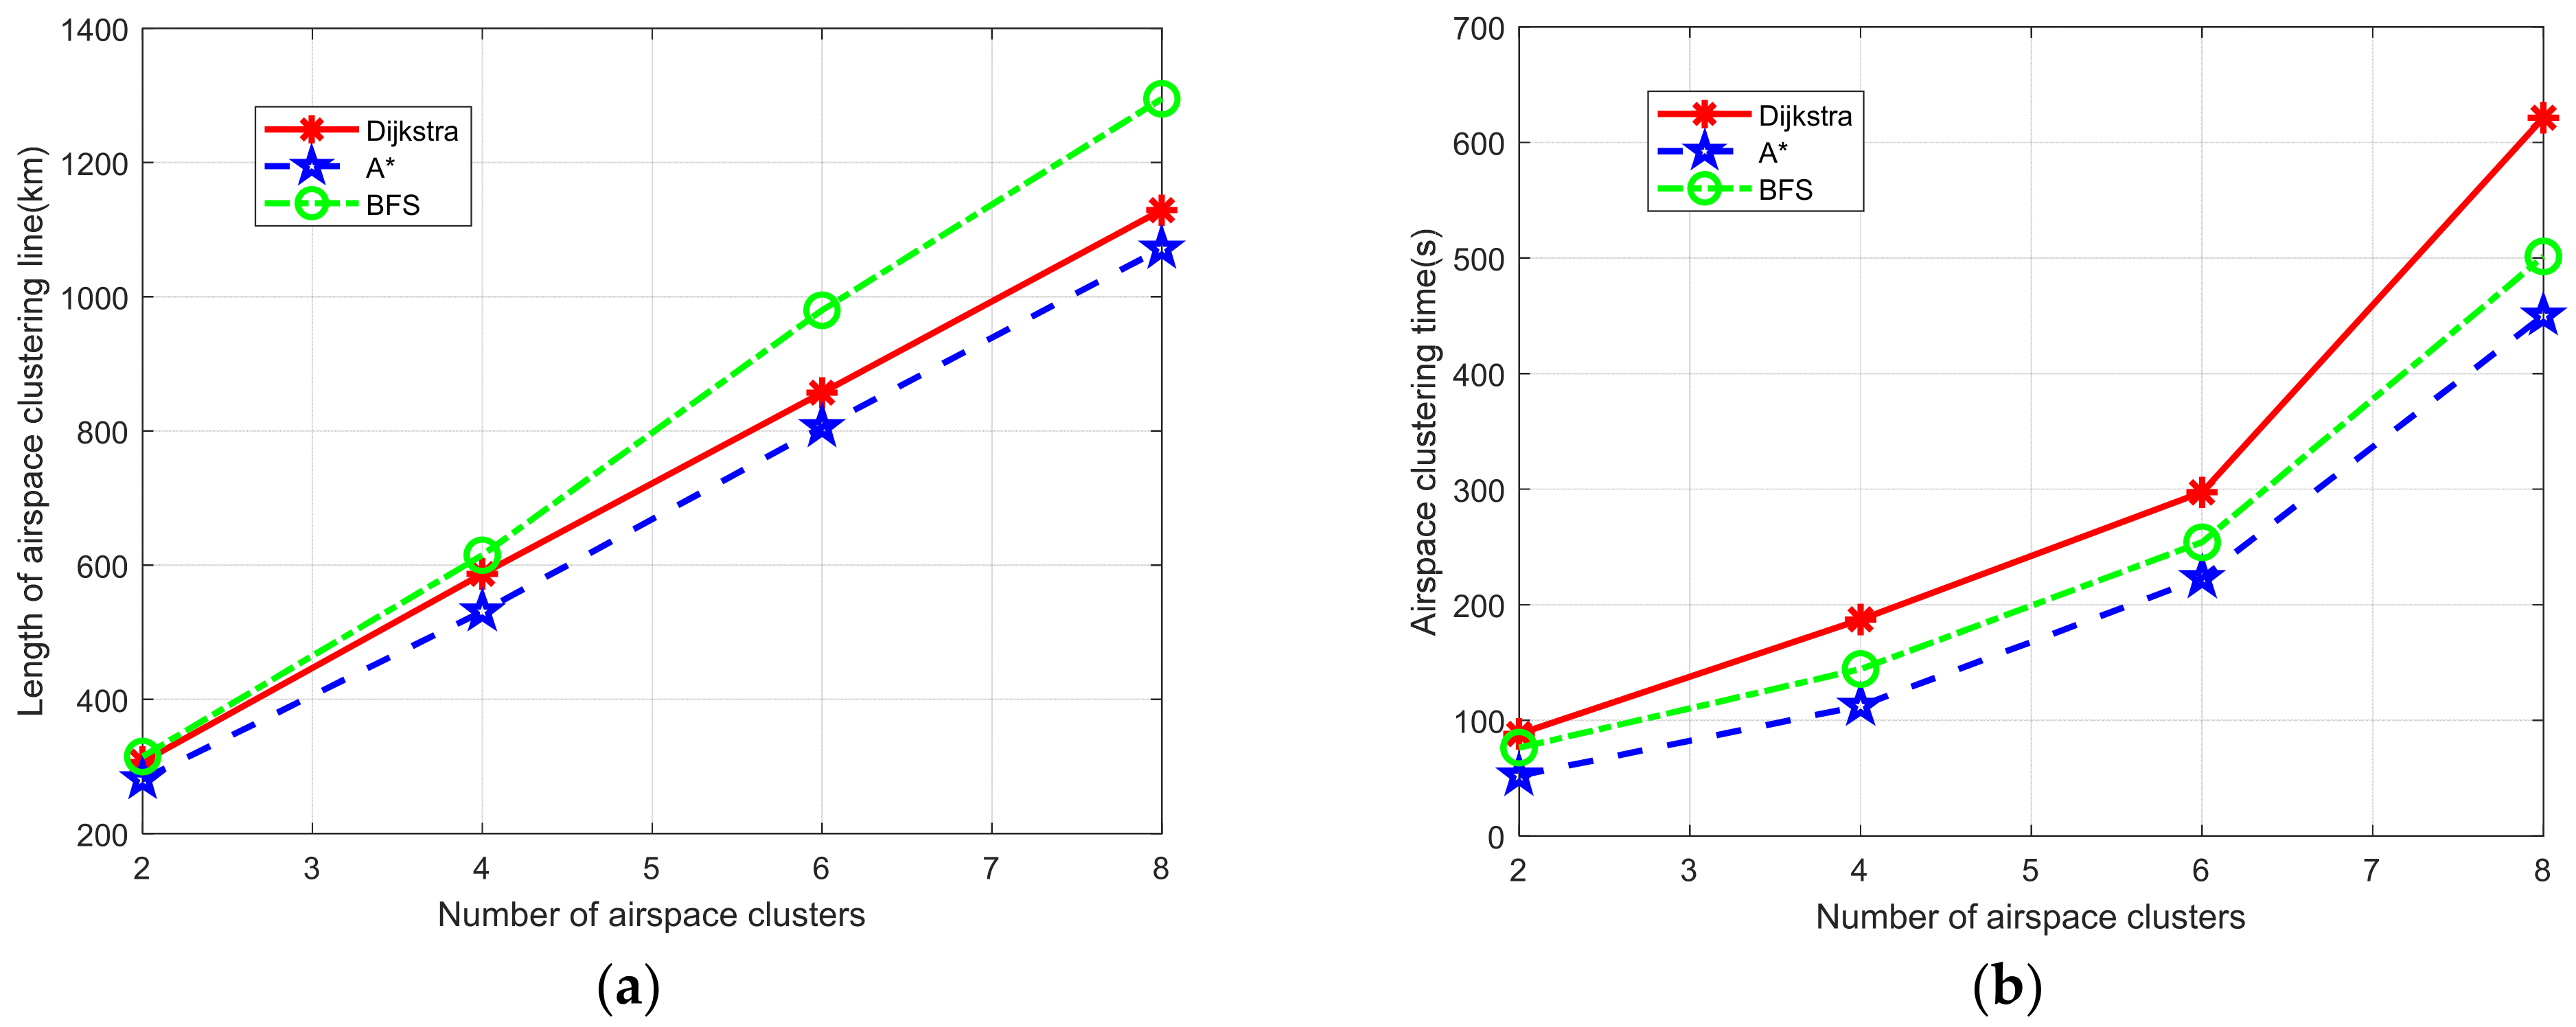
In this part of the experiment, Dijkstra algorithm, A * algorithm, and Best First Search (BFS) algorithm are selected as three mature intelligent path planning algorithms. By replacing A * algorithm, the battlefield airspace is clustered according to the steps of the large-scale battlefield airspace clustering method based on Multi-A * introduced in this paper. By comparing the results of airspace clustering, the length of airspace clustering lines, and the number of spatio-temporal clusters generated by airspace clustering lines, the advantages and disadvantages of different algorithms in achieving airspace clustering tasks are evaluated. The length of the airspace clustering line can be used as an important indicator to measure the complexity of airspace association clustering in specific projects. In general, the longer the airspace clustering line is, the more steps and links are required in the specific engineering application and algorithm implementation. Similarly, if the battlefield airspace changes, the airspace association clustering will also change accordingly. The longer the length is, the more difficult and complex the clustering line adjustment will be. The airspace clustering time is an important indicator to reflect the efficiency of airspace association clustering. The shorter the time consumed by airspace association clustering, the higher the efficiency of airspace association clustering and the higher the degree of adaptation to the issues studied in this paper.
First, set different target clustering numbers and observe the clustering results obtained under different path planning algorithms. The clustering results are shown in Figure 17, Figure 18 and Figure 19.
At the same time, record the total length (as shown in Table 5) and corresponding generation time (as shown in Table 5) of the airspace clustering lines generated under different airspace clustering numbers and different path planning algorithms, and draw them into a broken line chart for comparison and evaluation (as shown in Figure 20 and Figure 21).
By comparing the length of clustering lines, it was found that under the clustering requirements of different airspace clusters, the A * algorithm can plan shorter clustering lines to achieve the airspace clustering requirements proposed by the task. The overall task amount is smaller, and the overall task amount is sorted from small to large, as follows: A *, Dijkstra, BFS. By comparing the airspace clustering time, it was found that under the clustering requirements of different airspace clusters, the A * algorithm can spend less time to achieve the airspace clustering requirements proposed by the task, and the task completion efficiency is higher. The task completion efficiency is sorted from high to low: A *, BFS, Dijkstra. Therefore, the A * algorithm is more adaptable to the airspace grid system and more suitable for airspace clustering.

5.2. Evaluation of Airspace Clustering Effect

This part of the experiment was to explore the effect of airspace clustering on the key link of airspace management and control—airspace conflict detection. According to different clustering requirements, different target cluster numbers M will be formed. Considering that the process of airspace conflict detection and resolution is affected by multiple factors, this section also selects two key influence parameters; namely, it selects the overall number of airspace N and the safety margin distance between airspace R as experimental variables. On the premise that all parameters of airspace use are consistent (airspace use time, airspace use height, and airspace action communication frequency are consistent), the impact factors of the whole experiment mainly focus on the total number of airspace, the number of target airspace clusters and the safety margin distance.

5.2.1. Definition of Experimental Index Operator

The final experimental results and evaluation criteria are mainly quantized into the above-mentioned detection accuracy and detection speed ratio by comparing the results of traditional airspace conflict detection with the results of airspace conflict detection after airspace clustering. Through the method of controlling a single variable, a number of experimental environments are designed to conduct multiple groups of simulation experiments.
(1)
Detection accuracy ψ
The first step of the simulation is to detect all airspace within the wide area action area through the traditional airspace conflict detection method and record the detection results: the number of conflict airspace A and the conflict detection time T . After the airspace clustering is completed, the airspace conflict detection method is used to detect the airspace conflict in each airspace cluster after the airspace clustering. Finally, the detection result a 11 , a 12 , a 13 , , a 1 k in each airspace cluster is summarized to get the final airspace conflict detection result a 1 = i = 1 k a 1 i . Define the accuracy rate of the evaluation index detection results as the ratio of the difference between the number of detection results after using the airspace clustering method and the number of conflict results obtained by the traditional airspace conflict detection method and the number of conflict results obtained by the traditional airspace conflict detection method to reflect the accuracy of the airspace conflict detection results after airspace clustering:
ψ = i = 1 k a j i A A
(2)
Detection speed ratio υ
After the airspace clustering is completed, use the airspace conflict detection method to detect the airspace conflict in each airspace cluster, and record the time t j consumed for complete airspace conflict detection. Define the evaluation index detection speed ratio as the ratio of the time consumed after using the airspace clustering method and the time consumed by the traditional airspace conflict detection method to reflect the change in the detection speed of airspace conflict detection after airspace clustering:
υ = t j T

5.2.2. Experimental Results and Analysis

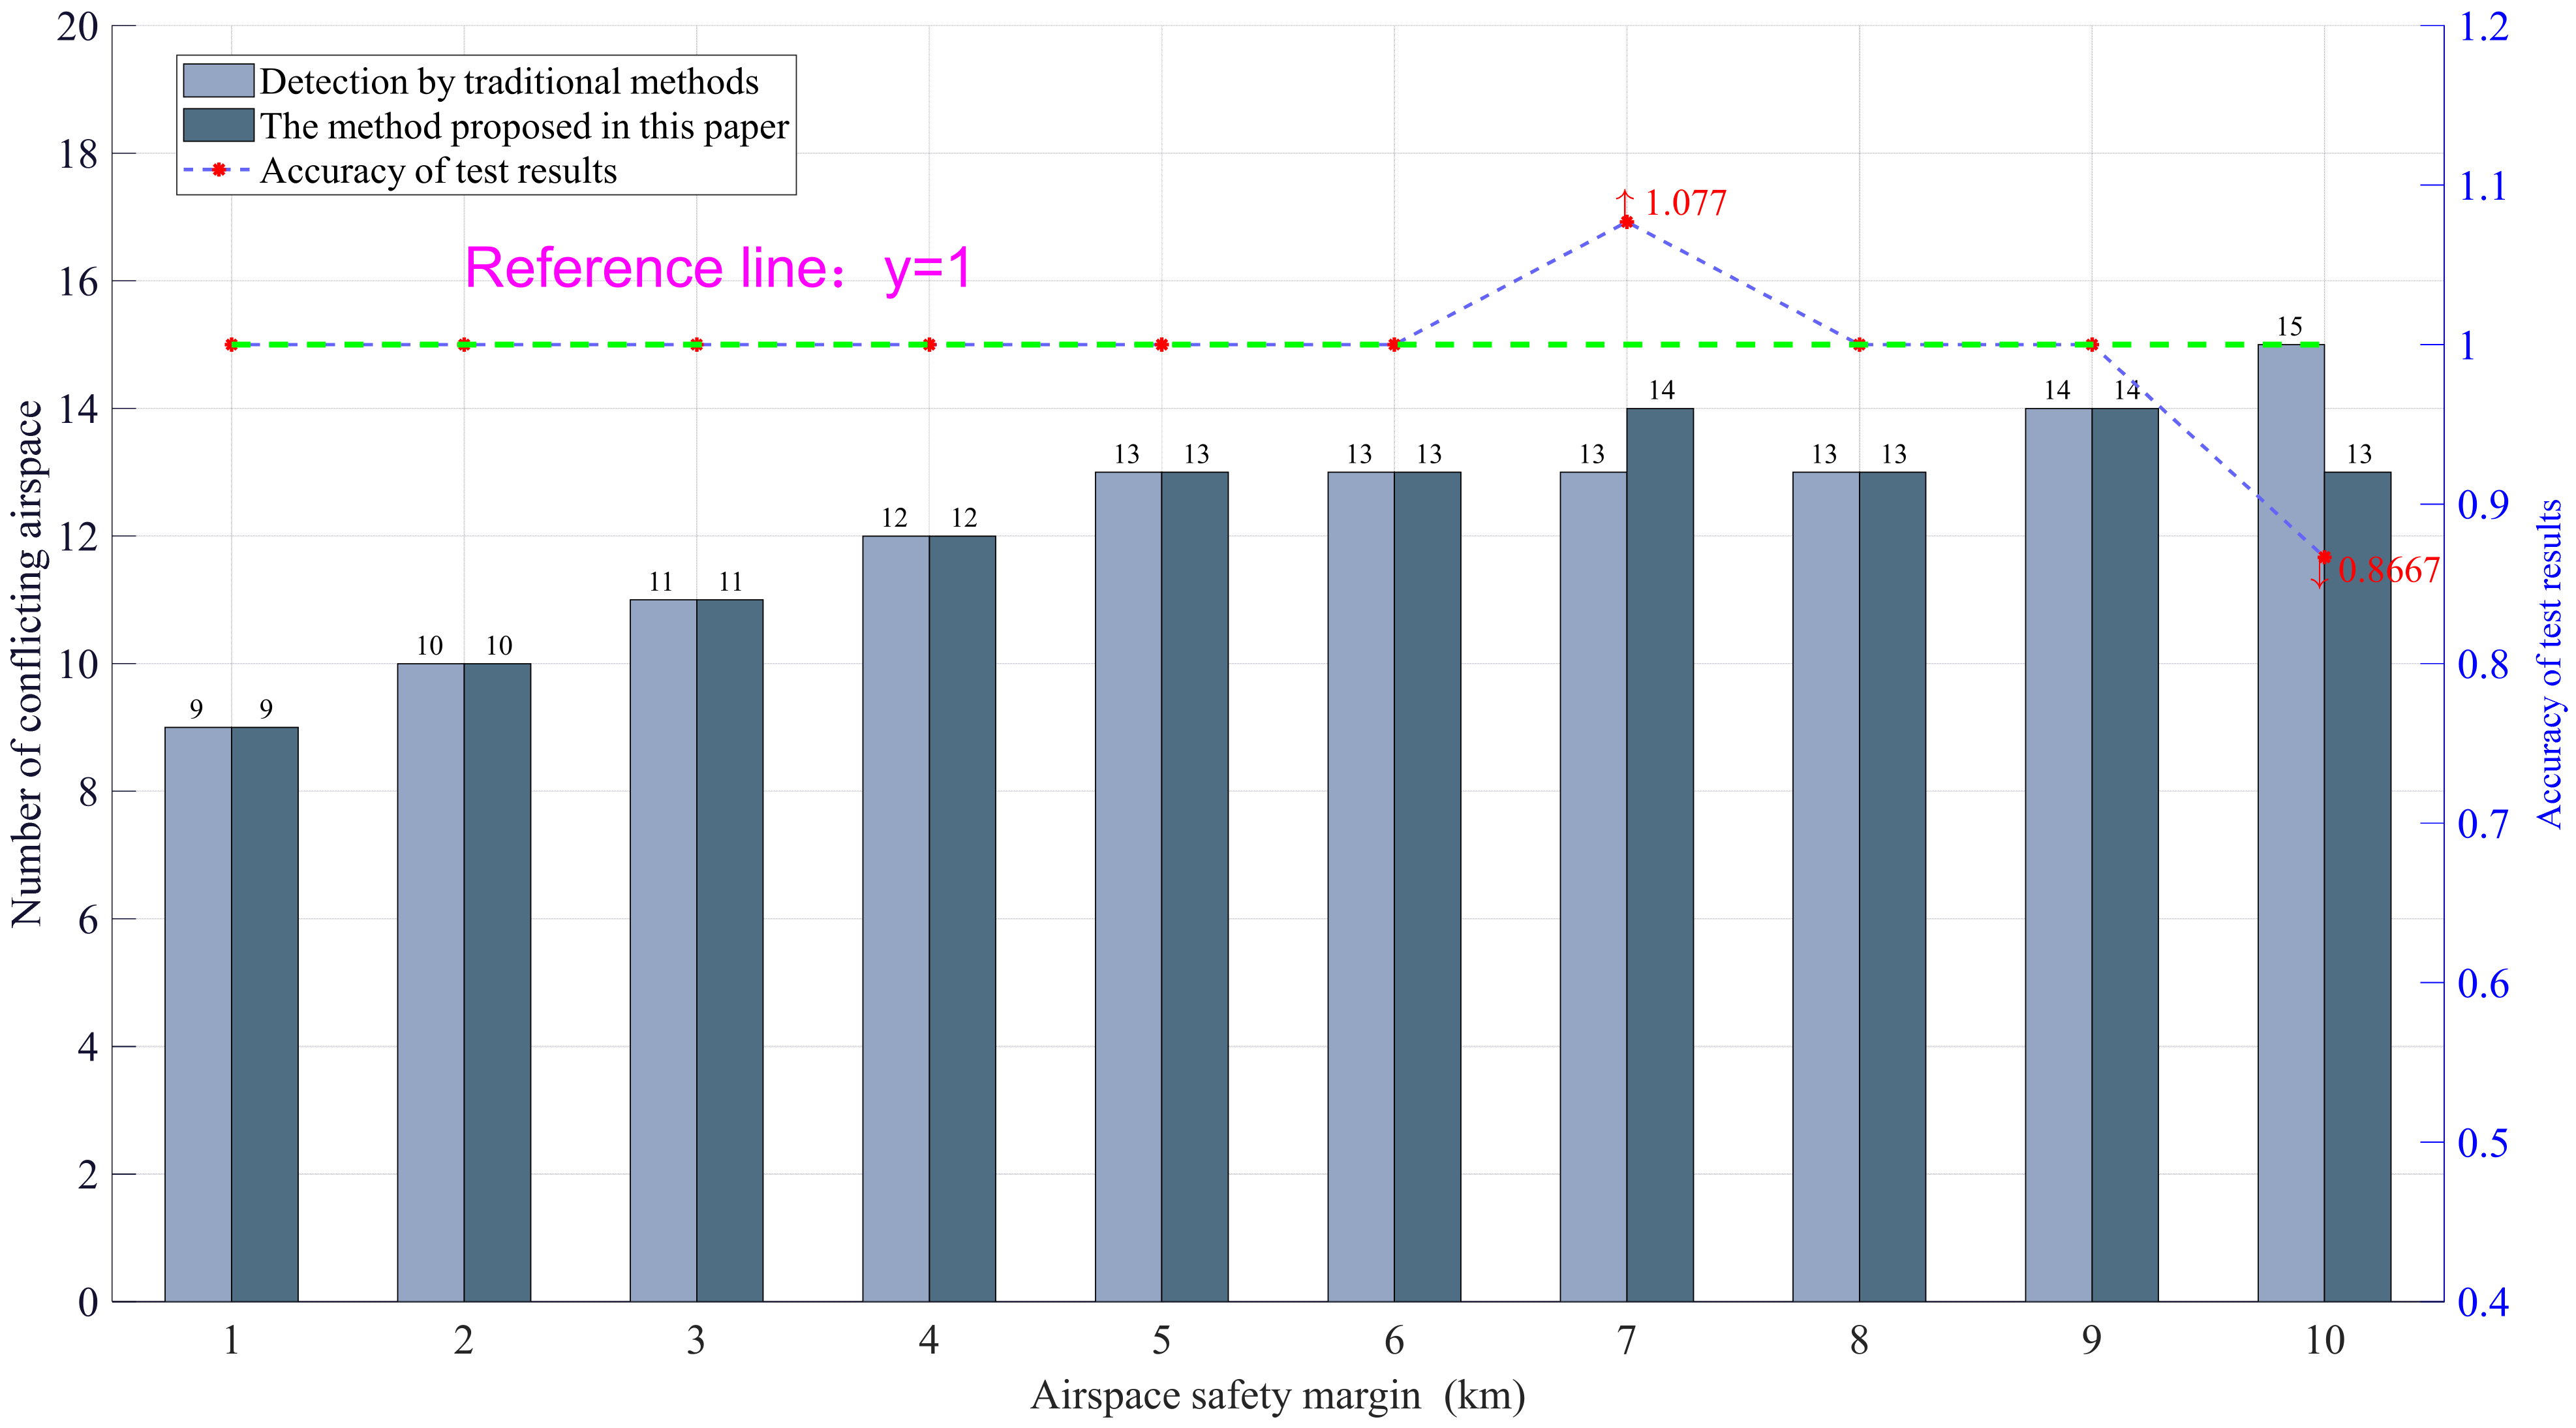
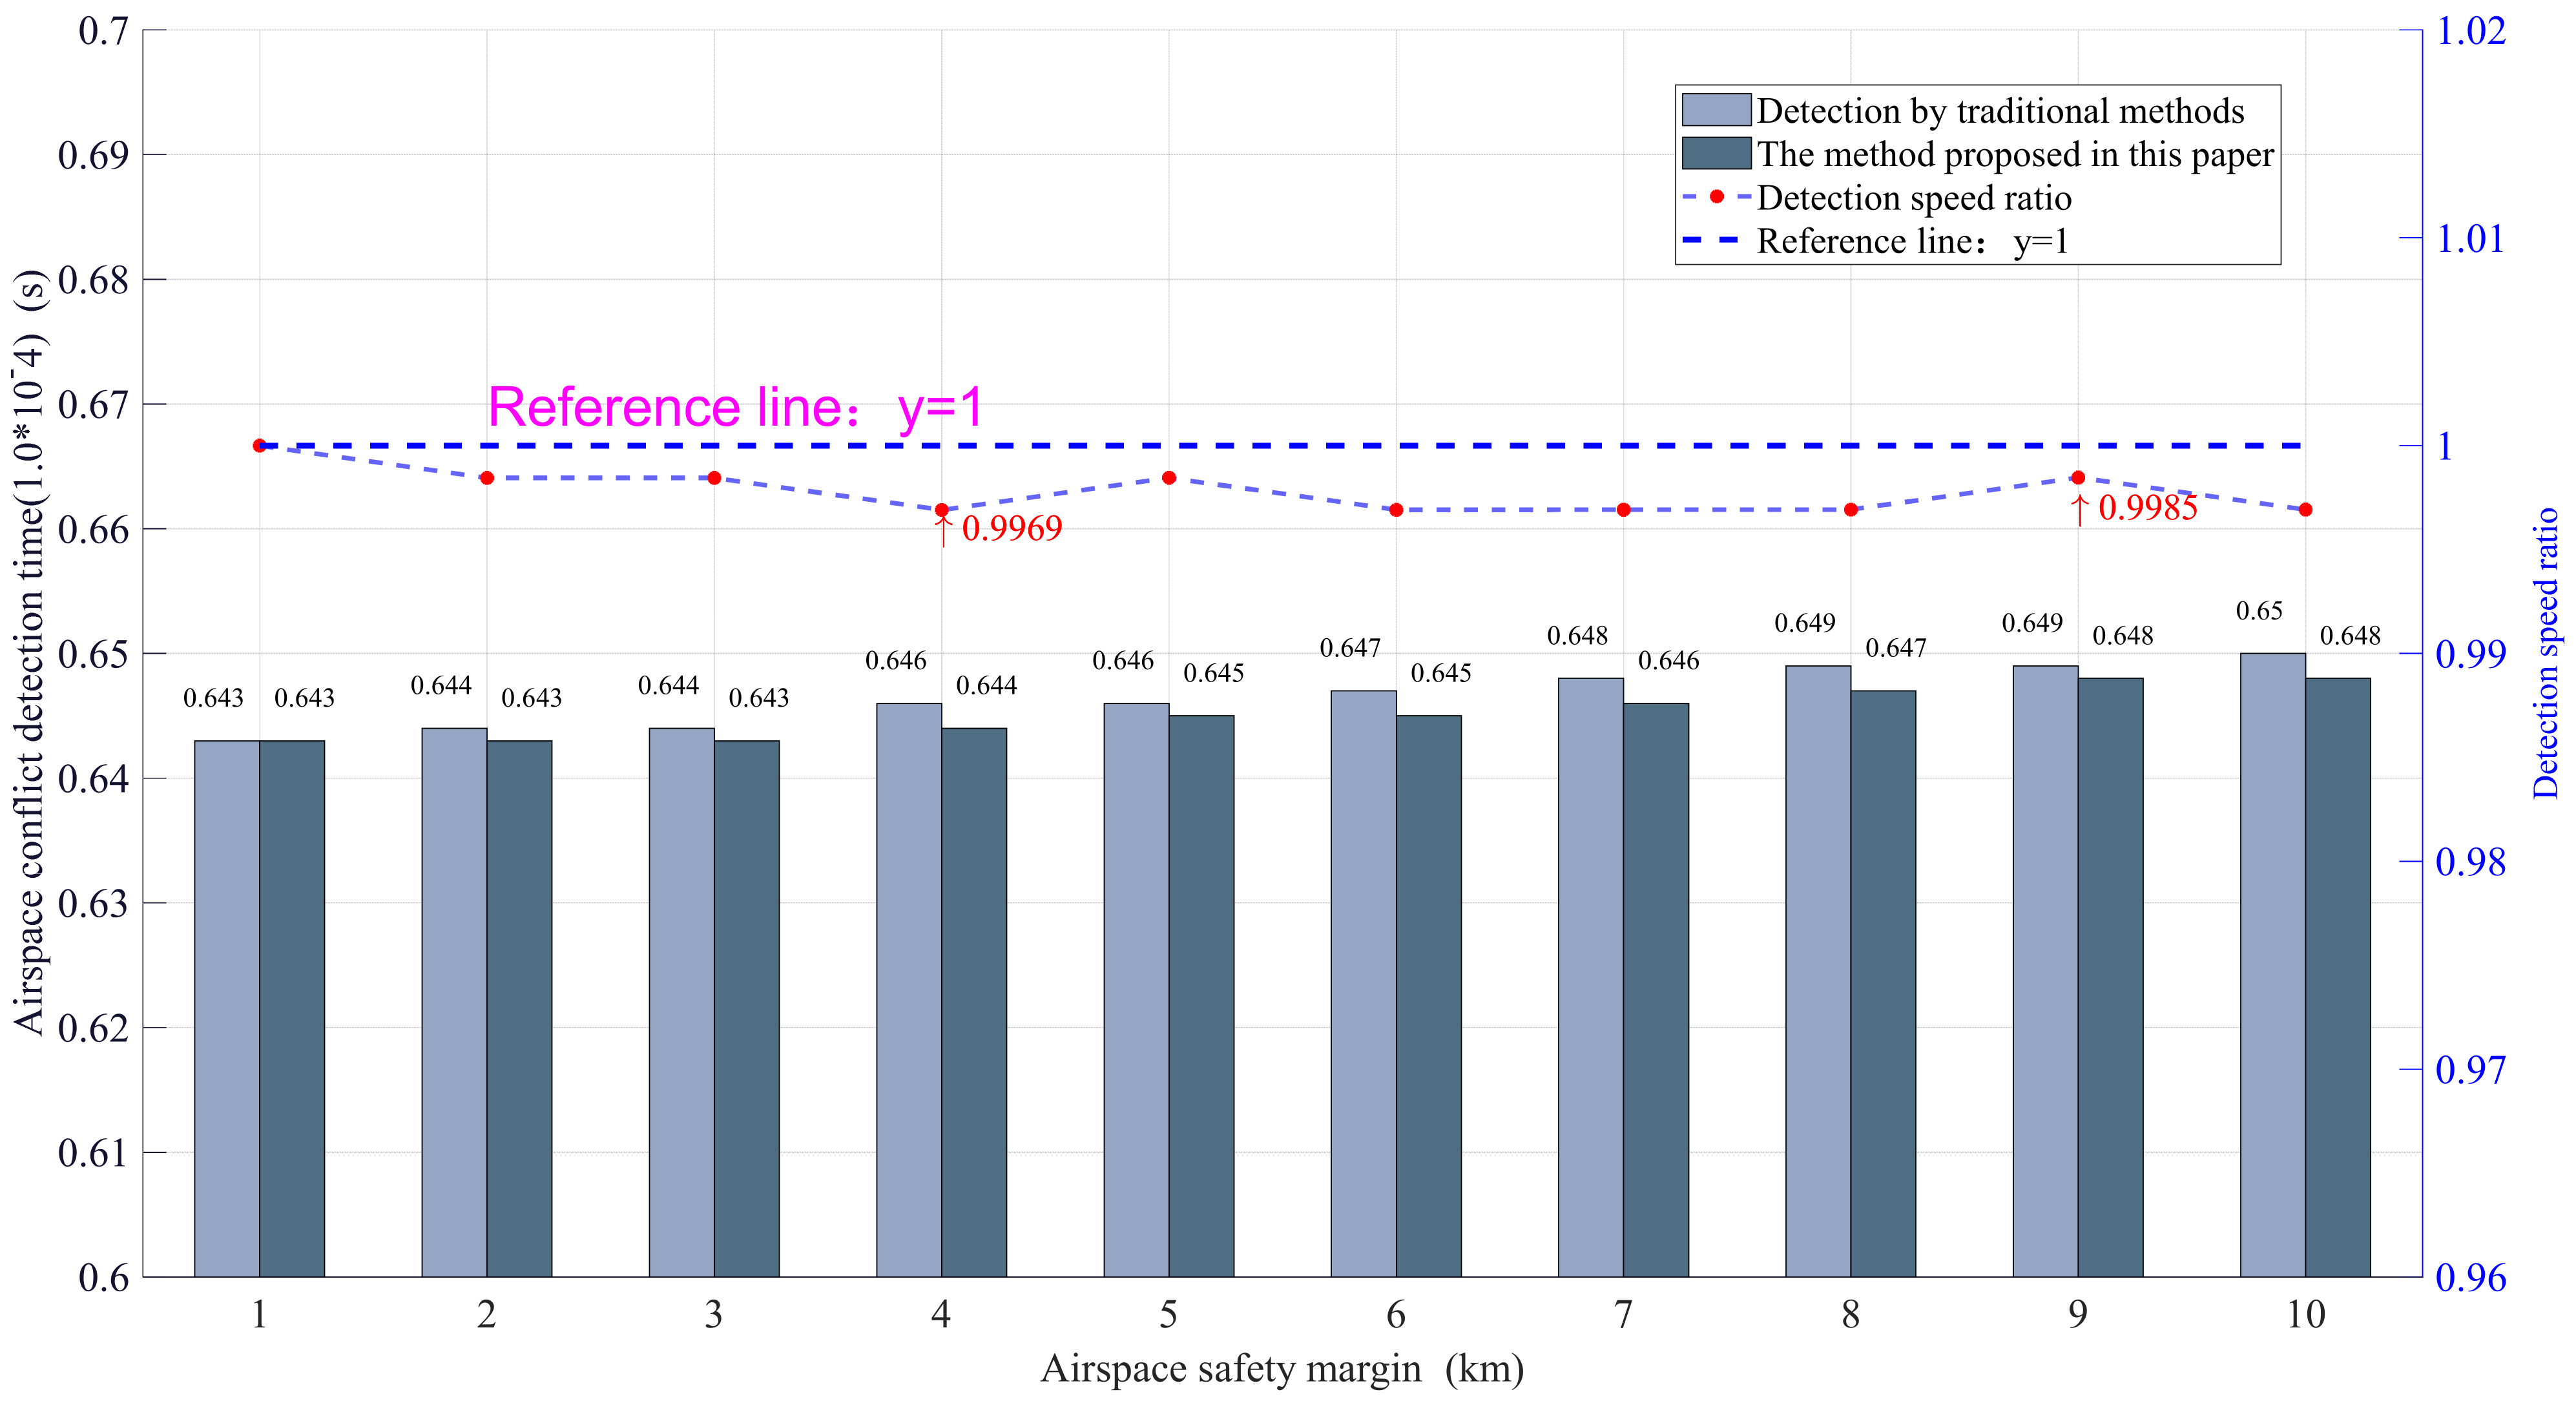
Simulation 1: Take the airspace parameter planning set in Section 4.1 as the task scenario, obtain the initial parameter airspace total quantity N = 15 of experimental simulation 1, and set the airspace target cluster quantity M = 6 . Observe the change of airspace conflict detection results by changing the airspace safety margin distance. The experimental results are shown in the Figure 21 and Figure 22.
From the experimental results of simulation 1, it can be found that in the whole experiment process, the safety margin distance between airspace has been adjusted for 10 times, and the corresponding detection result parameters have been adjusted for each time. In terms of the accuracy of detection results, 8 of the 10 detection results are accurate, of which two detection results have errors; the error values are 1 and 2. It shows that the accuracy of detection results of airspace conflict detection based on airspace clustering is different from that of traditional wide area airspace conflict detection. The main reason is that there may be some fuzzy disputed airspace near the edge cluster lines, which leads to the overall detection of multiple detections or missing detections. In terms of detection speed ratio, the speed obtained from simulation 1 is always lower than the same speed reference line ( y = 1 ) set in advance since the first detection, and the detection efficiency is improved by 1.6–10.9%. It shows that clustering the whole task airspace can improve the speed of conflict detection and improve the efficiency of airspace conflict detection.
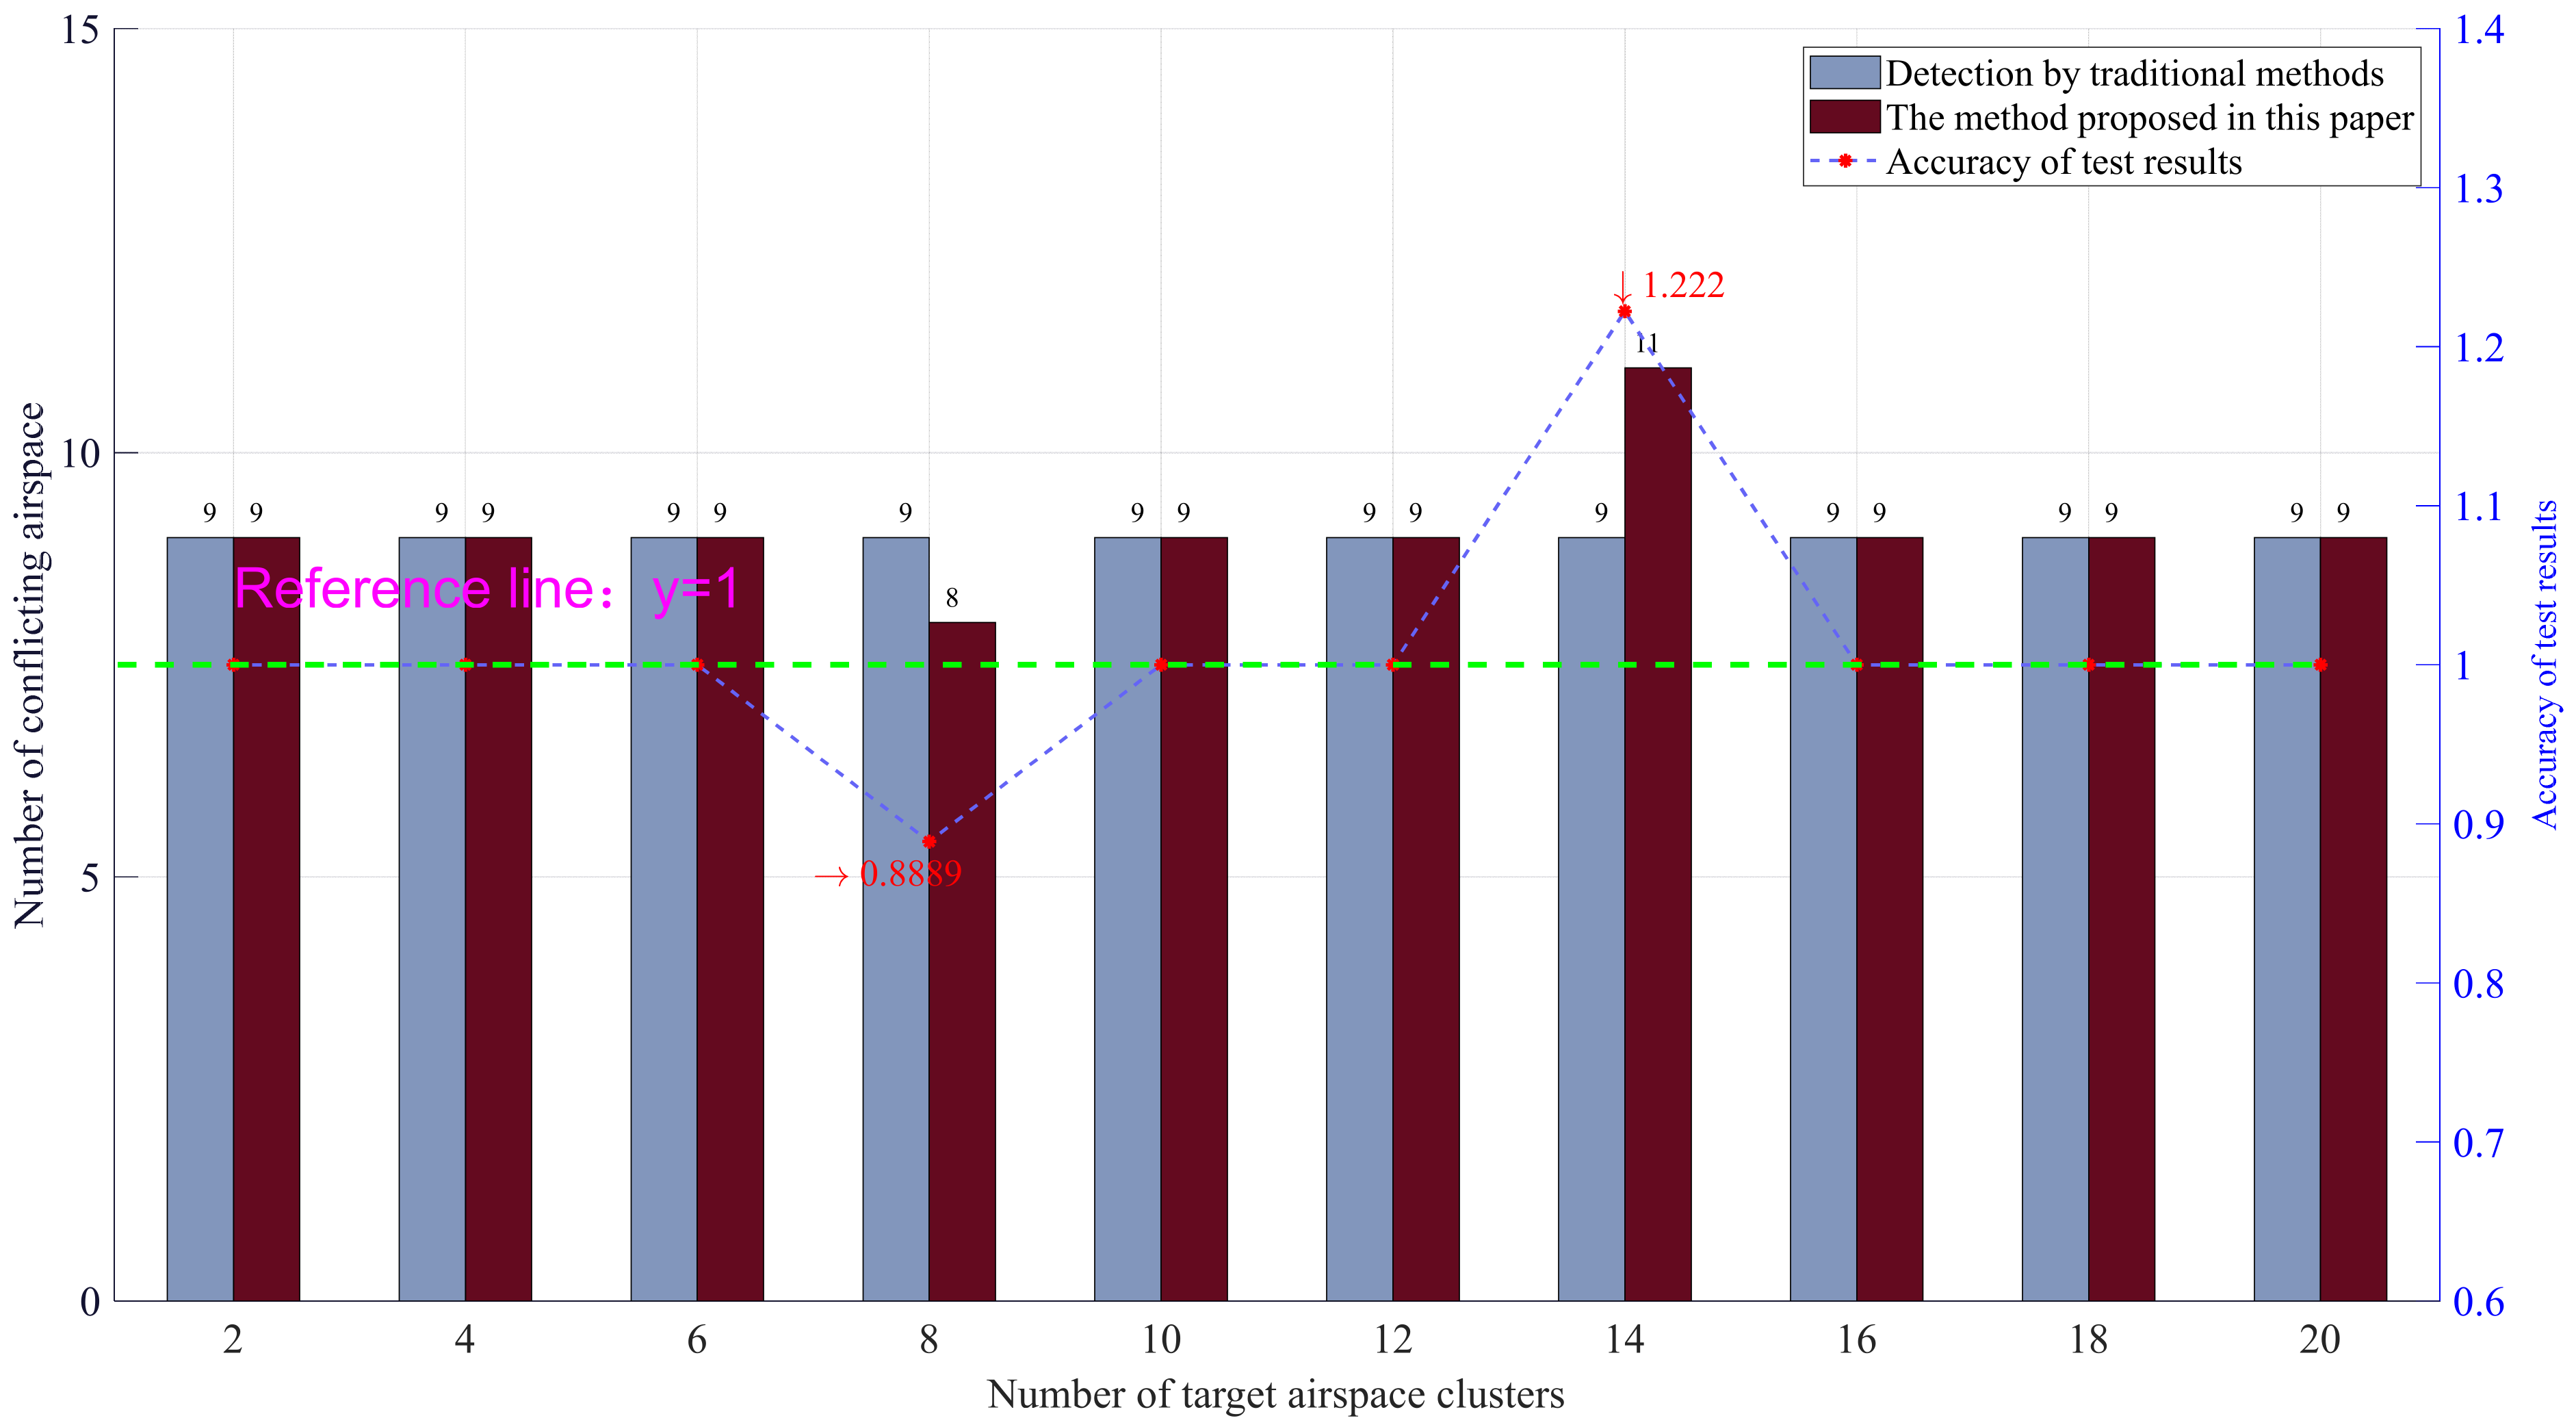
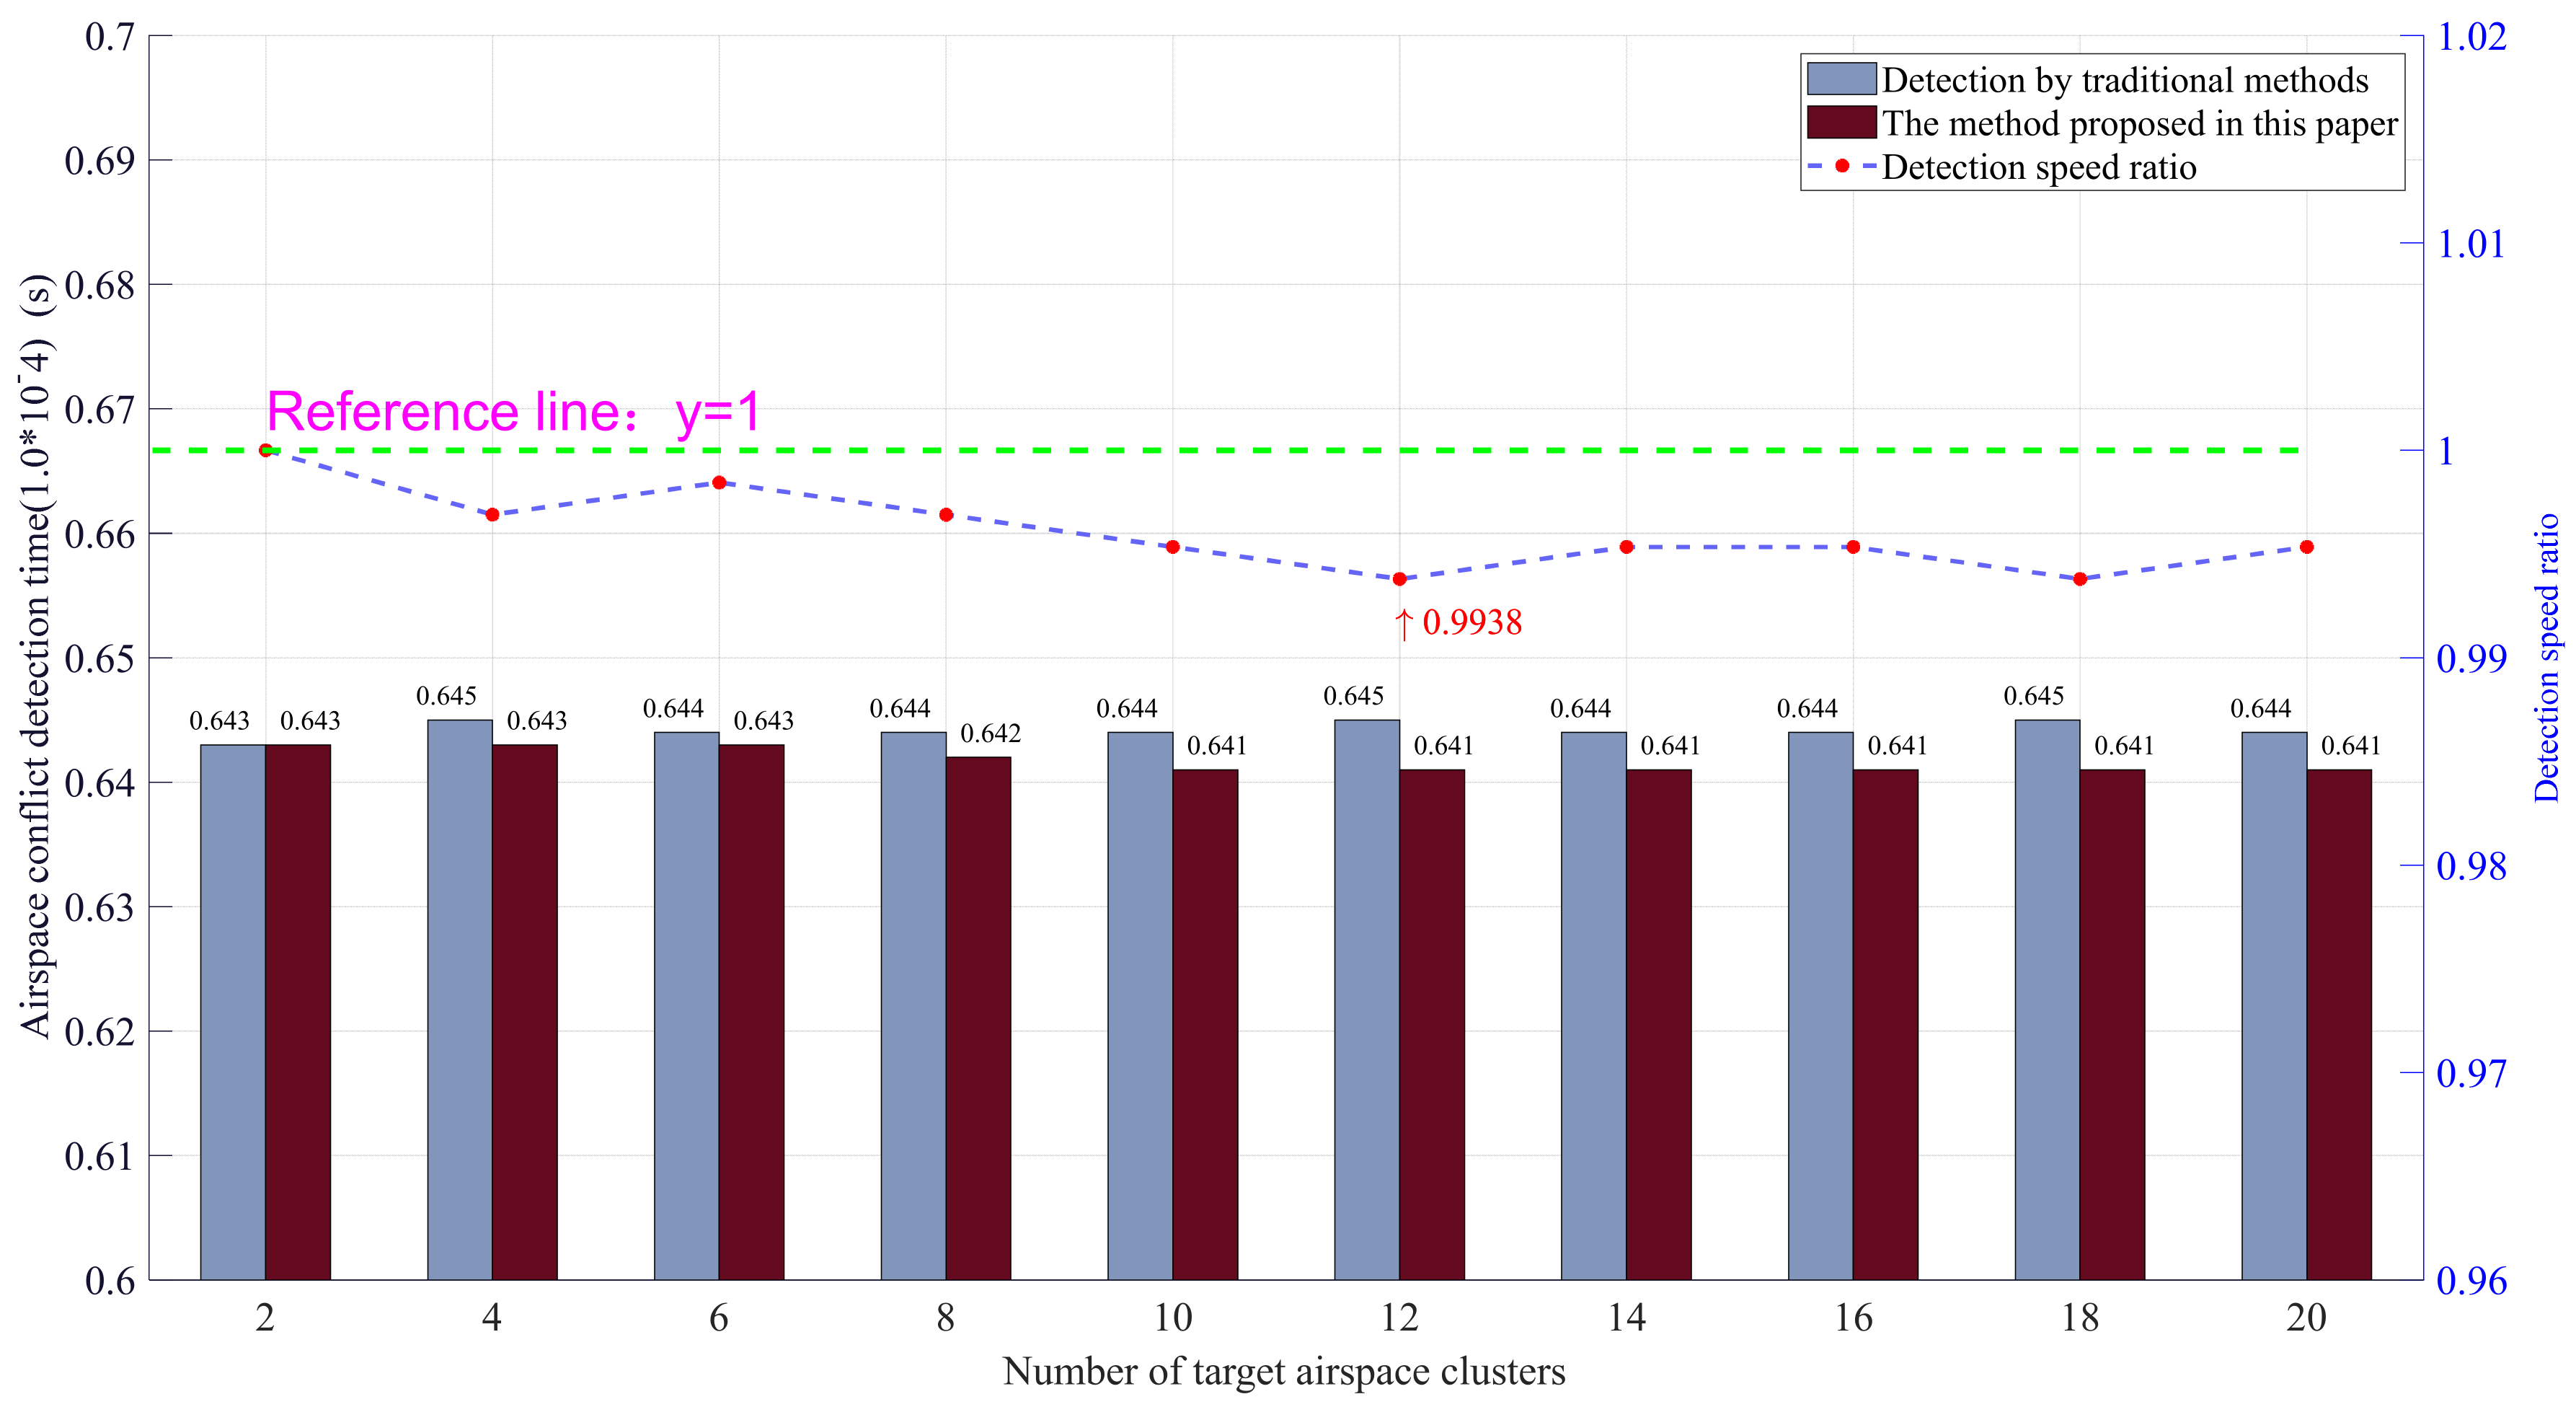
Simulation 2: Keep the total number N of airspace and the safety margin distance R between airspace unchanged, adjust the number M of target airspace clusters, detect airspace conflicts in the whole task airspace, and obtain the corresponding result parameters. After clustering, airspace conflict detection is carried out in each cluster according to the same process, and new result parameters are obtained. After comparing the two result parameters, the experimental simulation results are shown in the Figure 23 and Figure 24.
From the experimental results of simulation 2, it can be found that the number of target airspace clusters has been adjusted for 10 times in the whole experiment process, and the corresponding detection result parameters have been adjusted for each time. In terms of the accuracy of detection results, 8 of the 10 detection results are accurate, of which two detection results have errors; the error values are 2 and 1. It shows that the accuracy of detection results of airspace conflict detection based on airspace clustering is different from that of traditional wide area airspace conflict detection. The main reason is that there may be some fuzzy disputed airspace near the edge cluster lines, which leads to the overall detection of multiple detections or missing detections. In terms of detection speed ratio, the speed obtained from simulation 2 is always lower than the same speed reference line ( y = 1 ) set in advance since the first detection, and the detection efficiency is improved by 1.6–6.2%. It shows that the efficiency of conflict detection speed is improved by clustering the whole task airspace. At the same time, it is observed that with the increase of the number of target airspace clusters, the time consumed for airspace conflict detection based on airspace clustering is gradually reduced, and finally tends to a fixed constant that does not change. The factor of the change in the exploration constraint detection time should be the number of airspace. Clustering is carried out in a limited number of airspace. When the number of airspace clusters increases to a certain level, due to the limited number of airspace clusters, the airspace clustering has reached saturation, and the clustering results will no longer increase with the set number of airspace clusters, so the detection time will not change.
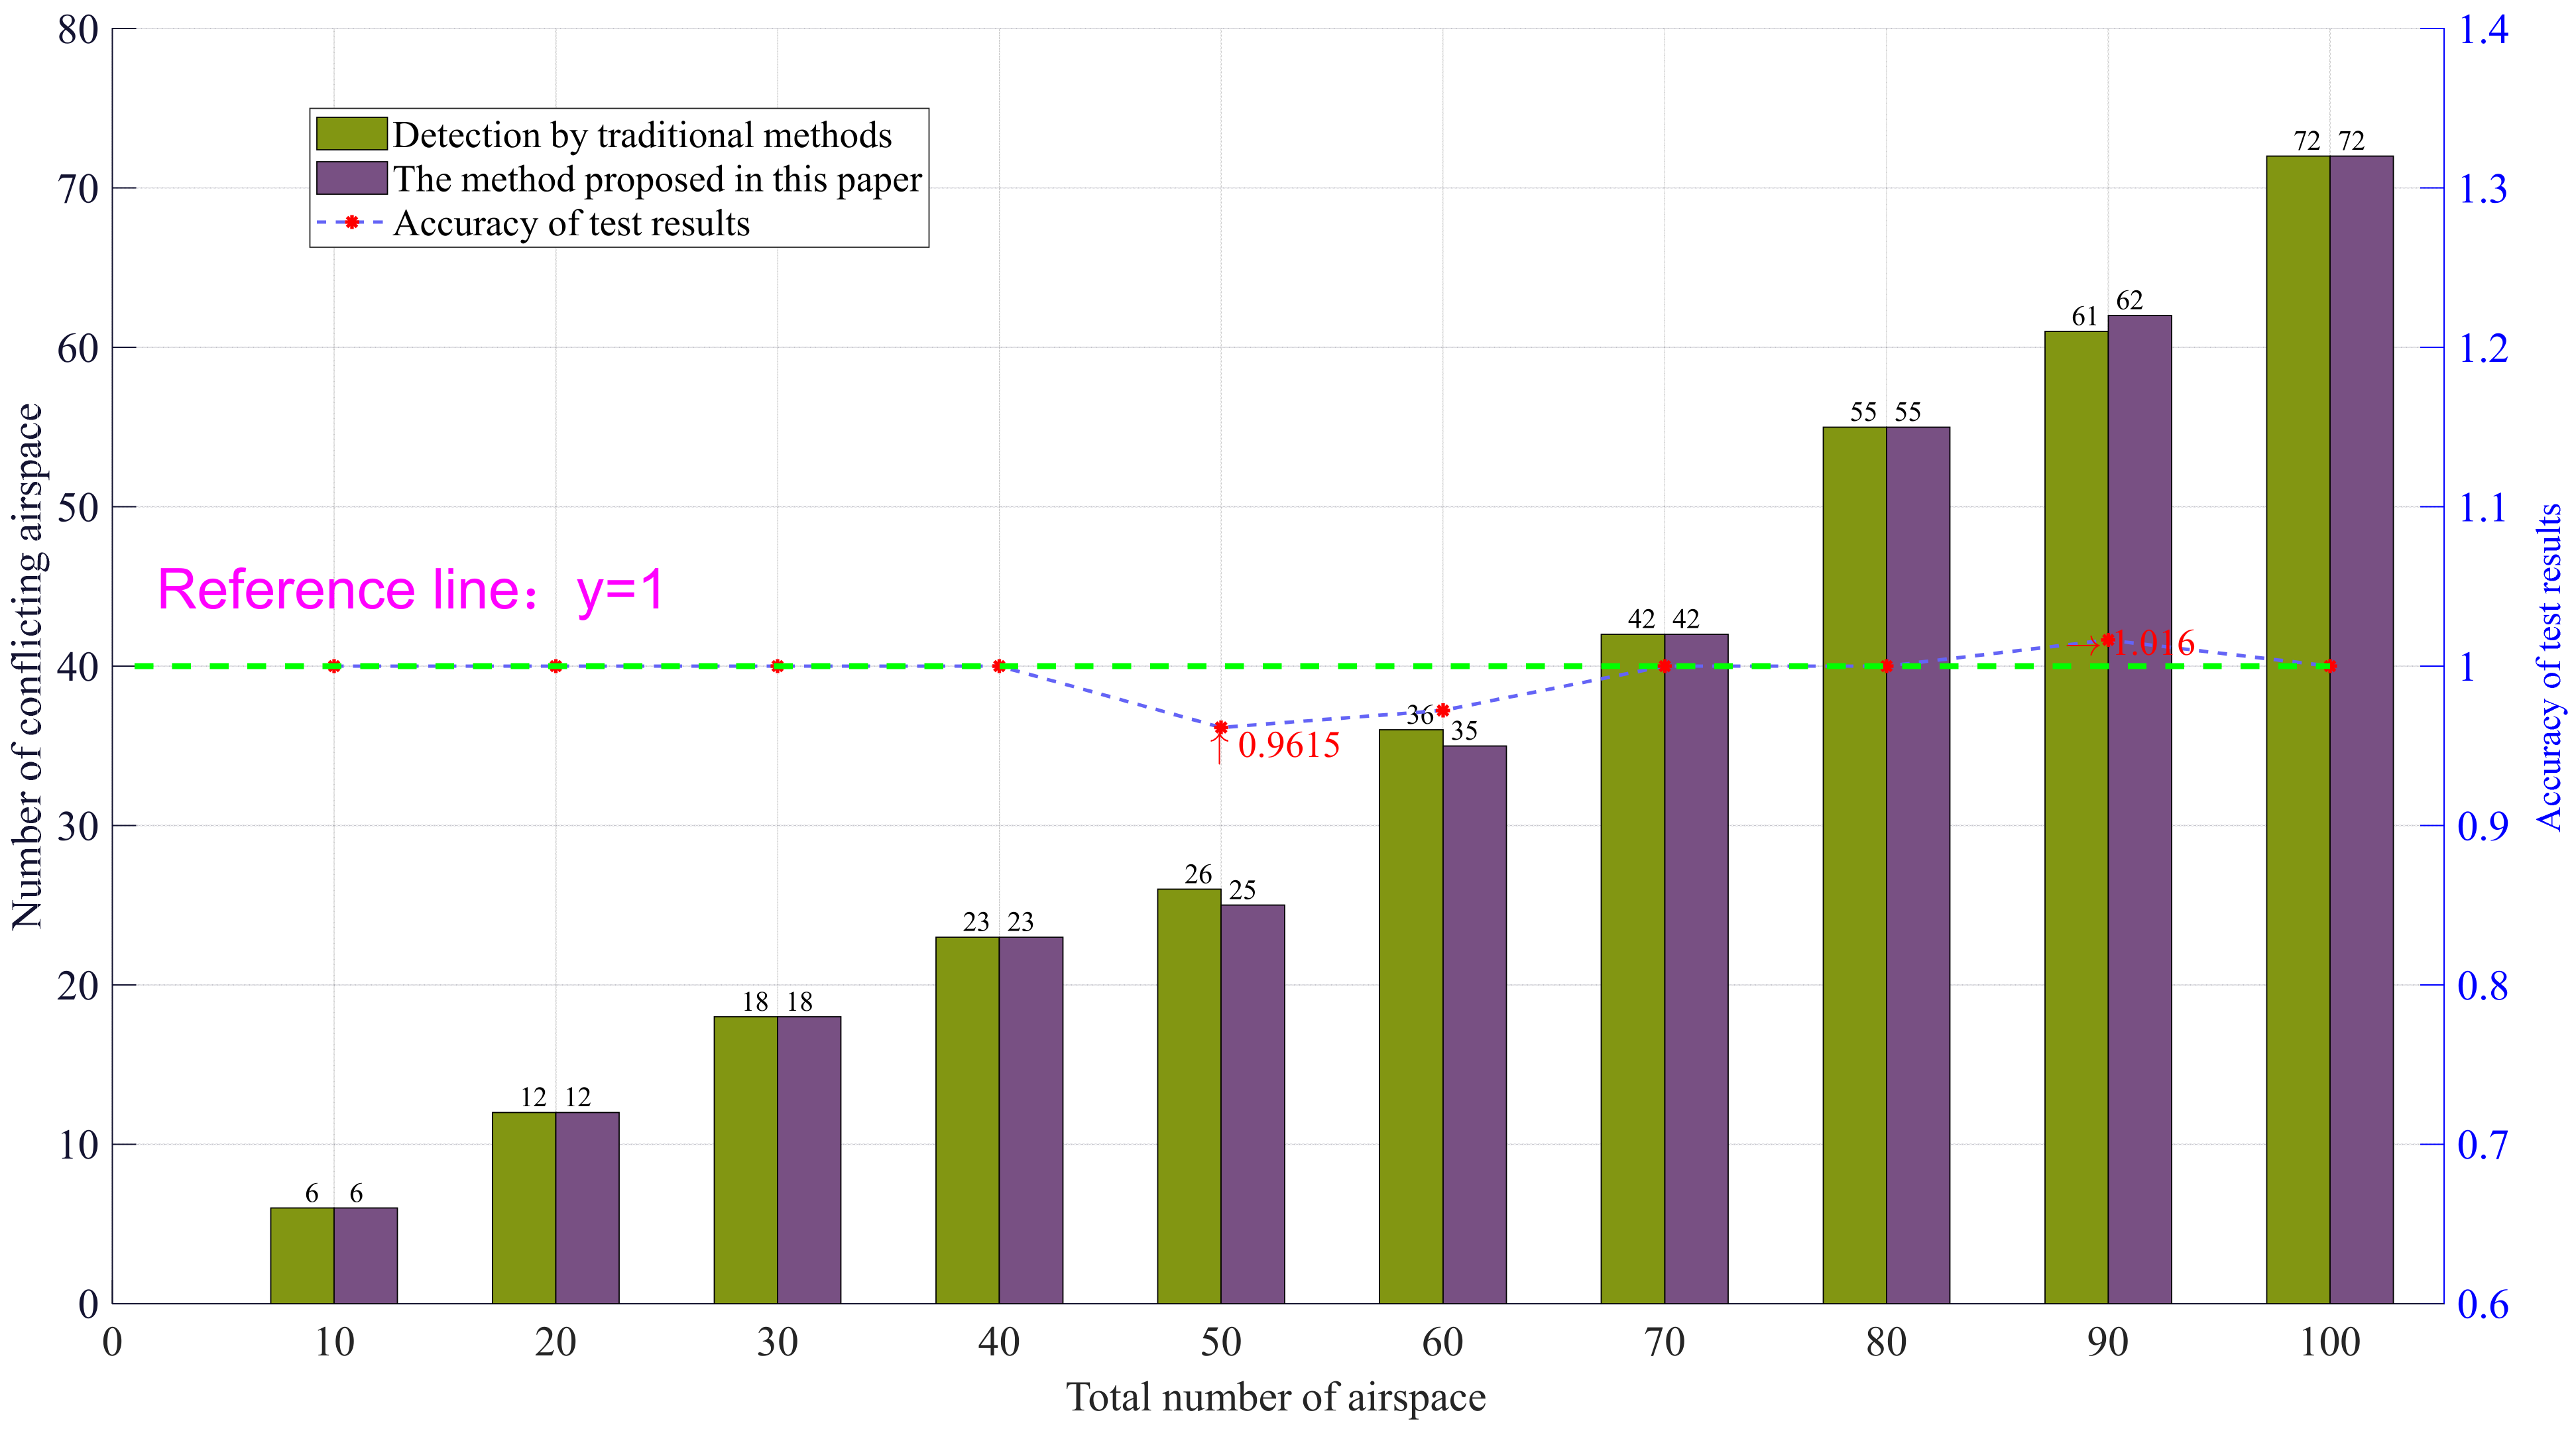
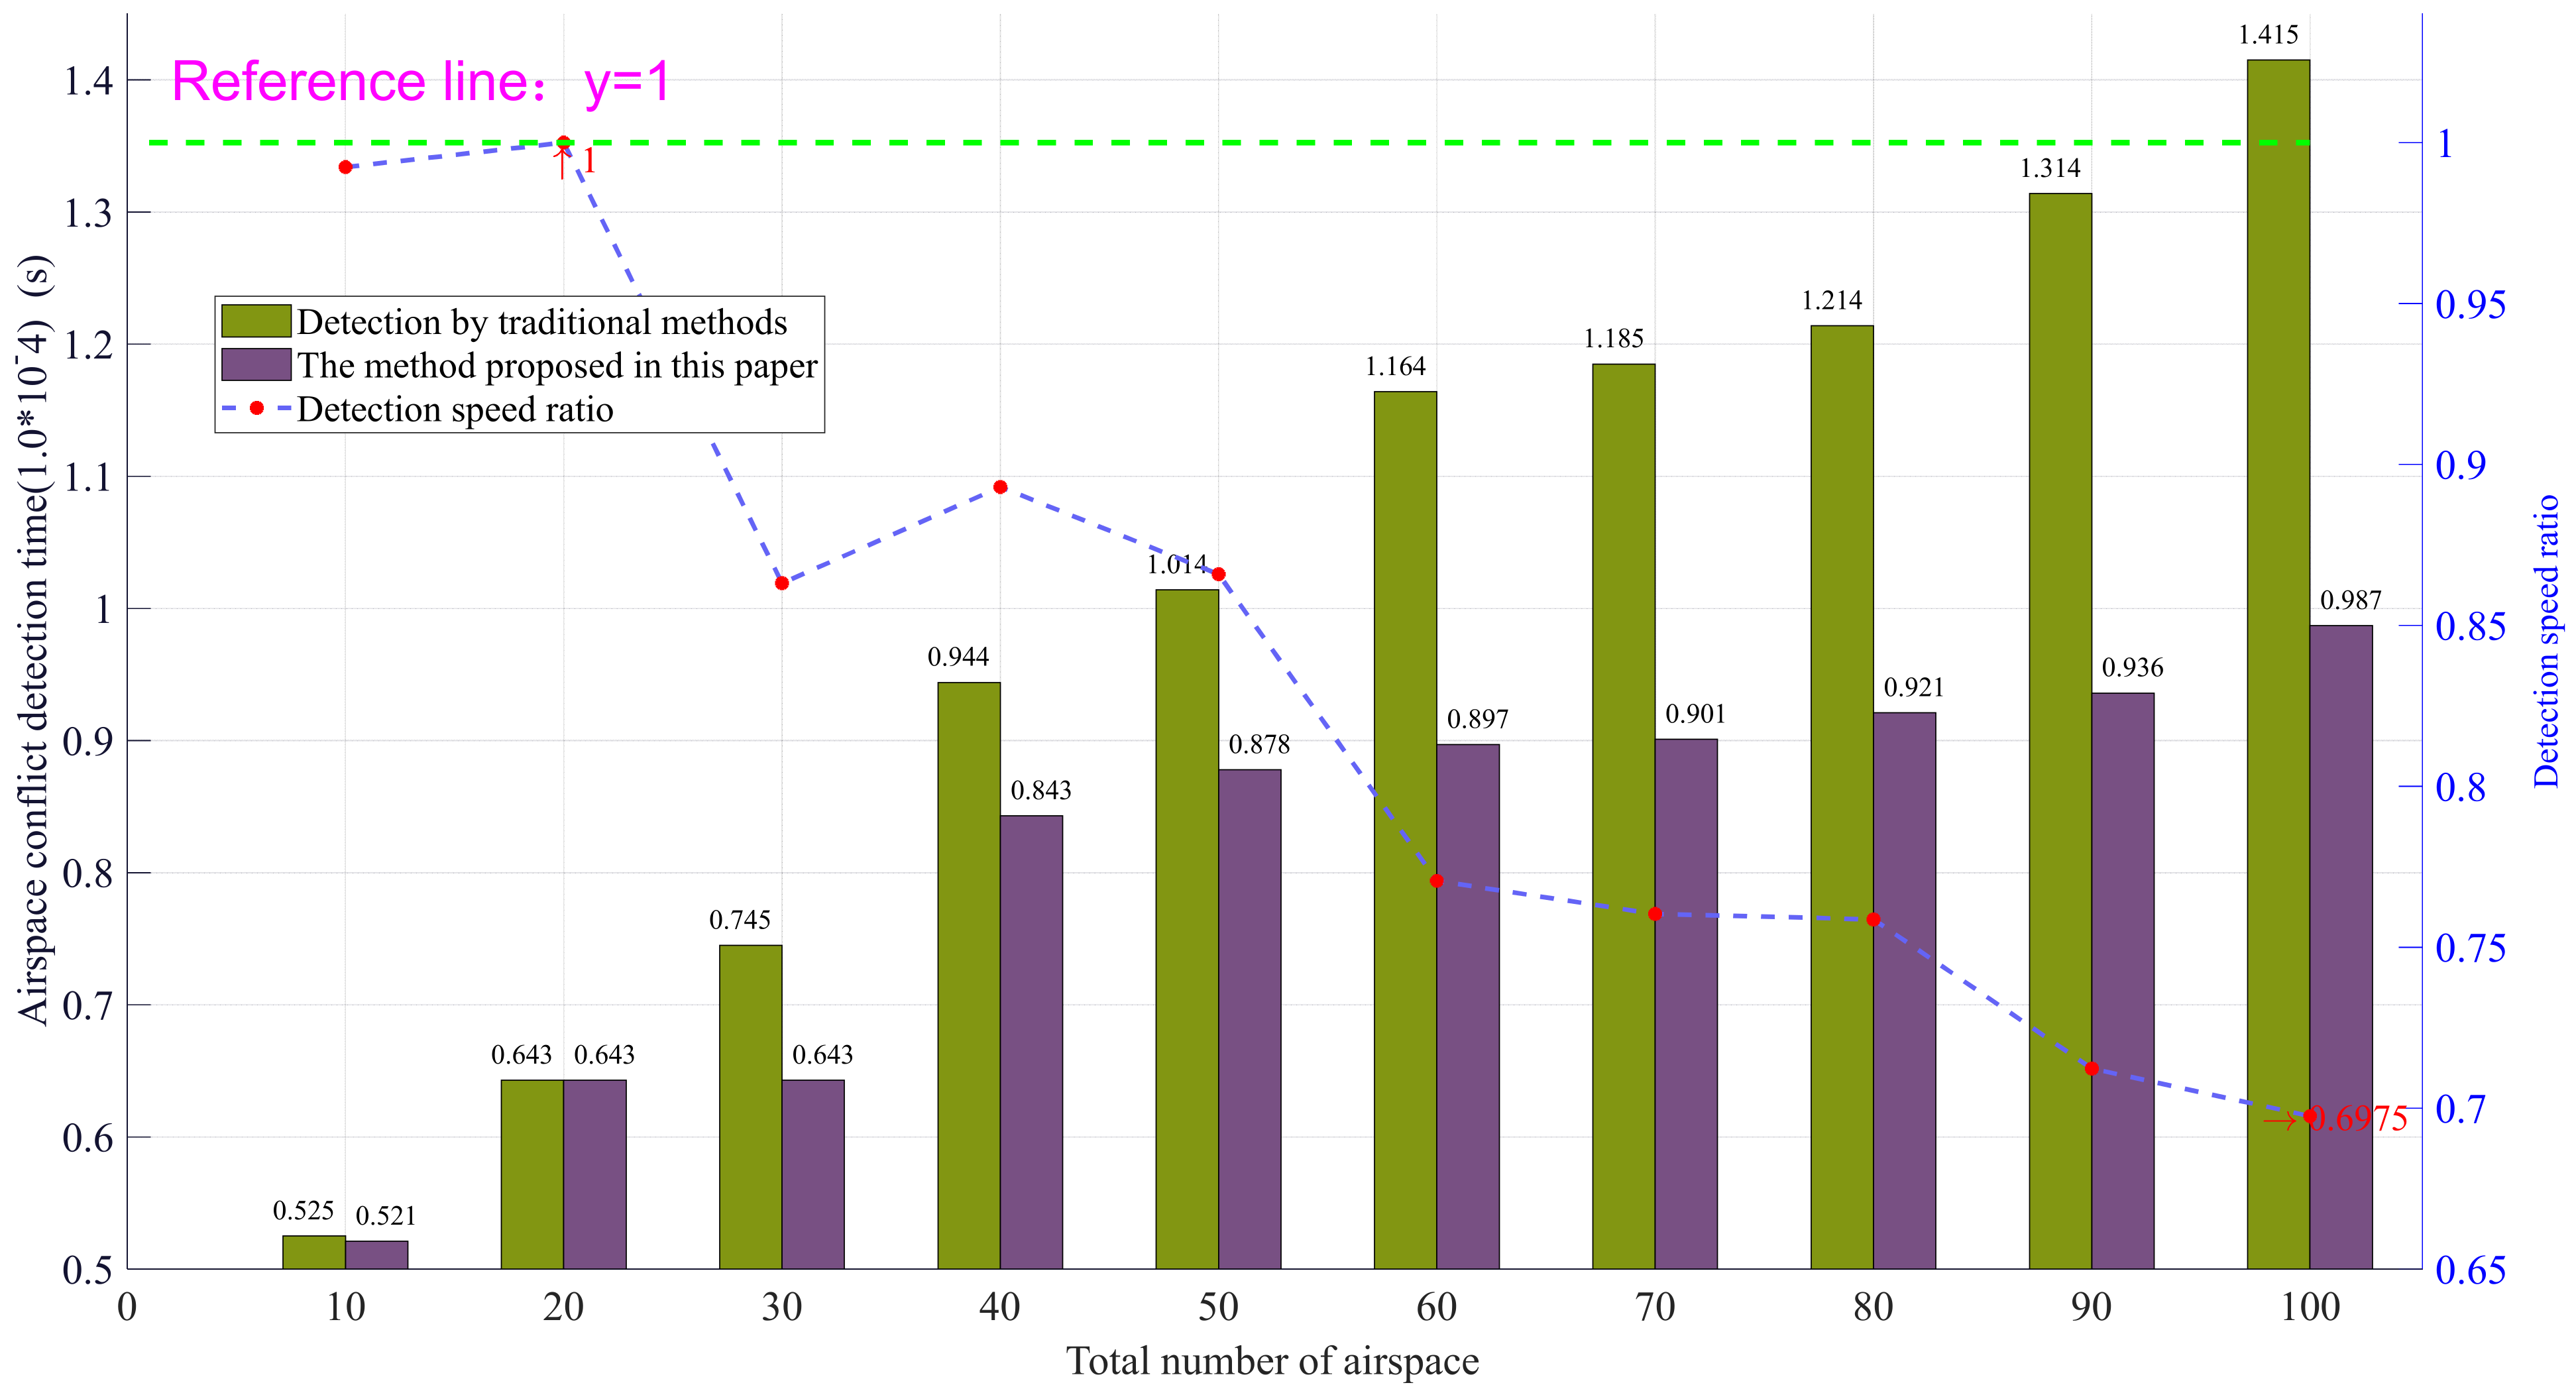
Simulation 3: Keep the number of target airspace clusters M and the safety margin distance R between airspace unchanged, adjust the total number N of airspace, and detect airspace conflicts in the whole task airspace to obtain the corresponding result parameters. After clustering, airspace conflict detection is carried out in each cluster according to the same process, and new result parameters are obtained. After comparing the two result parameters, the experimental simulation results are shown in the Figure 25 and Figure 26.
From the experimental results of simulation 3, it can be found that in the whole experiment process, the number of mission airspace has been adjusted for 10 times, and the corresponding detection result parameters have been adjusted for each time. In terms of the accuracy rate of detection results, 8 of the 10 detection results are accurate, of which two detection results have errors; the error values are 1 and 1. Although there are differences in the accuracy of detection results between airspace conflict detection based on airspace clustering and traditional airspace conflict detection based on wide area, it can be found that with the increase in the number of airspace, the accuracy of the method proposed in this paper has been gradually improved and the error rate has been continuously reduced. In terms of detection speed ratio, the speed obtained from simulation 3 is always lower than the same speed reference line ( y = 1 ) set in advance, except that the values in the broken line chart are the same in the second detection. The detection efficiency is increased by 1.76–30.25%. This shows that the efficiency of conflict detection speed is improved by clustering the whole task airspace. It is also observed that with the increase of the number of airspace, airspace conflict detection based on airspace clustering saves more time compared with traditional detection methods, and the speed difference is greater, which also reflects that airspace clustering is a pre preparation work when facing the challenge of large-scale airspace tasks. It has great application potential and great significance.

6. Conclusions

In this paper, with the help of technical tools such as airspace reference grid generation system, image processing and path planning algorithm, a method of pre-clustering task airspace based on position correlation is proposed under the condition of future large-scale airspace joint operations. This method innovatively meshes the battlefield airspace, abstracts the mission airspace into battlefield obstacles while grid characterizing, and uses the characteristics of traditional A * algorithm, such as high efficiency, fast speed, high integration with grid system, and good fit, to adjust and improve the Multi A * algorithm to multiple “start point- end point” and synchronous path planning. In the experimental simulation part, the A * algorithm is first verified to be more suitable for solving the problem in this paper by comparison, and then two core indicators (namely, the accuracy rate of detection results and the ratio of detection speed) are set for the accuracy and efficiency that are the most important aspects of traditional airspace conflict detection, aiming to explore the stability and sustainability of airspace clustering method for airspace conflict detection. The main conclusions are as follows:
(1)
The accuracy of detection results of airspace conflict detection based on airspace clustering is different from that of traditional wide area airspace conflict detection. The main reason is that there are some fuzzy disputes near the edge cluster lines in the airspace, which may lead to multiple or missing detections in the overall detection due to unclear clustering results, and ultimately affect the accuracy of detection.
(2)
Although there are differences in the accuracy of detection results between airspace conflict detection based on airspace clustering and traditional airspace conflict detection based on wide area, this difference can be continuously reduced by adjusting the number of airspace and other parameters, especially in the case of large-scale task airspace, the accuracy of the method proposed in this paper has been gradually improved, and the error rate is also declining.
(3)
Clustering the whole task airspace can effectively improve the efficiency of conflict detection. The larger the number and scale of airspace, the more time saved and the greater the speed difference between airspace conflict detection based on airspace clustering and traditional detection methods. This shows that airspace clustering is a pre preparation work when facing the challenge of large-scale airspace tasks. It has great application potential and great significance.
(4)
The efficiency of airspace conflict detection based on airspace clustering mentioned in point (3) is restricted by many factors. For example, when the number of airspace is limited, simply increasing the number of airspace clusters will lead to the saturation of airspace clustering, and the detection efficiency will gradually decrease. Therefore, the number of battlefield airspace and other parameters should be sorted, integrated, analyzed, and calculated in advance before airspace clustering, in this way, reasonable airspace clustering can be carried out to achieve the best operational efficiency.
(5)
The method proposed in this paper provides a new idea for the traditional battlefield airspace management. Such a simplified dimension reduction method greatly improves the accuracy of battlefield airspace management and also greatly releases the burden and pressure of battlefield airspace management and control. It is expected to be applied to large-scale joint operations in the future and become the key and booster of efficient and safe battlefield airspace management and control.

Author Contributions

Conceptualization: M.C. and L.W.; Methodology: M.C., L.W. and Z.J.; Software: M.C., L.W. and Z.J.; Validation: M.C.; Investigation: L.W.; Resources: M.C. and L.W.; Data Curation: M.C., L.W. and D.Q.; Writing—Original Draft Preparation: M.C.; Writing—Review and Editing: M.C., L.W., Z.J., M.L. and Z.G.; Supervision: M.C. and L.W.; Project Administration: L.W. All authors have read and agreed to the published version of the manuscript.

Funding

This research received no external funding.

Data Availability Statement

The numerical simulation data used to support this research comes from public documents such as the National Geographic Information Public Service Platform.

Acknowledgments

The authors are thankful to anonymous reviewers for their instructive reviewing of the manuscript.

Conflicts of Interest

The authors declare no conflict of interest.

References

  1. Zhang, W.L.; Jiang, H. On the concept of airspace. J. Beijing Univ. Aeronaut. Astronaut. (Soc. Sci. Ed.) 2021, 34, 127–133. [Google Scholar]
  2. Zhu, Y.J. Study on the Process of European Airspace Integration. Master’s Thesis, Fudan University, Shanghai, China, 2013. [Google Scholar]
  3. ICAO DOC 8168; Procedures for Air Navigation Services: Aircraft Operations. ICAO: Montreal, QC, Canada, 2006.
  4. Thipphavong, D.P.; Apaza, R.; Barmore, B.; Battiste, V.; Burian, B.; Dao, Q.; Feary, M.; Go, S.; Goodrich, K.H.; Homola, J. Urban air mobility airspace integration concepts and considerations. In Proceedings of the 2018 Aviation Technology, Integration, and Operations Conference, Atlanta, Georgia, 25–29 June 2018; p. 3676. [Google Scholar]
  5. Air Land Sea Application Center. Army Airspace Management during Large-Scale Combat Operations. Available online: https://www.alsa.mil/Portals/9/Documents/articles/220501_ALSA_Article_Cronen_Airspace.pdf (accessed on 1 May 2022).
  6. Gerdes, I.; Temme, A.; Schultz, M. Dynamic airspace sectorisation for flight-centric operations. Transp. Res. Part C Emerg. Technol. 2018, 95, 460–480. [Google Scholar] [CrossRef]
  7. Vascik, P.D.; Cho, J.; Bulusu, V.; Polishchuk, V. Geometric approach towards airspace assessment for emerging operations. J. Air Transp. 2020, 28, 124–133. [Google Scholar] [CrossRef]
  8. Yang, B.; Wang, B.; Feng, C. Research on the General Framework of Army Tactical Airspace Command and Control System. pp. 127–131. Available online: https://cpfd.cnki.com.cn/Article/CPFDTOTAL-ZHKZ201507002029.htm (accessed on 7 July 2015).
  9. Zheng, L.H.; Tao, J.D. Software Technology of Land Tactical Airspace Management and Control System. Command Inf. Syst. Technol. 2020, 11, 1–4. [Google Scholar]
  10. Hang, W.N.; Wu, H.X. U.S. High-Altitude E-Class Airspace Management (ETM) Operation Concept. pp. 528–541. Available online: https://kns.cnki.net/kcms/detail/detail.aspx?dbcode=CPFD&dbname=CPFDLAST2022&filename=ZGHU202111001094&uniplatform=NZKPT&v=JGihuccHY0POIfy4DtAdL1dL55x0-drLCQMAAyyixbqm2T34WtByUUfjZhWUgrVMB_91WC0q3GQ%3d (accessed on 9 November 2021).
  11. Xun, C.C.; Liu, G.B.; Zhao, X.L.; Ding, Y. American Air Battlefield Management and Control Information System. pp. 156–161. Available online: https://kns.cnki.net/kcms/detail/detail.aspx?dbcode=CPFD&dbname=CPFDLAST2021&filename=ZHKZ202107001028&uniplatform=NZKPT&v=HvtzC_hzgnVIBZspQsqvAYlxWd2cqz668Tz4mxi8tRCWQtWjbKxeqiu-EWGzRe8wya1NNeA4e68%3d (accessed on 5 July 2021).
  12. Fang, F.; Zhu, X.Y.; Zhang, Z.Z. Research on Airspace Management System of US Army Land Battlefield. Firepower Command Control. 2017, 42, 170–173. [Google Scholar]
  13. Xue, M. Airspace sector redesign based on Voronoi diagrams. J. Aerosp. Comput. Inf. Commun. 2009, 6, 624–634. [Google Scholar] [CrossRef]
  14. Sabhnani, G.; Yousefi, A.; Mitchell, J.S. Flow conforming operational airspace sector design. In Proceedings of the 10th AIAA Aviation Technology, Integration, and Operations (ATIO) Conference, Fort Worth, TX, USA, 13–15 September 2010; p. 9377. [Google Scholar]
  15. Zhang, M.; Shan, L.; Liu, K.; Yu, H.; Yu, J. Terminal airspace sector capacity estimation method based on the ATC dynamical model. Kybernetes 2016, 45, 884–899. [Google Scholar] [CrossRef]
  16. Lv, H.L. Sector Combination Optimization Based on Flexible Use of Airspace Concept. Master’s Thesis, China Civil Aviation Flight Academy, Sichuan, China, 2014. [Google Scholar]
  17. Feng, D.; Zeng, L.; Wang, F.; Liu, D.; Zhang, F.; Qin, L.; Liu, Q. Geographic Information Systems Grid. pp. 823–830. Available online: https://link.springer.com/chapter/10.1007/11508380_84 (accessed on 29 May 2021).
  18. Yan, J.; Chengqi, C.; Beitong, Z.; Weixin, Z. Geographic Airspace Semantic Translation Method Using Subdivision Grid Coding. pp. 4534–4537. Available online: https://ieeexplore.ieee.org/document/7326836 (accessed on 15 December 2020).
  19. Ware, C.; Mayer, L.; Johnson, P.; Jakobsson, M.; Ferrini, V. A global geographic grid system for visualizing bathymetry. Geosci. Instrum. Methods Data Syst. 2020, 9, 375–384. [Google Scholar] [CrossRef]
  20. Wang, S.; Armstrong, M.P. A quadtree approach to domain decomposition for airspace interpolation in grid computing environments. Parallel Comput. 2003, 29, 1481–1504. [Google Scholar] [CrossRef]
  21. AlShawi, I.S.; Yan, L.; Pan, W.; Luo, B. Lifetime enhancement in wireless sensor networks using fuzzy approach and A-star algorithm. IEEE Sens. J. 2012, 12, 3010–3018. [Google Scholar] [CrossRef]
  22. Zhang, Z.; Zhao, Z. A multiple mobile robots path planning algorithm based on A-star and Dijkstra algorithm. Int. J. Smart Home 2014, 8, 75–86. [Google Scholar] [CrossRef] [Green Version]
  23. Yao, J.; Lin, C.; Xie, X.; Wang, A.J.; Hung, C.C. Path planning for virtual human motion using improved A* star algorithm. In Proceedings of the 2010 Seventh International Conference on Information Technology: New Generations, Las Vegas, NV, USA, 12–14 April 2010; pp. 1154–1158. [Google Scholar]
  24. Duchoň, F.; Babinec, A.; Kajan, M.; Beňo, P.; Florek, M.; Fico, T.; Jurišica, L. Path planning with modified a star algorithm for a mobile robot. Procedia Eng. 2014, 96, 59–69. [Google Scholar] [CrossRef] [Green Version]
  25. Liu, Z.; Nan, Y.; Yang, Y. Airspace Conflict Detection Method Based on Subdivision Grid. Artif. Intell. China 2022, 854, 670–677. [Google Scholar]
  26. Zhao, H.; Zhang, Y.Q.; Fan, Q.; Wang, W.C. Coordinate transformation of geographic information data based on grid model. Surv. Mapp. Airsp. Geogr. Inf. 2022, 43, 201–203, 207, 211. [Google Scholar]
  27. Jin, A.; Chen, C.Q. airspace data coding method based on global grid. J. Surv. Mapp. Sci. Technol. 2013, 30, 284–287. [Google Scholar]
  28. Li, Z.Q.; Chen, C.Q.; Li, S. Fast Visualization and Experimental Analysis of airspace Objects Based on GeoSOT-3D. J. Earth Inf. Sci. 2015, 17, 810–815. [Google Scholar]
  29. Xu, X.Y.; Wan, L.J.; Chen, P.; Dai, J.B.; Cai, M. Airspace Rasterization Representation Method Based on GeoSOT Grid. J. Air Force Eng. Univ. (Nat. Sci. Ed.) 2021, 22, 15–22. [Google Scholar]
  30. Chen, C.Q.; Wu, F.L.; Wang, R.; Qin, Y.G.; Tong, X.C.; Chen, B. Preliminary study on the construction of geoairspace reference grid system. J. Peking Univ. (Nat. Sci. Ed.) 2016, 52, 1041–1049. [Google Scholar]
  31. Wang, L.; Wu, W.; Deng, G.Q.; Tong, X.C.; Li, J.F. Analysis of Geoairspace Grid Coding Technology. Bull. Surv. Mapp. 2020, 10, 131–134, 147. [Google Scholar]
  32. Russ, J.C. The Image Processing Handbook; CRC Press: Boca Raton, FL, USA, 2006. [Google Scholar]
  33. Acharya, T.; Ray, A.K. Image Processing: Principles and Applications; John Wiley & Sons: Hoboken, NJ, USA, 2005. [Google Scholar]
  34. Haralick, R.M.; Shapiro, L.G. Image segmentation techniques. Comput. Vis. Graph. Image Process. 1985, 29, 100–132. [Google Scholar] [CrossRef]
  35. Heel, M.V.; Harauz, G.; Orlova, E.V.; Schmidt, R.; Schatz, M. A new generation of the IMAGIC image processing system. J. Struct. Biol. 1996, 116, 17–24. [Google Scholar] [CrossRef] [Green Version]
  36. Zhu, S.; Xia, X.; Zhang, Q.; Belloulata, K. An image segmentation algorithm in image processing based on threshold segmentation. In Proceedings of the 2007 Third International IEEE Conference on Signal-Image Technologies and Internet-Based System, Shanghai, China, 16–18 December 2007; pp. 673–678. [Google Scholar]
  37. Al-Amri, S.S.; Kalyankar, N.V. Image segmentation by using threshold techniques. arXiv 2010, arXiv:1005.4020. [Google Scholar]
  38. Cuevas, E.; Zaldivar, D.; Pérez-Cisneros, M. A novel multi-threshold segmentation approach based on differential evolution optimization. Expert Syst. Appl. 2010, 37, 5265–5271. [Google Scholar] [CrossRef]
  39. Bhargavi, K.; Jyothi, S. A survey on threshold based segmentation technique in image processing. Int. J. Innov. Res. Dev. 2014, 3, 234–239. [Google Scholar]
  40. Huang, Y.C.; Tung, Y.S.; Chen, J.C.; Wang, S.W.; Wu, J.L. An adaptive edge detection based colorization algorithm and its applications. In Proceedings of the 13th annual ACM international conference on Multimedia, Beijing, China, 6–11 November 2005; pp. 351–354. [Google Scholar]
  41. Salman, N.; Liu, C.Q. Image segmentation and edge detection based on watershed techniques. Int. J. Comput. Appl. 2003, 25, 258–263. [Google Scholar] [CrossRef]
  42. Bogovic, J.A.; Prince, J.L.; Bazin, P.L. A multiple object geometric deformable model for image segmentation. Comput. Vis. Image Underst. 2013, 117, 145–157. [Google Scholar] [CrossRef] [Green Version]
  43. Wong, W.E.; Debroy, V.; Gao, R.; Li, Y. The DStar method for effective software fault localization. IEEE Trans. Reliab. 2013, 63, 290–308. [Google Scholar] [CrossRef]
  44. Li, B.; Chen, B. An adaptive rapidly-exploring random tree. IEEE/CAA J. Autom. Sin. 2021, 9, 283–294. [Google Scholar] [CrossRef]
  45. Zhu, Y.W.; Chen, Z.J.; Pu, F.; Wang, J.L. Research on the Development of Digital Airspace System. China Eng. Sci. 2021, 23, 135–143. [Google Scholar] [CrossRef]
  46. Zhu, Y.W.; Xie, H.; Pu, F.; Zhang, Y.; He, W.W. Research on airspace grid method and its application in ATC. Prog. Aeronaut. Eng. 2021, 12, 12–24. [Google Scholar]
  47. Zhu, Y.W.; Pu, F. Principle and Application of airspace Grid Identification in Airspace. J. Beijing Univ. Aeronaut. Astronaut. 2021, 47, 2462–2474. [Google Scholar]
  48. Kicinger, R.; Yousefi, A. Heuristic method for 3D airspace partitioning: Genetic algorithm and agent-based approach. In Proceedings of the 9th AIAA Aviation Technology, Integration, and Operations Conference (ATIO), Hilton Head, SC, USA, 21–23 September 2009; p. 7058. [Google Scholar]
  49. Zheng, Y.; Liu, J.; Li, J.; Xu, Y.; Huang, Q.; Zhu, Y.; Pei, Y. Design of Fine Management System for Civil Aviation Airspace Resources Based on Spatiotemporal Grid Model. In Proceedings of the 2019 IEEE 1st International Conference on Civil Aviation Safety and Information Technology (ICCASIT), Kunming, China, 17–19 October 2019; pp. 547–551. [Google Scholar]
  50. Sun, G.; Qu, T.; Han, B.; Sun, H.; Zhang, Q. Research on Airspace Grid Modeling Based on GeoSOT Global Subdivision Model. In Proceedings of the 2021 IEEE 3rd International Conference on Civil Aviation Safety and Information Technology (ICCASIT), Changsha, China, 20–22 October 2021; pp. 501–505. [Google Scholar]
  51. Qian, C.; Yi, C.; Cheng, C.; Pu, G.; Wei, X.; Zhang, H. Geosot-based spatiotemporal index of massive trajectory data. ISPRS Int. J. Geo-Inf. 2019, 8, 284. [Google Scholar] [CrossRef] [Green Version]
  52. Lu, N.; Cheng, C.; Jin, A.; Ma, H. An index and retrieval method of airspace data based on GeoSOT global discrete grid system. In Proceedings of the 2013 IEEE International Geoscience and Remote Sensing Symposium—IGARSS, Melbourne, VIC, Australia, 21–26 July 2013; pp. 4519–4522. [Google Scholar]
  53. Hou, K.; Cheng, C.; Chen, B.; Zhang, C.; He, L.; Meng, L.; Li, S. A set of integral grid-coding algebraic operations based on geosot-3d. ISPRS Int. J. Geo-Inf. 2021, 10, 489. [Google Scholar] [CrossRef]
  54. Song, S.H.; Chen, C.Q.; Pu, G.L.; An, F.G.; Luo, X. GeoSOT grid application of global remote sensing data subdivision organization. J. Surv. Mapp. 2014, 43, 869. [Google Scholar]
  55. Shu, P.; Zheng, Y.; Shi, H.; Liu, S.; Sun, H.; Zhou, X. Three dimensional grid model of airspace resources based on Beidou grid code. In Proceedings of the 2021 IEEE 3rd International Conference on Civil Aviation Safety and Information Technology (ICCASIT), Changsha, China, 20–22 October 2021; pp. 380–383. [Google Scholar]
  56. Shi, H.F.; Wang, Z.Y.; Zhen, Y.E.; Xu, Y.B. Fine management system of airspace resources based on Beidou grid code. J. Civ. Aviat. 2022, 6, 44–47. [Google Scholar]
  57. Delahaye, D.; Schoenauer, M.; Alliot, J.M. Airspace sectoring by evolutionary computation. In Proceedings of the 1998 IEEE International Conference on Evolutionary Computation Proceedings. IEEE World Congress on Computational Intelligence (Cat. No.98TH8360), Anchorage, AK, USA, 4–9 May 1998; pp. 218–223. [Google Scholar]
  58. Delahaye, D.; Puechmorel, S. 3D airspace sectoring by evolutionary computation: Real-world applications. In Proceedings of the 8th Annual Conference on Genetic and Evolutionary Computation, Washington, DC, USA, 27 October 2014; pp. 1637–1644. [Google Scholar]
  59. Klein, A. An efficient method for airspace analysis and partitioning based on equalized traffic mass. In Proceedings of the 6th USA/Europe Air Traffic Management R & D Seminar; George MasonUniversity: George, VA, USA, 2005. [Google Scholar]
  60. Trandac, H.; Baptiste, P.; Duong, V. Airspace sectorization with constraints. RAIRO-Oper. Res. 2005, 39, 105–122. [Google Scholar] [CrossRef]
  61. Granberg, T.A.; Polishchuk, T.; Polishchuk, V.; Schmidt, C. A framework for integrated terminal airspace design. Aeronaut. J. 2019, 123, 567–585. [Google Scholar] [CrossRef]
  62. Yousefi, A.; Donohue, G. Temporal and airspace distribution of airspace complexity for air traffic controller workload-based sectorization. In Proceedings of the AIAA 4th Aviation Technology, Integration and Operations (ATIO) Forum, Chicago, IL, USA, 20–22 September 2004; p. 6455. [Google Scholar]
  63. Delahaye, D.; Alliot, J.M.; Schoenauer, M.; Farges, J.L. Genetic algorithms for partitioning air space. In Proceedings of the Tenth Conference on Artificial Intelligence for Applications, San Antonio, TX, USA, 1–4 March 1994; pp. 291–297. [Google Scholar]
  64. Prandini, M.; Piroddi, L.; Puechmorel, S.; Brazdilova, S.L. Toward air traffic complexity assessment in new generation air traffic management systems. IEEE Trans. Intell. Transp. Syst. 2011, 12, 809–818. [Google Scholar] [CrossRef]
  65. Brinton, C.; Hinkey, J.; Leiden, K. Airspace sectorization by dynamic density. In Proceedings of the 9th AIAA Aviation Technology, Integration, and Operations Conference (ATIO), Hilton Head, CA, USA, 21–23 September 2009; p. 7102. [Google Scholar]
  66. Lee, K.; Feron, E.; Pritchett, A. Describing airspace complexity: Airspace response to disturbances. J. Guid. Control Dyn. 2009, 32, 210–222. [Google Scholar] [CrossRef]
  67. Sergeeva, M.; Delahaye, D.; Mancel, C. 3D airspace sector design by genetic algorithm. In Proceedings of the 2015 International Conference on Models and Technologies for Intelligent Transportation Systems (MT-ITS), Budapest, Hungary, 3–5 June 2015; pp. 499–506. [Google Scholar]
  68. Yu, D.; Ji, S. Grid based spherical cnn for object detection from panoramic images. Sensors 2019, 19, 2622. [Google Scholar] [CrossRef] [Green Version]
  69. Cai, P.; Indhumathi, C.; Cai, Y.; Zheng, J.; Gong, Y.; Lim, T.S.; Wong, P. Collision detection using axis aligned bounding boxes. In Simulations, Serious Games and Their Applications; Springer: Singapore, 2014; pp. 1–14. [Google Scholar]
  70. Mahovsky, J.; Wyvill, B. Fast ray-axis aligned bounding box overlap tests with plucker coordinates. J. Graph. Tools 2004, 9, 35–46. [Google Scholar] [CrossRef]
  71. Gottschalk, S.A. Collision Queries Using Oriented Bounding Boxes; The University of North Carolina at Chapel Hill: Chapel Hill, NC, USA, 2000. [Google Scholar]
  72. Eberly, D. Dynamic Collision Detection Using Oriented Bounding Boxes; Geometric Tools. Inc.: Chapel Hill, NC, USA, 2002. [Google Scholar]
  73. Ding, S.; Mannan, M.; Poo, A.N. Oriented bounding box and octree based global interference detection in 5-axis machining of free-form surfaces. Comput.—Aided Des. 2004, 36, 1281–1294. [Google Scholar] [CrossRef]
  74. Havel, J.; Herout, A. Yet faster ray-triangle intersection (using SSE4). IEEE Trans. Vis. Comput. Graph. 2009, 16, 434–438. [Google Scholar] [CrossRef]
  75. Zhang, X.L.; Wang, S.; Hou, B.; Chan, C.T. Dynamically encircling exceptional points: In situ control of encircling loops and the role of the starting point. Phys. Rev. 2018, 8, 021066. [Google Scholar] [CrossRef] [Green Version]
  76. Cunningham, C.H.; Pauly, J.M.; Nayak, K.S. Saturated double-angle method for rapid B1+ mapping. Magn. Reson. Med. Off. J. Int. Soc. Magn. Reson. Med. 2006, 55, 1326–1333. [Google Scholar] [CrossRef]
Figure 1. Schematic diagram of common polygon bounding box (a) spherical bounding box (SBB); (b) aligned axis bounding boxes (AABB); (c) oriented bounding boxes (OBB).
Applsci 12 11396 g001
Figure 2. Schematic Diagram of Airspace Projection.
Applsci 12 11396 g002
Figure 3. Airspace projection effect picture (a) 3D airspace model; (b) Geodetic 2D plane projection image.
Applsci 12 11396 g003
Figure 4. Task airspace projection effect picture (a) 2-D mission airspace distribution map; (b) 2D plane projection of mission airspace.
Applsci 12 11396 g004
Figure 5. Task airspace projection effect picture (a) 2D grayscale image of airspace projection; (b) gray level equalization processing gray level image; (c) black and white binary projection.
Applsci 12 11396 g005
Figure 6. Black and white binary projection of mission airspace.
Applsci 12 11396 g006
Figure 7. Grid generation and coding sequence diagram. (a) Grid division drawing; (b) Grid coding sequence diagram.
Applsci 12 11396 g007
Figure 8. Gauss Kruger projection zoning diagram.
Applsci 12 11396 g008
Figure 9. Schematic Diagram of Battlefield Airspace Grid Generation.
Applsci 12 11396 g009
Figure 10. Battlefield airspace clustering diagram.
Applsci 12 11396 g010
Figure 11. Detection diagram of intersecting nodes of airspace clustering lines.
Applsci 12 11396 g011
Figure 12. Airspace clustering line grid coding detection diagram.
Applsci 12 11396 g012
Figure 13. Schematic Diagram of Radiographic Testing Method. (a) Schematic diagram of ray intersection method; (b) Schematic Diagram of Surrounding Number Method.
Applsci 12 11396 g013
Figure 14. Schematic Diagram of Angle Addition.
Applsci 12 11396 g014
Figure 15. Determination of elements in clusters by angle addition.
Applsci 12 11396 g015
Figure 16. Schematic diagram of airspace clustering results.
Applsci 12 11396 g016
Figure 17. Results of airspace clustering (set number of airspace clusters M = 2 ). (a) Dijkstra algorithm; (b) A * algorithm; (c) Best First Search (BFS) algorithm.
Applsci 12 11396 g017
Figure 18. Results of airspace clustering (set number of airspace clusters M = 4 ). (a) Dijkstra algorithm; (b) A * algorithm; (c) Best First Search (BFS) algorithm.
Applsci 12 11396 g018
Figure 19. Results of airspace clustering (set number of airspace clusters M = 6 ). (a) Dijkstra algorithm; (b) A * algorithm; (c) Best First Search (BFS) algorithm.
Applsci 12 11396 g019
Figure 20. Comparison of airspace clustering parameters under different algorithms. (a) Comparison of Airspace clustering line length under different algorithms; (b) Comparison of airspace clustering time under different algorithms.
Applsci 12 11396 g020
Figure 21. Comparison of airspace conflict detection accuracy (the airspace safety margin distance change).
Applsci 12 11396 g021
Figure 22. Comparison of airspace detection speed ratio (the airspace safety margin distance change).
Applsci 12 11396 g022
Figure 23. Comparison of airspace conflict detection accuracy (number of target airspace clusters change).
Applsci 12 11396 g023
Figure 24. Comparison of airspace detection speed ratio (number of target airspace clusters change).
Applsci 12 11396 g024
Figure 25. Comparison of airspace conflict detection accuracy (total number of airspace change).
Applsci 12 11396 g025
Figure 26. Comparison of airspace detection speed ratio (total number of airspace change).
Applsci 12 11396 g026
Table 1. Rectangular grid code table of sample points.
Grid SizeGrid Code
10   km N 020 D 4452
1   km N 020 D 445720
100   m N 020 D 44572203
10   m N 020 D 4457252039
1   m N 020 D 445725120395
Table 2. Characteristic parameter table of task airspace.
Airspace NumberAirspace PositionAirspace ShapeAirspace Size (km)Usage TimeCommunication Frequency
1B316Rectangle120 × 208:00–10:0087.975 MHz
2E222Rectangle30 × 709:00–10:0067.975 MHz
3E418Rectangle45 × 407:00–8:0077.975 MHz
4B411Rectangle100 × 207:00–9:0087.975 MHz
5C206Rectangle70 × 808:00–10:0087.975 MHz
6E209Rectangle20 × 609:00–11:0077.975 MHz
7F006Rectangle80 × 8014:00–16:0067.975 MHz
8D122Rectangle20 × 6015:00–17:0067.975 MHz
9B221Circle257:00–10:0087.975 MHz
10A222Circle208:00–9:0087.975 MHz
11F025Circle309:00–10:0077.975 MHz
12A303Circle258:00–11:0087.975 MHz
13B206Circle4015:00–16:0067.975 MHz
14F204Circle2513:00–17:0067.975 MHz
15D119Circle2016:00–18:0087.975 MHz
Table 3. Statistics of airspace clustering.
Airspace Cluster NumberAirspace Number
none
none
1, 8, 9, 10, 15
4, 5, 12, 13
2, 3, 11
6, 7, 14
Table 4. Grid coding data structure.
Serial NumberVariable NameVariable MeaningData Type
1 C o d e _   I D Grid codeUnsigned Int
2 L 1 _   S e t The object grid coding set in the clustering line L 1 BLOB
3 L 2 _   S e t The object grid coding set in the clustering line L 2 BLOB
Table 5. Airspace clustering line length data record table.
Number of Airspace ClustersAlgorithm NameLength of Airspace Clustering Line (km)Airspace Clustering Time (s)
2Dijkstra30788.19
A *28152.17
BFS31576.32
4Dijkstra587187.25
A *531112.53
BFS615144.36
6Dijkstra857297.23
A *806223.15
BFS980254.13
8Dijkstra1129621.35
A *1072450.19
BFS1295501.32
Publisher’s Note: MDPI stays neutral with regard to jurisdictional claims in published maps and institutional affiliations.