Abstract
Owing to its vibration reduction and indirect signal amplification characteristics, a nonlinear energy sink (NES) is used for crack identification of structures. The equation of a cracked simply supported beam with an NES is derived and the influences of the crack properties on the dynamics of the system are investigated. A pixel method is applied to estimate phase diagram areas and crack parameters are identified based on the geometric features of the phase diagram. It is shown that the phase diagram of the NES varies significantly with crack parameters. This is because of the higher amplitudes generated by the absorbing NES with respect to the primary structure. In addition, the NES can reduce the amplitude of the cracked beam without hindering crack identification. Moreover, through introducing the NES, the system can produce a strongly modulated response, which can be utilized for convenient crack detection. Two sets of crack identification indices are defined for the system, generating a single-period response and a strongly modulated response. Contour maps of identification indices based on the area of phase diagrams are obtained by varying crack location and depth. The crack parameters are identified through the intersection of contour lines.
1. Introduction
Nonlinear energy sink (NES) is a type of device that can realize one-way irreversible energy transfer and has various designs [1,2]. It has received much attention owing to its broadband vibration absorption characteristics and lightweight property [3,4]. The conventional NES transfers energy through a purely nonlinear elastic component and dissipates it via damping. It has been both theoretically and experimentally verified that the conventional NES can efficiently suppress vibrations of many kinds of primary structures [5,6,7,8]. Since its discovery, the most important role of the NES has been vibration absorption. Consequently, the main focus of research is its performance and robustness enhancement for vibration control. Therefore, various improved versions such as vibro-impact NES [9,10], multi-stable NES [11,12], lever-type NES [13], inertial NES [14], and piecewise stiffness/damping NES [15,16,17] have been proposed.
Owing to its broadband energy transfer properties, the NES is suitable for use in energy harvesting and has also exhibited various other useful properties. Different kinds of piezoelectric and magnetoelectric energy harvesters combined with NES have been proposed [18,19,20,21]. The NES was also used in a viscoelastic vibration isolation system, achieving favorable results [22]. Generally speaking, the NES produces large amplitudes during its operation, which is usually considered to be a drawback because it increases the dimensions of the device. However, in this paper, this property is used to assist the crack identification of structures.
Crack is a common structural damage that results in the deterioration of mechanical properties. The evolution of a crack can lead to severe hidden vulnerabilities of engineering structures. Indices based on the linear vibration parameters such as natural frequency and mode were used to detect cracks at an early age [23,24,25]. The harmonic response is currently the most widely used nonlinear index [26,27], and other characteristics such as bifurcation and nonlinear strength [28,29] were also developed. The orbits in phase diagrams are sensitive to the change in mechanical properties of structures and are usually used to qualitatively analyze cracks [30,31,32], as they contain displacement and velocity information and show strongly nonlinear dynamic characteristics. Recently, phase diagrams have also been employed to quantitatively determine crack parameters. Identification methods based on orbital eccentricity, offset deviation [33,34], and area [35] of the phase diagrams were developed.
In this work, the dynamic equation of a beam with a breathing crack and attached to an NES is derived. The influences of the NES on the dynamics of the crack beam are analyzed. The effect of indirect signal amplification and the induction of the strongly modulated response are used for crack identification. The identification indices based on the area of the phase diagram are defined and their variations with crack parameters are obtained. The position and depth of the crack are estimated from the intersection point of contour lines.
2. Dynamic Equation of a Breathing Cracked Beam-NES System
A simply supported beam with a breathing crack is shown in Figure 1. The length, width, and height of the beam are L, b, and h respectively. The crack depth is a and the distance of the crack from the left end of the beam is Lo, defining the crack position ratio as β = Lo/L and the depth ratio as = a/h.

Figure 1.
A simply supported beam with a breathing crack.
The natural frequency of a perfect simply supported beam is given by the following:
where EI and ρ are flexural rigidity and density of the beam, respectively, and A is the sectional area. Thus, the stiffness of the simply supported beam is given by .
The flexibility change of the simply supported beam due to a crack is [36]
where is a function of crack depth ratio, given by the following:
Therefore, the stiffness of the cracked beam can be calculated as follows:
The dynamic equation of the simply supported beam with a breathing crack after discretizing is obtained as follows [37,38]:
where m is the mass of the beam, c is the damping coefficient, ko is the stiffness of the beam with an open crack, is the change range of equivalent stiffness, f is the exciting force, and ω is the exciting frequency. Figure 2 shows the cracked beam attached to an NES.

Figure 2.
Simply supported beam attached to an NES.
The distance between the force point and the left end of the beam is and the NES is placed at L2 from the left end of the beam. The dynamic equation is obtained as follows:
where the mass of the beam is represented by that equals in Equation (5), is the mass of the NES, γ is the damping coefficient of the NES, k is the stiffness coefficient of the NES, and υ is the displacement of the NES.
3. Crack Identification Based on Single-Period Response
The parameters are set as follows: beam length , width , height , density , modulus of elasticity , damping ratio , Poisson’s ratio , stiffness coefficient of NES , damping coefficient of NES , and mass ratio . NES is positioned at the beam midpoint and the force is imposed at .
The Runge–Kutta method implemented in MATLAB is used in the numerical simulation. The frequency responses are shown in Figure 3. In this case, f = 25 N; the crack depth ratio is set to 0.3; and the position ratio is set to 0.1, 0.3, and 0.5, respectively.
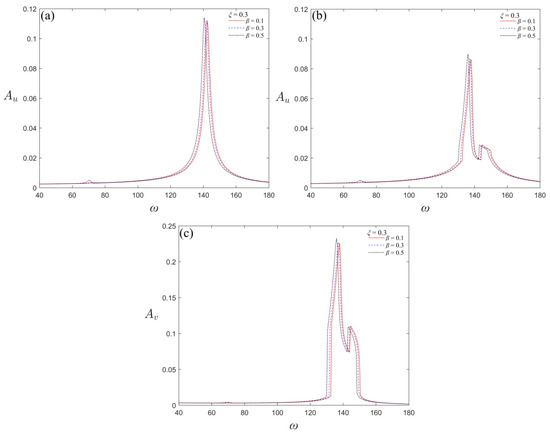
Figure 3.
Frequency responses of the beam and NES for different crack parameters: (a) beam without NES, (b) beam with NES, (c) NES.
As can be seen on the frequency response, for depth ratio and with the increase in crack position ratio , the amplitude of the beam both with and without NES gradually increases, while the corresponding frequency of the peak gradually decreases. In comparison with Figure 3a,b, it can be seen that the amplitude of the beam decreases after connecting the NES, and it is seen from Figure 3c that the amplitude of the NES is much greater than that of the beam. Therefore, the identification of the crack parameters with the assistance of the NES can not only protect the beam, but also amplify the detection signal, which is useful for crack identification. The corresponding frequencies of the peak of the beam without NES attached is 142.5 rad/s, 142 rad/s, and 140.5 rad/s with the three crack parameters, and the corresponding frequency of the NES peak in the beam-NES system is 138 rad/s, 137 rad/s, and 136 rad/s, respectively. In order to compare the response of the beam and NES, the corresponding frequency at one of their maximum amplitudes is used for excitation. The excitation frequency of the beam without NES attached is 140.5 rad/s and that of the NES is 136 rad/s. Figure 4 shows the phase diagram.
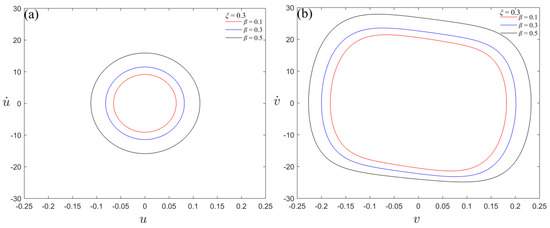
Figure 4.
Comparison of phase diagrams between beam without NES and NES in the beam–NES system; (a) phase diagram of beam without NES at a frequency of 140.5 rad/s, (b) phase diagram of NES in the beam–NES system at a frequency of 136 rad/s.
It can be seen that the area of the phase diagram of both the beam and NES increases in varying degrees with the increase in the position ratio. The NES phase diagram is better suited for crack identification because of its larger area. In order to identify the crack when the amplitude of the beam is as low as possible, the excitation frequency is chosen as 133 rad/s. The phase diagrams of the beam and NES in the beam–NES system are shown in Figure 5. The waveforms of the beam and NES in the beam–NES system with different crack parameters under the excitation of 133 rad/s are given in Figure 6.
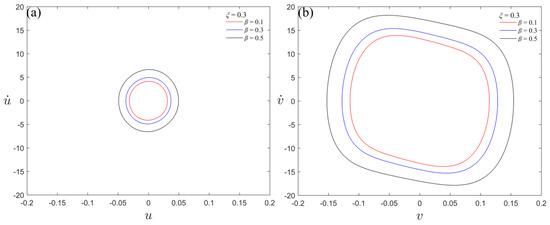
Figure 5.
Phase diagram of the system at 133 rad/s; (a) phase diagram of beam in the beam–NES system and (b) phase diagram of NES.
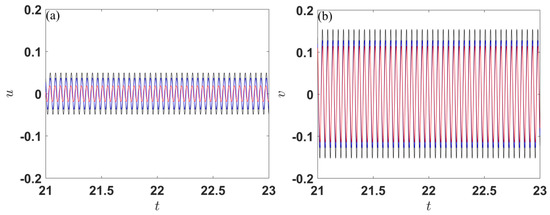
Figure 6.
Waveforms of beam and NES in the beam–NES system with ξ = 0.3, β = 0.1, 0.3, and 0.5; (a) waveforms of beam in the beam–NES system, (b) waveforms of NES; red line: β = 0.1, blue line: β = 0.3, black line: β = 0.5.
It can be seen in Figure 6 that, for the excitation frequency equal to 133 rad/s, the amplitude of both the beam and NES in the beam–NES system increases with β. However, the beam amplitude always remains low, while the NES amplitude increases greatly, resulting in an obvious signal amplification effect.
Based on the above analysis, the change in crack parameters inevitably leads to a change in the phase diagram. In addition, the phase diagram includes both the displacement and velocity information, and thus has significant advantages for damage identification with respect to those methods, which only use one of them. In other words, the phase diagram is more sensitive to the emergence and evolution of cracks. The phase diagram of NES is processed when the excitation frequency is 133 rad/s and is segmented with a vertical line x = 0 and a horizontal line y = 0, as shown in Figure 7.
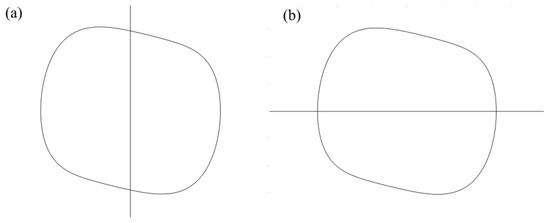
Figure 7.
Segmentation of phase diagram; (a) dividing the phase diagram with a vertical line of x = 0, (b) dividing phase diagram with a horizontal line of y = 0.
The areas of the left and right sides of the phase diagram in Figure 7a and the up- and downsides in Figure 7b are calculated. The ratio of the right part to the left part of the phase diagram area is defined as index and the area ratio of the downside to the upside is defined as . The dependence of these indexes on β and ξ is shown in Figure 8 and Figure 9.
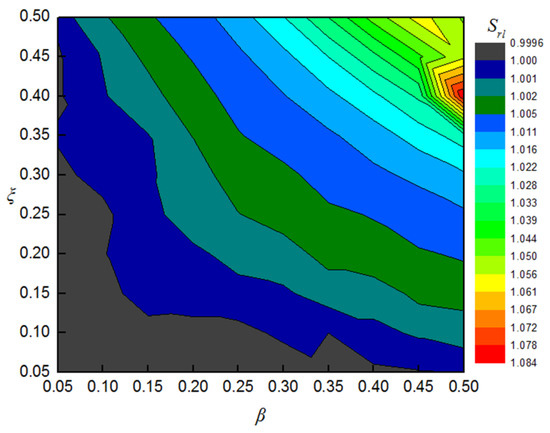
Figure 8.
Variation in with β and ξ.
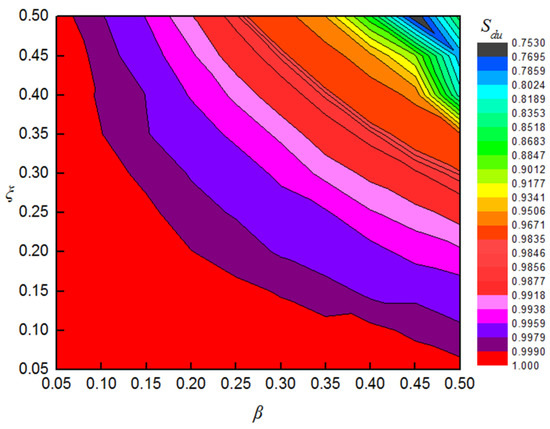
Figure 9.
Variation in with β and ξ.
Figure 8 and Figure 9 show that the index gradually increases, while the index gradually decreases with the increase in either crack depth or location. Therefore, the degree of damage and the location of cracks can be qualitatively estimated using the value of one of the indices. However, different crack parameters correspond to a single contour line with a single index value and a crack cannot be identified by one index alone. In order to accurately detect the crack, the intersection point of the contour line of the two indexes is used. Four groups of damaged conditions are selected to verify the feasibility of the method. The values of and for different crack parameters are given in Table 1.

Table 1.
Values of and under different crack parameters.
The contour lines of and corresponding to the crack parameters are selected from Figure 8 and Figure 9, respectively. As shown in Figure 10a, the contour lines of and are extracted. When the two contour lines are placed in one figure, it can be seen that the two contour lines intersect at a single point, and the corresponding horizontal and vertical coordinates of the point are crack parameters β and ξ. Similarly, other crack parameters can be extracted, as shown in Figure 10b–d.
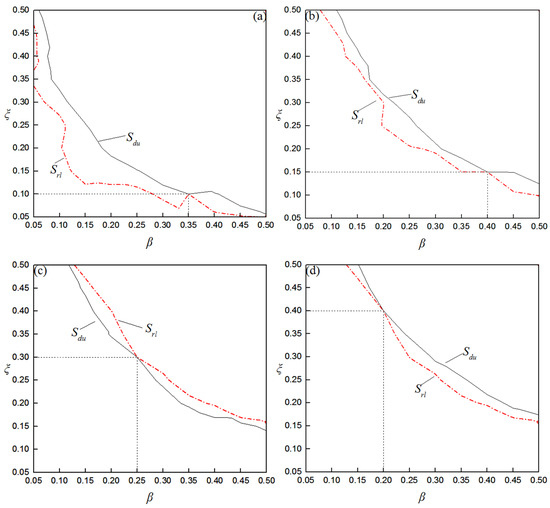
Figure 10.
Crack parameter identification for a single-period response; (a) β = 0.35, ξ = 0.1; (b) β = 0.4, ξ = 0.15; (c) β = 0.25, ξ = 0.3; (d) β = 0.2, ξ = 0.4.
4. Crack Identification Based on Strongly Modulated Response
Systems can generate a kind of strongly modulated response after the introduction of an NES, and this response is sensitive to the change in system parameters. For this reason, it can be used for crack detection. Figure 11 shows strongly modulated responses, obtained by setting the excitation amplitude to 18 N. In this case, the depth ratio is set to 0.3 and the position ratio is set to 0.15, 0.35, and 0.45.
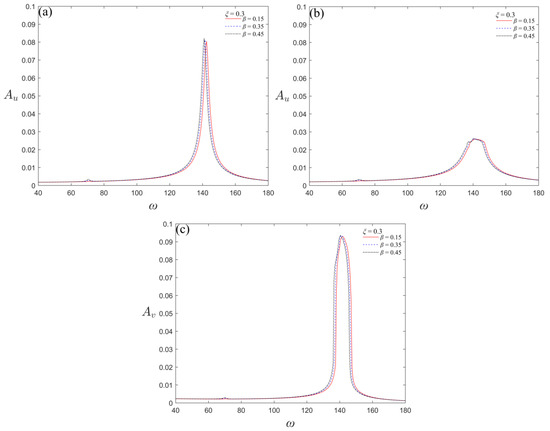
Figure 11.
Frequency responses of beam and NES with different crack parameters; (a) beam without NES, (b) beam with NES, (c) NES.
The results show that the amplitude of the beam increases with the increase in the crack position ratio, regardless of NES attachment. The corresponding frequency of the resonance peak decreases, consistent with the law of single-period response. Compared with the single-period response, the amplitude of the beam decreases significantly. However, the amplitude of the NES is only slightly higher than that of the beam without NES. Therefore, when the strongly modulated response occurs, the NES has a stronger protective effect on the beam; however, the signal amplification effect decreases. Moreover, there is no significant difference between the resonance peak frequencies of the beam with and without NES, which is about 140 rad/s. The waveforms of the beam with three damage parameters are shown in Figure 12.
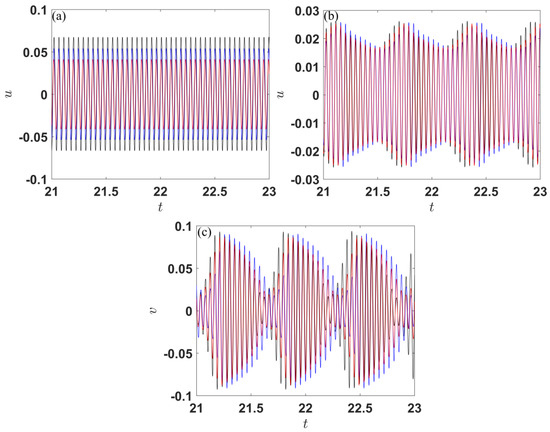
Figure 12.
Waveforms of the system for ξ = 0.3, β = 0.15, 0.35, and 0.45; (a) beam without NES, (b) beam with NES; (c) NES; red line: β = 0.15, blue line: β = 0.35, black line: β = 0.45.
It can be seen in Figure 12 that the beam response changes significantly after NES is connected. Before the NES is connected, the beam generates a single-period sine motion and, with the increase in the position ratio β, the amplitude of the waveform gradually increases. After connecting the NES, the waveforms of the beam and NES show strongly modulated responses, and their amplitude only changes slightly with the position ratio of the crack. The phase diagrams of the beam without NES attached and the NES in the beam–NES system for different crack parameters are shown in Figure 13 for an excitation frequency equal to 140 rad/s. It can be seen that the phase diagram area corresponding to the NES changes significantly.
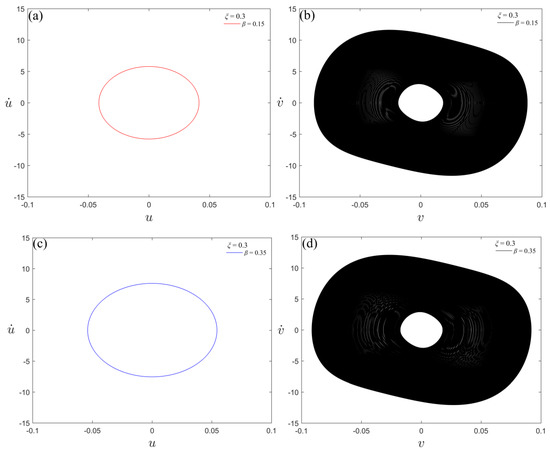
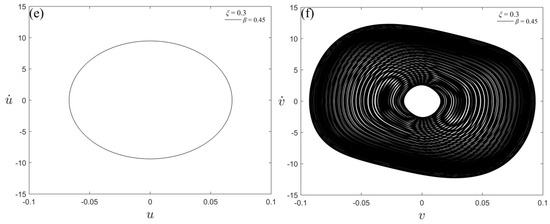
Figure 13.
Phase diagrams of the beam without NES and NES in the beam–NES system for different crack parameters; (a) phase diagram of beam without NES for β = 0.15, (b) phase diagram of NES for β = 0.15, (c) phase diagram of beam without NES for β = 0.35, (d) phase diagram of NES for β = 0.35, (e) phase diagram of beam without NES for β = 0.45, (f) phase diagram of NES for β = 0.45.
It can be seen from Figure 13 that the phase diagram of the beam without NES is elliptical, and the area of the phase diagram increases with the increase in the position ratio. The phase diagram of NES in the beam–NES system is manifestly different, with the shape changed from an ellipse to a ring. With the increase in the position ratio, the area of the small white circle gradually decreases and the area of the black ring increases. The area of the small white part is denoted as Ss and the area of the black ring, which is enclosed by the outermost black contour line and the boundary line of the small white circle, is Sl. The changes in Ss and Sl with β and ξ are shown in Figure 14 and Figure 15, respectively. In order to verify the feasibility of crack identification using Ss and Sl, four groups of parameters are selected. The values of Ss and Sl under different crack parameters are given in Table 2.
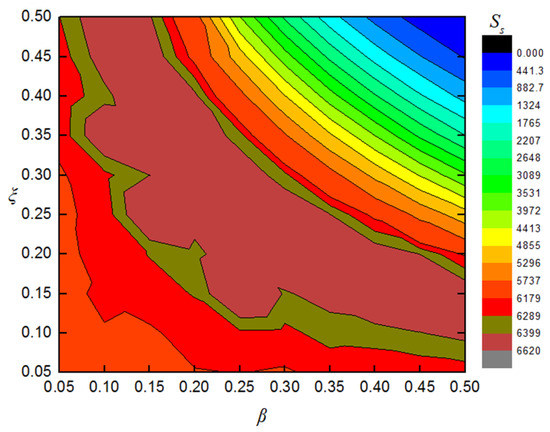
Figure 14.
Variation in index Ss with β and ξ.
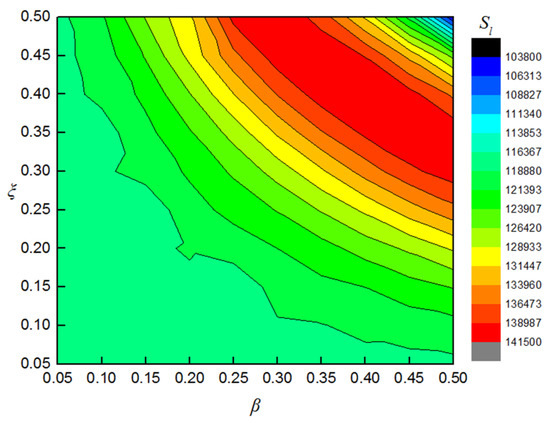
Figure 15.
Variation in index Sl with β and ξ.

Table 2.
Values of Ss and Sl under different crack parameters.
The required contour lines are extracted from Figure 14 and Figure 15. The contour lines of Ss = 4383 and Sl = 138,387 are drawn on the same plot in Figure 16a, and the horizontal and vertical coordinates of the intersection point are then the required values of β and ξ. In Figure 16a, two lines are close to each other, but do not intersect. Similarly, the other cracks can be detected, as shown in Figure 16b–d. It can be seen that, although the contour lines are close together, they intersect at a single point in each case.
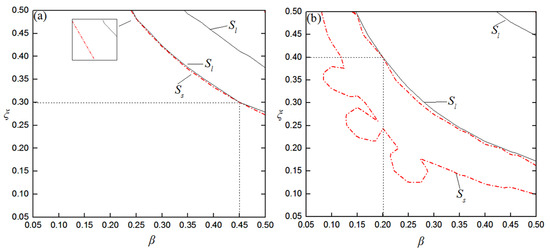
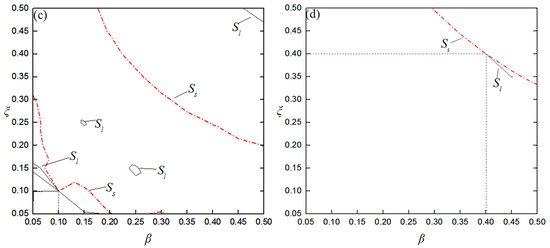
Figure 16.
Crack parameter identification as the system produces a strongly modulated response; (a) β = 0.45, ξ = 0.3; (b) β = 0.2, ξ = 0.4; (c) β = 0.1, ξ = 0.1; (d) β = 0.4, ξ = 0.4.
5. Conclusions
The NES is not only capable of reducing the vibration amplitude of a cracked beam, but can also indirectly amplify the identification signal. Using a method based on the geometric characteristics of the phase diagram, we investigate crack identification with NES.
First, the stiffness of the breathing cracked beam is defined as a function that changes periodically with time and, combined with the additional flexibility formula, the dynamic equation of the cracked beam is derived. Then, an NES is attached to the beam and the dynamic equation of the breathing cracked beam–NES system is obtained. The influence of crack parameters on the dynamic characteristics of the system is studied for single-period and strongly modulated responses.
It is shown that the amplitude of the beam is only slightly reduced by attaching the NES as the single period response is produced, while the amplitude of the NES is relatively large. Therefore, the area of NES is more suitable to be used for crack identification. When strongly modulated responses occur, the amplitude of the beam is greatly reduced by attaching the NES. Although the amplitude of NES in the beam–NES system increases slightly with the variation in crack parameters, the phase diagram of NES is significantly changed and very sensitive to changes in crack.
The area of the phase diagram is calculated by the pixel method. In the case of the single-period response, indexes Srl and Sdu are defined, while in the case of the strongly modulated response, indexes Ss and Sl are defined. The contour maps of the two groups of indexes, which vary with the crack position and depth, are drawn and the position and depth of the crack are acquired from the intersection point of contour lines.
Author Contributions
Conceptualization, M.S. and K.Z.; methodology, J.C.; validation, M.S., K.Z. and J.C.; formal analysis, M.S.; investigation, K.Z.; writing—original draft preparation, K.Z.; writing—review and editing, M.S.; supervision, J.C.; funding acquisition, M.S. and J.C. All authors have read and agreed to the published version of the manuscript.
Funding
This research was funded by the National Natural Science Foundation of China, grant numbers 12172246 and 11872274.
Institutional Review Board Statement
Not applicable.
Informed Consent Statement
Not applicable.
Data Availability Statement
Not applicable.
Acknowledgments
We sincerely thank the reviewers for their helpful and constructive suggestions and the editors for their careful and patient work.
Conflicts of Interest
The authors declare no conflict of interest.
References
- Vakakis, A.F. Passive nonlinear targeted energy transfer. Philos. Trans. R. Soc. A-Math. Phys. Eng. Sci. 2018, 376, 20170132. [Google Scholar] [CrossRef] [PubMed]
- Gendelman, O.V. Targeted energy transfer in systems with external and self-excitation. Proc. Inst. Mech. Eng. Part C J. Mech. Eng. Sci. 2011, 225, 2007–2043. [Google Scholar] [CrossRef]
- Ding, H.; Chen, L.Q. Designs, analysis, and applications of nonlinear energy sinks. Nonlinear Dyn. 2020, 100, 3061–3107. [Google Scholar] [CrossRef]
- Lu, Z.; Wang, Z.X.; Zhou, Y.; Lu, X.L. Nonlinear dissipative devices in structural vibration control: A review. J. Sound Vib. 2018, 423, 18–49. [Google Scholar] [CrossRef]
- Lee, Y.S.; Vakakis, A.F.; Bergman, L.A.; Mcfarland, D.M.; Kerschen, G. Suppression aeroelastic instability using broadband passive targeted energy transfers, part 1: Theory. AIAA J. 2007, 45, 693–711. [Google Scholar] [CrossRef]
- Nucera, F.; Lo Iacono, F.; McFarland, D.M.; Bergman, L.A.; Vakakis, A.F. Application of broadband nonlinear targeted energy transfers for seismic mitigation of a shear frame: Experimental results. J. Sound Vib. 2008, 313, 57–76. [Google Scholar] [CrossRef]
- Yang, T.Z.; Liu, T.; Tang, Y.; Hou, S.; Lv, X.F. Enhanced targeted energy transfer for adaptive vibration suppression of pipes conveying fluid. Nonlinear Dyn. 2019, 97, 1937–1944. [Google Scholar] [CrossRef]
- Bab, S.; Khadem, S.E.; Shahgholi, M.; Abbasi, A. Vibration attenuation of a continuous rotor-blisk-journal bearing system employing smooth nonlinear energy sinks. Mech. Syst. Signal Process. 2017, 84, 128–157. [Google Scholar] [CrossRef]
- Gendelman, O.V. Analytic treatment of a system with a vibro-impact nonlinear energy sink. J. Sound Vib. 2012, 331, 4599–4608. [Google Scholar] [CrossRef]
- Gourc, E.; Michon, G.; Seguy, S.; Berlioz, A. Targeted energy transfer under harmonic forcing with a vibro-impact nonlinear energy sink: Analytical and experimental developments. J. Vib. Acoust. 2015, 137, 031008. [Google Scholar] [CrossRef]
- Romeo, F.; Sigalov, G.; Bergman, L.A.; Vakakis, A.F. Dynamics of a linear oscillator coupled to a bistable light attachment: Numerical study. J. Comput. Nonlinear Dyn. 2015, 10, 011007. [Google Scholar] [CrossRef]
- Yao, H.L.; Wang, Y.W.; Cao, Y.B.; Wen, B.C. Multi-stable nonlinear energy sink for rotor system. Int. J. Non-Linear Mech. 2020, 118, 103273. [Google Scholar] [CrossRef]
- Zang, J.; Yuan, T.C.; Lu, Z.Q.; Zhang, Y.W.; Ding, H.; Chen, L.Q. A lever-type nonlinear energy sink. J. Sound Vib. 2018, 437, 119–134. [Google Scholar] [CrossRef]
- Chen, H.Y.; Mao, X.Y.; Ding, H.; Chen, L.Q. Elimination of multimode resonances of composite plate by inertial nonlinear energy sinks. Mech. Syst. Signal Process. 2020, 135, 106383. [Google Scholar] [CrossRef]
- Chen, J.E.; Sun, M.; Hu, W.H.; Zhang, J.H.; Wei, Z.C. Performance of non-smooth nonlinear energy sink with descending stiffness. Nonlinear Dyn. 2020, 100, 255–267. [Google Scholar] [CrossRef]
- Starosvetsky, Y.; Gendelman, O.V. Vibration absorption in systems with a nonlinear energy sink: Nonlinear damping. J. Sound Vib. 2009, 324, 916–939. [Google Scholar] [CrossRef]
- Sun, M.; Hu, W.H.; Liu, J.; Chen, J.E. Steady-state responses of mechanical system attached to non-smooth vibration absorber with piecewise damping and stiffness. Meccanica 2021, 56, 275–285. [Google Scholar] [CrossRef]
- Li, X.; Zhang, Y.W.; Ding, H.; Chen, L.Q. Dynamics and evaluation of a nonlinear energy sink integrated by a piezoelectric energy harvester under a harmonic excitation. J. Vib. Control 2019, 25, 851–867. [Google Scholar] [CrossRef]
- Ahmadabadi, Z.N.; Khadem, S.E. Nonlinear vibration control and energy harvesting of a beam using a nonlinear energy sink and a piezoelectric device. J. Sound Vib. 2014, 333, 4444–4457. [Google Scholar] [CrossRef]
- Zang, J.; Cao, R.Q.; Fang, B.; Zhang, Y.W. A vibratory energy harvesting absorber using integration of a lever-enhanced nonlinear energy sink and a levitation magnetoelectric energy harvester. J. Sound Vib. 2020, 484, 115534. [Google Scholar] [CrossRef]
- Fang, Z.W.; Zhang, Y.W.; Li, X.; Ding, H.; Chen, L.Q. Integration of a nonlinear energy sink and a giant magnetostrictive energy harvester. J. Sound Vib. 2017, 391, 35–49. [Google Scholar] [CrossRef]
- Huang, D.M.; Li, R.H.; Yang, G.D. On the dynamic response regimes of a viscoelastic isolation system integrated with a nonlinear energy sink. Commun. Nonlinear Sci. Numer. Simul. 2019, 79, 104916. [Google Scholar] [CrossRef]
- Kim, J.T.; Ryu, Y.S.; Cho, H.M.; Stubbs, N. Damage identification in beam-type structures:frequency-based method vs. mode-shape based method. Eng. Struct. 2003, 25, 57–67. [Google Scholar] [CrossRef]
- Doebling, S.W.; Farrar, C.R.; Prime, M.B. A Summary review of vibration-based damage identification methods. Shock Vib. Dig. 1998, 30, 91–105. [Google Scholar] [CrossRef]
- Carden, E.P.; Fanning, P. Vibration based condition monitoring: A review. Struct. Health Monit. 2004, 3, 355–377. [Google Scholar] [CrossRef]
- Bovsunovsky, A.P.; Surace, C. Considerations regarding superharmonic vibrations of acracked beam and the variation in damping caused by the presence of the crack. J. Sound Vib. 2005, 28, 865–886. [Google Scholar] [CrossRef]
- Semperlotti, F.; Wang, K.W.; Smith, E.C. Localization of a breathing crack using superharmonic signals due to system nonlinearity. AIAA J. 2009, 47, 2076–2086. [Google Scholar] [CrossRef]
- Bovsunovsky, A.P.; Bovsunovsky, O. Crack detection in beams by means of the driving force parameters variation at non-linear resonance vibrations. Key Eng. Mater. 2007, 347, 413–420. [Google Scholar] [CrossRef]
- Xu, W.; Ding, K.Q.; Liu, J.Q.; Cao, M.S.; Radzienski, M.; Ostachowicz, W. Non-uniform crack identification in plate-like structures using wavelet 2D modal curvature under noisy conditions. Mech. Syst. Signal Process. 2019, 126, 469–489. [Google Scholar] [CrossRef]
- Rezaee, M.; Shaterian-Alghalandis, V. A new crack detection method in a beam under geometrically nonlinear vibration. Arch. Appl. Mech. 2018, 88, 1491–1506. [Google Scholar] [CrossRef]
- Cheng, C.; Nie, Z.H.; Ma, H.W. Structural damage detection of the simple beam based on responses phase space. Adv. Mater. Res. 2013, 605–607, 985–995. [Google Scholar] [CrossRef]
- Liu, W.; Barkey, M.E. Nonlinear vibrational response of a single edge cracked beam. J. Mech. Sci. Technol. 2017, 31, 5231–5243. [Google Scholar] [CrossRef]
- Andreaus, U.; Baragatti, P. Experimental damage detection of cracked beams by using nonlinear characteristics of forced response. Mech. Syst. Signal Process. 2012, 31, 382–404. [Google Scholar] [CrossRef]
- Andreaus, U.; Baragatti, P. Cracked beam identification by numerically analyzing the nonlinear behavior of the harmonically forced response. J. Sound Vib. 2011, 330, 721–742. [Google Scholar] [CrossRef]
- Huang, Y.H.; Chen, J.E.; Ge, W.M.; Bian, X.L.; Hu, W.H. Research on geometric features of phase diagram and crack identification of cantilever beam with breathing crack. Results Phys. 2019, 15, 102561. [Google Scholar] [CrossRef]
- Dimarogonas, A.D.; Paipetis, S.A.; Chondros, T.G. Analytical Methods in Rotor Dynamics; Applied Science Publishers: London, UK, 1983. [Google Scholar]
- Mousa, R.; Reza, H. Free vibration analysis of simply supported beam with breathing crack using perturbation method. Acta Mech. Solida Sin. 2010, 23, 459–470. [Google Scholar]
- Douka, E.; Hadjileontiadis, J.L. Time-frequency analysis of the free vibration response of a beam with a breathing crack. NDT&E Int. 2005, 38, 3–10. [Google Scholar]
Publisher’s Note: MDPI stays neutral with regard to jurisdictional claims in published maps and institutional affiliations. |
© 2022 by the authors. Licensee MDPI, Basel, Switzerland. This article is an open access article distributed under the terms and conditions of the Creative Commons Attribution (CC BY) license (https://creativecommons.org/licenses/by/4.0/).