Article

An Intelligent Approach for Fair Assessment of Online Laboratory Examinations in Laboratory Learning Systems Based on Student’s Mouse Interaction Behavior

by
Hadeer A. Hassan Hosny
1,*,
Abdulrahman A. Ibrahim
1,
Mahmoud M. Elmesalawy
2 and
Ahmed M. Abd El-Haleem
2
1
Computers and Systems Engineering Department, Faculty of Engineering, Helwan University, Cairo 11795, Egypt
2
Electronics and Communications Engineering Department, Faculty of Engineering, Helwan University, Cairo 11795, Egypt
*
Author to whom correspondence should be addressed.
Appl. Sci. 2022, 12(22), 11416; https://doi.org/10.3390/app122211416
Submission received: 3 October 2022 / Revised: 7 November 2022 / Accepted: 7 November 2022 / Published: 10 November 2022

Abstract

:
The COVID-19 pandemic has made the world focus on providing effective and fair online learning systems. As a consequence, this paper proposed a new intelligent, fair assessment of online examinations for virtual and remotely controlled laboratory experiments running through Laboratory Learning Systems. The main idea is to provide students with an environment similar to being physically present in a Laboratory while conducting practical experiments and exams and detecting cheating with high accuracy at a minimal cost. Therefore, an intelligent assessment module is designed to detect cheating students by analyzing their mouse dynamics using Artificial Intelligence. The mouse interaction behavior method was chosen because it does not require any additional resources, such as a camera and eye tribe tracker, to detect cheating. Various AI algorithms, such as KNN, SVC, Random Forest, Logistic Regression, XGBoost, and LightGBM have been used to classify student mouse behavior to detect cheating, and many metrics are used to evaluate their performance. Moreover, experiments have been conducted on students answering online laboratory experimentations while cheating and when answering the exams honestly. Experimental results indicate that the LightGBM AI algorithm achieves the best cheat detection results up to an accuracy of 90%, precision of 88%, and degree of separation of 95%.

1. Introduction

The extensive need for a complete online learning system is considered the main attractive research point. Because the COVID-19 epidemic makes the whole world think of providing an online learning system to provide education for millions of students. Many applications are carried out to provide people over the world with a remote learning system [1,2,3]. Furthermore, an effective and fair assessment learning system is needed.
The proposed intelligent Module for fair assessment targets the discipline of online laboratory learning environment for engineering, science, and technology education systems, which is a part of the new LLS presented in [4]. The LLS is a new Laboratory Learning System that is used to provide teachers and students with a complete online learning system that includes the new flexible and generic laboratory learning environment. This new LLS is responsible for providing not only an online learning system but also allowing the students to perform laboratory experiments remotely. This is done by allowing the users to access virtual and remotely controlled experiments that run on a (Virtual Machine) VM that exists in the laboratory’s server from their homes and perform various experiments and exams remotely without needing a special interface to software. Furthermore, to provide a fair system, an intelligent cheating detection technique is needed, which is presented in detail in this paper.
To provide a fair assessment for the LLS, cheating has to be detected. Therefore, many research papers are concerned with how to detect cheating. One of the techniques used to detect cheating is based on the mouse dynamics of the student while conducting the experiment. In the mouse dynamic, it measures the mouse movement as a biometric. There are many other biometrics used, like fingerprint, face recognition, eye recognition, and others [5,6].
The mouse dynamic is one of the best techniques as it does not require extra cost for equipment to collect the biometrics. Many techniques used mouse dynamics, which are intrusion detection [7], login system [8], user authentication [9], and others. Regarding the intrusion detection technique, it uses the collected mouse dynamics to extract from it several features, which is used to detect the impostor to systems. Furthermore, the login system is one of the techniques that use mouse dynamics, where the user is asked to perform a task, and from his mouse dynamics, the system decides whether to login or not to the system instead of using the regular username and password. Moreover, the user authentication technique is similar to the login system, where from the mouse cognitive style, the system can detect if this user is authorized to access the system or not. As a consequence, mouse dynamics have attracted many recent types of research [10,11,12,13,14]. On the other side, some research papers use the mouse keystroke rather than mouse dynamic, but always when dealing with laboratory experiments, mouse movement is more frequently used than keystrokes [15].

2. Background and Related Work

Many research papers are concerned with providing a trusted online learning system. The important aspect is to provide fairness in the LLS student assessment tasks by detecting cheating students remotely. Some researchers deal with the keystroke behavior, like the one published by Trezise et al. [16], by collecting the keystrokes and clickstream data to detect cheating students from their authentic writing behavior. The data are collected from university students who performed three writing tasks under different experimental cases. Model-based clustering was used to distinguish cheaters from un-cheating students. The experimental results prove that keystrokes and clickstreams can be used to distinguish cheaters from their writing behavior.
Another biometrics used to detect cheating in exams is the one proposed by Razan Bawarith et al. [17], who collected the biometrics data: fingerprints and the eye tribe of students. They collected data using two devices, the fingerprint reader authenticator and the eye tribe tracker, which required extra cost. Afterward, they used the two parameters collected, which are the collected total time elapsed on the screen and the number of times taken to enter and out from the screen to classify cheating and non-cheating students. After performing several experiments, they proved to reach a precision of 95%.
Most of the applications deal with mouse dynamics as it happens more in the system than keystrokes [18]. From applications that used the mouse movement is the paper published by Gamboa and Fred [19], which recorded the mouse behavior of players playing a memory game through the web to identify the player. They used a pointed device to collect the user interaction and used statistical pattern recognition techniques to verify the player from the imposter. A large set of features were extracted from the user interaction’s raw data; then, a feature extraction algorithm chose the main features. Finally, a sequential classifier is used to classify users from the imposter. The experimental results showed that the proposed algorithm succeeded in authenticating users playing a memory game at an inexpensive cost, as it used a standard human interaction device (mouse).
Furthermore, other papers that used mouse movement in verifying users is the one proposed by Zheng et al. [20]; they collected data sets from general mouse movement and another data set from an online form for several users. Afterward, the raw data is segmented into the PC (Point click) action, and several features are extracted. These features are the Angle-based features and the statistical features, which enhanced the process of user verification, as they are unique from one person to another. Finally, they used support vector machines (SVMs) for accurate classification. Their results showed that they could verify users with high accuracy without the need for an extra cost.
The paper proposed by Antal & Egyed-Zsigmond [7] has performed a number of studies to determine the most important mouse actions, which are extracted from mouse dynamics and the number of mouse actions required to detect the intrusion with high precision. They have segmented the mouse movement’s raw data collected into three mouse actions. The first one is the Mouse Movement (MM) action, which is a general mouse event. The second one is the Point and Click (PC) mouse action, which ends with a mouse click event. The last type is the Drag and Drop (DD) mouse action, which represents the drag and drop mouse events. Furthermore, they extracted additional features to help increase intrusion detection. They proved that mouse dynamics is considered a good inexpensive intruder detection system. Furthermore, to perform the detection with high accuracy, they used a sufficient data set.
Other papers have used mouse dynamics and AI algorithms in classification to enhance the precision of results, like the work done by Siddiqui et al. [21], who collected the mouse dynamics of 10 users playing Minecraft video games. Afterward, the Random Forest AI algorithm is used to differentiate between the user’s movement and the imposter’s movement.
Furthermore, the paper proposed by [22] used deep Learning-based techniques for user authentication reinforcement processes. In this work, the authors collected user activities by designing a custom application. Afterward, these data are processed and several features are extracted. These features are used to train three different AI algorithms: Support Vector Machine, Multi-Layer Perceptron, and a Deep Learning approach. Finally, these algorithms successfully performed the user authentication process and detected the imposter in the system.
From the recent papers published that considered detecting cheating while performing an online exam is the one proposed by Sokout et al. [23]; the author collected the mouse dynamics of students performing an online midterm exam. They used the mouse dynamics and the Moodle plugin to detect cheaters. Their proposed system succeeded in detecting 94% of students cheating in online midterm exams.
Furthermore, papers published considering the online examination using mouse dynamic is the one proposed by [24]. This paper helps the proctoring of the online exam to detect cheating using both the recorded video of the exam and the mouse dynamic of the student. They proved with the experimental results the effectiveness and efficiency of their algorithm for a fair assessment of online exams.
This new proposed paper is concerned with developing a cheating module to detect whether the students cheat or not while conducting online laboratory experimentation exams from mouse dynamics. The main contribution of this paper is providing a new fair assessment module in the LLS. This module is used to detect cheating students while performing online experiments and laboratory exams. Moreover, the proposed cheating system used only mouse dynamics, which requires no extra cost, and used AI algorithms to achieve high precision and accuracy. So, the classification between cheating and non-cheating students enhanced, and the degree of separation of students increased. Furthermore, the experiments are performed on different types of online exams. These exams may include static questions like MCQ, True and False questions, or may contain Virtual Remote Lab (VRL) based questions. The VRL questions can be added to the system, which allows the user to remotely access a computer that exists in the laboratory using the Myrtille technology [25] from the LLS. This computer includes a VM that has the required simulator software installed on it. Therefore, the instructor can add any type of virtual simulator software within the experiment, which will be explained in detail in Section 3. The paper is organized as follows, Section 1 gives an introduction to the paper, and Section 2 includes the literature review. Furthermore, the new LLS intelligent, fair assessment module is described in Section 3. The experiments are carried out on several students performing exams and experiments to detect cheating or not, as presented in Section 4. Finally, the conclusion is presented in Section 5.

3. The LLS Intelligent Fair Assessment Module

The proposed intelligent fair assessment Module for LLS and its architecture are described in the next two subsections: The first section describes the new proposed fair assessment module and its interaction with the other LLS modules. The second section describes in detail how the Fair assessment module detects cheating.

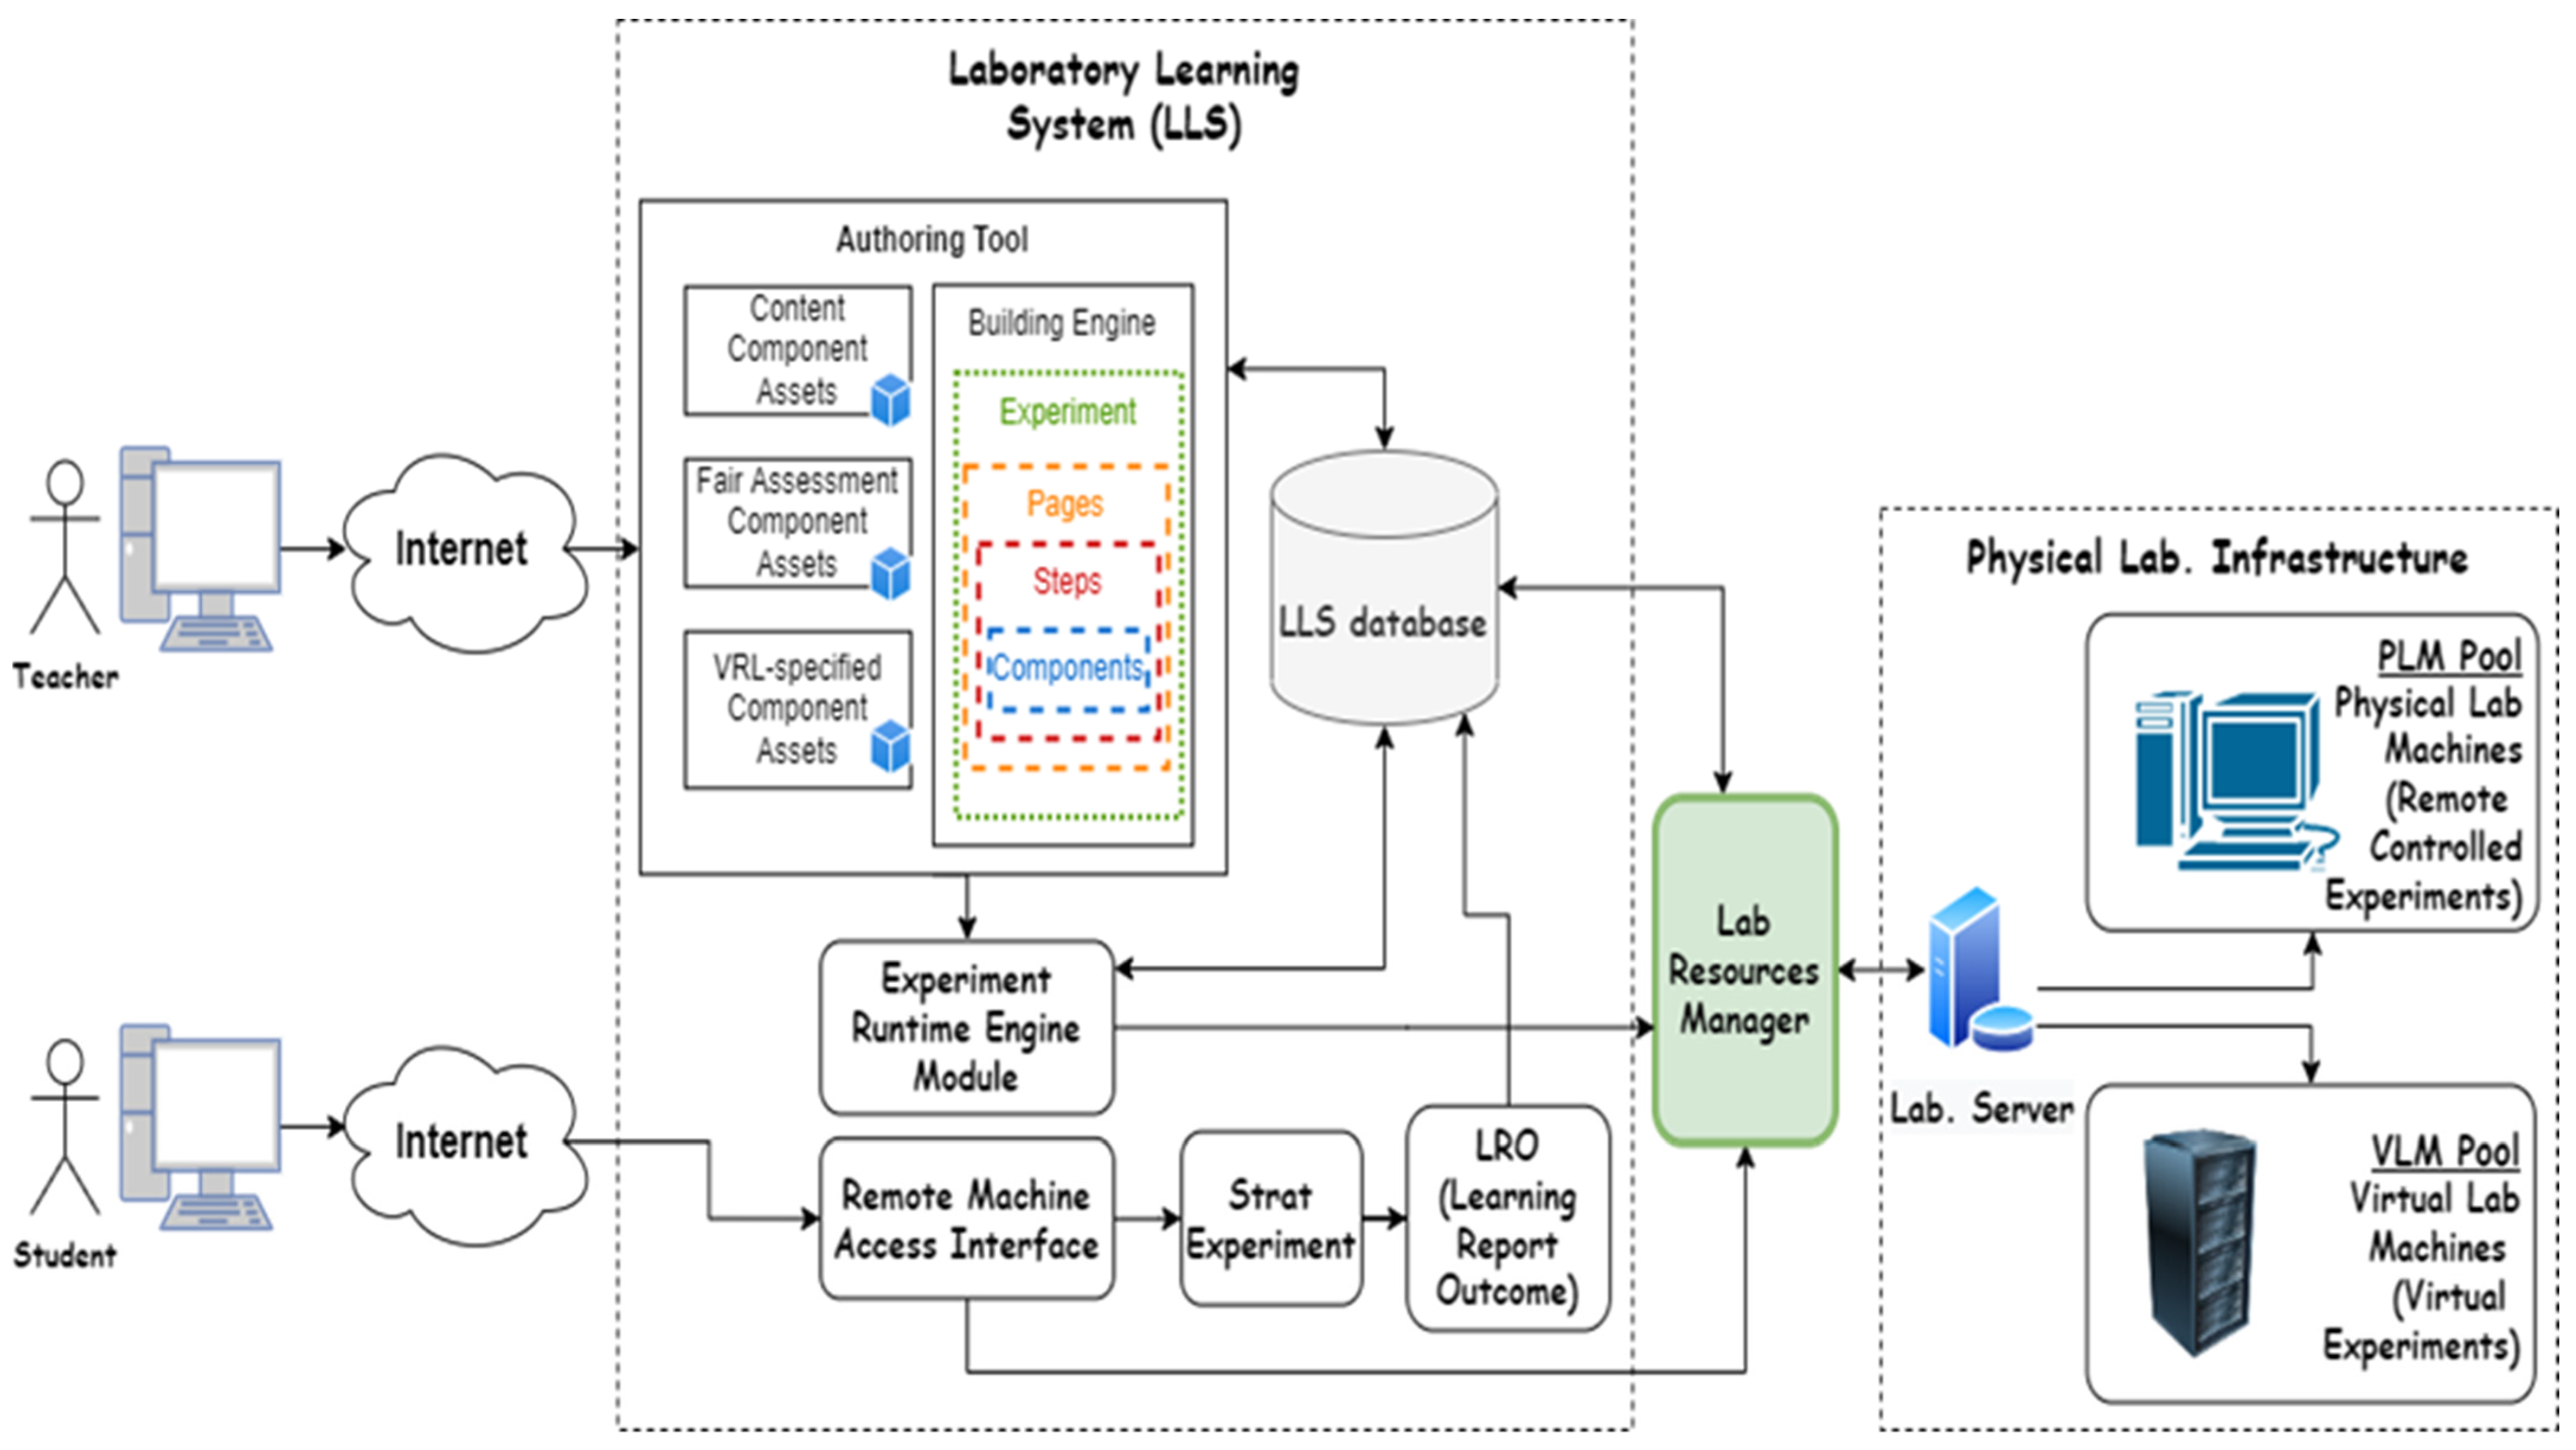
3.1. Overview of the LLS

The architecture of a new Laboratory Learning System proposed, after adding the intelligent fair assessment module, is shown in Figure 1. This new architecture is designed to support the simplicity of designing and performing various online experiments and practical exams remotely using a web browser only.
The LLS supports two scenarios to perform online experiments and practical exams: The first scenario is performing an experimentation exam on a virtual experiment by running a simulator remotely. The second scenario is performing the experimentation exam on a physically controlled experiment remotely. Furthermore, the new LLS is considered generic as you can perform any type of software or hardware practical exam with one generic student interface. This can be done by installing any type of software in the server’s virtual machine (VM) and connecting to the VM remotely through Myrtille technology. The Myrtille technology allows you to automatically access and uses the VM’s software installed as part of the experiment’s student interface. Furthermore, the proposed LLS allows the students to access and control the hardware devices that exist in the laboratory remotely as part of the experimentation exams from the student’s generic interface.
Moreover, the LLS added a new intelligent, fair assessment component to detect cheating students while performing the practical exam, as students perform the exam online from home. As a consequence, the mouse interaction behavior is studied to detect cheating to be compatible with any software without needing to interface with it.
As shown in Figure 1, the teacher accesses the authoring tool of the LLS to design a new experiment or practical exam, which includes many types of draggable components. From these components are the MCQ questions, matching questions, true & false questions, and questions that need students to perform practical experimental steps.
The authoring tool consists mainly of four components: The Content component, the Fair assessment component, the VRL (Virtual Remote Lab.) component, and the Building engine. The Content component is used to add static components to the practical exam, for example, true and false questions, MCQ questions, and others. The Fair assessment component is used to detect cheating while performing the experiment exam online using the student’s mouse behavior.
The VRL component is used to add any software virtually or control remote physical equipment in the laboratory as a part of the questions that need students to perform practical experimental steps. The Building engine is used to build the structure of questions which needs students to simulate the steps of performing the real experiment in the laboratory.
After the instructor finished designing the new practical exam using the authoring tool, a Laboratory Learning Object (LLO) is generated and stored in the LLS database, where the LLS database contains all the system data. These data are related to the student’s and instructor’s information, such as their name, identifications, and others. Furthermore, one of the stored data in the database is the practical exams LLO content, which includes all types of questions, and steps authored for completing the learning process. The laboratory Resource Manager is used to assign and schedule the available resources in the laboratory server needed by the LLO.
As shown in Figure 1, the student accesses the Remote Machine Access Interface, which is used to open the student interface and assign a practical exam for each student. Afterward, the student starts the exam, and the LLO of the assigned practical exam is read from the database and loaded into the Experimental Runtime Engine Module. The students start solving the practical exam loaded in the Experimental Runtime Engine Module, and after finishing the experiments, the student’s answers are stored in an LRO (Learning Report Outcome) and stored in the LLS database.
During the experiment execution, all students’ activities from the experiment runtime engine are collected and sent to the Fair assessment component to analyze the student activity and detect cheating.

3.2. The Proposed Fair Assessment Module

The proposed fair assessment Module is responsible for detecting cheating students while solving the online practice exam remotely. This module is one of the most important services offered by the new LLS. As discussed before, the students access the exam remotely, and all the student’s activities are collected and sent to the Fair Assessment Module (Cheating Detection system) for analysis. These students’ activities are considered the raw data, which are special-temporal data and contain five fields “the Timestamp, Button, State of the button, X, and Y coordinates,” as presented in detail in Table 1.
Before segmenting the data into actions, a cleaning process for the raw data is done to remove the duplicated lines. Furthermore, the records where the mouse cursor was moved outside the desktop window’s maximum X and Y coordinates are replaced by the previous X and Y coordinates values.
As shown in Figure 2, the Cheating Detection system performs a segmentation process of the collected mouse events to decide the mouse actions. Three actions are used, which are the MM (Mouse Movement) actions, which express the movement between two points on the screen. Moreover, PC (Point Click) actions denote a point click action. Furthermore, the DD (Drag and Drop) is used to express the drag and drop of a component from the screen. The segmentation phase distinguishes between MM, PC, and DD actions, as presented in [7], where the segmentation is done by cutting the raw collected data into several segments, and the segment ends with the mouse release event. Therefore, if a previous event is a mouse-pressed event and several mouse movements exist, so this segment type is PC action. However, if there are a number of mouse Drag and Drop that end with the mouse release event, so it is considered a segment of type DD action. Finally, the MM actions are isolated using a given threshold of time from the PC that contains mouse movement.
An explanation of how cleaning for data is performed after segmentation is presented as follows, where the action of the mouse is determined by a sequence of consecutive mouse instances. This sequence of mouse events starts with the mouse cursor at the desktop window position named ‘a’ and ends with the mouse cursor at position ‘b’. Each mouse action is segmented by a set of rules; for example, a DD action is a sequence of mouse events that starts with a left button pressed and ends with a left button released, and any sequence of events that does not comply with any action is neglected. A sequence of mouse events is represented as [   E 0 ( x 0 ,   y 0 ) ,   E 1 ( x 1 ,   y 1 ) ,   , E n   ( x n ,   y n ) ], where E 0 is mouse event with coordinates ( x 0 ,   y 0 ) . To interpolate this sequence of data, at least four events must be present, so any sequence with less than four instances is removed. Moreover, sequences that exceed a threshold of 10 s are split into two actions.
After cleaning, preprocessing the raw mouse data and performing the segmentation step to form mouse actions as a consecutive sequence mouse. These segments (sequences) are used to extract features for each individual mouse action, which is used to classify the input mouse actions and detect cheating or not. Only three fields are needed to calculate the features, x and y coordinates, and a time stamp with each point in the sequences, which are represented as a three-valued tuple ( x i , y i , t i ). Ɵ sequence is also calculated, which represents the angle of each point on the path tangent with the horizontal axis. So each point in the sequence is redefined to a four-valued tuple ( x i , y i , t i ,   θ i ).
Based on this definition, the following seven time series were computed: Horizontal_velocity, Vertical_velocity, Velocity, Curvature, Acceleration, Jerk, and Angular_velocity. A mathematical description of how to compute these seven time series is presented in detail in [7]. Furthermore, the standard deviation, mean, maximum and minimum values of these seven-time series were used as features that sum up to 28 features. Moreover, several other features were used, which are Type, Elapsed_time, Path_length, Dist_end_to_end, Direction, Straightness, Num_points, Sum_of_angles, Largest_deviation, Sharp_angles, and A_beg_time. As shown in Table 2, all 39 extracted features [7] are summarized with their description.
Regarding the variables that are used as a hyperparameter to the preprocessing algorithm are as follows: Global_action_time = 10, which represents the maximum duration of a sequence of events (in seconds). Moreover, the Min_action_length = 4 represents the Minimum length of a sequence. Furthermore, the Sharp_angle_threshold = 0.0005 represents the threshold for sharp angles. Finally, the number of (RDP) Remote Desktop Window leaving are X m a x   = 1920 and Y m a x   = 1080.
To avoid using any redundant variables, a feature selection technique is used. This technique is the sklearn RFECV method which uses recursive feature elimination with cross-validation to select desired features. Recursive feature elimination (RFE) is a way to select features by recursively considering smaller and smaller sets of features. Given an external estimator that assigns weights to features, first, the estimator is trained on the initial set of features and the importance of each feature is obtained either through a coef_ attribute or through a feature_importances_attribute. Then, the least important features are pruned from the current set of features. That procedure is recursively repeated on the pruned set until the desired number of features to select is eventually reached. The results of the sklearn RFECV method indicated that the 39 features are needed to be able to generalize better on unseetheyata, so the 39 features are used.
After extracting the features, different AI algorithms are used to classify inputs based on the extracted features. The classified output is used to indicate if the student is cheating or not. If the output of the classifier is a class (1) or (0), it means that the student is cheating or not, consequently.
A label is added to the LRO’s of a student and stored in the LLS database. As a consequence, when the instructor reads the LRO of a student to grade, they will find a variable to state whether this student is cheating or not; this helps him to give a fair evaluation of the student. Therefore, the LLS with Cheating Detection service is considered a completely fair assessment LLS.

4. Experimental Setup

As discussed before in the proposed LLS section, the instructor uses the authoring tool to design a new practical exam and then assign it to students. Therefore, the instructor designed exams that included both VRL-based questions and static questions. The experiments are performed in two different scenarios: First, the instructor designed exams that include the VRL questions, which used a VRL-specified component to add a C++ compiler as part of the exam running remotely on the laboratory server. Second, instructors designed exams that include both types of questions MCQ, true & false, and C++ coding questions.
For the previously discussed two test scenarios, the instructor assigned this exam to 50 students with differences in gender, academic year, and specialty. Afterward, the student opens the assigned exam from the Remote Machine Access Interface and starts the experiment, and this interface appears to the student as shown in Figure 4a for C++ coding questions and Figure 4b for MCQ and true & false questions. Figure 4 represents samples of VRL-based questions and static questions. The students start solving the practical exam by using mouse clicks and mouse movements. The Experimental Runtime Engine Module in the LLS collects all the mouse events fired on the screen and sends them to the Fair assessment component (Cheating system) for further analysis of data. A dataset from 50 colleagues is collected. Each colleague answered different questions for different exams, and each question was treated as a separate session. After combining the extracted features from all sessions, the dataset is described as shown in Table 3 and Table 4.
As shown in Table 4, the DD action is not used too much in the exams, as the exams include C++ coding problems which do not need drag and drop. Moreover, the static questions used in exams need little use of drag-and-drop questions.
The experiment was performed as follows; the students were asked to answer the questions in the exam honestly, then answer the questions again while cheating. Moreover, different cheating scenarios were performed, for example, some students were cheating on the internet, and others were cheating from their own PC or book. After each question, the raw data collected is saved for further analysis, as discussed before, for each test scenario. Two different methods are used for visualizing the distribution of observations in a dataset which are Histogram and kernel density estimate (KDE). As shown in the next subsections, raw data are collected for different types of questions.

4.1. Raw Data of Mouse Dynamics Collected for VRL-Based Questions

In this scenario, the designed exams include VRL-based questions, which are C++ coding questions and run a C++ compiler within the question. The exams are performed on four different C++ coding problems. The mouse movement behavior of 50 students answering a question honestly and while cheating is collected. As shown in Figure 5, Figure 6, Figure 7 and Figure 8 are samples of mouse dynamics movement of two different VRL-based questions answered by students, which are questions 1 and 3 using both the Histogram and kernel density estimate (KDE).
As shown in Figure 5, the mouse movement behavior of students answering question 1 honestly and then when they are cheating is presented. This mouse movement behavior is considered raw data collected, which is used to train the Cheating detection system. As shown in Figure 5a, when the students were answering the question, they performed many movements in the place of the terminal of the question on the right side of the screen. On the other side, in Figure 5b, when they cheated, the least movement is performed in place of the terminal of the question, and almost all movement is on the other side, which indicates cheating.
As shown in Figure 6b, a little to no movement, mostly in the right part of the screen where the terminal of the question can be noticed by the naked eye as a pattern of cheating. While in Figure 6a, the movement increases in the place of the question’s terminal. From Figure 5 and Figure 6, the differences in raw data (x and y coordinates) by using kernel density estimate (KDE) and Histogram methods for cheating and solving honestly are seen. As shown in Figure 7 and Figure 8, another C++ coding question is tested within the exam and the raw data of mouse dynamics is collected. From Figure 7a, it is noticed, as in Figure 5a, that almost the mouse movement of the student answering the question honestly is in the place of the question’s terminal.
However, in the case of cheating, as presented in Figure 7b, the least movement is in the question’s terminal place. Furthermore, the same observation is seen in Figure 8a,b, that in case of cheating, the mouse movement is scattered along the screen, while when solving the question honestly, most of the mouse movement is in the place of the question’s terminal.

4.2. Raw Data of Mouse Dynamics Collected for Static Questions

In this scenario, the designed exams include static questions, which are MCQ or true & false, or both questions. The exams are performed on four different collections of MCQ and true & false questions.
To cover all types of exam questions, the mouse movement behavior of 50 students answering static questions without cheating and with cheating is collected. As shown in Figure 9, Figure 10, Figure 11 and Figure 12, samples of mouse dynamic movement of two different collections of MCQ and true & false questions answered by students, which are questions 5 and 8 represented by the Histogram and kernel density estimate (KDE).
As presented in Figure 9a, when the students answered an exam containing several MCQ questions, almost all the mouse movements were in one place on the screen. On the other side, when the students cheat while answering the questions, the mouse movement behavior is across the whole screen as the students search through the internet for the solution to questions. As a consequence, they performed a lot of movement across the screen, as shown in Figure 9b.
Moreover, Figure 10 shows that students cheating while solving the questions performed more mouse movements than the students who were not cheating. For this reason, mouse dynamic movement can distinguish between cheating and non-cheating students.
As presented in Figure 11 and Figure 12, another sample of static questions, which includes true and false questions, is tested within the exam, and the raw data of mouse dynamics is collected. As shown in Figure 11a, the students performed less mouse movement when they answered the true and false questions honestly. However, when the students are allowed to cheat, they perform more mouse movements, as presented in Figure 11b. The results presented in Figure 12 show that as the students cheat, they perform more mouse movements than not cheating.
As shown in Figure 5, Figure 6, Figure 7, Figure 8, Figure 9, Figure 10, Figure 11 and Figure 12, the raw data of mouse dynamics for a sample of VRL-based questions and static questions are collected. These raw data showed that the cheating students could be distinguished from not cheating students from their mouse behavior for both static and VRL-based questions. As a consequence, the mouse behavior is sufficient to detect the cheating students with the least cost for any type of exam performed.
As shown in Figure 5, Figure 6, Figure 7, Figure 8, Figure 9, Figure 10, Figure 11 and Figure 12, the collected raw data of mouse movement varies for different questions. These differences in mouse dynamics for each student are due to the different behavior of students and the fact that each question is solved differently.

5. Evaluation Metrics and Results

After collecting the raw data and extracting features (as elaborated in the above sections). The preprocessed data are trained on several machine learning techniques and achieve a promising accuracy score of up to 90%.
The data are trained using very famous algorithms such as KNN, SVC, Random Forest, Logistic Regression, Extreme Gradian boost XGBoost, and lightGBM algorithm.
To properly test the model, the information about the prediction of the proposed model is gathered by using a confusion matrix. The confusion matrix is used to describe the performance of different classification models using the following measures: The first two measures are the True Positives (TP) and False Positive (FP), which are used to represent the number of positive values that are correctly predicted and that are wrongly predicted, respectively. The second two measures are the True Negative (TN) and False Negative (FN), which are used to represent the number of negative values that are correctly and wrongly predicted, respectively.
The following metrics are used [27] to compare the performance of different machine learning algorithms: The first metric is called Accuracy, which is used to measure the ratio between the correctly predicted positive and negative observation and the overall observation as shown in Equation (1).
A c c u r a c y = T P + T N T P + T N + F P + F N
The second used metric is Precision, which equals the ratio between the correctly predicted positive observation and the overall observation, as shown in Equation (2).
P r e c i s i o n = T P T P + F P
The third metric is the TPR stands for the True Positive Rate, which equals the ratio between the correctly predicted positive observation and the overall observation of the actual system, as shown in Equation (3).
T P R = T P T P + F N
The fourth metric is the FPR stands for the False Positive Rate, which equals the ratio between the falsely predicted positive observation and the overall observation of the actual system, as shown in Equation (4).
F P R = F P F P + T N
The last metric is the F1-score, which equals the ratio between the TPR and Precision values, as shown in Equation (5).
F 1 _ s c o r e = 2 ( T P R P r e c i s i o n ) T P R + P r e c i s i o n
And lastly, the receiver operating characteristic (ROC) is calculated, which plots the relationship between the true positive rate versus the false positive rate. Afterward, the Area Under the ROC curve (AUROC) for each AI algorithm is calculated. When the value of the AUROC curve increases, it is better because it measures the degree of separation.
As explained before, experiments are performed on two test scenarios to obtain accurate results which cover different types of questions. As shown in the subsection, results are collected for each test scenario using the explained metrics.

5.1. Results for the First Test Scenario

In this test scenario, the designed exams include only VRL-based questions, which are C++ coding examples and need to run a C++compiler within the question. After collecting the mouse movement and performing the extraction of features. The preprocessed data are trained on several mentioned machine learning techniques, and the metrics are calculated as shown in Figure 13 and Table 5.
As shown in Figure 13 and Table 5, the LightGBM algorithm is considered the best algorithm used in detecting cheating from un cheating students with a value of AUROC equal to 0.945, following the XGBoost, Random Forest, Logistic Regression, SCV, and KNN algorithms with values equal, 0.943, 0.93, 0.81, 0.81, 0.73, respectively. The calculated performance metrics for all AI algorithms used in classifying the student’s behavior are shown in Table 5. As observed from the results in Table 5, simpler machine learning models like KNN performed weakly on the data with only 70% accuracy and 73% AUROC.
More sophisticated machine learning algorithms such as SCV and Logistic Regression showed improvement in the overall accuracy, scoring 72% and 74 %, respectively, and having the same AUROC of 81%. From methods used with the ensembles, techniques are the bagging, stacking, and boosting methods. The bagging method is used to average the prediction of different samples of the same dataset. The stacking method fits many models on the same dataset, then uses another model to predict with it. The last method is the Boosting method, which is used to collect ensembles that are used in predictions made by previous models, then add them to the model sequentially and calculate the average prediction value.
The ensemble techniques were found to work best for the dataset, where the ensemble learning machine provides us with better results as it uses multiple models to perform classification.
From machine learning algorithm that uses the Bagging method is the Random Forest, which scores relatively well on the test dataset, with 86% of the predictions being correctly labeled and scoring 93% AUROC. The best scores were reached from the machine learning algorithms that were based on gradient boosting. Two of the most famous methods used are: Extreme gradient boosting and light gradient boosting machines, where both XGBoost and LightGBM scored the highest accuracy of 87% and 88%, respectively, on the test dataset. Furthermore, they showed robust improvement in the AUROC score resulting in 94.3% and 94.5%, respectively.

5.2. Results for the Second Test Scenario

In this test scenario, the designed exams include both the C++ coding experiments, MCQ, and true & false questions. In this scenario, the exam includes different types of questions that may exist in an exam. As explained before, after collecting the raw data and performing feature extraction. The preprocessed data are trained using the mentioned AI algorithms, and the results are calculated as shown in Figure 14 and Table 6.
As presented in Figure 14 and Table 6, the LightGBM algorithm gives the best results compared to the other AI algorithms. Furthermore, the results collected from exams include both types of static and VRL-based questions, which are comparable to that of exams that include only VRL-based questions. There is a relatively small difference between results in Table 5 and Table 6 due to the nature of static questions, which results in degradation in the five metrics for the KNN algorithm. However, the results of the five metrics show an enhancement for the LighjtGBM, XGBoost, and Random forest algorithms, as these algorithms use ensemble techniques, which work well for different types of datasets than in Table 5.
From the results in Table 6, it is noticed that the LightGBM algorithm is the best AI algorithm relative to XGBoost, Logistic Regression, Random Forest, SVC, and KNN algorithms, where it reaches an accuracy of 90%, while other reaches an accuracy of 88%, 77%, 87%, 73%, and 68%, respectively. Furthermore, LightGBM achieved the highest value of AUROC, which equals 95.6% relative to its competitors AI algorithms. As a consequence, the results collected for two scenarios, as presented in Table 5 and Table 6, showed that the LightGBM is better than its competitor’s algorithms. Therefore, it is better to use the LightGBM algorithm in training the preprocessed data for all types of exams.

6. Conclusions

The COVID-19 epidemic affected many students all over the world. As a consequence, a new online LLS is proposed to help the students to perform their practical experimentations remotely. The LLS allows the students to conduct online virtual and remotely controlled laboratory experimentations and exams. Furthermore, the main problem faced by online practical exams is the provision of a fair assessment for students. For this reason, the fair assessment module used to detect cheating is added to the new LLS. From many prior studies, the mouse dynamics were found from the commonly used biometric behavior to distinguish the behavior of users. Therefore, mouse dynamics are collected and segmented into three mouse actions PC, MM, and DD. Afterward, 39 features are extracted and trained using 6 different AI algorithms to detect cheating students. To get better results, the algorithms are trained to distinguish between the student’s mouse behavior when he/she is cheating and not cheating on the questions. Various numbers of experiments are performed for different students answering different types of questions, and the LightGBM algorithm achieved the best results of 90% accuracy and 95% degree of separation. One of the main limitations of the technique used is that it may be affected by the emotional state of the students while performing the exam, which may affect their mouse dynamics behavior. Furthermore, the different screen resolution for the collected mouse dynamics is one of the limitations facing the proposed algorithm. Moreover, the continuous monitoring of the mouse dynamics led to a huge number of collected mouse events for students while performing the experiment, including many redundant mouse events. As a consequence, to decrease the collected redundant mouse events, we need to enhance the proposed system to collect only the main events of mouse dynamics without redundancy. All these limitations should be taken into consideration in future work.

Author Contributions

Conceptualization, H.A.H.H., A.A.I., M.M.E. and A.M.A.E.-H.; data curation, H.A.H.H., A.A.I., M.M.E. and A.M.A.E.-H.; formal analysis, H.A.H.H., A.A.I. and M.M.E.; funding acquisition, M.M.E. and A.M.A.E.-H.; investigation, H.A.H.H., A.A.I., M.M.E. and A.M.A.E.-H.; methodology, H.A.H.H., A.A.I., M.M.E. and A.M.A.E.-H.; project administration, M.M.E. and A.M.A.E.-H.; resources, H.A.H.H., A.A.I., M.M.E. and A.M.A.E.-H.; software, A.A.I.; validation, H.A.H.H., A.A.I., M.M.E. and A.M.A.E.-H.; visualization, H.A.H.H., A.A.I., M.M.E. and A.M.A.E.-H.; writing—original draft, H.A.H.H. and A.A.I.; writing—review & editing, M.M.E. and A.M.A.E.-H. All authors have read and agreed to the published version of the manuscript.

Funding

This research is supported by the Academy of Scientific Research and Technology (ASRT) through the Egypt RDI/P4/1/20-21 program (2021–2023). Any opinions, findings, conclusions, or recommendations expressed in this material are those of the author(s) and do not necessarily reflect the views of ASRT.

Institutional Review Board Statement

Not applicable.

Informed Consent Statement

Not applicable.

Data Availability Statement

The data used to support the findings of this paper are available from the corresponding author upon reasonable request.

Acknowledgments

This research is a part of a research project supported by the Academy of Scientific Research and Technology (ASRT) through the Egypt RDI/P4/1/20-21 program (2021–2023).

Conflicts of Interest

The authors declare that they have no conflicts of interest.

References

  1. Khtere, R.; Yousef, A.M.F. The professionalism of online teaching in Arab universities: Validation of faculty readiness. Educ. Technol. Soc. 2021, 24, 1–12. [Google Scholar]
  2. Liang, K.; Zhang, Y.; He, Y.; Zhou, Y.; Tan, W.; Li, X. Online Behavior Analysis-Based Student Profile for Intelligent E-Learning. J. Electr. Comput. Eng. 2017, 2017, 9720396. [Google Scholar] [CrossRef] [Green Version]
  3. Han, Q.; Su, J.; Zhao, Y. More Adaptive and Updatable: An Online Sparse Learning Method for Face Recognition. J. Electr. Comput. Eng. 2019. [Google Scholar] [CrossRef]
  4. Elmesalawy, M.M.; Atia, A.; Yousef, A.M.F.; El-Haleem, A.M.A.; Anany, M.G.; Elmosilhy, N.A.; Salama, A.I.; Hamdy, A.; El Zoghby, H.M.; El Din, E.S. AI-based Flexible Online Laboratory Learning System for Post-COVID-19 Era: Requirements and Design. In Proceedings of the 2021 International Mobile, Intelligent, and Ubiquitous Computing Conference (MIUCC), Cairo, Egypt, 26–27 March 2021; pp. 1–7. [Google Scholar] [CrossRef]
  5. Jain, A.; Ross, A.; Pankanti, S. Biometrics: A Tool for Information Security. IEEE Trans. Inf. Forensics Secur. 2006, 1, 125–143. [Google Scholar] [CrossRef] [Green Version]
  6. Milisavljevic, A.; Abate, F.; Le Bras, T.; Gosselin, B.; Mancas, M.; Doré-Mazars, K. Similarities and Differences Between Eye and Mouse Dynamics During Web Pages Exploration. Front. Psychol. 2021, 12, 554595. [Google Scholar] [CrossRef] [PubMed]
  7. Antal, M.; Egyed-Zsigmond, E. Intrusion detection using mouse dynamics. IET Biom. 2019, 8, 285–294. [Google Scholar] [CrossRef] [Green Version]
  8. Bours, F.P.; Fullu, C. A Login System Using Mouse Dynamics. In Proceedings of the 5th International Conference on Intelligent Information Hiding and Multimedia Signal Processing, Kyoto, Japan, 12–14 September 2009; pp. 1072–1077. [Google Scholar]
  9. Salman, O.A.; Hameed, S.M. User Authentication via Mouse Dynamics. Iraqi J. Sci. 2018, 59, 963–968. [Google Scholar]
  10. Zheng, N.; Paloski, A.; Wang, H. An efficient user verification system via mouse movements. In Proceedings of the ACM Conference on Computer and Communications Security, Chicago, IL, USA, 17–21 October 2011; pp. 139–150. [Google Scholar] [CrossRef]
  11. Jorgensen, Z.; Yu, T. On mouse dynamics as a behavioral biometric for authentication. In Proceedings of the 6th ACM Symposium on Information, Computer and Communication Security, Hong Kong, China, 22–24 March 2011; pp. 476–482. [Google Scholar] [CrossRef]
  12. Berezniker, A.V.; Kazachuk, M.A.; Mashechkin, I.V.; Petrovskiy, M.I.; Popov, I.S. User Behavior Authentication Based on Computer Mouse Dynamics. Mosc. Univ. Comput. Math. Cybern. 2021, 45, 135–147. [Google Scholar] [CrossRef]
  13. Earl, S.; Campbell, J.; Buckley, O. Identifying Soft Biometric Features from a Combination of Keystroke and Mouse Dynamics. In Advances in Human Factors in Robots, Unmanned Systems and Cybersecurity; AHFE 2021; Lecture Notes in Networks and Systems; Springer: Cham, Switzerland, 2021; pp. 184–190. [Google Scholar]
  14. Almalki, S.; Assery, N.; Roy, K. An Empirical Evaluation of Online Continuous Authentication and Anomaly Detection Using Mouse Clickstream Data Analysis. J. Appl. Sci. 2021, 11, 6083. [Google Scholar] [CrossRef]
  15. Krátky, P.; Chudá, D. Recognition of web users with the aid of biometric user model. J. Intell. Inf. Syst. 2018, 51, 621–646. [Google Scholar] [CrossRef]
  16. Trezise, K.; Ryan, T.; de Barba, P.; Kennedy, G. Detecting Contract Cheating Using Learning Analytics. J. Learn. Anal. 2019, 6, 90–104. [Google Scholar] [CrossRef]
  17. Bawarith, R.; Basuhail, A.; Fattouh, A.; Gamalel-Din, S. E-exam Cheating Detection System. Int. J. Adv. Comput. Sci. Appl. 2017, 8, 176–181. [Google Scholar] [CrossRef] [Green Version]
  18. Pepa, L.; Sabatelli, A.; Ciabattoni, L.; Monteriù, A.; Lamberti, F.; Morra, L. Stress Detection in Computer Users from Key-board and Mouse Dynamics. IEEE Trans. Consum. Electron. 2021, 67, 12–19. [Google Scholar] [CrossRef]
  19. Gamboa, H.; Fred, A. A behavioral biometric system based on human-computer interaction. SPIE Biom. Technol. Hum. Identif. 2004, 5404, 381–393. [Google Scholar] [CrossRef]
  20. Zheng, N.; Paloski, A.; Wang, H. An Efficient User Verification System Using Angle-Based Mouse Movement Biometrics. ACM Trans. Inf. Syst. Secur. 2016, 18, 1–27. [Google Scholar] [CrossRef]
  21. Siddiqui, N.; Dave, R.; Seliya, N. Continuous authentication using mouse movements, machine learning, and Minecraft. arXiv 2021, arXiv:2110.11080. [Google Scholar]
  22. Garabato, D.; Dafonte, C.; Santoveña, R.; Silvelo, A.; Nóvoa, F.J.; Manteiga, M. AI-based user authentication reinforcement by continuous extraction of behavioral interaction features. Neural Comput. Applic. 2022, 34, 11691–11705. [Google Scholar] [CrossRef]
  23. Sokout, H.; Purnama, F.; Mustafazada, A.N.; Usagawa, T. Identifying potential cheaters by tracking their behaviors through mouse activities. Proceeding of the 2020 IEEE International Conference on Teaching, Assessment, and Learning for Engineering, Takamatsu, Japan, 8–11 December 2020. [Google Scholar] [CrossRef]
  24. Li, H.; Xu, M.; Wang, Y.; Wei, H.; Qu, H. A visual analytics approach to facilitate the proctoring of online exams. In Proceedings of the 2021 CHI Conference on Human Factors in Computing Systems, Yokohama, Japan, 8–13 May 2021; pp. 1–17. [Google Scholar]
  25. Available online: https://www.myrtille.io/ (accessed on 1 August 2022).
  26. Ahmed, A.A.E.; Traore, I. A New Biometric Technology Based on Mouse Dynamics. IEEE Trans. Dependable Secur. Comput. 2007, 4, 165–179. [Google Scholar] [CrossRef]
  27. Almalki, S.; Chatterjee, P.; Roy, K. Continuous Authentication Using Mouse Clickstream Data Analysis. In Security, Privacy, and Anonymity in Computation, Communication, and Storage; SpaCCS 2019; Lecture Notes in Computer Science; Springer: Cham, Switzerland, 2019; Volume 11637. [Google Scholar]
Figure 1. The architecture of the online Laboratory Learning System.
Applsci 12 11416 g001
Figure 2. The architecture of the fair assessment module.
Applsci 12 11416 g002
Figure 3. Eight existing directions.
Applsci 12 11416 g003
Figure 4. Screenshots for designed exams are as follows: (a) a screenshot of a C++ coding question; (b) a screenshot of a true & false question.
Applsci 12 11416 g004
Figure 5. 2-d KDE plot showing the density distribution of raw mouse cursor movements of students as follows: (a) a KDE plot of question 1 answered by students without cheating; (b) a KDE plot of question 1 answered by students who are allowed to cheat.
Applsci 12 11416 g005
Figure 6. A histogram of raw mouse movements showing the difference in the frequency of movements is as follows: (a) a KDE plot of question 1 answered by students without cheating; (b) a KDE plot of question 1 answered by students who are allowed to cheat.
Applsci 12 11416 g006
Figure 7. 2-d KDE plot showing the density distribution of raw mouse cursor movements of students as follows: (a) a KDE plot of question 3 answered by students without cheating; (b) a KDE plot of question 3 answered by students who are allowed to cheat.
Applsci 12 11416 g007
Figure 8. A histogram of raw mouse movements showing the difference in the frequency of movements is as follows: (a) a KDE plot of question 3 answered by students without cheating; (b) a KDE plot of question 3 answered by students who are allowed to cheat.
Applsci 12 11416 g008
Figure 9. 2-d KDE plot showing the density distribution of raw mouse cursor movements of students as follows: (a) a KDE plot of question 5 answered by students without cheating; (b) a KDE plot of question 5 answered by students who are allowed to cheat.
Applsci 12 11416 g009
Figure 10. A histogram of raw mouse movements showing the difference in the frequency of movements is as follows: (a) a KDE plot of question 5 answered by students without cheating; (b) a KDE plot of question 5 answered by students who are allowed to cheat.
Applsci 12 11416 g010
Figure 11. 2-d KDE plot showing the density distribution of raw mouse cursor movements of students as follows: (a) a KDE plot of question 8 answered by students without cheating; (b) a KDE plot of question 8 answered by students who are allowed to cheat.
Applsci 12 11416 g011
Figure 12. A histogram of raw mouse movements showing the difference in the frequency of movements is as follows: (a) a KDE plot of question 8 answered by students without cheating; (b) a KDE plot of question 8 answered by students who are allowed to cheat.
Applsci 12 11416 g012
Figure 13. The receiver operating characteristic curve (ROC) for the exam includes the VRL-based questions.
Applsci 12 11416 g013
Figure 14. The receiver operating characteristic curve (ROC) for exams includes VRL-based and static questions.
Applsci 12 11416 g014
Table 1. Raw data fields.
FieldDescription
Time StampThe elapsed time in seconds since the start of the session
Button The current condition of the mouse buttons (e.g., Left)
State Contains additional information about the button (e.g., Pressed)
X X coordinates of the mouse cursor
Y Y coordinates of the mouse cursor
Table 2. Features extracted from each mouse action.
Feature Name Description#Features
Horizontal_velocity Measure the mean, standard deviation, maximum and minimum values of the horizontal velocity of the mouse events 4
Vertical_velocity Measure the mean, standard deviation, maximum and minimum values of the vertical velocity of the mouse events 4
Velocity Measure the mean, standard deviation, maximum and minimum values of the velocity of the mouse events 4
Acceleration Measure the mean, standard deviation, maximum and minimum values of the acceleration of the mouse events 4
Jerk Measure the mean, standard deviation, maximum and minimum values of the jerk of the mouse events 4
Angular_velocity Measure the mean, standard deviation, maximum and minimum values of the angular velocity of the mouse events 4
Curvature Measure the mean, standard deviation, maximum and minimum values of the curvature time series of the mouse events (i.e., curvature time series equals the ratio between the traveled distance and the change in angle) 4
Type Type of mouse click, which may be MM or PC 1
Elapsed_time Measure the elapsed time needed to perform a specific action 1
Path_length Measure the length of the path from the starting point to the n points of a specific mouse action 1
Dist_end_to_end Is the distance of the end-to-end line of an action 1
Direction Measure the direction of the end-to-end line. As in Figure 3, if the angle is between 0° and 45°, so it is direction 1 [26]1
Straightness Measure the ratio between the Dist_end_to_end and the Path_length 1
Num_points The number of points (mouse events) that exist in each mouse action. 1
Sum_of_angles The sum of the angles for each mouse action 1
Largest_deviation The largest deviation for each mouse action. 1
Sharp_angles The number of sharp angles less than the threshold value, which equals 0.0005 1
A_beg_time Acceleration time at the beginning segment 1
Table 3. Distribution of dataset.
Rows
(Number of Actions)
Columns (Label + 39 Extracted Features +
Start and Endpoint for Each Action)
Percentage
Total3859421.0
Train2585420.67
Test1274420.33
Table 4. The number of different actions present in test and train datasets.
MM PCDD
Train561 (21%)1998 (77%)26 (1%)
Test272(21.1%)989 (77.6%)13 (1.3%)
Table 5. A detailed description of the used machine learning algorithms and the metrics used to test these models for exams, including the VRL-based questions.
Algorithms/MetricsAccuracyPrecisionTPRF1-ScoreAUROC
KNN 0.70 0.59 0.51 0.55 0.73
SVC 0.72 0.77 0.33 0.46 0.81
Random Forest 0.86 0.87 0.73 0.79 0.93
Logistic Regression 0.74 0.73 0.43 0.54 0.81
XGBoost 0.87 0.88 0.77 0.82 0.943
LightGBM0.88 0.88 0.78 0.83 0.945
Table 6. A detailed description of the used machine learning algorithms and the metrics used to test these models for exams, including both VRL-based and static questions.
Algorithms/MetricsAccuracyPrecisionTPRF1-ScoreAUROC
KNN0.680.540.500.520.71
SVC0.730.700.400.510.81
Random Forest0.870.870.740.800.94
Logistic Regression0.770.690.600.640.80
XGBoost0.880.840.800.820.952
LightGBM0.900.880.820.850.956
Publisher’s Note: MDPI stays neutral with regard to jurisdictional claims in published maps and institutional affiliations.

