Abstract
An experimental investigation has been carried out to evaluate the effectiveness of Polyvinyl chloride (PVC) confinements in short plain circular concrete columns. The experimental part is conducted using different tube diameters (110, 160, 220, and 250 mm) with two types of confinement strategies (fully and confined with the cut ends). The results are validated with unconfined samples (control samples). The test results showed that using external confinement of concrete columns by PVC tubes enhances the ultimate load capacity of the short columns. For fully confined samples, the enhancement ratio ranges between 5% and 8.3%, and from 4.16% to 15% for samples with cut ends. Furthermore, the confining of PVC pipes with the cut ends has a more considerable effect on load capacity for all diameters except the ones with 250 mm, where the samples with full confinement () carried a bigger load than those with cutting ends. Finally, a numerical simulation of samples is carried out by the finite element model using the software. For all scenarios, the results of the numerical analysis showed considerable similarity to the experimental results, with of 0.95 indicating the high linearity between the actual and simulated compressive strength values. Moreover, the induces fewer simulated errors with a relative error ranging from 0.16% to 6% for all scenarios.
1. Introduction
In the last decades, the construction industry has become increasingly focused on strengthening and repairing rapidly deteriorating concrete columns, specifically those in harsh environments, such as seawater and acidic areas, where the structure is subjected to severe chemicals leading to corrosion in concrete or steel reinforcement in constructions with this kind of reinforcement [1,2]. Furthermore, lacking lateral confinement and low capacity regarding energy absorption are considered the most significant drawbacks of columns [3,4]. Consequently, researchers have conducted many studies to increase durability and protect the concrete columns during construction [5,6,7,8,9].
In this regard, a concrete fill tube is considered one of the most effective strategies to overcome the above issues. The term involves a tube (confining tube) filled with plain or reinforced concrete, creating a hybrid system (composite material) with considerable ductility, high bearing capacity, and better energy absorption [10,11,12]. Steel tubes and fiber-reinforced polymer tubes are considered the most commonly used materials to improve the compressive strength of concrete [8]. The process of confining concrete columns with steel tubes has led to remarkable strides in improving the compressive strength, stiffness, and ductility of concrete columns due to the high mechanical properties of steel tubes [13,14]. However, the steel tubes serve as an outside layer, making them susceptible to corrosion and limiting their applications. On the other hand, concrete-filled tubes showed a remarkable resistance against corrosion, making them a suitable material in critical construction sites, such as bridges and ocean constructions [15,16,17]. Furthermore, the confinement of tubes enhances the compressive strength, ductility, and stiffness of concrete columns [18,19,20,21,22,23]. However, their practical use is limited due to their high price [24], low fire resistance [25], and not being applicable on wet or dumped surfaces [26].
Meanwhile, another confining material known as Polyvinyl chloride has drawn the attention of many researchers due to several attributes, such as high resistance to corrosion, light weight, which allows easy handling, impermeability to fluids or gases, low price, and durability (life cycle is more than 50 years in civil constructions) [27,28,29]. P.K. Gupta [30] studied the performance of concrete columns with different compressive strengths confined with different diameters of unplasticized polyvinyl chloride tubes. Their results showed a good enhancement in load-bearing capacity, ductility, and energy absorption of concrete columns. Oyawa et al. [31] showed a significant increase in the compressive strength of concrete columns confined with tubes compared to unconfined ones. Askari et al. [32] investigated the performance of reinforced concrete columns with polypropylene fibers confined with tubes. The results showed that the confinement of tubes improved the loading-bearing capacity and ductility of the concrete columns.
Given these facts, this study investigates the performance of confining short columns with different diameters with PVC tubes experimentally. Furthermore, this study investigates the influence of different confining strategies on the compressive strength of short columns. Finally, after developing a robust numerical simulation based on the finite element approach to reproduce the experimental results, obtain a well-calibrated nonlinear model and study the behavior of short columns with different confining strategies under uniaxial loads.
2. Experimental Programs
2.1. Specimens Preparation
The short column specimens are prepared using three different confining scenarios (fully confined , confined with cutting 1 cm from ends and unconfined with four different circular diameters (110, 160, 220, and 250 mm)) to examine the performance of the short columns reinforced with tubes under axial loading. The height to diameter ratio was taken as 3 to ensure that columns act like short columns and to minimize the effect of slenderness. Table 1 shows more details about the specimens.

Table 1.
Details of specimens.
Table 1.
Details of specimens.
| D/mm | H/mm | t/mm |
|---|---|---|
| 110 | 330 | 10 |
| 160 | 480 | 10 |
| 220 | 660 | 10 |
| 250 | 750 | 10 |
Where is the thickness of the tube. Figure 1 shows tubes used in this study.

Figure 1.
The four different circular tubes diameters used in the study.
Figure 1.
The four different circular tubes diameters used in the study.

2.2. Material Properties
Ordinary Portland cement from Al-Mas Company is used in this study. The physical and mechanical properties of cement are shown in Table 2.
Table 2.
The physical and mechanical properties of ordinary Portland cement.
As a fine aggregate, natural sand is used, conforming to Iraqi Specifications No. 45/1984. Figure 2 and Table 3 show the results of the conducted sieve analysis.
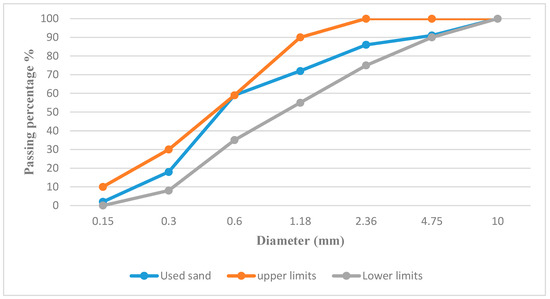
Figure 2.
Grading curve for fine aggregate.
Table 3.
Sieve analysis results of used sand.
Natural gravel with a size of 14 mm is used as coarse aggregate, conforming to Iraqi Specifications No. 45/1984. Figure 3 and Table 4 show the sieve analysis results of the used coarse aggregate.
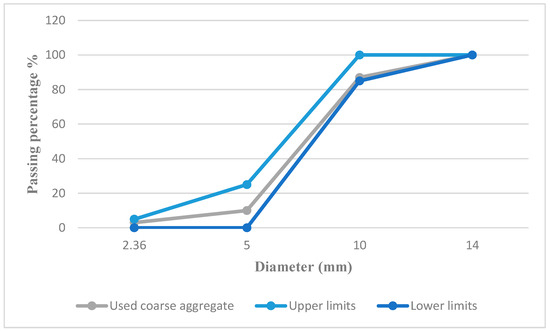
Figure 3.
Grading curve of coarse aggregate.
Table 4.
Sieve analysis results of used coarse aggregate.
Finally, regular tap water is used with a ratio of 0.41 for all specimens.
For the tubes, commercial water supply PVC pipes which conform to the ASTM D1785 schedule 40 standards [33] are used. The properties of the tubes are shown in Table 5.
Table 5.
Properties of PVC.
2.3. Specimens
For each scenario, a total of 12 specimens (three specimens for each diameter) are cast using a mixing ratio of 1:2:4 and a ratio of 0.41. The mixture was prepared in the laboratory using a mechanical mixture with a capacity of 1 as shown in Figure 4. Then, the mixture is cast in the tubes (see Figure 5) and cured for 7 and 28 days in basin water at room temperature. Table 6 shows details about specimen distribution for each scenario and for four different diameters taking into consideration two different curing periods. The compression strength test is conducted using a hydraulic compression strength machine with a capacity of (3000 KN).
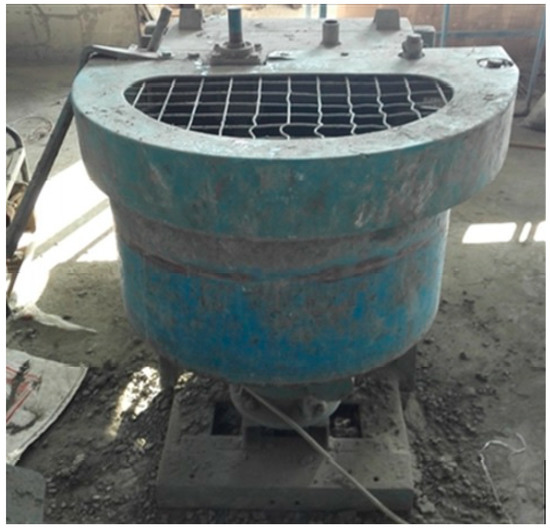
Figure 4.
Mechanical mixture with 1 m3 capacity.
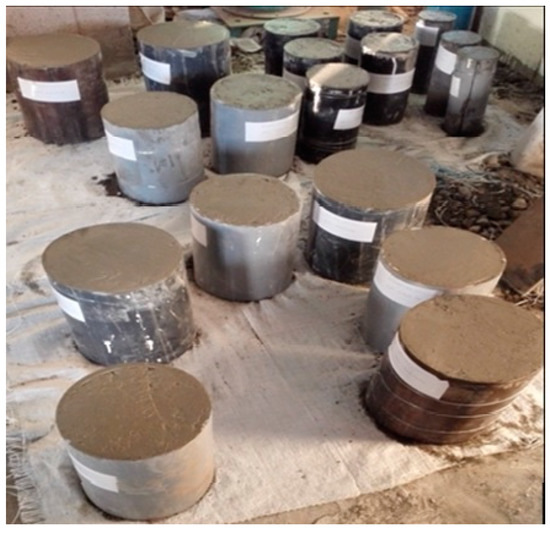
Figure 5.
Casted specimens.
Table 6.
Distribution of specimens for each scenario, diameter and curing period.
3. Experimental Results
The compressive strength testing results for each scenario and diameter at the age of seven days are illustrated in Table 7. It can be observed that the columns for 110, 160, and 220 mm of diameter provide the highest compressive strength compared to and columns due to lateral confining of columns which increases the load-bearing capacity, and the tube cutting ends help to restrict the tube function for confining only. However, with a 250 mm diameter, the improvement of compressive strength in columns are less than in columns leading the latter to provide higher compressive strength. On the other hand, the columns provide better compressive strength than columns for all diameters due to the full confining of the column, which causes the applied load to be distributed on both the concrete and the tube. However, this distribution of force limits some of the confining functionality of columns, which affects the loading bearing capacity of the columns. Table 8 shows the enhancement due to the tube confinement for both , and types. The improvement reaches the highest (15% for and 8.3% for columns) when the column diameter is 110 mm and starts to decrease as the diameter increases.
Table 7.
Compressive strength at the age of 7 days.
Table 8.
The improvement of compressive strength using tubes at 7 days.
The compressive strength results at 28 days are presented in Table 9 and Figure 6. The results showed that the columns yield the highest compressive strength compared to and columns for all diameters except at 250 mm where columns yielded slightly higher compressive strength than columns. Furthermore, the percentage of enhancement using tubes is presented in Table 10. According to Table 10, the highest enhancement is achieved at the diameter of 110 mm, reaching a percentage of 15% for and 8.3% for columns, then starting to decline as the diameter increases. Table 8 and Table 10 show that using PVC tubes enhanced the short columns’ compressive strength by the same ratio by seven and 28 days.
Table 9.
Compressive strength at the age of 28 days.
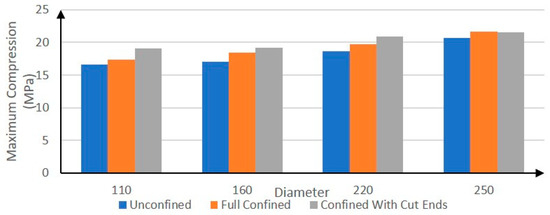
Figure 6.
Comparison between each scenario in terms of compressive strength at 28 days.
Table 10.
The improvement of compressive strength using tubes at 28 days.
The failure mode of specimens is presented in Figure 7. It can be noticed that there is some buckling in small diameters confined specimens, such as 110 mm, due to the small diameter compared with the specimen’s length. Moreover, in unconfined specimens, it is noticed that the failure started in ends with a breaking of ends and then longitudinal cracks. Furthermore, the failure of fully confined samples was slower than that in unconfined samples. That is due to the role of PVC pipe in confining the concrete and increasing the compression strength. This situation involved more confining activity with cut samples where the pipe played the confining role only without carrying any compression load.
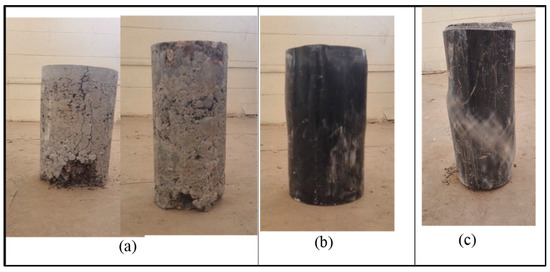
Figure 7.
Mode of failure (a) unconfined samples (b) fully confined samples (c) confined with cut ends.
4. Numerical Analysis
In parallel to the experimental studies as illustrated above, finite element analyses have been carried out using software to support the experimental findings. FE model was developed to analyze the compressive behavior of confined and unconfined columns. FE model is shown in Figure 8. Solid element C3D8R is used for concrete and PVC pipe. The boundary conditions are shown in Figure 9. The load control (pressure load) simulates the compression load on columns. Contact interaction was defined between the inner surface of the PVC pipe and the external side surface of concrete columns, as shown in Figure 10. Hard contact is applied in the normal direction, and penalty friction is in the tangential direction with a friction coefficient of 0.3. The loading process of the sample was by applying a pressure load on the upper face of the sample. The pressure was applied by selecting smooth step amplitude in ABAQUS software (version 6.6). A concrete damage plasticity model is used for concrete. Equations (1)–(3) are used to develop the parameters of concrete damage plasticity, which are adopted from [34,35]. The stress–strain curves for the tension and compression of concrete are shown in Figure 11 and Figure 12. Compression and tension damage of concrete are shown in Figure 13 and Figure 14.
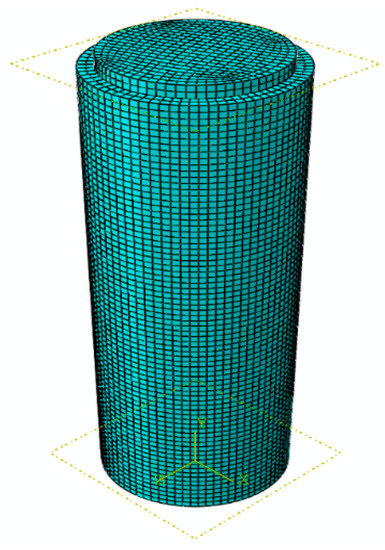
Figure 8.
Meshed model of the confined column with cut ends of PVC.
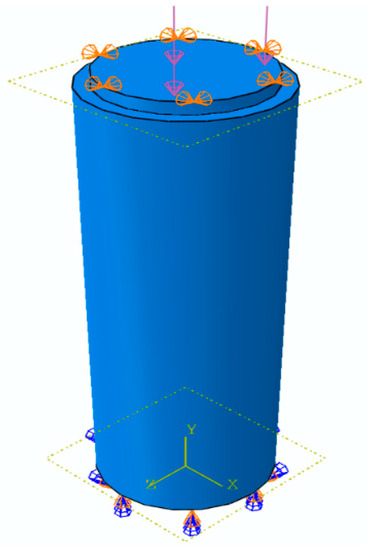
Figure 9.
Loading and boundary conditions.
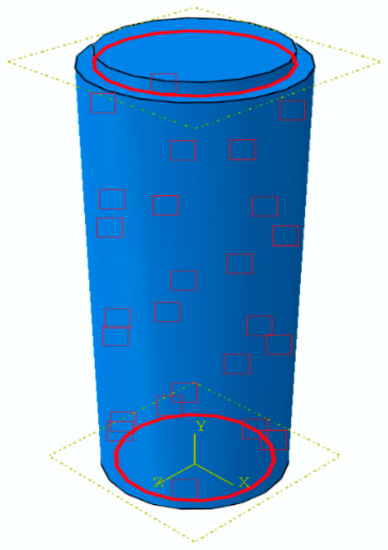
Figure 10.
Interaction between PVC inner surface and side surface of the concrete.
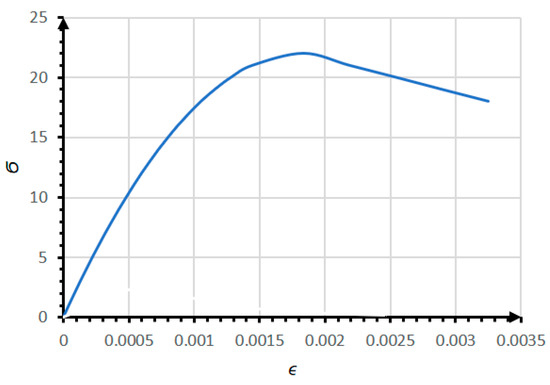
Figure 11.
Stress-strain curve for compression stress in concrete.
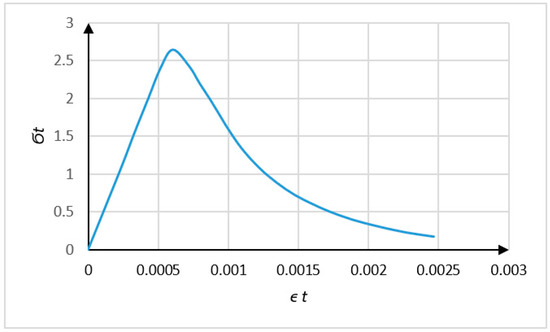
Figure 12.
Stress-strain for tension stress in concrete.
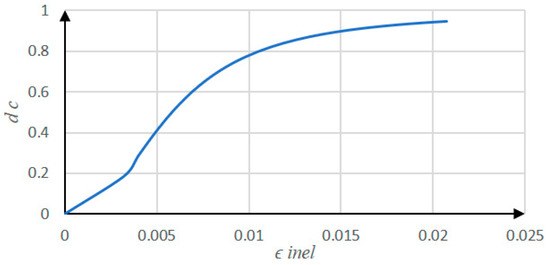
Figure 13.
Damage of concrete in compression.
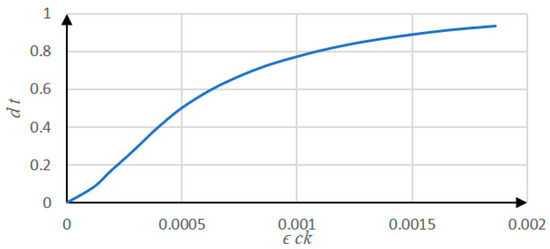
Figure 14.
Damage of concrete in tension.
For ,
For
The results of the numerical analyses are illustrated in Table 11. According to Table 11, the numerical analysis results are significantly similar to the experimental ones for all diameters. For further assessment of the performance of the approach, scatter and relative error plots are utilized, as shown in Figure 15 and Figure 16. Figure 15 shows the relation between the actual and simulated compressive strength for all scenarios combined (12 samples) based on a statistical parameter called the coefficient of determination and it is mathematically expressed in Equation (4) below.
where are the actual and predicted compressive strength values, respectively. is the mean of the actual values. According to Figure 15, the approach provides of 0.95, which indicates the robustness of the approach in simulating the compressive strength value. Figure 16 shows the FE approach’s relative error distribution for all diameters considering all scenarios combined (12 samples). According to Figure 16, the range of the of the approach is between 0.16% and 6%, with only one value with less than 10%, which indicates that the approach can efficiently simulate the compressive strength.
Table 11.
The results of the numerical analysis.
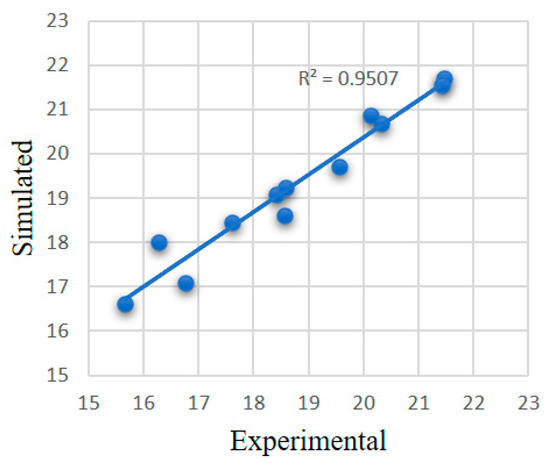
Figure 15.
Comparison between the actual and simulated compressive strength values for all scenarios.
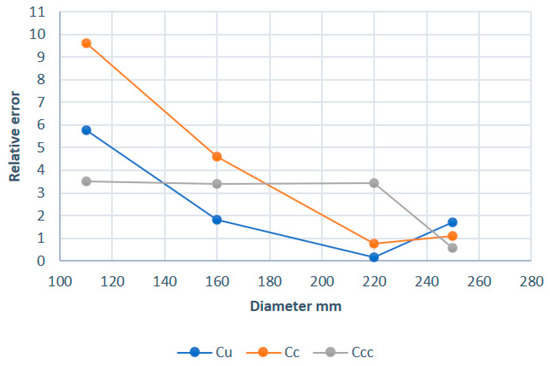
Figure 16.
Relative error distribution for each diameter using the FE approach for all scenarios.
Additionally, according to analysis, the samples with 250 mm diameter showed that the confining with cut ends provides lower load-bearing capacity than those confined fully. Furthermore, the failure mode is similar to what happened in the experimental part, as shown in Figure 17, Figure 18, Figure 19 and Figure 20, illustrating some buckling for fully confined samples, such as 110 mm, due to their small diameter compared to their length. Moreover, in unconfined samples, the failure mode provided by the FE model is similar to experimental results, which start at the samples’ end before longitudinal cracks occur.
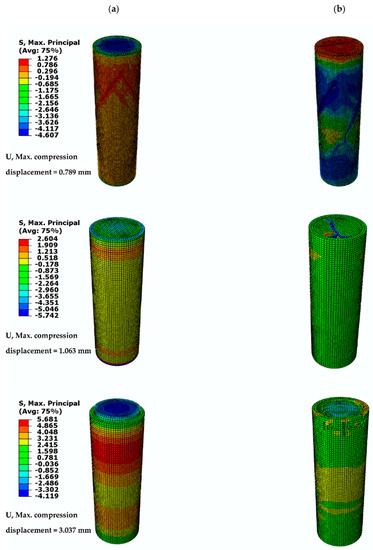
Figure 17.
The failure mode of 110 mm samples with max principle stress. (a) before failure (b) after failure.
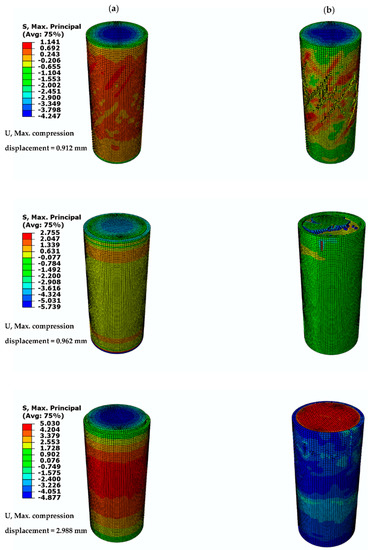
Figure 18.
The failure mode of 160 mm samples with max principle stress. (a) before failure (b) after failure.
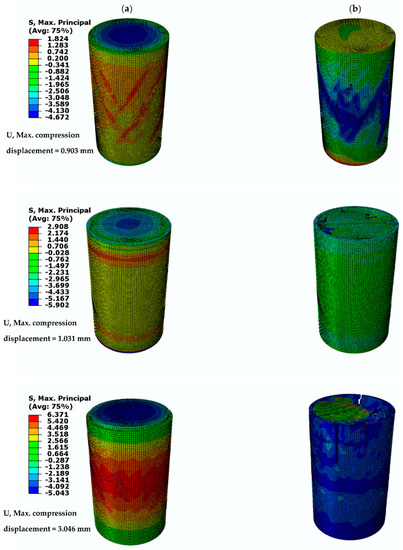
Figure 19.
The failure mode of 220 mm samples with max principle stress. (a) before failure (b) after failure.
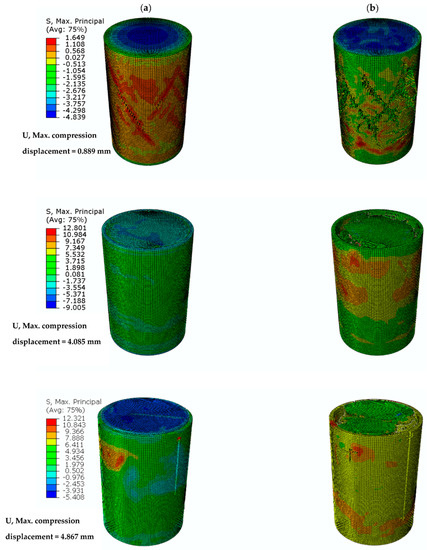
Figure 20.
The failure mode of 250 mm samples with max principle stress. (a) before failure (b) after failure.
5. Conclusions
This paper investigates the performance of the tubes for short circular columns using experimental and numerical approaches. Moreover, the effect of confining strategy on the compressive strength of short columns has been studied. Considering different diameters, confining methods, and testing ages, the experimental work showed a difference in the compression strength values of the confined column, unconfined column, and the confined column with the cut ends. In general, confining short columns with tubes enhances the compressive strength of short columns. For fully confined samples, the enhancement varied between 5% and 8.3% with respect to column diameter. On the other hand, the enhancement varied between 4.16% to 15% for samples with cut ends. Moreover, the confining with cut ends showed better compressive strength than those fully confined except for the ones with 250 mm diameter, where the latter showed slightly better compressive strength. Moreover, confining short columns with tubes in both strategies enhanced the compressive strength of short columns at seven and 28 days age by the same ratio. Considering different diameters and confining methods, the failure mode happened in two scenarios, the first through the buckling of the PVC tubes and the second through the shear failure in the concrete core. Finally, the numerical analysis results for compressive strength and failure mode have been investigated using the approach. The results of the numerical simulation are validated against the experimental ones using two statistical matrices and . The model demonstrates high efficiency in simulating the experimental results by providing high simulating accuracy () and fewer simulating errors ( between 0.16 and 6%). Additionally, the failure mode obtained by the model is significantly similar to the experimental one. For more improvement of the results, it is recommended for future research to utilize the UPVC as a replacement for PVC as well as an oval shape, which could also improve the performance.
Author Contributions
Data curation, A.A.H.; formal analysis, F.K.; funding acquisition, M.M.H.K.; methodology, A.A.H., H.A.A. and A.A.H.S.; resources, M.M.H.K.; software, A.A.H.; supervision, H.A.A. and A.A.H.S.; visualization, F.K.; writing—original draft, A.A.H. and A.A.H.S.; writing—review & editing, F.K., H.A.A. and M.M.H.K. All authors have read and agreed to the published version of the manuscript.
Funding
This research partially supported by INTI International University, Malaysia and by Al-Maarif University College, Ramadi, Iraq under Grant no. (DCE-0111).
Institutional Review Board Statement
Not applicable.
Informed Consent Statement
Not applicable.
Data Availability Statement
Not applicable.
Conflicts of Interest
The authors declare no conflict of interest.
References
- Wang, L.; Yang, Z.; Cui, Y.; Wei, B.; Xu, S.; Sheng, J.; Wang, M.; Zhu, Y.; Fei, W. Graphene-copper composite with micro-layered grains and ultrahigh strength. Sci. Rep. 2017, 7, 41896. [Google Scholar] [CrossRef] [PubMed]
- Bazli, M.; Zhao, X.-L.; Raman, R.K.S.; Bai, Y.; Al-Saadi, S. Bond performance between FRP tubes and seawater sea sand concrete after exposure to seawater condition. Constr. Build. Mater. 2020, 265, 120342. [Google Scholar] [CrossRef]
- Yuan, W.; Yang, J. Experimental and numerical studies of short concrete-filled double skin composite tube columns under axially compressive loads. J. Constr. Steel Res. 2013, 80, 23–31. [Google Scholar] [CrossRef]
- Schneider, S.P. Axially loaded concrete-filled steel tubes. J. Struct. Eng. 1998, 124, 1125–1138. [Google Scholar] [CrossRef]
- Al-Gemeel, A.N.; Zhuge, Y. Using textile reinforced engineered cementitious composite for concrete columns confinement. Compos. Struct. 2019, 210, 695–706. [Google Scholar] [CrossRef]
- Shan, B.; Gui, F.C.; Monti, G.; Xiao, Y. Effectiveness of CFRP confinement and compressive strength of square concrete columns. J. Compos. Constr. 2019, 23, 4019043. [Google Scholar] [CrossRef]
- Faleschini, F.; Zanini, M.A.; Hofer, L.; Toska, K.; De Domenico, D.; Pellegrino, C. Confinement of reinforced concrete columns with glass fiber reinforced cementitious matrix jackets. Eng. Struct. 2020, 218, 110847. [Google Scholar] [CrossRef]
- Feng, C.; Yu, F.; Fang, Y. Mechanical behavior of PVC tube confined concrete and PVC-FRP confined concrete: A review. Structures 2021, 31, 613–635. [Google Scholar] [CrossRef]
- Yu, F.; Li, D.; Niu, D.; Zhu, D.; Kong, Z.; Zhang, N.; Fang, Y. A model for ultimate bearing capacity of PVC-CFRP confined concrete column with reinforced concrete beam joint under axial compression. Constr. Build. Mater. 2019, 214, 668–676. [Google Scholar] [CrossRef]
- Roeder, C.W.; Cameron, B.; Brown, C.B. Composite action in concrete filled tubes. J. Struct. Eng. 1999, 125, 477–484. [Google Scholar] [CrossRef]
- Fam, A.Z.; Rizkalla, S.H. Behavior of axially loaded concrete-filled circular fiber-reinforced polymer tubes. Struct. J. 2001, 98, 280–289. [Google Scholar]
- Mao, X.Y.; Xiao, Y. Seismic behavior of confined square CFT columns. Eng. Struct. 2006, 28, 1378–1386. [Google Scholar] [CrossRef]
- Abed, F.; AlHamaydeh, M.; Abdalla, S. Experimental and numerical investigations of the compressive behavior of concrete filled steel tubes (CFSTs). J. Constr. Steel Res. 2013, 80, 429–439. [Google Scholar] [CrossRef]
- Chen, Z.; Xu, J.; Chen, Y.; Lui, E.M. Recycling and reuse of construction and demolition waste in concrete-filled steel tubes: A review. Constr. Build. Mater. 2016, 126, 641–660. [Google Scholar] [CrossRef]
- Boumarafi, A.; Abouzied, A.; Masmoudi, R. Harsh environments effects on the axial behaviour of circular concrete-filled fibre reinforced-polymer (FRP) tubes. Compos. Part B Eng. 2015, 83, 81–87. [Google Scholar] [CrossRef]
- Fam, A.; Pando, M.; Filz, G.; Rizkalla, S. Precast piles for Route 40 bridge in Virginia using concrete filled FRP tubes. PCI J. 2003, 48, 32–45. [Google Scholar] [CrossRef]
- Zhou, A.; Qin, R.; Chow, C.L.; Lau, D. Structural performance of FRP confined seawater concrete columns under chloride environment. Compos. Struct. 2019, 216, 12–19. [Google Scholar] [CrossRef]
- Mahgub, M.; Ashour, A.; Lam, D.; Dai, X. Tests of self-compacting concrete filled elliptical steel tube columns. Thin-Walled Struct. 2017, 110, 27–34. [Google Scholar] [CrossRef]
- Naderpour, H.; Nagai, K.; Fakharian, P.; Haji, M. Innovative models for prediction of compressive strength of FRP-confined circular reinforced concrete columns using soft computing methods. Compos. Struct. 2019, 215, 69–84. [Google Scholar] [CrossRef]
- Jiang, C.; Wu, Y.-F. Axial strength of eccentrically loaded FRP-confined short concrete columns. Polymers 2020, 12, 1261. [Google Scholar] [CrossRef]
- Siddika, A.; Al Mamun, M.A.; Alyousef, R.; Amran, Y.H.M. Strengthening of reinforced concrete beams by using fiber-reinforced polymer composites: A review. J. Build. Eng. 2019, 25, 100798. [Google Scholar] [CrossRef]
- Csuka, B.; Kollár, L.P. Analysis of FRP confined columns under eccentric loading. Compos. Struct. 2012, 94, 1106–1116. [Google Scholar] [CrossRef]
- Hadi, M.N.S.; Widiarsa, I.B.R. Axial and flexural performance of square RC columns wrapped with CFRP under eccentric loading. J. Compos. Constr. 2012, 16, 640–649. [Google Scholar] [CrossRef]
- y Basalo, F.J.D.C.; Matta, F.; Nanni, A. Fiber reinforced cement-based composite system for concrete confinement. Constr. Build. Mater. 2012, 32, 55–65. [Google Scholar] [CrossRef]
- Triantafillou, T.C.; Papanicolaou, C.G.; Zissimopoulos, P.; Laourdekis, T. Concrete confinement with textile-reinforced mortar jackets. ACI Struct. J. 2006, 103, 28. [Google Scholar]
- Bournas, D.A.; Lontou, P.V.; Papanicolaou, C.G.; Triantafillou, T.C. Textile-reinforced mortar versus fiber-reinforced polymer confinement in reinforced concrete columns. ACI Struct. J. 2007, 104, 740. [Google Scholar]
- Marzouck, M.; Sennah, K. Concrete-filled PVC tubes as compression members. In Proceedings of the Composite Materials in Concrete Construction: Proceedings of the International Seminar, Scotland, UK, 5–6 September 2002; Thomas Telford Publishing: London, UK, 2002; pp. 31–37. [Google Scholar]
- Whittle, A.J.; Tennakoon, J. Predicting the residual life of PVC sewer pipes. Plast. Rubber Compos. 2005, 34, 311–317. [Google Scholar] [CrossRef]
- Boersma, A.; Breen, J. Long term performance prediction of existing PVC water distribution systems. In Proceedings of the 9th International Conference PVC, Rhodes Island, Greece, 1–3 September 2005. [Google Scholar]
- Gupta, P.K. Confinement of concrete columns with unplasticized Poly-vinyl chloride tubes. Int. J. Adv. Struct. Eng. 2013, 5, 19. [Google Scholar] [CrossRef]
- Oyawa, W.O.; Githimba, N.K.; Mang’urio, G.N. Structural response of composite concrete filled plastic tubes in compression. Steel Compos. Struct. 2016, 21, 589–604. [Google Scholar] [CrossRef]
- Askari, S.M.; Khaloo, A.; Borhani, M.H.; Masoule, M.S.T. Performance of polypropylene fiber reinforced concrete-filled UPVC tube columns under axial compression. Constr. Build. Mater. 2020, 231, 117049. [Google Scholar] [CrossRef]
- ASTM D1785-06; Standard Specification for Polyvinyl Chloride (PVC) Plastic Pipe, Schedules 40, 80, and 120. ASTM International: West Conshohocken, PA, USA, 2006.
- Carreira, D.J.; Chu, K.-H. Stress-strain relationship for plain concrete in compression. J. Proc. 1985, 82, 797–804. [Google Scholar]
- Chaudhari, S.V.; Chakrabarti, M.A. Modeling of concrete for nonlinear analysis using finite element code ABAQUS. Int. J. Comput. Appl. 2012, 44, 14–18. [Google Scholar]


Publisher’s Note: MDPI stays neutral with regard to jurisdictional claims in published maps and institutional affiliations. |
© 2022 by the authors. Licensee MDPI, Basel, Switzerland. This article is an open access article distributed under the terms and conditions of the Creative Commons Attribution (CC BY) license (https://creativecommons.org/licenses/by/4.0/).