
Experimental Study on the Permeability of Microbial-Solidified Calcareous Sand Based on MICP
Abstract
:1. Introduction
2. Materials and Methods
2.1. Materials
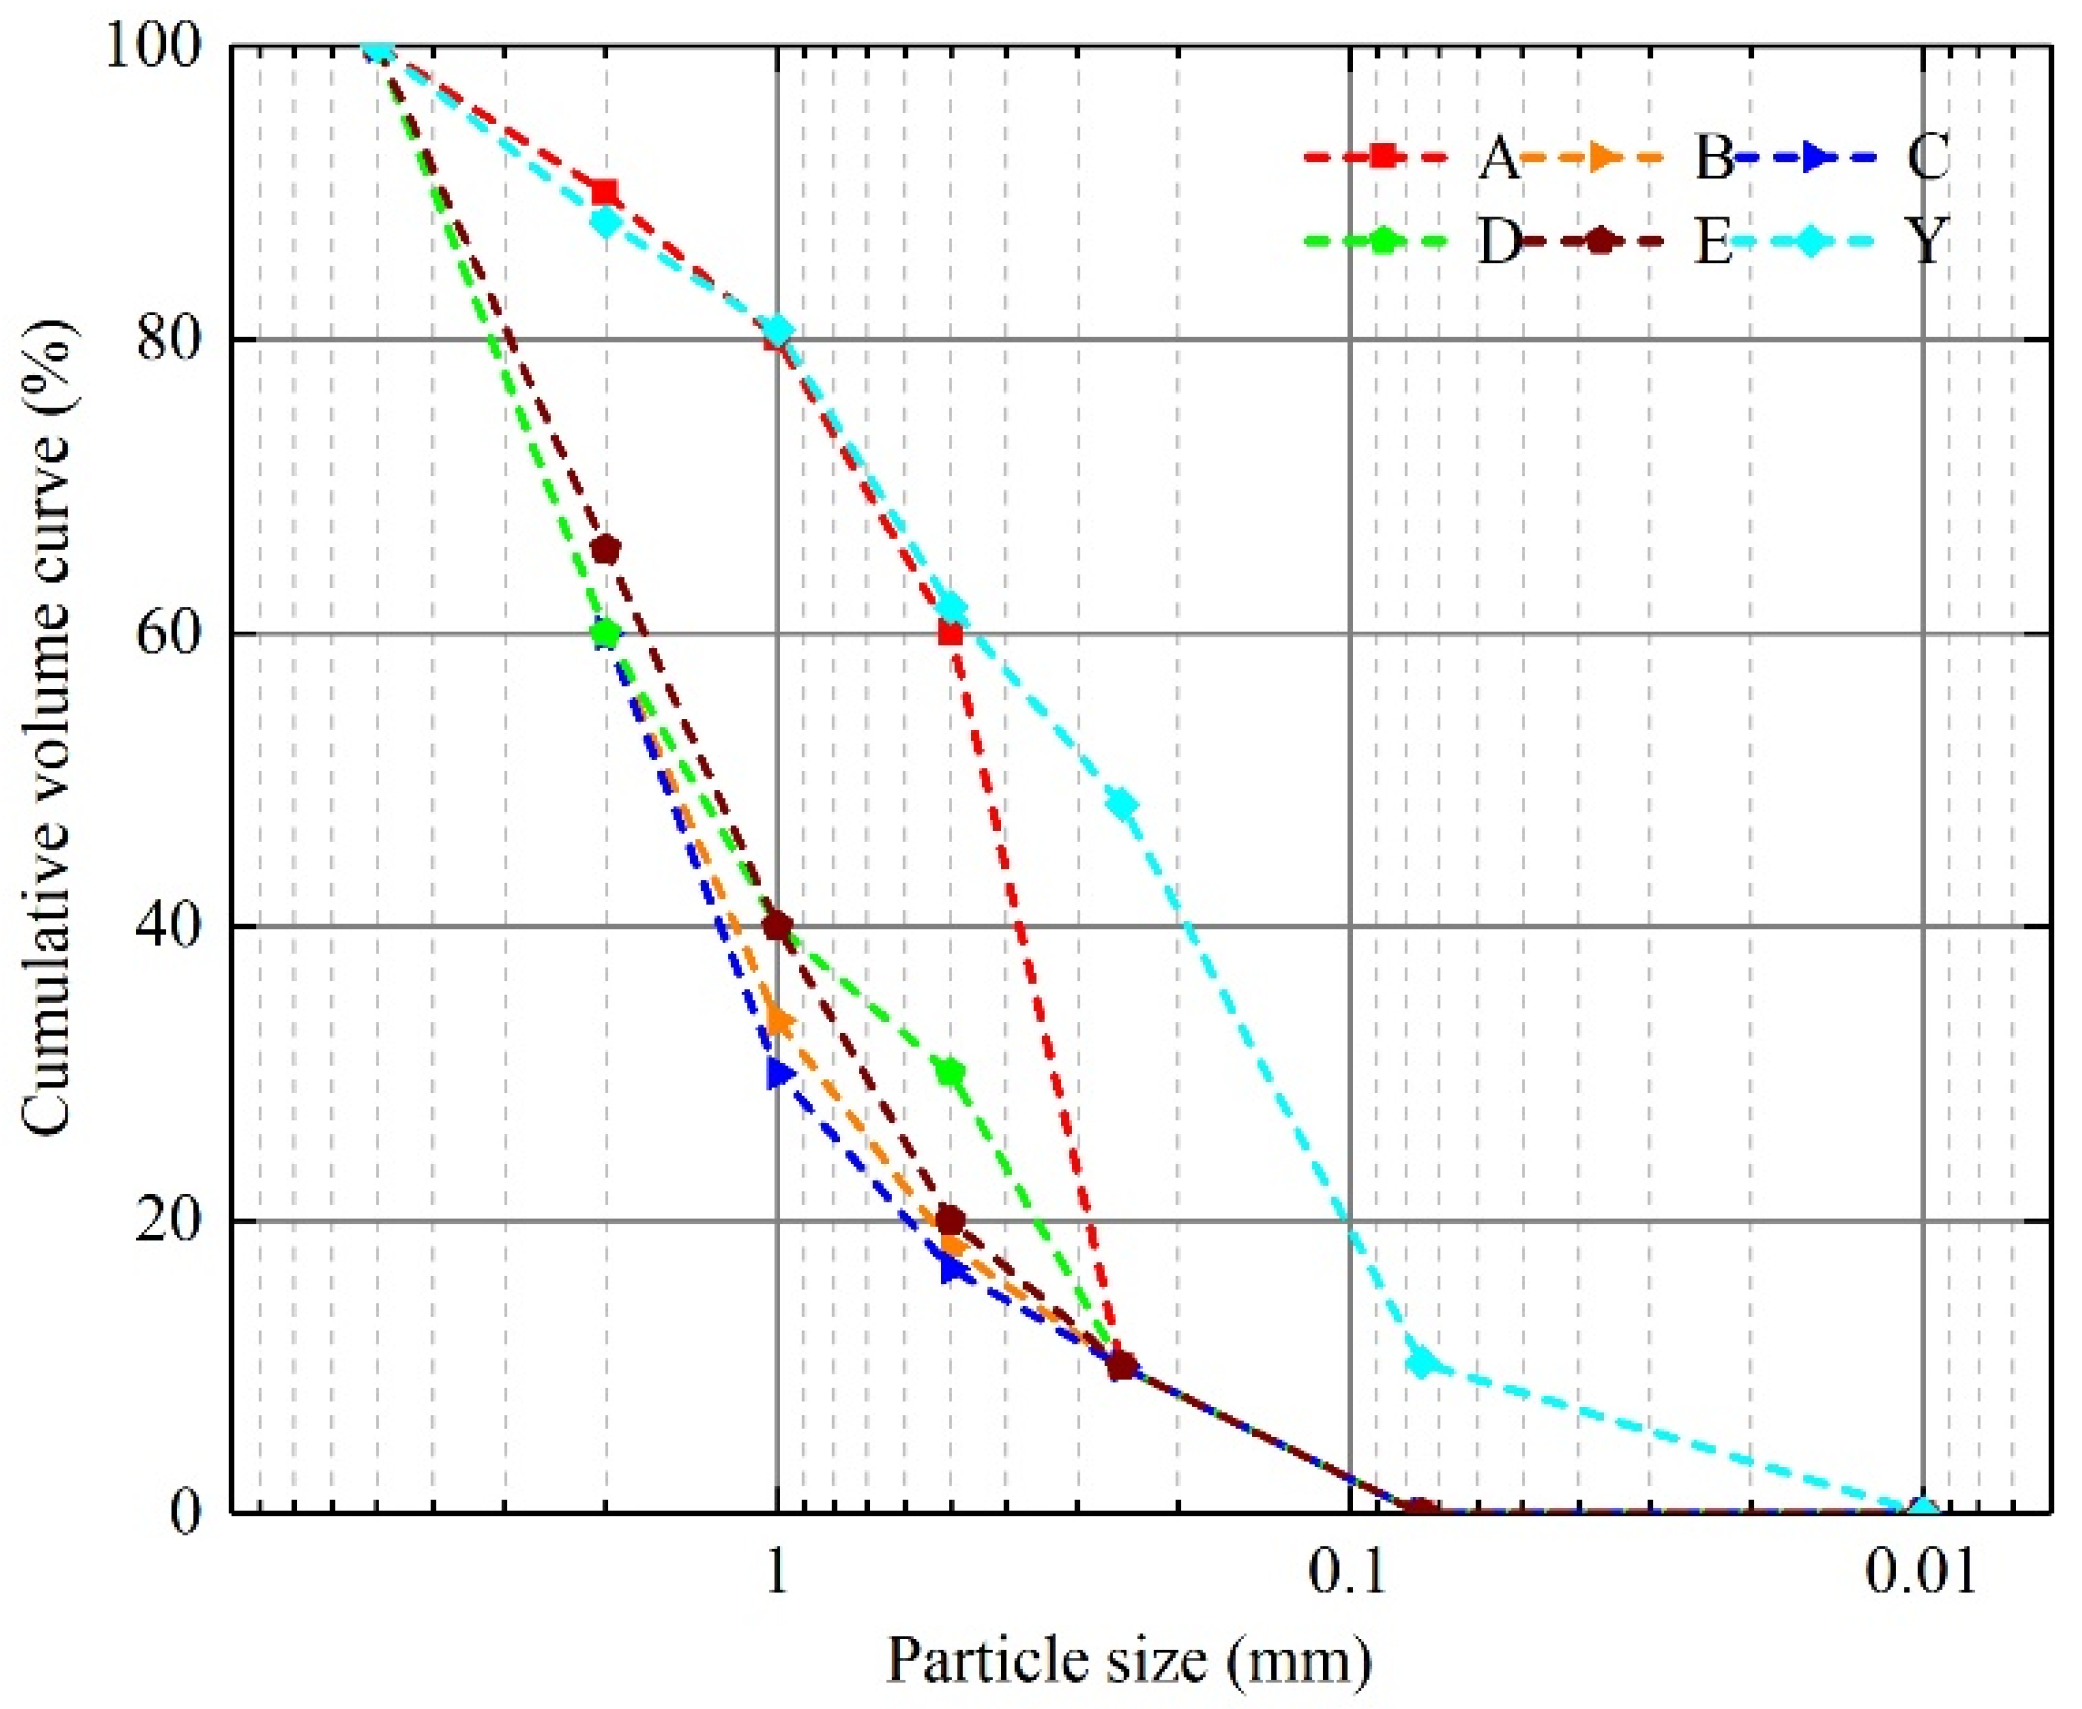
2.1.1. Test Sand
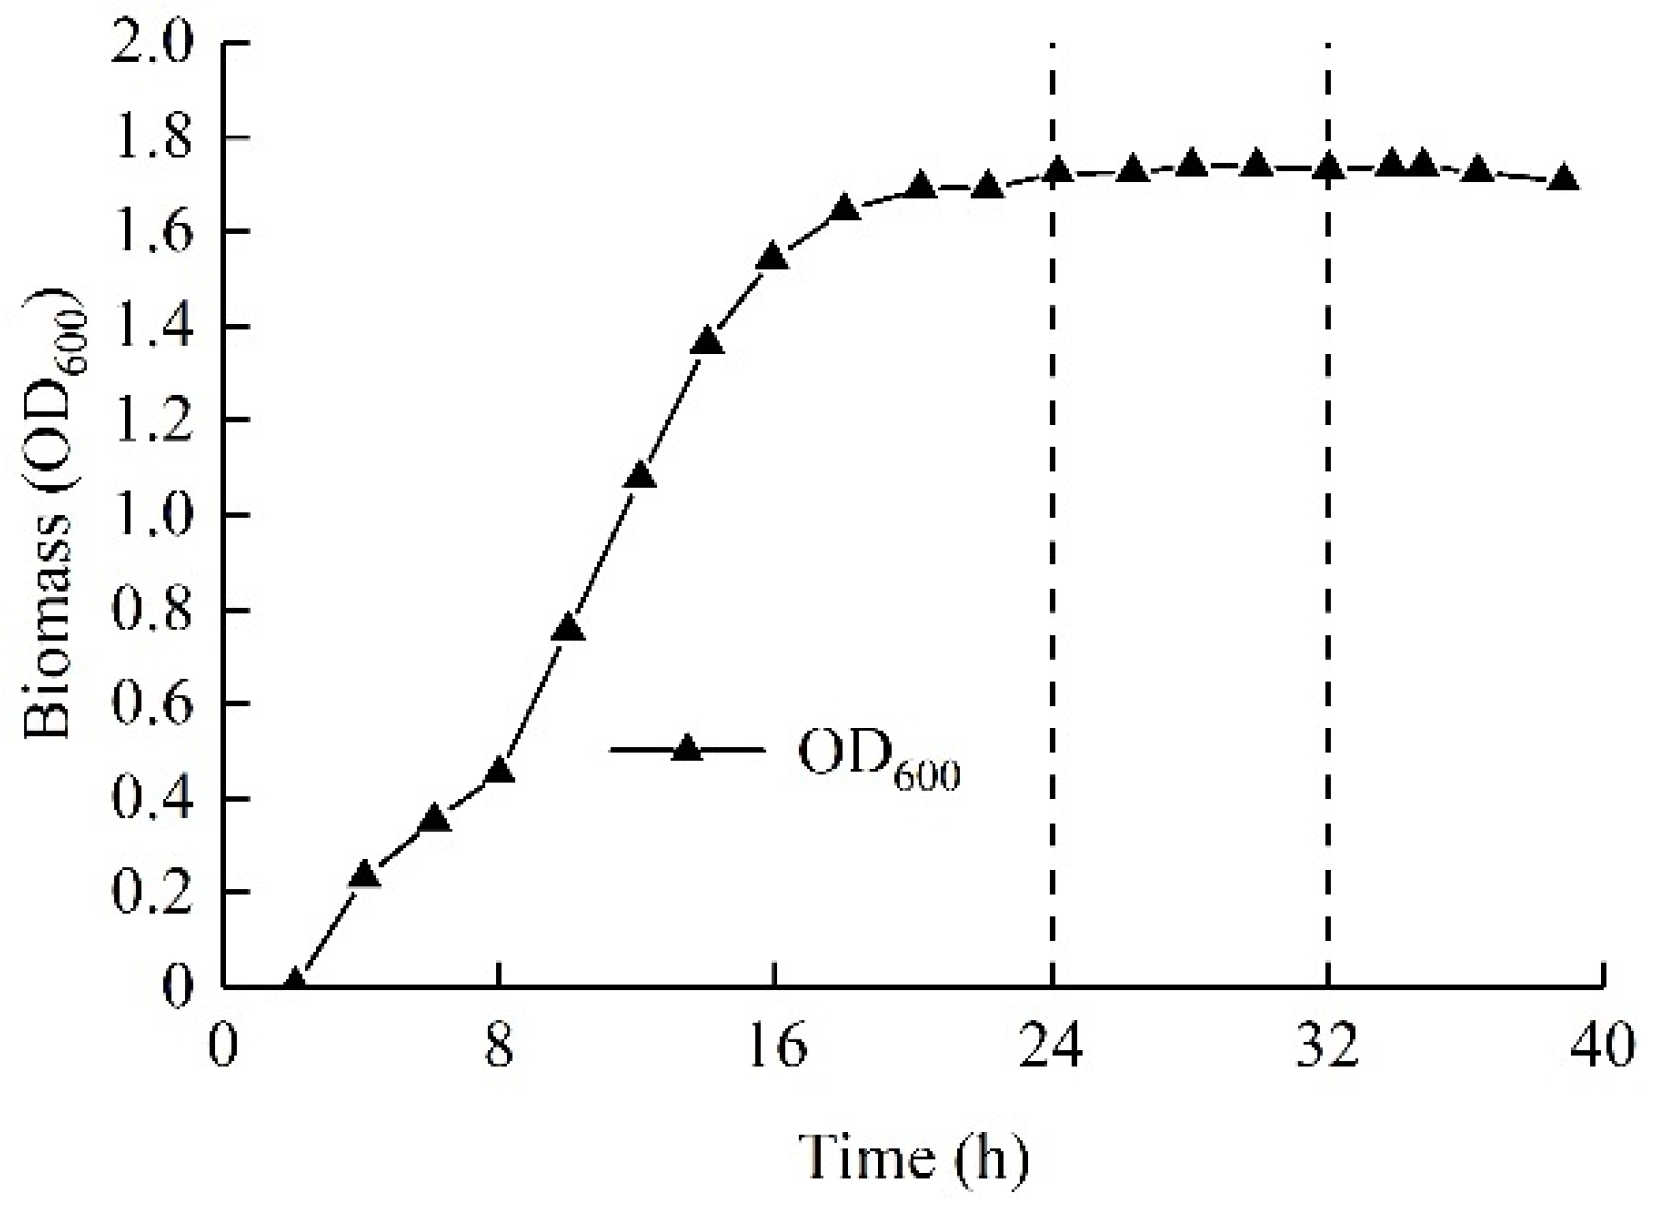
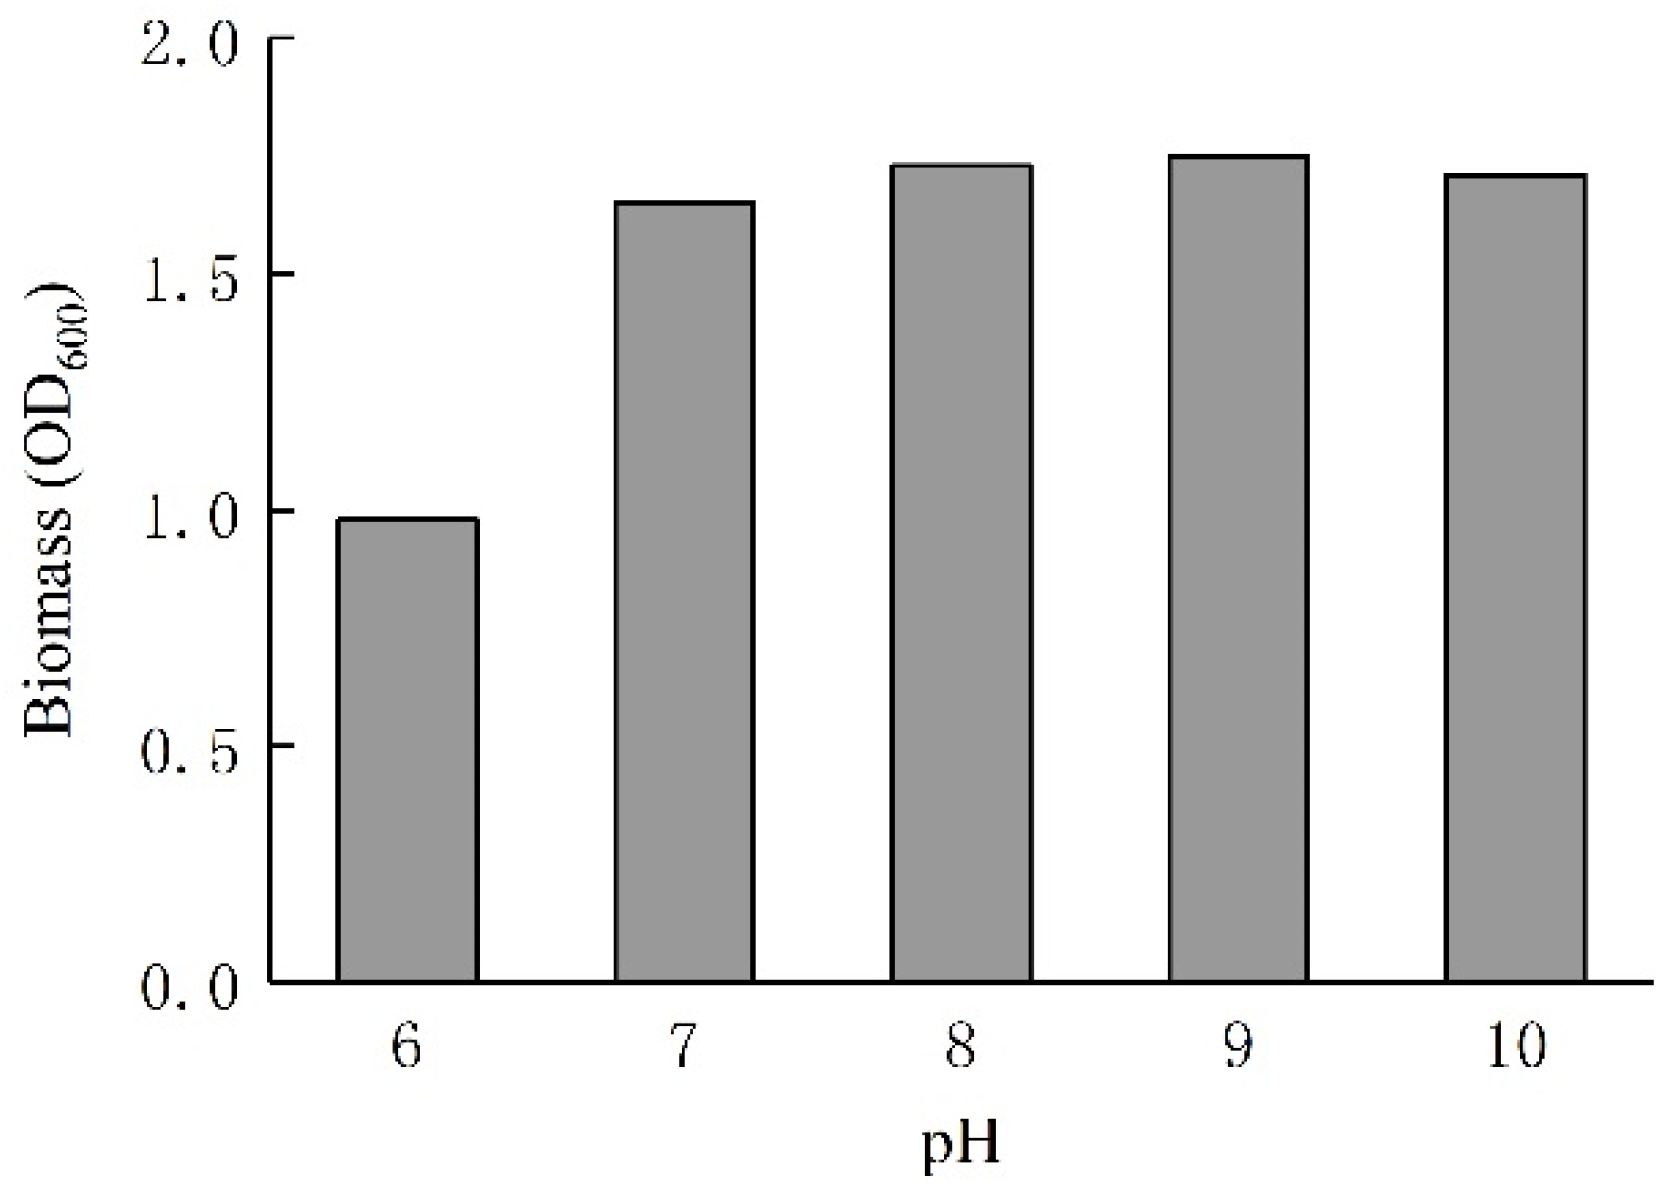
2.1.2. Microbial Suspensions
2.1.3. Fixation and Cementation Solutions
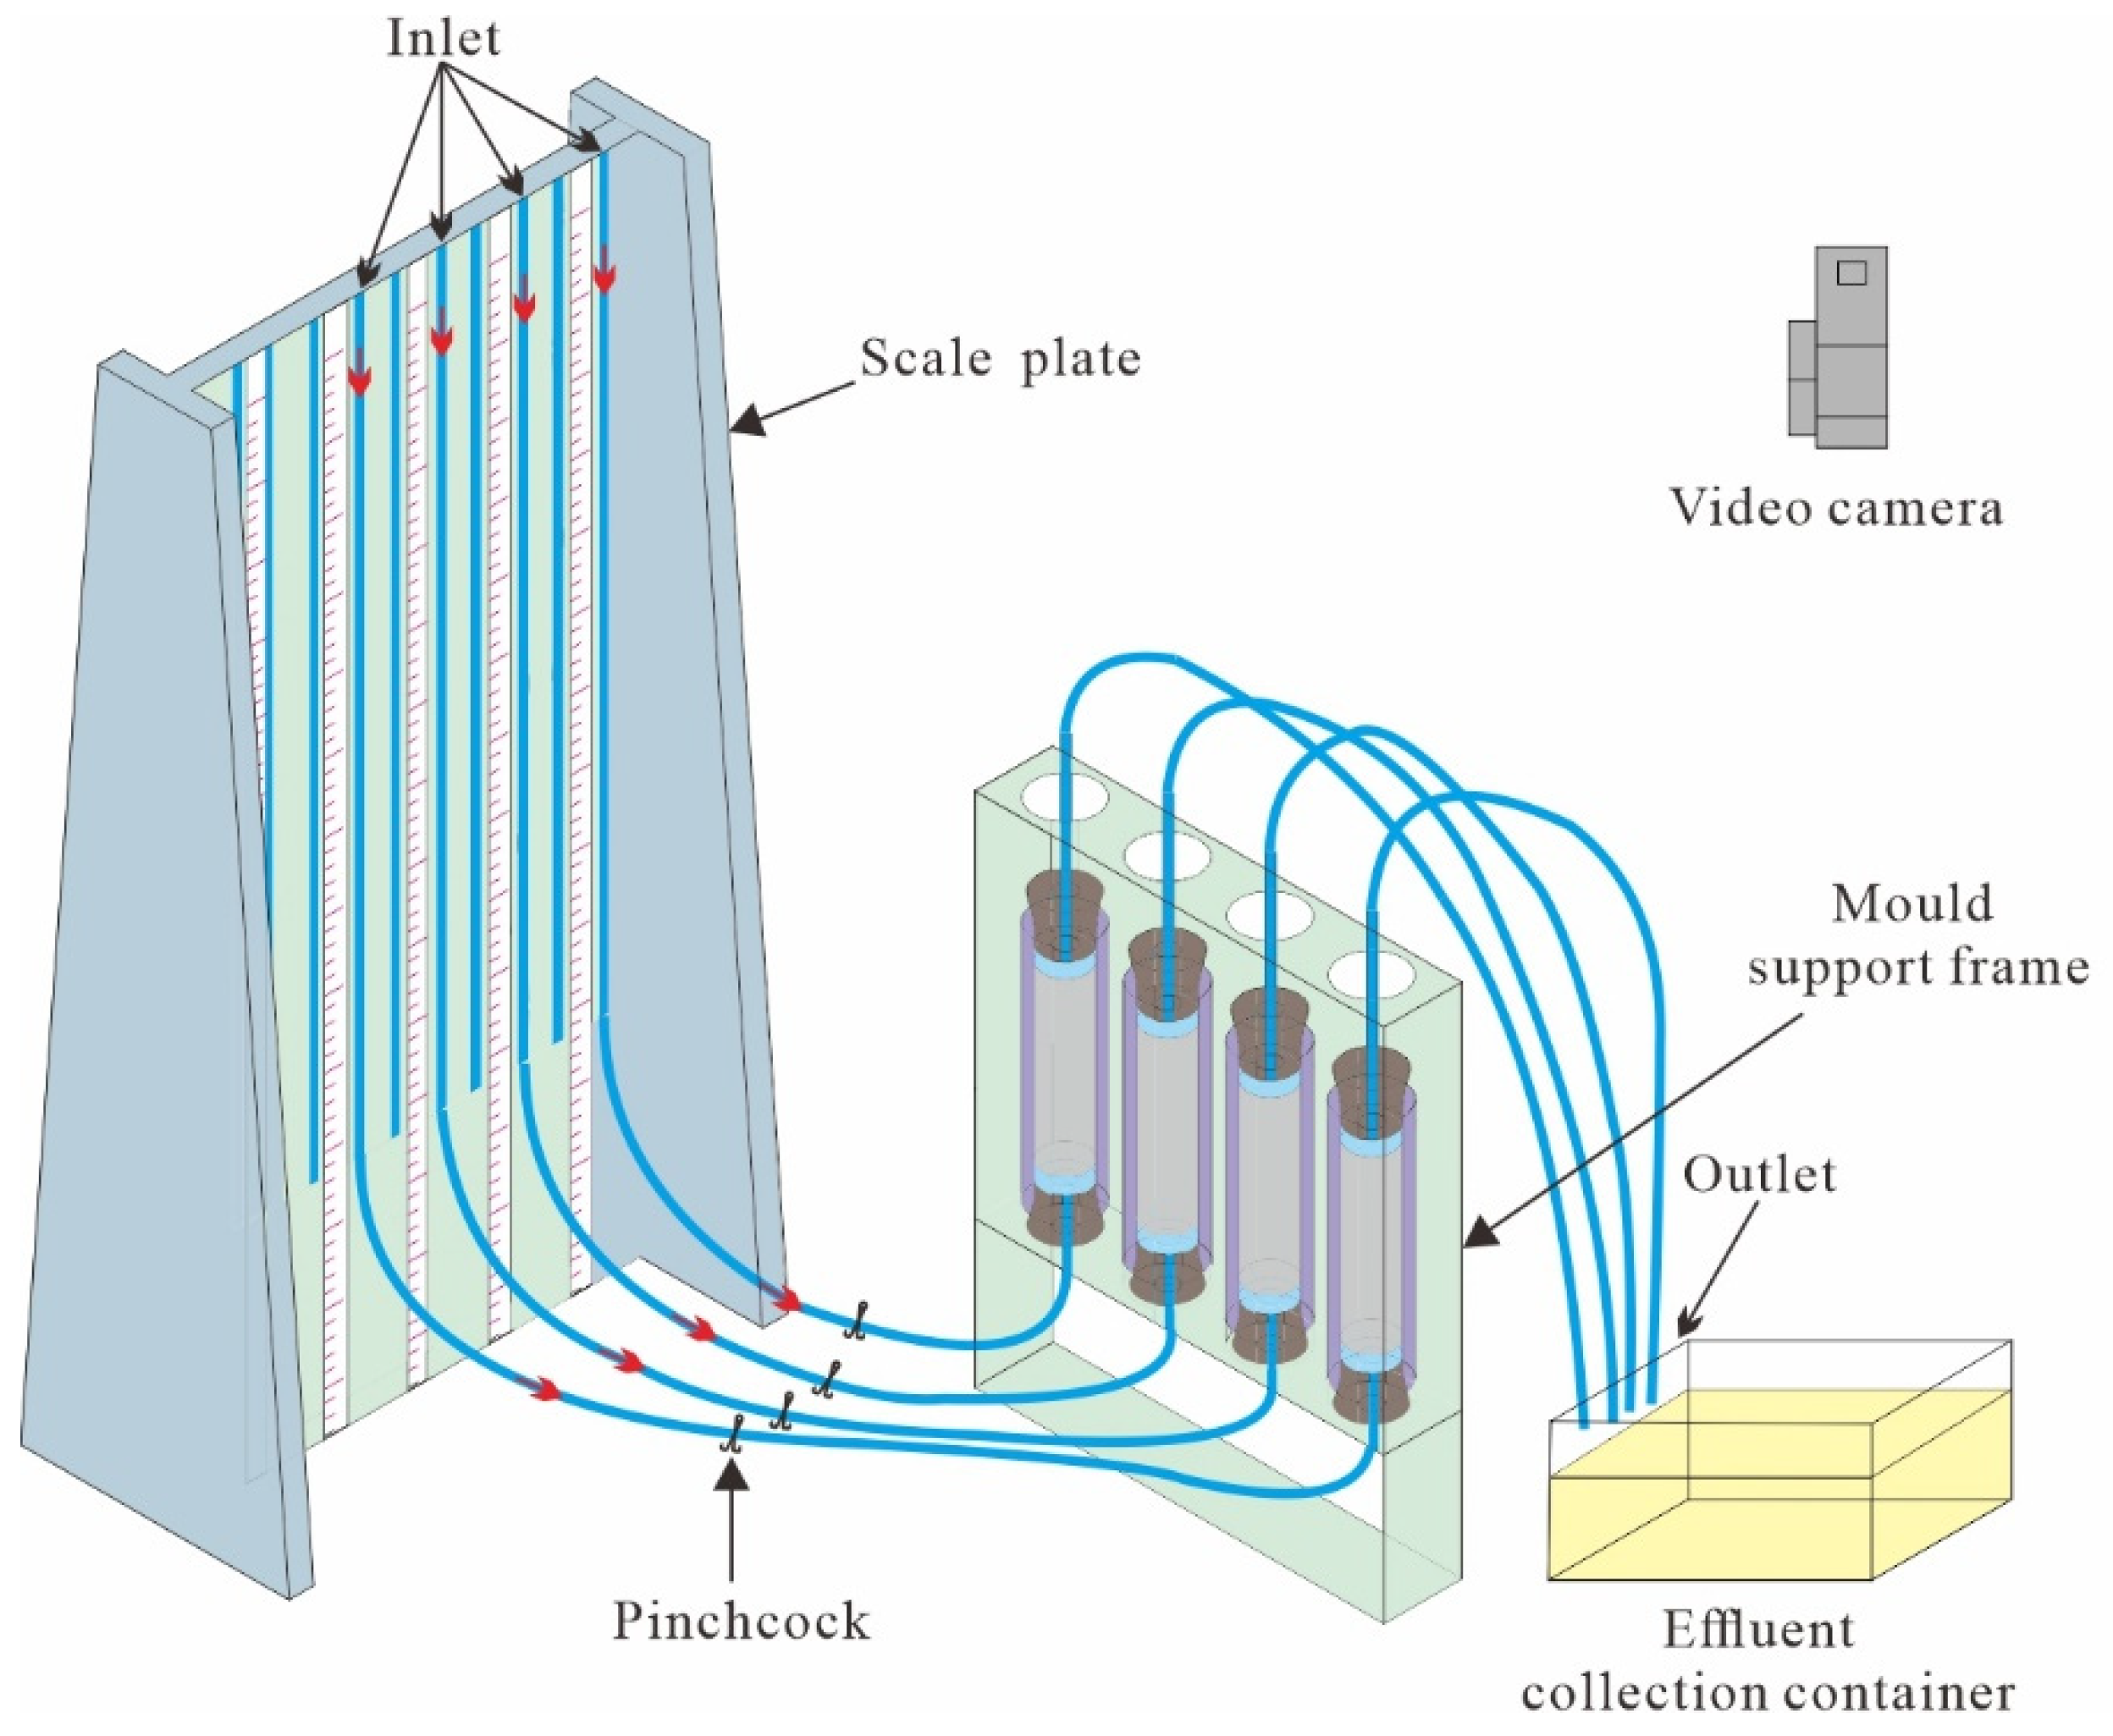
2.2. Apparatus
2.3. Experimental Strategy
2.3.1. MICP Treatment
2.3.2. Permeability Test
- The sand sample in the mold was sealed to be watertight and fully saturated.
- The deionized water was injected into the variable head pipe until the fluid was overflowing without bubbles, then the pinchcock was closed.
- The variable head pipe was injected with deionized water to the required height (1~1.5 m). Then, the pinchcock was opened, and the changing of the water head and time was recorded. The measurement was repeated 2~3 times at the same water head.
- The measurement was repeated 5~6 times at different water heads for each sand sample. When the permeability coefficient measured was within the allowable error (±2.0 × 10−n cm/s), the test was ended. The permeability coefficient (k) can be calculated using the following equation:
2.3.3. The Content of Induced Calcium Carbonate in Sand Columns
2.3.4. X-ray Computed Tomography Scan (CT)
2.3.5. Scanning Electron Microscopy (SEM) of MICP-Treated Sand
3. Results and Discussion
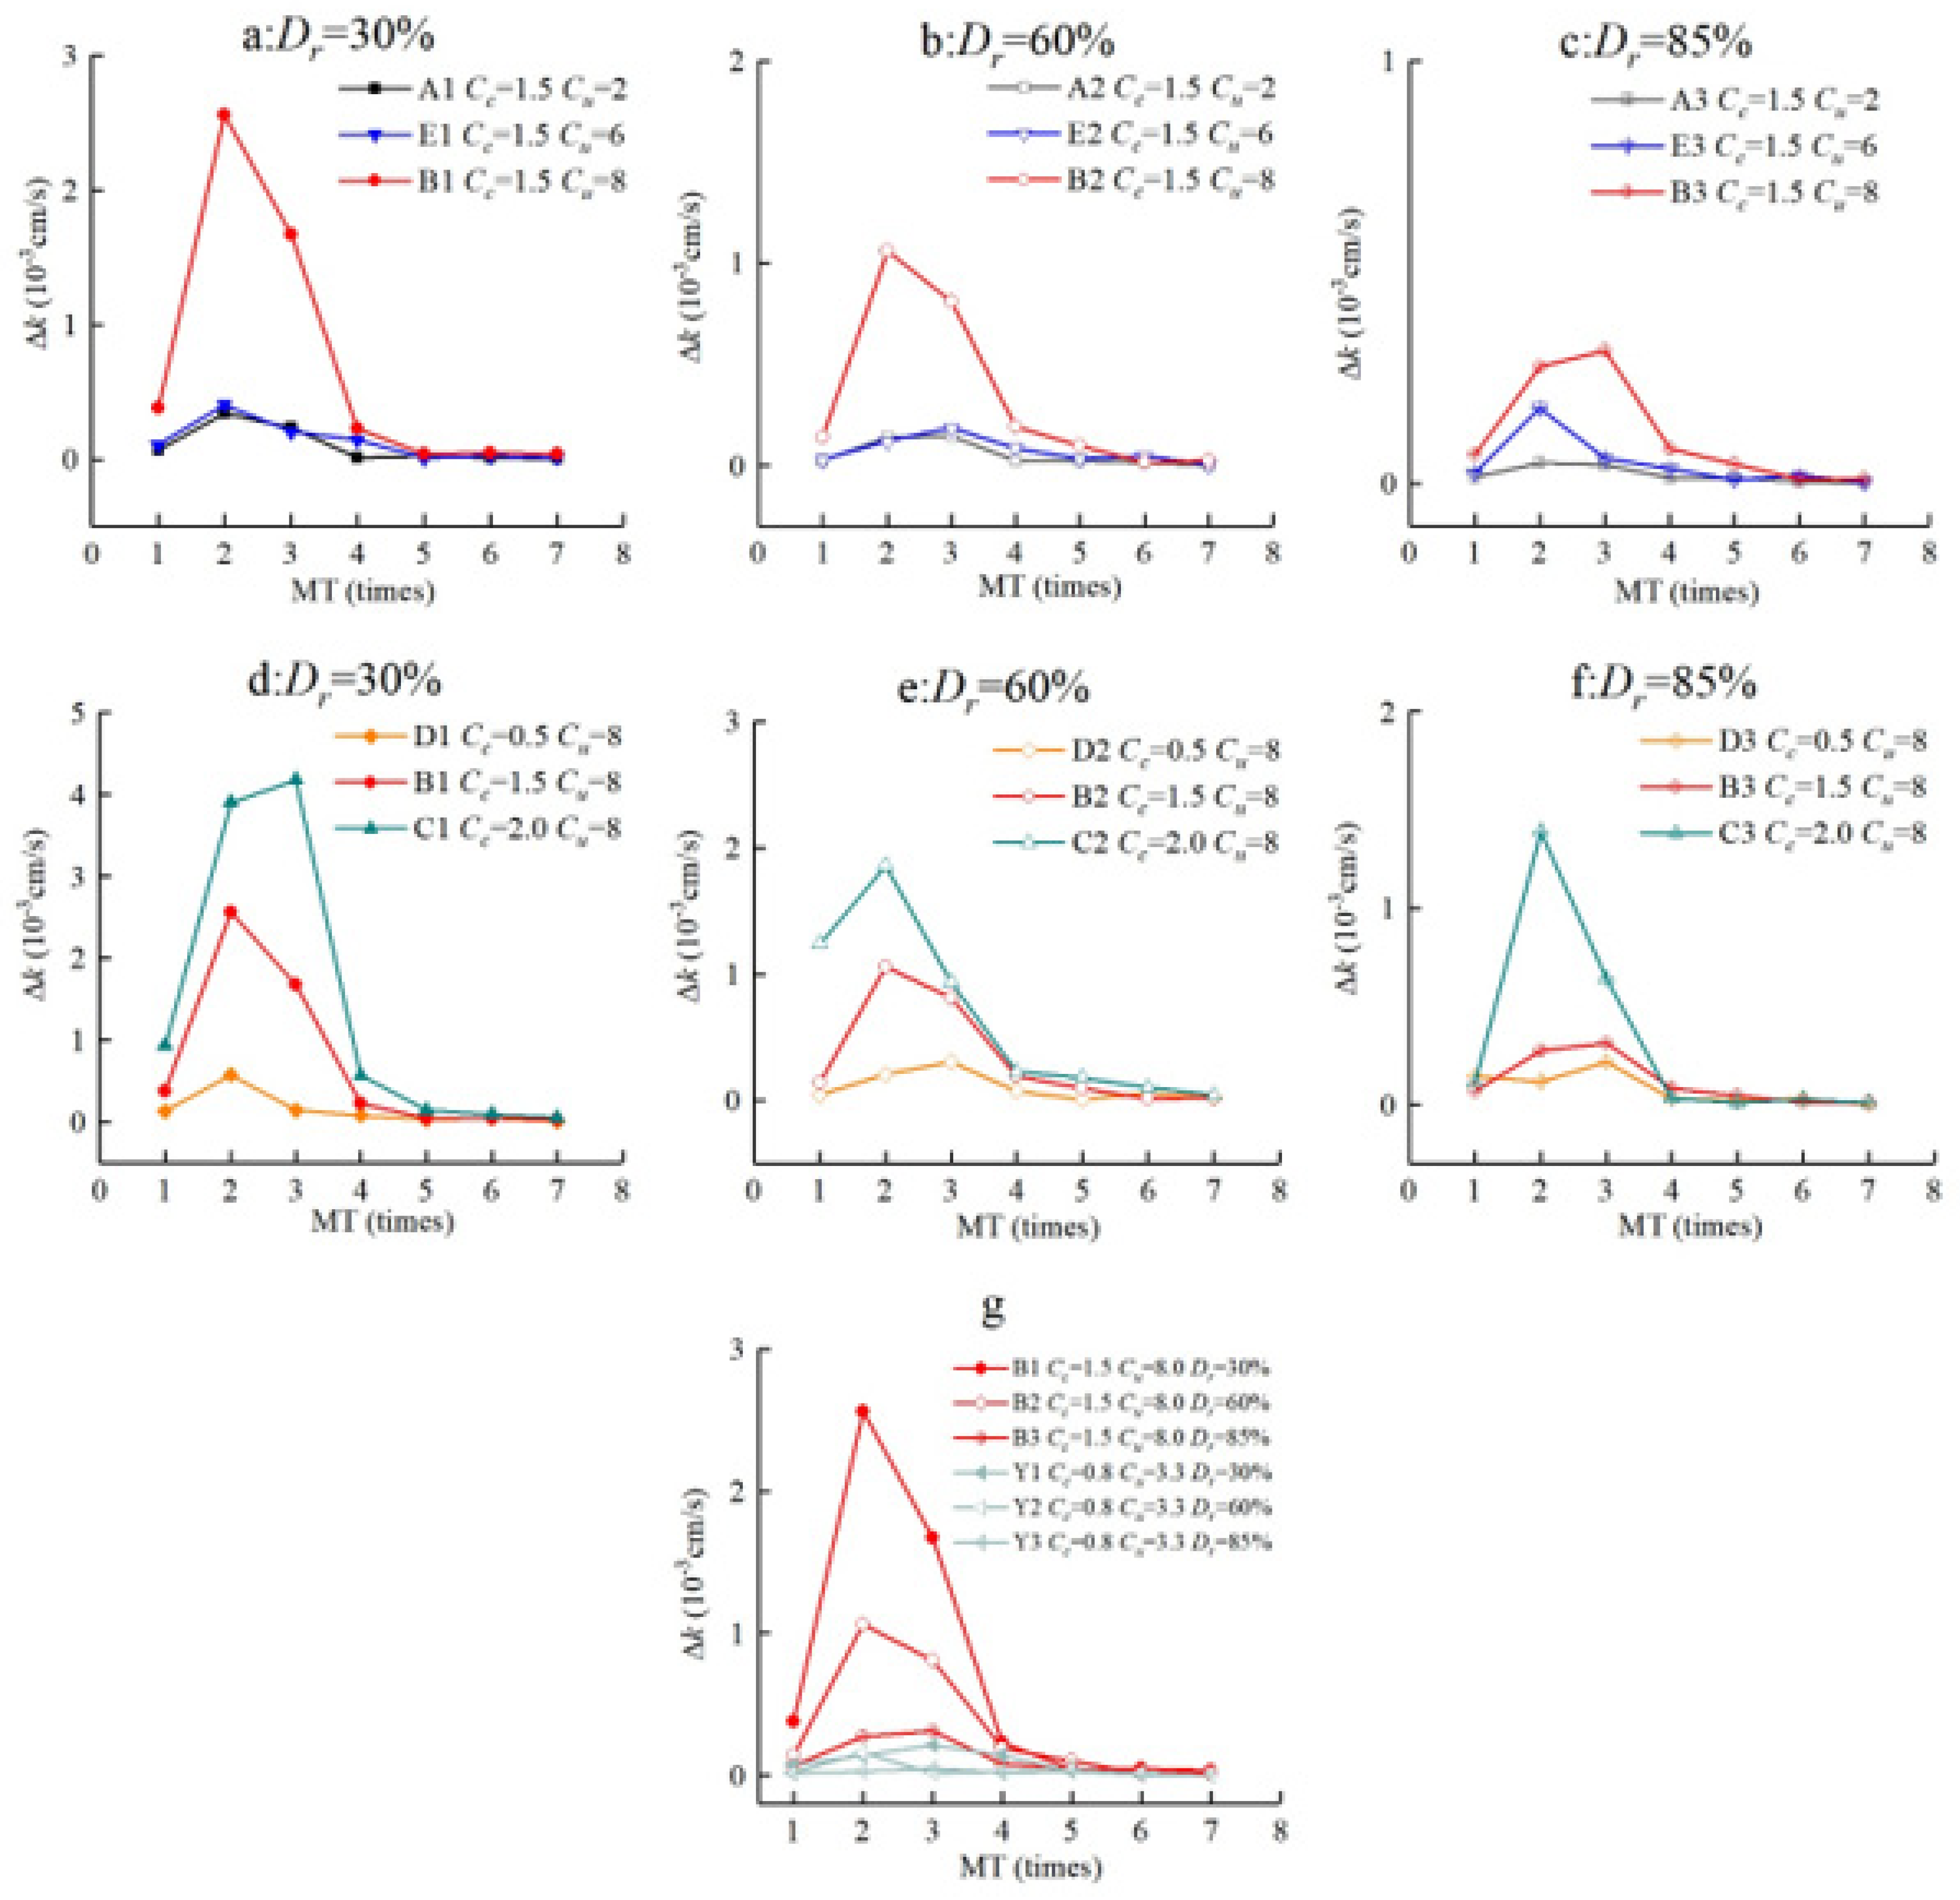
3.1. The Effect of Gradation on the Permeability Coefficient
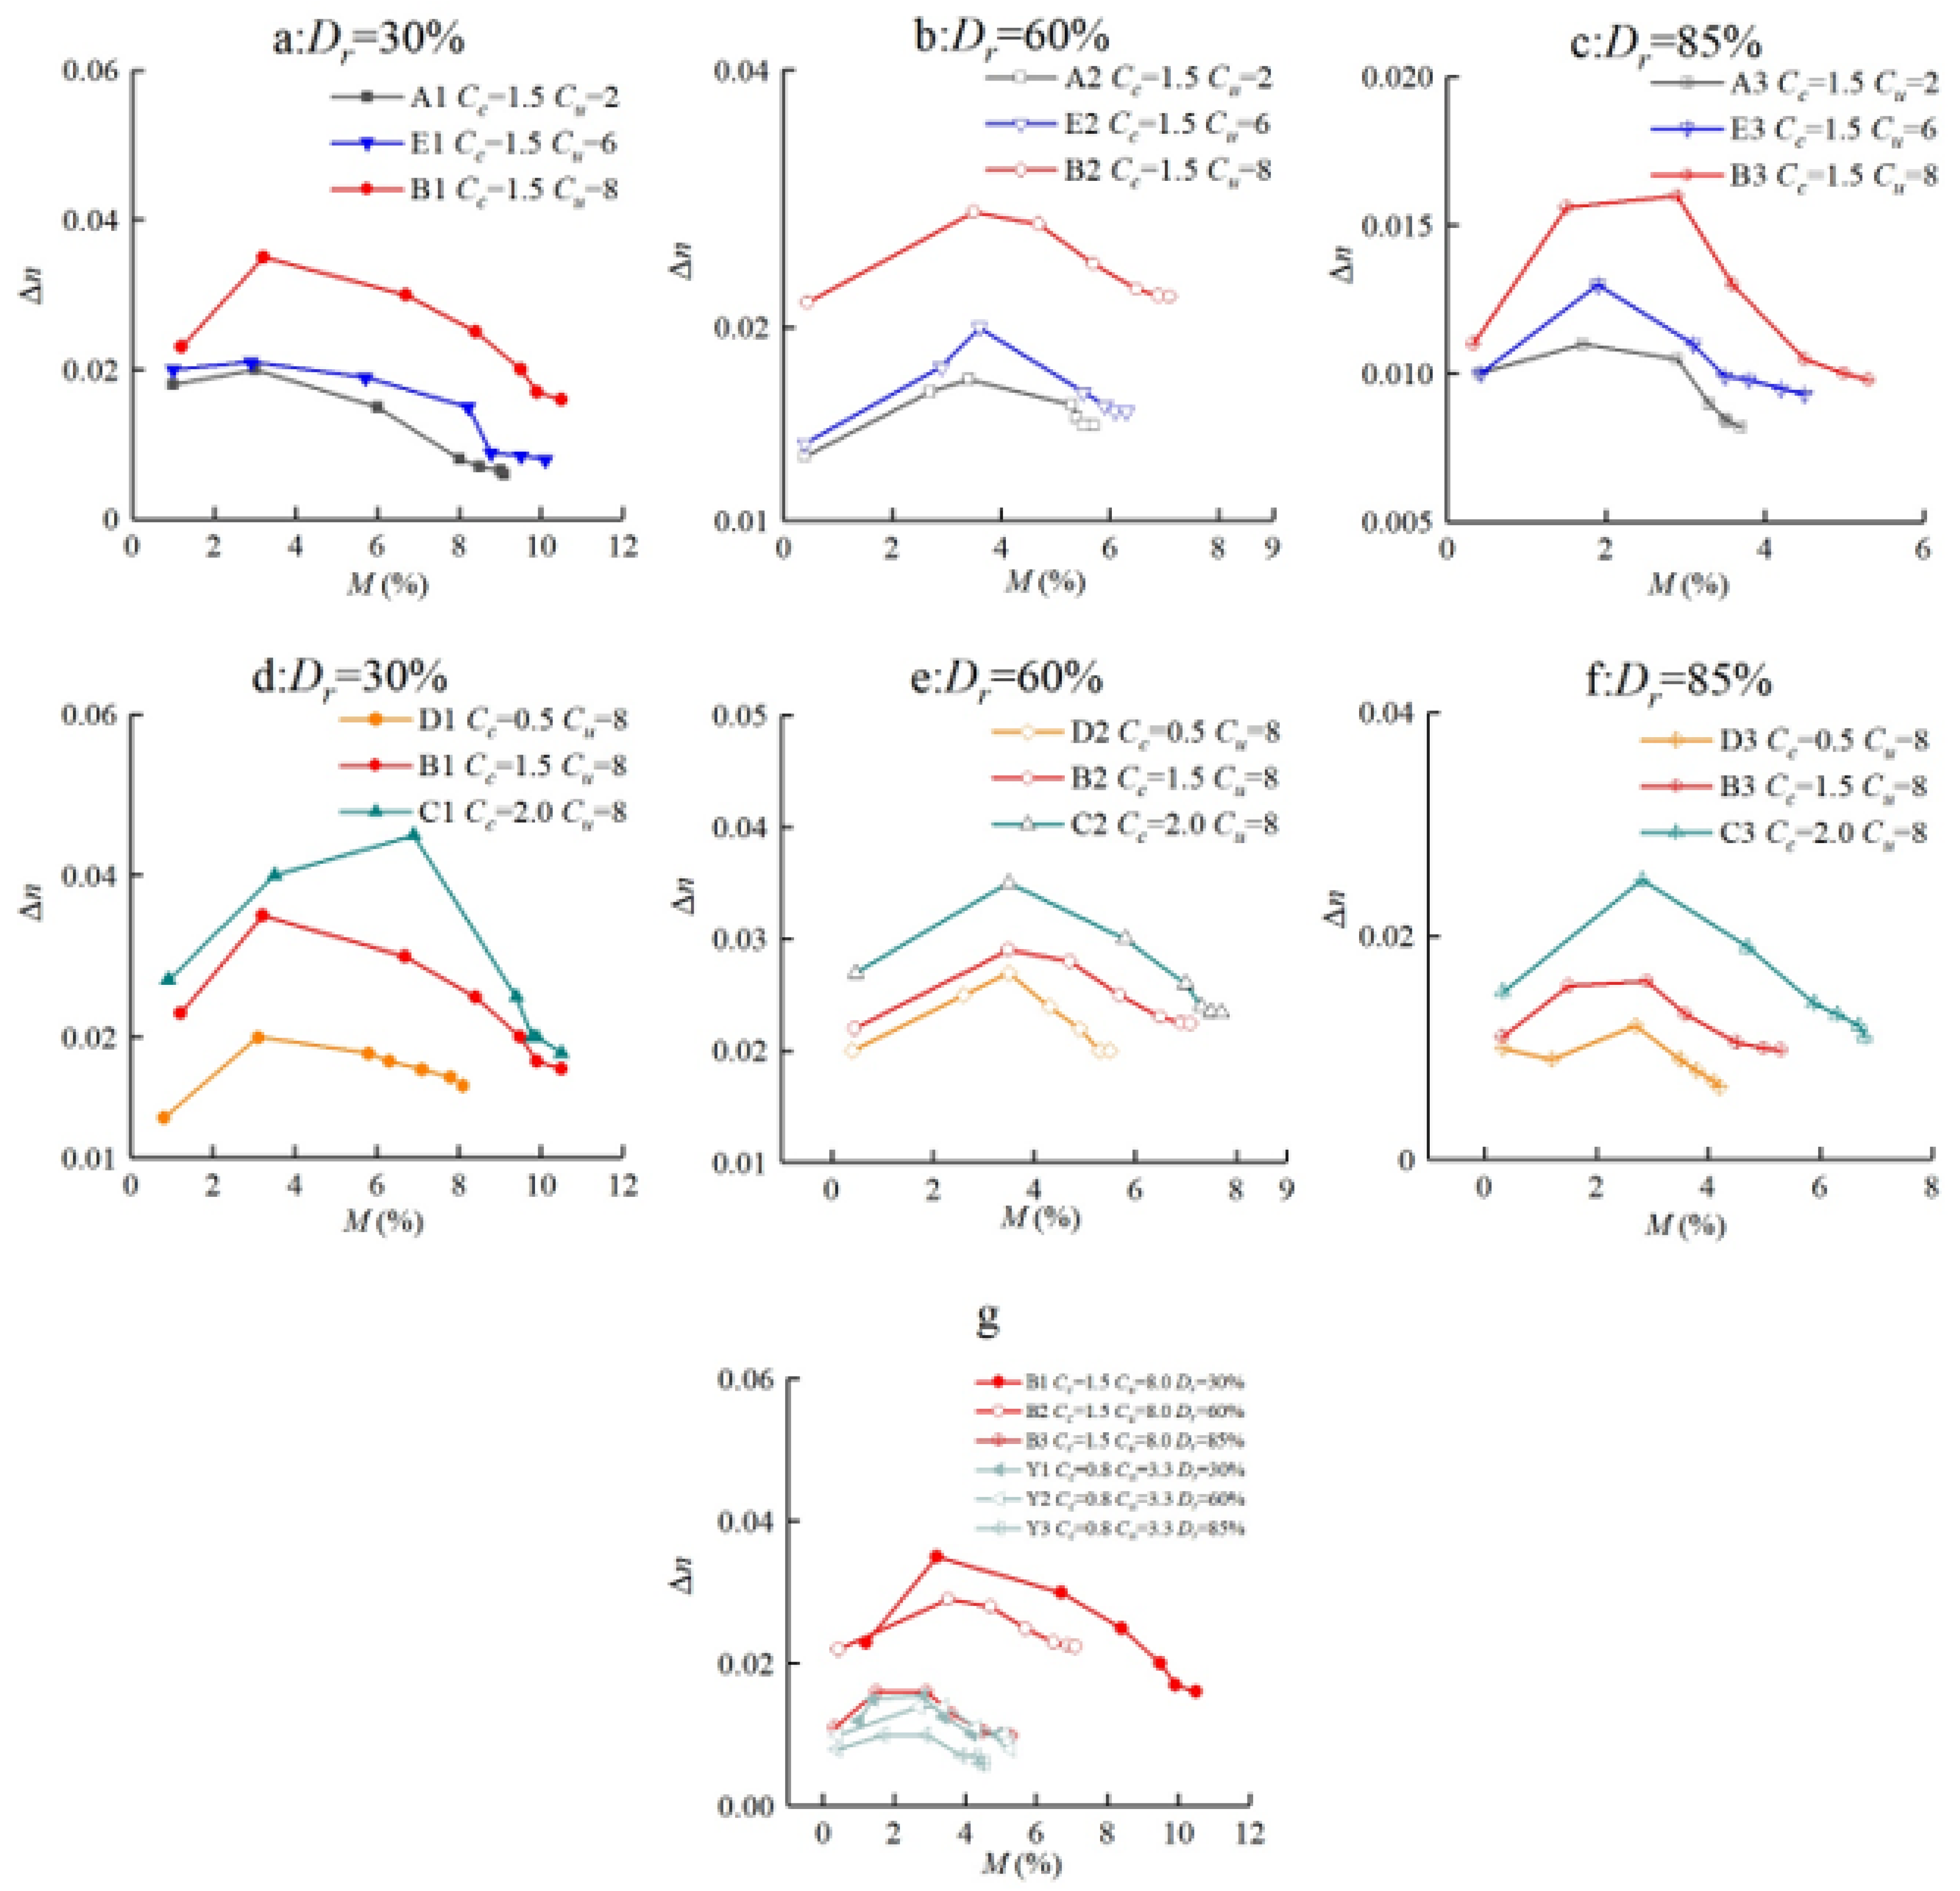
3.2. Porosity and Mass Variation
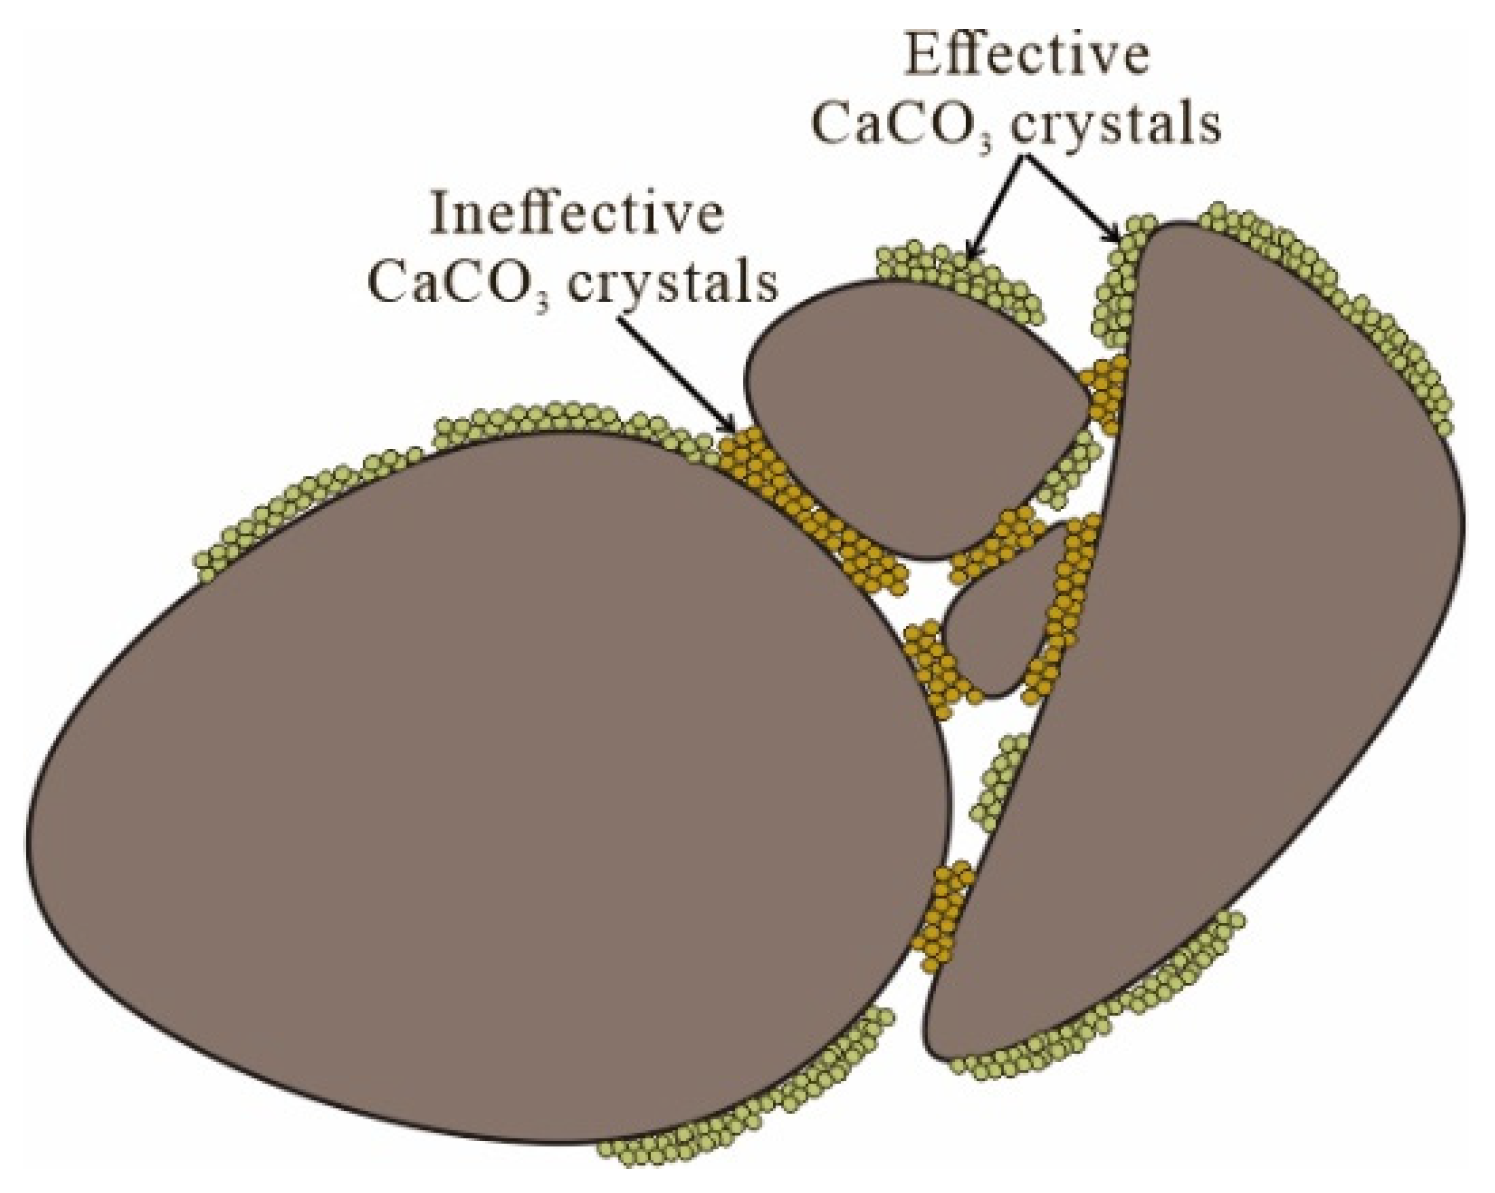
3.3. Scanning Electron Microscopy (SEM) Analyses
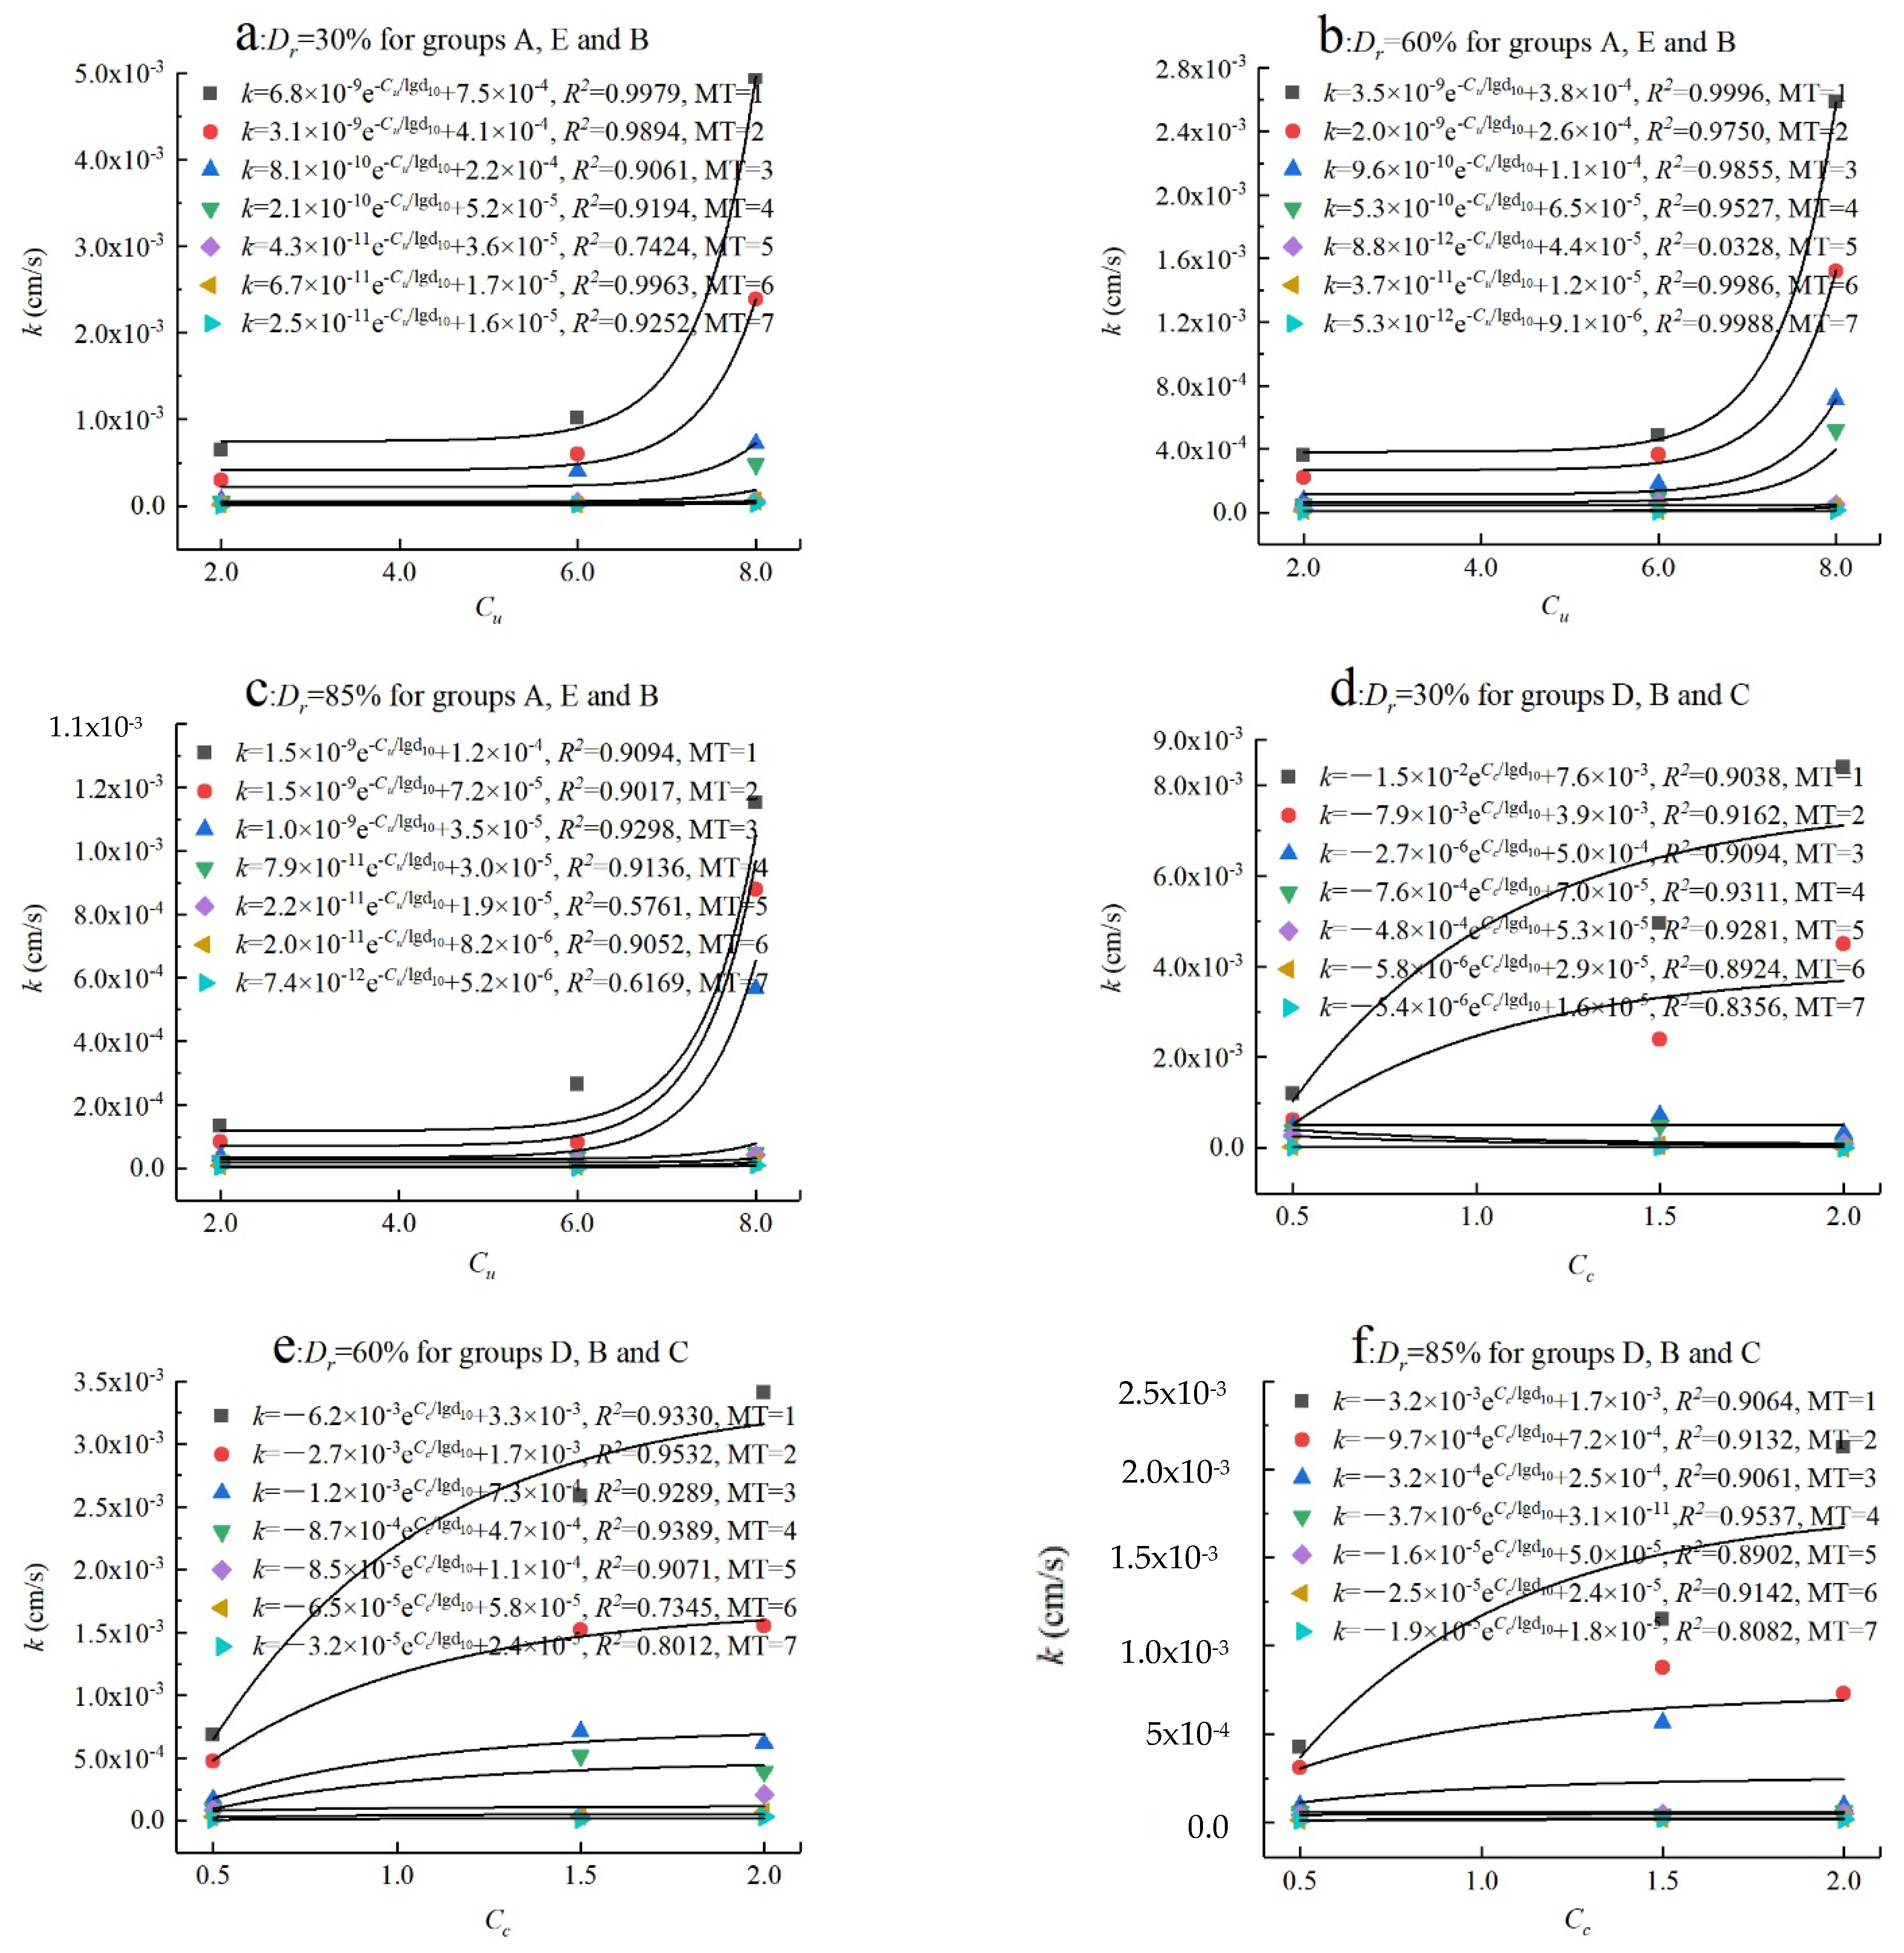
3.4. Correlational Analyses
4. Conclusions
- The grain gradation of cemented sand influences its permeability. In the case of the same Dr, the decreased amount of the permeability coefficient of each MICP treatment cycle increased with the rise in Cu and Cc.
- All sand samples showed a certain increase in induced calcium carbonate and a decrease in porosity after the MICP treatments. In the case of the same Dr, the decrease amount of the porosity and increase amount of the cementation content of each MICP treatment cycle increased with the rise in Cu and Cc.
- From the SEM analyses, after MICP treatment, the microstructures of the sand samples with different gradations were similar. The calcium carbonate crystals not only coat on the particle surfaces but also fill the particle pores, thus reducing permeability and decreasing porosity.
- The permeability coefficient (k) is proportional to Cu and Cc. When the MICP treatment cycle is less than five, the larger Cu (Cu ≥ 6.0) and smaller Cc (2.0 > Cc > 0.5) will lead to a more significant reduction in permeability, and permeability was fitted well with Cu and Cc. However, the permeability coefficient does not correlate well with Cu or Cc after a number of cycles of MICP treatment (MT ≥ 5) because the interparticle pores are basically filled by calcium carbonate crystals.
- This work provides a reference for the freshwater storage of calcareous sand foundations and the antiseepage of calcareous sand structures on island reefs. The targeted application of MICP according to soil gradation makes permeability a controlled variable, which not only saves the cost of construction but also avoids damaging the local ecosystem due to a permeability which is too low.
Author Contributions
Funding
Data Availability Statement
Conflicts of Interest
References
- Poole, E. The Dubai Palms: Construction and Environmental Consequences. In World Environmental and Water Resources Congress 2009; Great Rivers: Dubuque, IA, USA, 2009; pp. 5277–5282. [Google Scholar]
- Zhao, H.T.; Wang, L.R. Construction of Artificial Islands on Coral Reef in the South China Sea Islands. Trop. Geogr. 2017, 37, 681–693. [Google Scholar]
- Zheng, Q.H. Design of freshwater sources in the construction planning of hydraulic reclamation island of South China Sea blow-fill islands-sinking and floating controllable submarine reverse osmosis freshwater reservoir. In Proceedings of the 16th China Scientists Fourum, Beijing, China, 8 September 2019. [Google Scholar]
- Fan, Z.H.; Hu, C.; Zhu, Q.L.; Jia, Y.; Zuo, D.; Duan, Z. Three-dimensional pore characteristics and permeability properties of calcareous sand with different particle sizes. Bull. Eng. Geol. Environ. 2021, 80, 2659–2670. [Google Scholar] [CrossRef]
- Zhao, H.T.; Wang, L.R.; Song, C.J. Review on freshwater lens of lime-sand island in Nanhai Zhudao. Mar. Sci. Bull. 2014, 33, 601–610. [Google Scholar]
- Lu, C.H.; Cao, H.F.; Ma, J.; Shi, W.; Rathore, S.S.; Wu, J.; Luo, J. A proof-of-concept study of using a less permeable slice along the shoreline to increase fresh groundwater storage of oceanic islands: Analytical and experimental validation. Water Resour. Res. 2019, 55, 6450–6463. [Google Scholar] [CrossRef]
- Yan, M.; Lu, C.H.; Werner, A.D.; Luo, J. Analytical, Experimental, and Numerical Investigation of Partially Penetrating Barriers for Expanding Island Freshwater Lenses. Water Resour. Res. 2021, 57, e2020WR028386. [Google Scholar] [CrossRef]
- Chen, X.; Shen, J.; Wang, X.; Yao, T.; Xu, D. Effect of Saturation on Shear Behavior and Particle Breakage of Coral Sand. J. Mar. Sci. Eng. 2022, 10, 1280. [Google Scholar] [CrossRef]
- Wang, X.; Liu, J.Q.; Cui, J.; Wang, X.Z.; Shen, J.H.; Zhu, C.Q. Particle breakage characteristics of a foundation filling material on island-reefs in the South China Sea. Constr. Build. Mater. 2021, 306, 124690. [Google Scholar] [CrossRef]
- Wang, X.; Wang, Y.; Cheng, L.; Cui, J.; Shen, J.H.; Wang, X.Z.; Zhu, C.Q. Particle breakage mechanism and particle shape evolution of calcareous sand under impact loading. Bull. Eng. Geol. Environ. 2022, 81, 372. [Google Scholar] [CrossRef]
- Lees, A.; Mimms, S.; King, D.A. Palm Jumeirah, Dubai: Cone penetrometer testing data from the carbonate sand fill. Proc. Inst. Civ. Eng.-Geotech. Eng. 2013, 166, 253–267. [Google Scholar] [CrossRef]
- Wang, Y.; Ren, Y.B.; Yang, Q. Experimental study on the hydraulic conductivity of calcareous sand in South China Sea. Mar. Georesour. Geotechnol. 2017, 35, 1037–1047. [Google Scholar] [CrossRef]
- Lee, K.M.; Shen, C.K.; Leung, D.H.K.; Mitchell, J.K. Effects of Placement Method on Geotechnical Behavior of Hydraulic Fill Sands. J. Geotech. Geoenviron. Eng. 1999, 125, 832–846. [Google Scholar] [CrossRef]
- Lee, K.M. Influence of placement method on the cone penetration resistance of hydraulically placed sand fills. Can. Geotech. J. 2001, 38, 592–607. [Google Scholar] [CrossRef]
- Liu, J.Y.; Li, J.L.; Wu, C.Y. Evaluation of different reinforcement methods for treating a barged-in fall sandy soil foundation. Glob. Geol. 2006, 25, 81–85. [Google Scholar]
- Whiffin, V.S. Microbial CaCO3 Precipitation for the Production of Biocement. Ph.D. Thesis, Murdoch University, Perth, Western Australia, 2004. [Google Scholar]
- Tobler, D.J.; Maclachlan, E.; Phoenix, V.R. Microbially mediated plugging of porous media and the impact of differing injection strategies. Ecol. Eng. 2012, 42, 270–278. [Google Scholar] [CrossRef]
- Choi, S.G.; Wu, S.F.; Chu, J. Biocementation for sand using an eggshell as calcium source. J. Geotech. Geoenviron. Eng. 2016, 142, 06016010. [Google Scholar] [CrossRef]
- Jiang, N.J.; Yoshioka, H.; Yamamoto, K.; Soga, K. Ureolytic activities of a urease producing bacterium and purified urease enzyme in the anoxic condition: Implication for subseafloor sand production control by microbially induced carbonate precipitation (MICP). Ecol. Eng. 2016, 90, 96–104. [Google Scholar] [CrossRef] [Green Version]
- Whiffin, V.S.; Van Paassen, L.A.; Harkes, M.P. Microbial carbonate precipitation as a soil improvement technique. Geomicrobiol. J. 2007, 24, 417–423. [Google Scholar] [CrossRef]
- Ivanov, V.; Chu, J. Applications of microorganisms to geotechnical engineering for bioclogging and biocementation of soil in situ. Rev. Environ. Sci. Biotechnol. 2008, 7, 139–153. [Google Scholar] [CrossRef]
- Phillips, A.J.; Gerlach, R.; Lauchnor, E.; Mitchell, A.C.; Cunningham, A.B.; Spangler, L. Engineered applications of ureolytic biomineralization: A review. Biofouling 2013, 29, 715–733. [Google Scholar] [CrossRef] [Green Version]
- Liu, K.W.; Li, X.D.; Hao, H.; Li, X.; Sha, Y.; Wang, W.; Liu, X. Study on the raising technique using one blast based on the combination of long-hole presplitting and vertical crater retreat multiple-deck shots. Int. J. Rock Mech. Min. Sci. 2019, 113, 41–58. [Google Scholar] [CrossRef]
- DeJong, J.T.; Fritzges, M.B.; Nüsslein, K. Microbially Induced Cementation to Control Sand Response to Undrained Shear. J. Geotech. Geoenviron. Eng. 2006, 132, 1381–1392. [Google Scholar] [CrossRef]
- Van Paassen, L.A.; Harkes, M.P.; Van Zwieten, G.A. Scale up of BioGrout: A biological ground reinforcement method. In Proceedings of the 17th International Conference on Soil Mechanics and Geotechnical Engineering, Alexandria, Egypt, 5–9 October 2009; pp. 2328–2333. [Google Scholar]
- Montoya, B.M.; DeJong, J.T.; Boulanger, R.W.; Wilson, D.W.; Gerhard, R.; Ganchenko, A.; Chou, J.C. Liquefaction mitigation using microbial induced calcite precipitation. In Proceedings of the GeoCongress: 1918–1927: State of the Art and Practice in Geotechnical Engineering; Hryciw, R.D., Athanasopoulos-Zekkos, A., Yesiller, N., Eds.; GSP: Oakland, CA, USA; ASCE: Reston, VA, USA, 2012; p. 225. [Google Scholar]
- Cheng, X.H.; Ma, Q.; Yang, Z.; Zhang, Z.C.; Li, M. Study on the dynamic response of microbial grouting to strengthen liquefied sandy soil foundation. Chin. J. Geotech. Eng. 2013, 35, 1486–1495. [Google Scholar]
- Montoya, B.M.; DeJong, J.T.; Boulanger, R.W. Dynamic response of liquefiable sand improved by microbial-induced calcite precipitation. Geotechnique 2013, 63, 125–135. [Google Scholar] [CrossRef]
- Emmanuel, S.; Erica, M.; Kannan, R.I.; Charles, W.K.; Alessandro, T. Application of microbially induced calcite precipitation in erosion mitigation and stabilisation of sandy soil foreshore slopes: A preliminary investigation. Eng. Geol. 2015, 201, 96–105. [Google Scholar]
- Minoo, A. Reducing the hydraulic erosion of sand using microbial-induced carbonate precipitation. Proc. Inst. Civ. Eng.-Ground Improv. 2017, 170, 112–122. [Google Scholar]
- Van der Star, W.R.L.; van Wijngaarden, W.K.; Van Paassen, L.A.; Van Baalen, L.R.; Van Zwieten, G. Stabilization of gravel deposits using microorganisms. In Proceedings of the 15th European Conference on Soil Mechanics and Geotechnical Engineering, Athens, Greece, 15 September 2011; IOS Press: Amsterdam, The Netherlands, 2011; pp. 85–90. [Google Scholar]
- Van Paassen, L.A. Bio-mediated ground improvement: From laboratory experiment to pilot applications. In Geo-Frontiers Congress 2011: Advances in Geotechnical Engineering; ASCE Geotechnical Special No. 211; ASCE: Reston, VA, USA, 2011; pp. 4099–4108. [Google Scholar]
- Smith, R.W.; Fujita, Y.; Hubbard, S.S.; Ginn, T.R. US Department of Energy Final Report Grant No. In DE-FG02-07ER64404: Field Investigations of Microbially Facilitated Calcite Precipitation for Immobilization of Strontium-90 and Other Trace Metals in the Subsurface; Technical Report DEO/ER64404-01; US Department of Energy: Washington, DC, USA, 2012; pp. 1–20. [Google Scholar]
- Gomez, M.G.; Martinez, B.C.; DeJong, J.T.; Hunt, C.E.; deVlaming, L.A.; Major, D.W.; Dworatzek, S.M. Field-scale bio-cementation tests to improve sands. Proc. Inst. Civ. Eng. Geotech. Eng. 2015, 168, 206–216. [Google Scholar] [CrossRef]
- Zhang, J.M. Study on the Fundamental Mechanical Characteristisc of Calcareous Sand and the Influence of Particle Breakage. Ph.D. Thesis, Chniese Academy of Sciences, Wuhan, China, 2004. [Google Scholar]
- Liu, H.L.; Xiao, P.; Xiao, Y.; Wang, J.P.; Chen, Y.M.; Chu, J. Dynamic behaviors of MICP-treated calcareous sand in cyclic tests. Chin. J. Geotech. Eng. 2018, 40, 38–45. [Google Scholar]
- Khan, M.N.H.; Amarakoon, G.G.N.N.; Shimazaki, S.; Kawasaki, S. Coral Sand Solidification Test Based on Microbially Induced Carbonate Precipitation Using Ureolytic Bacteria. Mater. Trans. 2015, 56, 1725–1732. [Google Scholar] [CrossRef] [Green Version]
- Xiao, Y.; Liu, H.; Chen, Q.; Long, L.; Xiang, J. Evolution of particle breakage and volumetric deformation of binary granular soils under impact load. Granul. Matter 2017, 19, 71. [Google Scholar] [CrossRef]
- Ata, A.; Salem, T.N.; Hassan, R. Geotechnical characterization of the calcareous sand in northern coast of Egypt. Ain Shams Eng. J. 2018, 9, 3381–3390. [Google Scholar] [CrossRef]
- Wei, H.Z.; Zhao, T.; Meng, Q.S.; Wang, X.; He, J. Experimental evaluation of the shear behavior of fiber-reinforced calcareous sands. Int. J. Geomech. 2018, 18, 4018175.1–4018175.9. [Google Scholar] [CrossRef] [Green Version]
- Lv, Y.; Liu, J.G.; Xiong, Z.M. One-dimensional dynamic compressive behavior of dry calcareous sand at high strain rates. J. Rock Mech. Geotech. 2019, 11, 196–205. [Google Scholar] [CrossRef]
- Shahnazari, H.; Rezvani, R. Effective parameters for the particle breakage of calcareous sands: An experimental study. Eng. Geol. 2013, 159, 98–105. [Google Scholar] [CrossRef]
- Wang, X.Z.; Wang, X.; Chen, J.W.; Wang, R.; Hu, M.J.; Meng, Q.S. Experimental study on permeability characteristics of calcareous soil. Bull. Eng. Geol. Environ. 2017, 77, 1753–1762. [Google Scholar] [CrossRef]
- Chu, J.; Ivanov, V.; Stabnikov, V.; Li, B. Microbial method for construction of an aquaculture pond in sand. Geotechnique 2013, 63, 871–875. [Google Scholar] [CrossRef]
- Harkes, M.P.; Van Paassen, L.A.; Booster, J.L. Fixation and distribution of bacterial activity in sand to induce carbonate precipitation for ground reinforcement. Ecol. Eng. 2009, 36, 112–117. [Google Scholar] [CrossRef]
- Zhu, J.K.; Zhou, Y.; Wang, D.L.; Zhang, J.M. Affecting factors for calcareous sand reinforcement based on microbial induced mineralization. Geol. Sci. Technol. Inf. 2019, 38, 206–211. [Google Scholar]
- Zhao, Q. Experimental Study on Soil Improvement Using Microbial Induced Calcite Precipitation (MICP). Ph.D. Thesis, China University of Geosciences, Beijing, China, 2014. [Google Scholar]
- GB/T 50123-2019; Standard for Geotechnical Testing Method. Standard for Variable Head Penetration Test. MOHURD: Beijing, China, 2019.
- Choi, S.G.; Park, S.S.; Wu, S. Methods for calcium carbonate content measurement of biocemented soils. J. Mater. Civ. Eng. 2017, 29, 06017015. [Google Scholar] [CrossRef]
- Cui, M.J.; Zheng, J.J.; Zhang, R.J.; Lai, H.J.; Zhang, J. Influence of cementation level on the strength behaviour of bio-cemented sand. Acta Geotech. 2017, 12, 971–986. [Google Scholar] [CrossRef]
- Cheng, L.; Shahin, M.A.; Mujah, D. Influence of Key Environmental Conditions on Microbially Induced Cementation for Soil Stabilization. J. Geotech. Geoenviron. Eng. 2017, 143, 04016083. [Google Scholar] [CrossRef] [Green Version]
- Mujah, D.; Cheng, L.; Mohamed, A.S. Microstructural and Geomechanical Study on Biocemented Sand for Optimization of MICP Process. J. Mater. Civ. Eng. 2019, 31, 04019025-1–04019025-10. [Google Scholar] [CrossRef]
- Qian, K.; Wang, X.Z.; Chen, J.W.; Liu, P.J. Experimental study on permeability of calcareous sand for islands in the South China Sea. Rock Soil Mech. 2017, 38, 1557–1564. [Google Scholar]


| Groups | Cc | Cu | Dr/% | D10/mm | D30/mm | D60/mm | ρs/g·cm−3 |
|---|---|---|---|---|---|---|---|
| A1 | 1.5 | 2 | 30 | 0.25 | 0.36 | 0.5 | 2.81 |
| A2 | 60 | ||||||
| A3 | 85 | ||||||
| B1 | 1.5 | 8 | 30 | 0.25 | 0.71 | 2 | 2.78 |
| B2 | 60 | ||||||
| B3 | 85 | ||||||
| C1 | 2 | 8 | 30 | 0.25 | 1.00 | 2 | 2.80 |
| C2 | 60 | ||||||
| C3 | 85 | ||||||
| D1 | 0.5 | 8 | 30 | 0.25 | 0.5 | 2 | 2.80 |
| D2 | 60 | ||||||
| D3 | 85 | ||||||
| E1 | 1.5 | 6 | 30 | 0.25 | 0.75 | 1.5 | 2.79 |
| E2 | 60 | ||||||
| E3 | 85 | ||||||
| Y1 | 0.8 | 3.3 | 30 | 0.17 | 0.28 | 0.56 | 2.78 |
| Y2 | 60 | ||||||
| Y3 | 85 |
| Constituent | Liquid Medium | Solid Medium |
|---|---|---|
| Agar (g) | / | 20 |
| Sodium chloride (g) | 5 | 5 |
| Casein peptone (g) | 15 | 15 |
| Soya peptone (g) | 5 | 5 |
| Urea (g) | 20 | 20 |
| Deionized water (mL) | 1000 | 1000 |
Publisher’s Note: MDPI stays neutral with regard to jurisdictional claims in published maps and institutional affiliations. |
© 2022 by the authors. Licensee MDPI, Basel, Switzerland. This article is an open access article distributed under the terms and conditions of the Creative Commons Attribution (CC BY) license (https://creativecommons.org/licenses/by/4.0/).
Share and Cite
Li, Y.; Chen, J. Experimental Study on the Permeability of Microbial-Solidified Calcareous Sand Based on MICP. Appl. Sci. 2022, 12, 11447. https://doi.org/10.3390/app122211447
Li Y, Chen J. Experimental Study on the Permeability of Microbial-Solidified Calcareous Sand Based on MICP. Applied Sciences. 2022; 12(22):11447. https://doi.org/10.3390/app122211447
Chicago/Turabian StyleLi, Yanjun, and Jianwen Chen. 2022. "Experimental Study on the Permeability of Microbial-Solidified Calcareous Sand Based on MICP" Applied Sciences 12, no. 22: 11447. https://doi.org/10.3390/app122211447