Article

Effects of an Ozone-Based Domestic Clothes Washer/Dryer on Indoor Air Quality: A Probabilistic Risk Assessment Study

Department of Environmental Health Sciences, Istituto di Ricerche Farmacologiche Mario Negri IRCCS, Via Mario Negri 2, 20156 Milan, Italy
*
Author to whom correspondence should be addressed.
Current Address: European Commission Directorate General Joint Research Centre, Retieseweg 111, B-2440 Geel, Belgium.
Appl. Sci. 2022, 12(22), 11466; https://doi.org/10.3390/app122211466
Submission received: 14 October 2022 / Revised: 3 November 2022 / Accepted: 8 November 2022 / Published: 11 November 2022
(This article belongs to the Section Applied Physics General)

Abstract

:

Featured Application

A methodological approach to assess human health risks from new technologies that have potentially harmful emissions in indoor environments.

Abstract

New technologies are facing the market to overcome high energy costs and efficiency regulations. Among these, the use of ozone in domestic appliances has been recently proposed for a cold-water sanitizing system for clothes or even a no-water cycle to refresh clothes. Ozone is a contaminant in indoor environments and its toxicity is mainly due to the strong oxidizing action on cellular components that can reduce lung function and increase respiratory symptoms. This study illustrates a risk assessment for ozone emissions released from new domestic clothes washer/dryer during normal operation and in the case of a failure. Indoor ozone concentrations were measured, and a mass-balance model was applied, considering ozone released from the appliance during the no-water cycle and the outdoor ozone contribution. Monte Carlo analysis was used to derive the probability of exceeding the air quality standards established by the main international organizations for the protection of human health. This study indicated the most suitable ozone generator and the best refresh cycle to minimize health risks. This method can be generally used to assess the potential health risk for the indoor environment, due to the release of harmful emissions from household appliances.

1. Introduction

There is an urgent need to accelerate global energy efficiency. Despite having similar climates, the International Energy Agency (IEA) showed that the average home in some EU nations uses approximately twice as much energy, mainly for heating, as homes in other nations. Over the past five years, the annual rate of increase in house efficiency has also varied; some nations have made no progress at all, while others have reduced energy usage per square meter by as much as 4% annually [1].
In this scenario, it is well known that wet appliances, such as washing machines, dishwashers and tumble dryers, account for some of the highest household energy consumption regarding home appliances. Recently, cloth washers/dryers are being offered on the market with a new feature, the “refresh” cycle (RC), a no-water cycle that claims to refresh and deodorize clothes without a full wash cycle. Innovative technologies such as the use of steam or ozone are now being applied to consumer-level machines to remove unpleasant odors. Ozone treatments, indeed, are well known for their antibacterial effect and are widely used for disinfection, allowing a cold-water sanitizing wash where high electricity costs and efficiency regulations make high temperature sanitizing difficult.
Ozone is ubiquitous in the environment and is formed naturally from oxygen by ultraviolet light and by atmospheric electrical discharges. The highest levels of ozone in the atmosphere are in the stratosphere (ozone layer) where they protect the earth from the sun’s harmful rays, adsorbing 97–99% of the sun’s medium-frequency ultraviolet light. However, ground-level ozone is the main component of photochemical smog, which is the result of a complex series of reactions involving energy from solar radiation, nitrogen oxides, carbon monoxide and volatile organic compounds (VOCs). These ozone precursors mainly arise from automobile and industrial emissions [2,3].
Ozone is also a contaminant indoors. Its sources include ozone generators (i.e., devices sold as home air cleaners that produce ozone intentionally), and office equipment such as printers and photocopiers. Indoor ozone concentrations are also influenced by the rate of air exchange rate with the outside environment and outdoor ozone concentrations. Therefore, the formation and destruction of indoor ozone are both due to its indoor sources, outdoor concentrations, entry of outside air, indoor air circulation rates and reactions with other gaseous chemicals in indoor air and with surfaces [4].
Ozone is a strong oxidant and reacts rapidly on surfaces and with other constituents occurring in the atmosphere. Ground-level ozone toxicity [5] is mainly due to its strong oxidizing action on cellular components such as unsaturated and polyunsaturated acids, and the thiol group of proteins [6]. Oxidation occurs both directly, by reaction with lipids, and through the formation of byproducts such as organic and hydrogen peroxides, aldehydes and organic radicals [3]. In human controlled-exposure studies [7,8,9,10], both short (up to 4 h) and longer (from 4 to 8 h) exposure of healthy young adults to ozone caused irritation of the respiratory system and diminished lung function, with an increase in complaints such as headaches, eye irritation and coughs. People with lung disease, children, older adults and people who are active outdoors may be particularly sensitive to ozone [10,11].
We used a Monte Carlo simulation to perform a risk assessment study of the potential health effects of ozone released during the no-water cycle of a clothes dryer, in normal conditions and in the case of failure or inappropriate use. The specific aims were: (a) to measure the ozone concentrations in an indoor environment assuming different scenarios of normal/wrong working cycles and/or inappropriate use; (b) to assess human exposure to ozone as a result of release from the dryer and taking outdoor concentrations into account; (c) to establish a safe ozone concentration below which the risk of adverse effects could be considered negligible for the most sensitive sub-population; and (d) to describe an ozone generator and an RC to minimize human health risks.

2. Materials and Methods

2.1. Experimental Measurements

Ozone was measured with a certified X-am 5000 multi-gas detector equipped with a metal oxide semiconductor XXS Drager ozone sensor (Draeger Safety S.p.A., Corsico, Milano, Italia). The sensor has a 0–10 ppm range with 0.01 ppm resolution. The multi-gas detector has an optional pump, with a 1.5 m sampling line, that was used to sample the atmosphere inside the dryer while it was working. Ozone data were used on the basis of a valid calibration and performance certificate from the manufacturer.
A commercially available condenser tumble dryer was used with no hardware modifications beside the ozone generator and ozone piping installation. The dryer was housed in a medium-sized empty room (25.5 m3), maintained at 24.5 °C, 45% relative humidity, with no openings, in agreement with the requirements for household air-cleaning electrical appliances [12]. The dryer was positioned on the floor, at 500 mm from the back wall, and the room was equipped with a computerized recirculation system, used to clean up ozone residuals after the experiments.
Ozone generated in the dryer was produced with ozone generators (Shangai Zero Industrial Co. Ltd., Shanghai, China) with a declared nominal production rate of >5, >25 and >60 mg/h. The actual production rate was verified by direct sampling of the generator input and output airflow, with the ozone gas detection system, after a ten-times dilution with dry synthetic air, to keep the ozone output concentration within the sensor analytical range.
The ozone half-life in the room conditions was obtained by experimentally measuring ozone decay. The ozone generators were placed on the dryer 1.5 m from the sensor and were turned on until the ozone concentration reached steady state. Then, the concentration was measured continuously for 12 h and the half-life was calculated by fitting exponential decay curves of ozone concentration over time.
Ozone generators and dryer movements were controlled by the dryer logic board, after adapting the software for the desired cycling times.
To assess the exposure, ozone concentration was measured in front of the dryer, approximately 300 mm from its door and 300 mm off the floor, simulating a child sitting or playing in front of the appliance. Ozone concentrations in the dryer were obtained by placing the sensor inside, when it was working without textiles. When textiles were present, the sensor sampling tube was placed in the middle of the dryer space. The textiles used were a 1.5 kg mixture of clean, dry, white cotton and pieces of wool fabrics.

2.2. Risk Assessment

Risk assessment was completed following the four basic steps of such process: (1) hazard identification; (2) toxicological evaluation; (3) exposure assessment; and (4) risk characterization. Hazard identification was the release of ozone from the dryer in different working conditions and/or malfunctioning. Toxicological evaluation was based on a literature search in PubMed and different web sites to identify controlled animal and human studies on ozone toxicity and safety levels established by the main national and international organizations for health protection. For exposure assessment, two different scenarios were employed to estimate the risk due to the release of ozone from the dryer: one long and one acute exposure. The long exposure was evaluated by an approach based on the mass-balance model developed by Morrison and coworkers [13] to set the maximum emission rates from ozone-emitting consumer appliances to respect the maximum indoor ozone concentration goal:
S = (λ + kd)VCL − VλC0P
where S is the emission rate of the appliance; λ is the rate of air exchange rate with outdoor air; kd the net ozone decay rate; V the room or building volume; CL the maximum indoor ozone concentration goal; C0 the outdoor ozone concentration; and P the penetration of ozone through the building shell (1 = 100% penetration). We used this model because direct measures of ozone in the room where the dryer was placed were not representative of a real scenario since, as mentioned before, the room was completely isolated, so the contribution of outdoor ozone was not considered. Thus, we used Equation (1) to calculate the indoor ozone concentration resulting from the dryer working as a continuous source of ozone (e.g., occurring in case of breakdown of the ozone generator) and the contribution of outdoor ozone.
To take into account the variability of the parameters λ, kd, and C0, we applied the Monte Carlo analysis, with Crystal Ball software 2000.51. The single values and the distribution parameters assigned to each variable of Equation (1) are shown in Table 1: we used a small room (V = 15 m3) and the “worst case” in terms of the ozone penetration factor through the building shell (P = 1, equivalent to 100% penetration). The λ values (mean ± standard deviation 0.51 ± 0.68 h−1) were found in the literature [13], and the ozone Kd was calculated from our experimental measures (mean ± standard deviation 3.75 ± 2.10 h−1). Both these parameters were fitted to a log-normal distribution. The C0 values (mean ± standard deviation 42.5 ± 41.8 µg/m3) refer to the average annual ground-level ozone concentration, based on the actual hourly ozone data that were gathered from local monitoring sites of the Regional Environmental Protection Agency (http://ita.arpalombardia.it/ITA/index.asp (accessed on 17 December 2021)) in Milan, and fitted to a log-normal distribution.
To assess acute exposure to ozone and the possible risks for health, we considered a scenario representing the worst case of a highly sensitive person, such as an asthmatic child, who might accidentally open the dryer while it is working. In general, children are at greatest risk from exposure to ozone and other air pollutants because their lungs and immune system are still developing, and they inhale more air, in relation to their body weight [14,15,16]. We also assumed that the dryer was accidentally working empty (i.e., with no removal of ozone due to reactions with the surfaces of the clothes) and that the acute exposure ozone concentration was the same as inside the dryer.
Finally, for risk characterization, we compared the ozone exposure concentrations estimated in the long and short scenarios with the health-based guidance values and air quality standards found in the literature, and we estimated the probability of exceeding these values using Monte Carlo analysis.

3. Results

3.1. Toxicological Evaluation

Table 2 shows the toxicological parameters, health-based guidance values and air quality standards for the protection of human health established by the different national and international organizations, found by our literature search. The toxicological parameters included the Lowest Observed Adverse Effect Level (LOAEL) and the No Observed Adverse Effect Level (NOAEL) from experimental studies for both short and prolonged exposure to outdoor ozone, established by Health Canada [3]. A LOAEL of 120 ppb for short exposure to ozone (up to 4 h) (Table 2) was obtained from studies in humans, showing lung function decrements and increased breathing frequency [7,8,9,10] after controlled exposure to ozone. For longer exposure (from 4 to 8 h), Adams [17,18] investigated the effects of 6.6 h exposure in healthy adults while doing intermittent exercise; one of these studies [17] considered different exposure levels (40, 80 and 120 ppb) to establish the dose–response relationship. Since this study found no significant effects occurred at the lowest exposure level of 40 ppb, compared to subjects exposed to filtered air, this concentration was set as the NOAEL for prolonged exposure (Table 2). Significant effects were seen at 80 and 120 ppb, with greater decreases in pulmonary function and increases in respiratory symptoms at 120 than at 80 ppb. Therefore, the LOAEL was set at 80 ppb for this duration (Table 2).
Health Canada also derived a Reference Concentration (RfC), which is a health-based guidance concentration below which there should be a negligible risk of adverse health effects after lifetime exposure. The RfC was estimated by dividing the experimentally derived NOAEL by the uncertainty factor of 10 for intra-species variability.
This RfC should be used for a recommended Maximum Exposure Limit (MEL) for residential indoor environments (Table 2), taking account of the feasibility of achieving such a limit. An exposure limit based on the RfC of 4 ppb for prolonged ozone exposure, however, was considered not achievable in many homes, mainly because of the outdoor ozone concentrations [21]. Health Canada therefore established a MEL of 20 ppb for ozone, based on an average time of 8 h. Consequently, for our study we took 20 ppb as a safe ozone concentration that should not be exceeded in indoors for long exposure, considering the ozone released from the dryer during its normal operation, plus outdoor ozone concentration.
Air quality standards defined by the European Union (EU) [19] and World Health Organization (WHO) [20] refer to long and short exposure to outdoor ozone (Table 2), and come from an assessment of the effects of ozone exposure on life expectancy. The “information threshold” and the “alert threshold” indicate the outdoor ozone concentrations above which, after a short exposure of 1 h, there is a health risk in the most sensitive sub-population, such as people with asthma or cardiovascular diseases (“information threshold”, 90 ppb), and the general population (“alert threshold”, 120 ppb) [22].
For long exposure, the EU and WHO established as air quality standards for outdoor ozone (8-h average exposure), a target of 60 ppb and the Air Quality Guideline (AQG) of 30 ppb, respectively (Table 2).
Table 3 shows the Threshold Limit Values (TLV) for acute and long exposure, from occupational studies, suggested by the National Institute for Occupational Safety and Health (NIOSH) of the Centers of Disease Control and Prevention of the U.S. Department of Health and Human Services. Chronic exposure was evaluated for different kinds of work, indicating a Time-Weighted Average (TWA) for light work (0.1 ppm), moderate work (0.08 ppm) and heavy work (0.05 ppm); for acute exposure, a single value, Immediately Dangerous for Life and Health (IDLH), 5 ppm, was established.
The TLV-IDLH is defined as the maximum concentration of a toxic substance to which a healthy person can be exposed for 30 min without irreversible adverse health effects which may hinder escape [23,24]. We used the TLV-IDLH to establish a “safe level” for acute exposure to ozone resulting from the inappropriate use of the dryer in a domestic environment. Since TLV-IDLH is used for occupational studies, referring to healthy adult workers, we extrapolated it to the general population by applying a safety factor of 10 (intra-species variability). We then applied a further safety factor of 3.16 [25,26] to consider the most sensitive sub-groups, such as asthmatic children. We obtained a safety level of 160 ppb below which the risk of health adverse effects, following very short exposure, could be acceptable even for the most sensitive individuals.

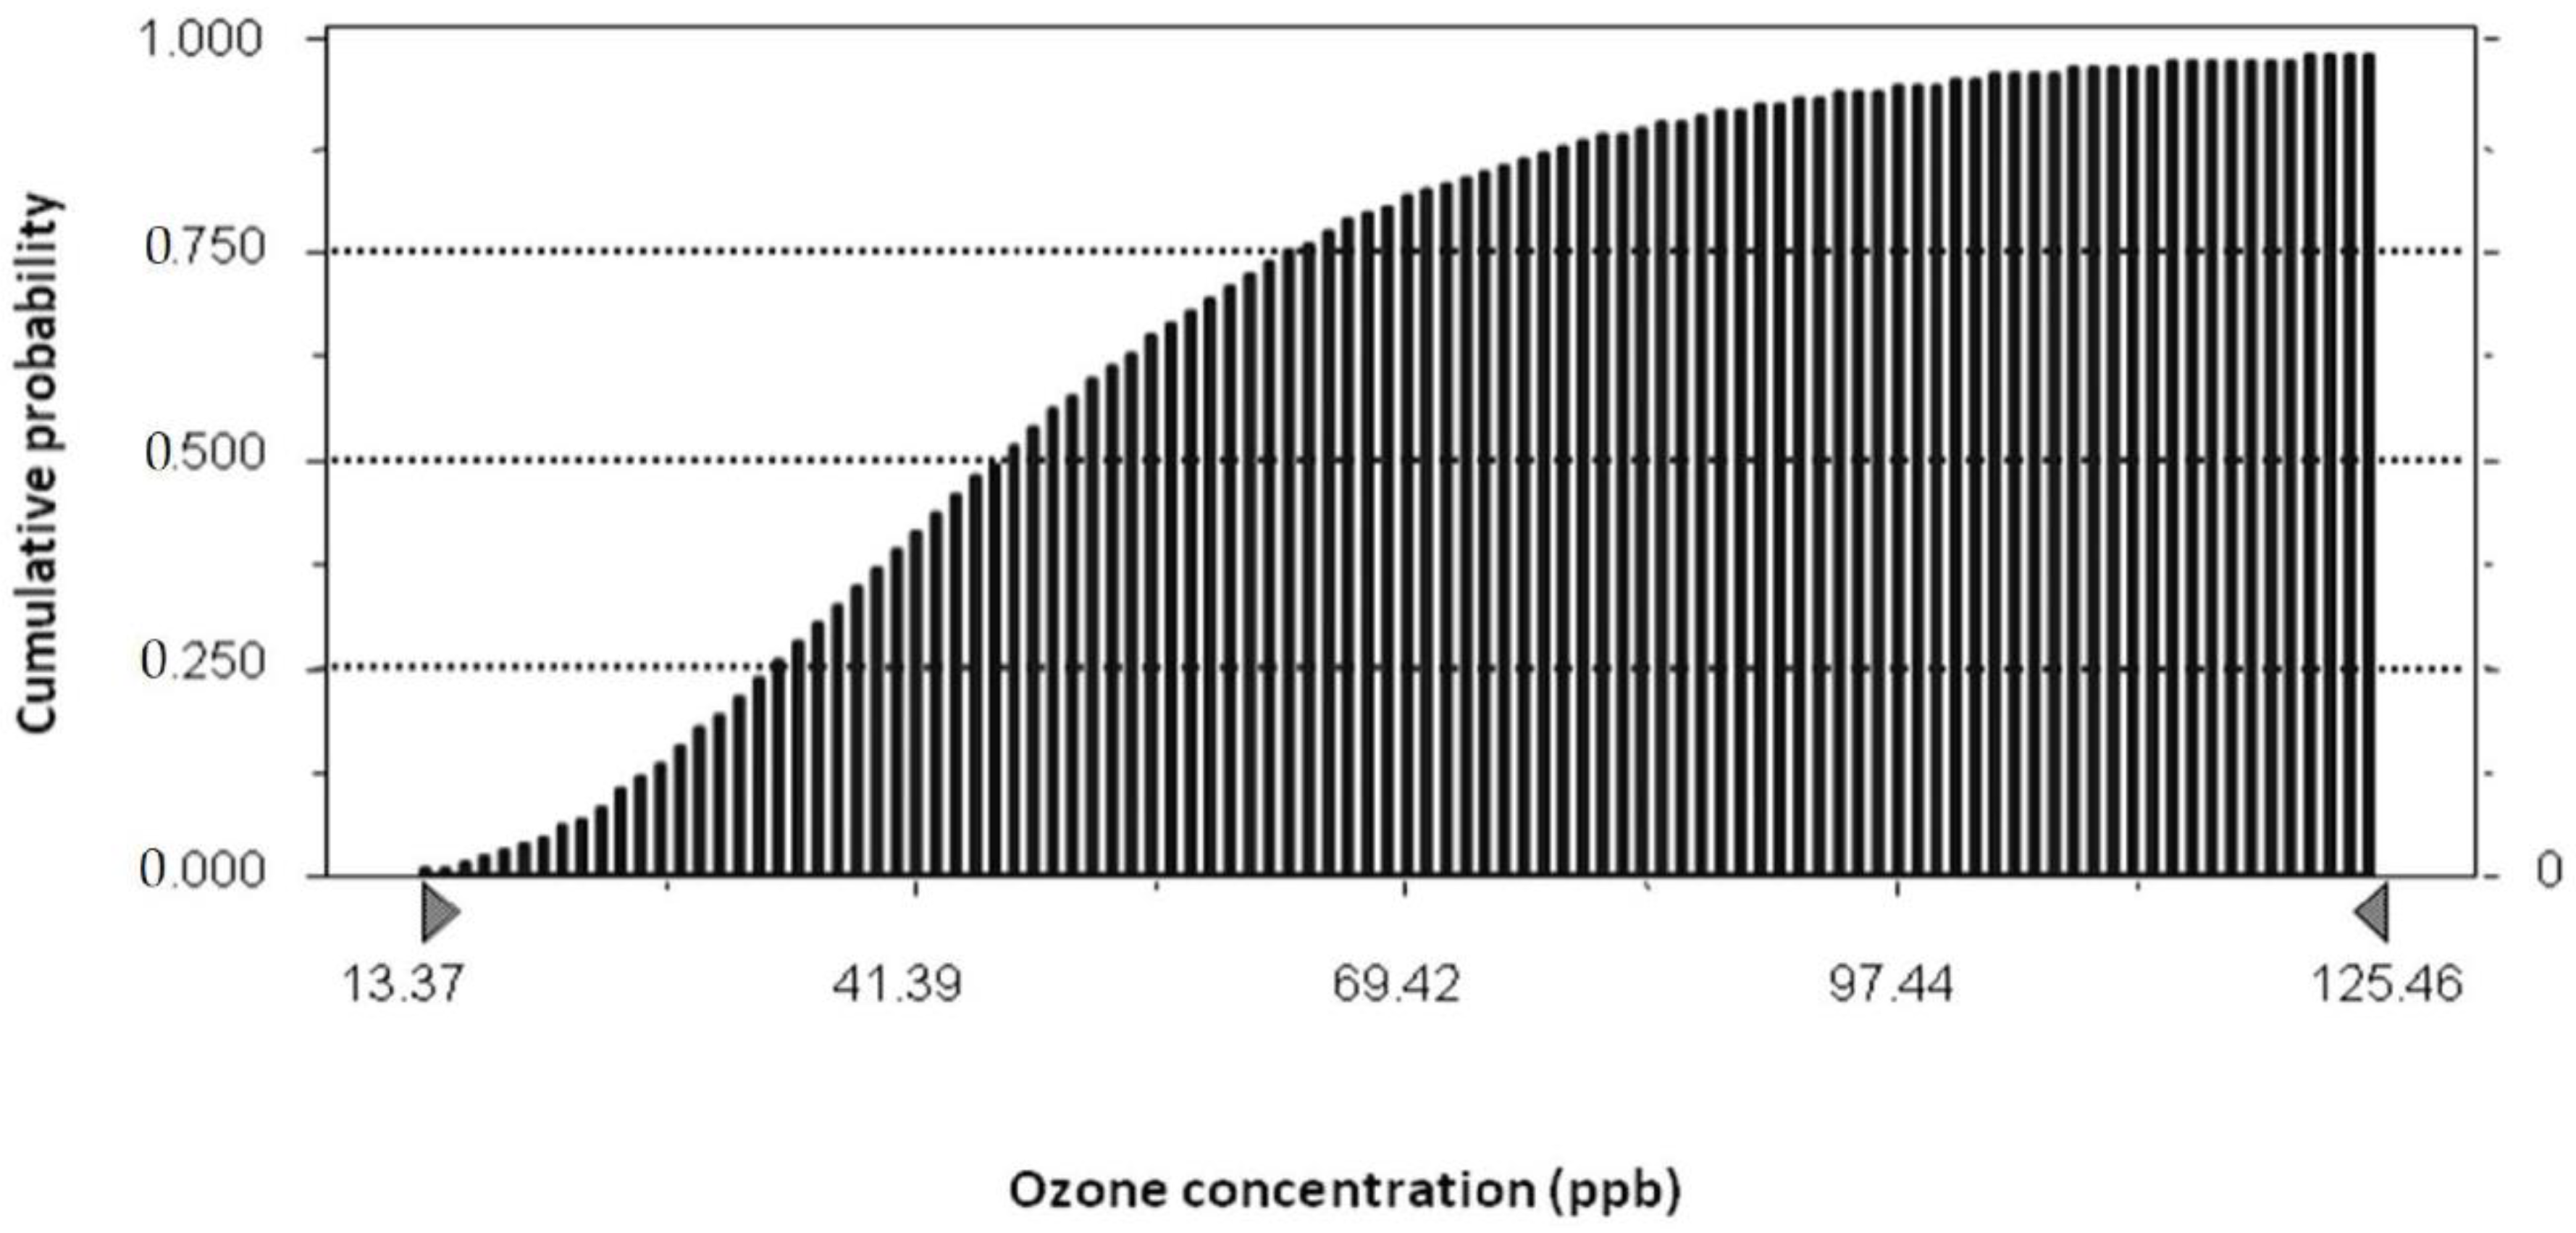
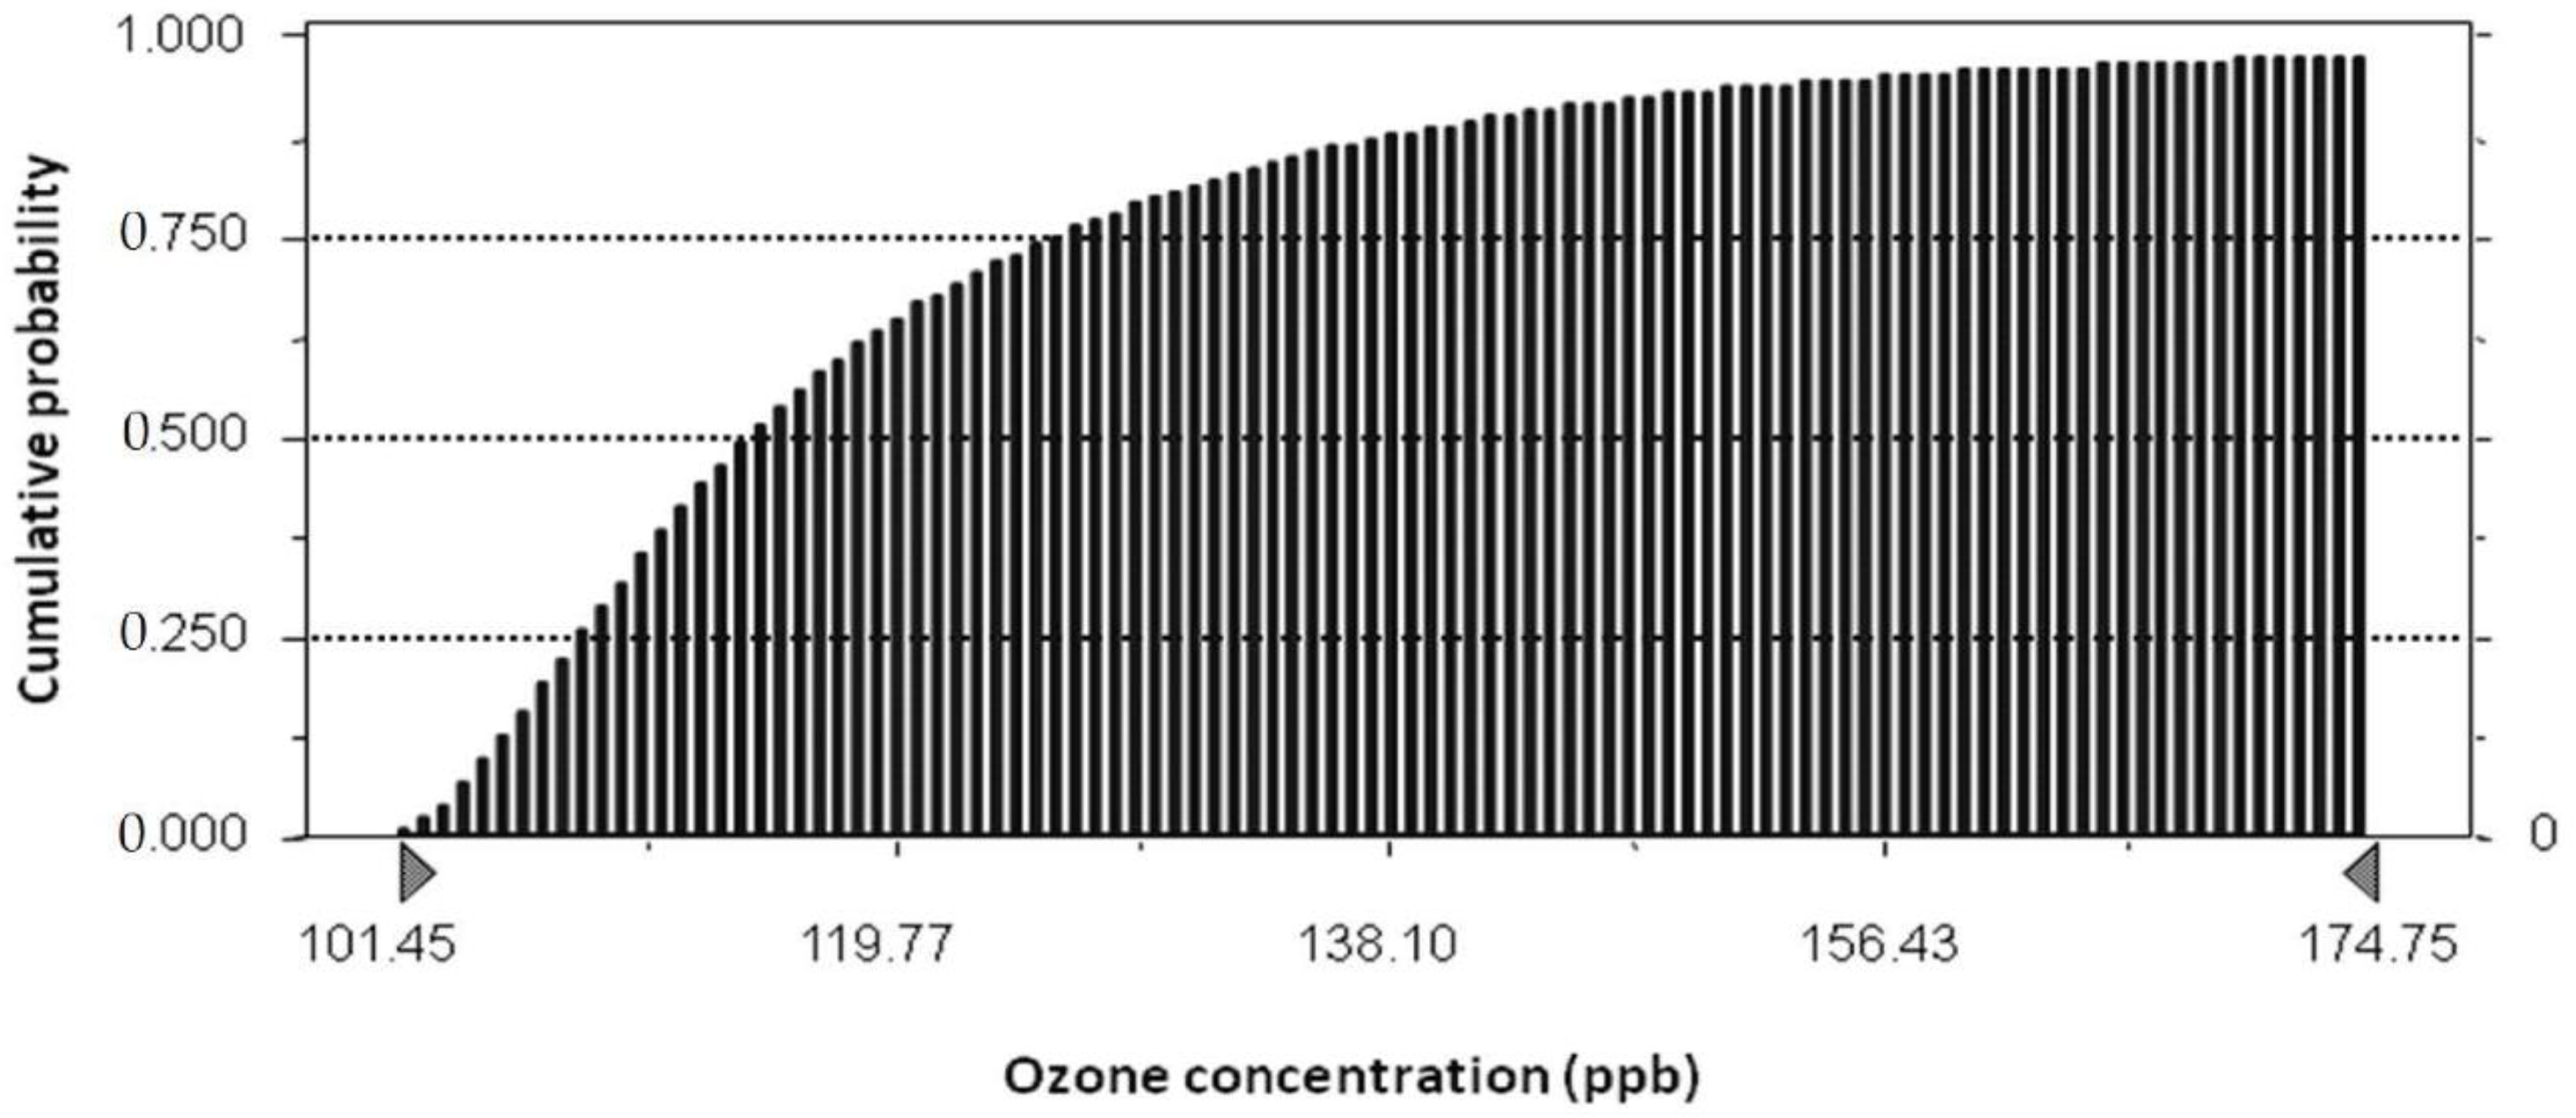
3.2. Exposure Assessment

The maximum ozone concentrations measured in the test room, placing the 60 and 110 mg/h ozone generator outside the appliance, were 100 and 180 ppb reached after 15 and 27 min. Both experiments gave the same concentration decay profile and the ozone half-life in the test room was 16.01 min (Figure 1). This was consistent with previous data showing a half-life range of 6–30 min, due to surface removal, with no air exchange and no main reactant chemicals [27] and 15–60 min [28] in a 1 m3 experimental chamber.
Ozone concentrations inside and outside the dryer, when the dryer was working either empty or loaded with fabrics, showed that reactions with fabrics were very important for the ozone decay, and the concentrations dropped quickly inside the drum when it was working loaded.
Ozone concentrations, using the low-level 5 mg/h ozone generator, reached a maximum of 100 ppb inside the empty dryer (Figure 2). Outside the dryer, in the room, ozone concentrations were always below our instrumental limit of detection (LOD) of 10 ppb.
The results of the mass-balance model, using the Monte Carlo simulation, are illustrated in the cumulative probability chart in Figure 3. The median and the 90th percentile of ozone concentration in the room when the dryer was working with an ozone emission rate of 5 mg/h as continuous source, were 47 and 85 ppb, respectively. The acute exposure scenario is illustrated in Figure 4. The maximum ozone concentration inside the drum during RC, with the 5 mg/h ozone generator, was 100 ppb. Using this figure, maximum ozone concentrations in the room just in front of the dryer, after accidentally opening the empty, fully working appliance, and taking into account the outdoor ozone, were 115 and 143 ppb for the 50th and 90th percentiles, respectively.
Such exposure would occur only for a short time because of the fast ozone decay due to removal reactions with the room surfaces and the other atmospheric gases.

3.3. Risk Characterization

When the dryer was working normally with an ozone generator of 5 mg/h, both with or without clothes inside, the ozone air concentration in the room with no outdoor air exchange was always below the LOD of the ozone analyzer (10 ppb) and therefore below the MEL of 20 ppb established by Health Canada for indoor environments (Table 2).
Considering the contribution of the outdoor ozone, and simulating malfunctioning of the dryer so that it worked as a continuous source, without clothes inside, the 50th and 90th percentiles of concentrations in the room were 47 and 85 ppb. These concentrations were the result of a “worst case” scenario, not of the appropriate normal operation of the appliance, and were always below the “information threshold” and the “alert threshold” for 1-h average exposure; they slightly exceeded the “target values” and “AQG” for 8-h average exposure, and significantly exceeded the MEL of 20 ppb (Table 2). However, the latter limits are related to 8-h exposure, and a person is very unlikely to stay exposed for so long in a room with the dryer malfunctioning. Moreover, the concentrations in this scenario were driven more by the outdoor ozone concentrations rather than to the device itself, highlighting the issue of the background outdoor ozone concentrations, which frequently exceed the health-based guidance values.
The scenario for acute exposure (Figure 4) showed that the median and 90th percentiles of the concentration distribution were 115 and 143 ppb, respectively. These concentrations, which occurred in the room for a very short period because of the high reactivity and decay of ozone, are below the safety exposure level of 160 ppb that we extrapolated from the limit for occupational acute exposure. The concentrations are close to the alert threshold of 120 ppb indicated by the European Commission [19]. However, the alert threshold refers to a short exposure of 1 h. Monte Carlo analysis showed that the probability of obtaining total indoor concentrations of ozone below the safety level of 160 ppb, and the alert threshold of 120 ppb, were, respectively, 95.6% and 62.9%.

4. Discussion

This risk assessment case study illustrates a method for assessing the potential health risk due to the release of potentially harmful emissions from household appliances. We simulated different worst-case scenarios, including malfunctioning of appliances and outdoor pollution. Monte Carlo analysis was used to estimate the probability of exceeding the health-based guidance values established by international organizations. The results in this study indicate that the use of a 5 mg/h ozone generator in dryers is suitable for an indoor use, with respect to human health risks, taking into account both the indoor environment characteristics and the local regional outdoor ozone levels. Ozone indoor levels, due to the dryer, were lower than the MEL of 20 ppb established by Health Canada for indoor environments, and compatible with the alert threshold of 120 ppb, indicated by the European Commission, in case of accidental exposure when outdoor ozone concentration contribution was considered. For these reasons, it seems that this new generation of appliances based on the use of ozone could be considered safe for human health.

5. Conclusions

Innovative technologies that increase energy efficiency are essential. In preparation for the UN Climate Change Conference, the IEA is leading a global drive to double the efficiency of important appliances marketed internationally [29]. For this reason, future research should consider all new technological approaches as an important tool to support existing efficiency policy frameworks, but should always be developed by managing the health risk for populations and also using quantitative risk assessment tools. Ozone’s toxicological properties should always be assessed as a preliminary step before launching new products, even though the study’s data indicate that the health risks are tolerable for this product.

Author Contributions

Conceptualization, E.D. and E.F.; methodology, E.D., V.P. and E.F.; formal analysis, E.D., V.P. and E.F.; writing—original draft preparation, E.D., V.P. and E.F.; writing—review and editing, E.D. and E.F.; supervision, E.D. and E.F.; funding acquisition, E.D. All authors have read and agreed to the published version of the manuscript.

Funding

This research was supported by an unrestricted research grant funded by Indesit S.p.A.

Institutional Review Board Statement

Not applicable.

Informed Consent Statement

Not applicable.

Data Availability Statement

The data that support the findings of this study are available from the corresponding author, (E.D.), upon reasonable request.

Acknowledgments

We are grateful to Giuseppina Potena and Luca Bossi, from the Indesit Company, Category Laundry, R&D Dryer. We also thank J. D. Baggot for English editing.

Conflicts of Interest

The authors declare no conflict of interest.

References

  1. Accelerating Energy Efficiency: What Governments Can Do Now to Deliver Energy Savings—Analysis. Available online: https://www.iea.org/commentaries/accelerating-energy-efficiency-what-governments-can-do-now-to-deliver-energy-savings (accessed on 3 October 2022).
  2. Emissions of Ozone Precursors—European Environment Agency. Available online: https://www.eea.europa.eu/data-and-maps/indicators/emissions-of-ozone-precursors-version-2/assessment-4 (accessed on 30 September 2022).
  3. Zhang, J.; Wei, Y.; Fang, Z. Ozone Pollution: A Major Health Hazard Worldwide. Front. Immunol. 2019, 10, 2518. [Google Scholar] [CrossRef] [PubMed] [Green Version]
  4. Health Canada. Residential Indoor Air Quality Guideline: Ozone. Available online: https://www.canada.ca/en/health-canada/services/publications/healthy-living/residential-indoor-air-quality-guideline-ozone.html (accessed on 30 September 2022).
  5. Soares, A.R.; Silva, C. Review of Ground-Level Ozone Impact in Respiratory Health Deterioration for the Past Two Decades. Atmosphere 2022, 13, 434. [Google Scholar] [CrossRef]
  6. Swanson, T.J.; Jamal, Z.; Chapman, J. Ozone Toxicity. In StatPearls; StatPearls Publishing: Treasure Island, FL, USA, 2022. [Google Scholar]
  7. Krishna, M.T.; Blomberg, A.; Biscione, G.L.; Kelly, F.; Sandstrom, T.; Frew, A.; Holgate, S. Short-Term Ozone Exposure Upregulates P-Selectin in Normal Human Airways. Am. J. Respir. Crit. Care Med. 1997, 155, 1798–1803. [Google Scholar] [CrossRef] [PubMed]
  8. Liu, L.-J.S.; Koutrakis, P.; Leech, J.; Broder, I. Assessment of Ozone Exposures in the Greater Metropolitan Toronto Area. J. Air Waste Manag. Assoc. 1995, 45, 223–234. [Google Scholar] [CrossRef] [PubMed] [Green Version]
  9. McDonnell, W.F.; Horstman, D.H.; Hazucha, M.J.; Seal, E.; Haak, E.D.; Salaam, S.A.; House, D.E. Pulmonary Effects of Ozone Exposure during Exercise: Dose-Response Characteristics. J. Appl. Physiol. Respir. Environ. Exerc. Physiol. 1983, 54, 1345–1352. [Google Scholar] [CrossRef] [PubMed]
  10. Seal, E.; McDonnell, W.F.; House, D.E. Effects of Age, Socioeconomic Status, and Menstrual Cycle on Pulmonary Response to Ozone. Arch. Environ. Health Int. J. 1996, 51, 132–137. [Google Scholar] [CrossRef]
  11. USEPA. Ozone Population Exposure Analysis for Selected Urban Areas; U.S. Environmental Protection Agency: Research Triangle Park, NC, USA, 2005.
  12. International Electrotechnical Commission. Particular Requirements for Air-Cleaning Appliances; INTERNATIONAL STANDARD IEC 60335-2-65; International Electrotechnical Commission: Research Triangle Park, NC, USA, 2002. [Google Scholar]
  13. Morrison, G.; Shaughnessy, R.; Shu, S. Setting Maximum Emission Rates from Ozone Emitting Consumer Appliances in the United States and Canada. Atmos. Environ. 2011, 45, 2009–2016. [Google Scholar] [CrossRef]
  14. Schwartz, J. Air Pollution and Children’s Health. Pediatrics 2004, 113, 1037–1043. [Google Scholar] [CrossRef] [PubMed]
  15. World Health Organization. Children’s Health and the Environment: A Global Perspective: A Resource Manual for the Health Sector/J. Pronczuk de Garbino, Editor-in-Chief. 2005. Available online: https://apps.who.int/iris/handle/10665/43162 (accessed on 3 November 2022).
  16. Dimakopoulou, K.; Douros, J.; Samoli, E.; Karakatsani, A.; Rodopoulou, S.; Papakosta, D.; Grivas, G.; Tsilingiridis, G.; Mudway, I.; Moussiopoulos, N.; et al. Long-Term Exposure to Ozone and Children’s Respiratory Health: Results from the RESPOZE Study. Environ. Res. 2020, 182, 109002. [Google Scholar] [CrossRef] [PubMed]
  17. Adams, W.C. Comparison of Chamber and Face Mask 6.6-Hour Exposure to 0.08 Ppm Ozone via Square-Wave and Triangular Profiles on Pulmonary Responses. Inhal. Toxicol. 2003, 15, 265–281. [Google Scholar] [CrossRef] [PubMed]
  18. Adams, W.C. Relation of Pulmonary Responses Induced by 6.6-h Exposures to 0.08 Ppm Ozone and 2-h Exposures to 0.30 Ppm Ozone via Chamber and Face-Mask Inhalation. Inhal. Toxicol. 2003, 15, 745–759. [Google Scholar] [CrossRef] [PubMed]
  19. Union Pean. Directive 2008/50/EC of the European Parliament and of the Council of 21 May 2008 on Ambient Air Quality and Cleaner Air for Europe. Off. J. Eur. Union 2008, 152, 1–44. [Google Scholar]
  20. World Health Organization. WHO Global Air Quality Guidelines: Particulate Matter (PM2.5 and PM10), Ozone, Nitrogen Dioxide, Sulfur Dioxide and Carbon Monoxide; World Health Organization: Geneva, Switzerland, 2021; ISBN 9789240034228. [Google Scholar]
  21. Nazaroff, W.W.; Weschler, C.J. Indoor Ozone: Concentrations and Influencing Factors. Indoor Air 2022, 32, e12942. [Google Scholar] [CrossRef] [PubMed]
  22. Sousa, S.I.V.; Alvim-Ferraz, M.C.M.; Martins, F.G. Health Effects of Ozone Focusing on Childhood Asthma: What Is Now Known—A Review from an Epidemiological Point of View. Chemosphere 2013, 90, 2051–2058. [Google Scholar] [CrossRef] [PubMed]
  23. Toxicology of Drugs and Chemicals by Deichmann, William B. & Gerarde, Horace W.: (1969) Fourth Edition|Xochi’s Bookstore & Gallery. Available online: https://www.abebooks.com/9780122088582/Toxicology-Drugs-Chemicals-Deichmann-William-0122088581/plp (accessed on 30 September 2022).
  24. Giel, C.; Kleinfeld, M.; Tabershaw, I.R. Health Hazards Associated with Inert-Gas-Shielded Metal Arc Welding. AMA Arch. Ind Health 1957, 15, 27–31. [Google Scholar] [PubMed]
  25. US EPA. Ozone (O3) Air Quality Standards. Available online: https://www.epa.gov/naaqs/ozone-o3-air-quality-standards (accessed on 30 September 2022).
  26. Renwick, A.G.; Lazarus, N.R. Human Variability and Noncancer Risk Assessment- An Analysis of the Default Uncertainty Factor. Regul. Toxicol. Pharm. 1998, 27, 3–20. [Google Scholar] [CrossRef] [PubMed]
  27. Weschler, C.J. Ozone in Indoor Environments: Concentration and Chemistry. Indoor Air 2000, 10, 269–288. [Google Scholar] [CrossRef] [PubMed] [Green Version]
  28. Baba, S.; Satoh, S.; Yamabe, C. Development of Measurement Equipment of Half Life of Ozone. Vacuum 2002, 65, 489–495. [Google Scholar] [CrossRef]
  29. A Call to Action on Efficient and Smart Appliances—Analysis. Available online: https://www.iea.org/articles/a-call-to-action-on-efficient-and-smart-appliances (accessed on 3 November 2022).
Figure 1. Half-life curve of ozone decay in the test room. A least squares regression method was used to fit experimental data.
Applsci 12 11466 g001
Figure 2. Ozone concentrations inside the empty dryer with a 5 mg/h ozone generator. Outside ozone was undetectable (<10 ppb) under this experimental setup.
Applsci 12 11466 g002
Figure 3. Monte Carlo analysis results reached after 20,000 simulation trials, showing the cumulative probability plot for ozone concentrations in a small room (15 m3), with a penetration factor of ozone through the building shell of 100% and assuming the dryer was working as a continuous source of 5 mg/h.
Applsci 12 11466 g003
Figure 4. Monte Carlo analysis results reached after 20,000 simulation trials, showing the cumulative probability plot for ozone concentrations in front of the dryer for a very short period after accidentally opening the machine while it was working empty, with an ozone source of 5 mg/h.
Applsci 12 11466 g004
Table 1. Values assigned to each parameter of the mass-balance model.
S (mg/h)P (Unitless)V (m3)Kd (h−1) aλ (h−1) aC0(µg/m3) a
51153.75 ± 2.10 0.51 ± 0.68 42.5 ± 41.8
a values as mean ± standard deviation. Legend: S = ozone source emissions; P = penetration of the building shell; V = room volume; Kd = ozone decay rate (calculated from the t ½ of 16.01 min measured in our laboratory experiments); λ = air exchange; C0 = mean annual ozone concentration using data from the Regional Protection Agency.
Table 2. Toxicological parameters, health-based guidance values and air quality standards for short and long exposure to outdoor and indoor ozone.
Toxicological Parameters/Health-Based Guidance Values/Air Quality StandardsOrganizationsReference
Outdoor
Short exposureLong exposure
LOAEL a = 120 ppb
RfC c = 4 ppb
NOAEL b = 40 ppb
LOAEL b = 80 ppb
RfC c = 4 ppb
Health Canada[4]
Information threshold = 90 ppb
Alert threshold= 120 ppb
Target valued = 60 ppbEuropean Union[19]
Air Quality Guideline = (AQG) d = 30 ppb eWorld Health Organization[20]
Indoor
Maximum Exposure Limit f = 20 ppbHealth Canada[4]
a up to 4 h; b 6.6-h average exposure; c for both short and long exposure; d defined as the average of daily maximum 8-h mean concentration in the six consecutive months with the highest six-month running-average O3 concentration; e WHO AQG as above, converted in ppb for table uniformity; f 1-h average exposure; LOAEL = Lowest Observed Adverse Effect Level; NOAEL = No Observed Adverse Effect Level; RfC = Reference Concentration.
Table 3. Occupational limits for acute and chronic exposure to ozone defined by the National Institute for Occupational Safety and Health (NIOSH).
Acute Exposure aChronic Exposure bReference
TLV-IDLH = 5 ppmTLV-TWA = 0.1 ppm light work
TLV-TWA = 0.08 ppm moderate work
TLV-TWA = 0.05 ppm heavy work
[23]
a 30-min exposure to the maximum ozone concentration; b occupational exposure-whole life—8 h/day, 40 h/week, 50 weeks/year; Legend: TLV= Threshold Limit Value; IDLH = Immediately Dangerous for Life and Health; TWA= Time-weighted Average.
Publisher’s Note: MDPI stays neutral with regard to jurisdictional claims in published maps and institutional affiliations.

