Abstract
One of the technical challenges in multi-unit probabilistic safety assessment (MUPSA) is dealing with numerous combinations of plant operational states (POSs) for each nuclear power plant unit. Since the number of possible combinations of POSs increases exponentially with the number of units, it is impractical to develop separate MUPSA models and assess the risk for each POS combination. This paper proposes a pragmatic approach to modeling combinations of POSs for each reactor unit in MUPSA involving up to 10 reactor units. This approach does not focus on selecting representative POS combinations but rather on screening out non-risk-significant accident sequences in a stepwise manner according to the model quantification results. The effectiveness of the approach is demonstrated by application to cases with four different numbers of units. As a result, in the 2-, 4-, and 6-unit cases, the site and multi-unit core damage frequency (CDF) due to a multi-unit loss of offsite power initiating event are successfully calculated without screening out any accident sequences for each unit. In the 10-unit case, the quantification fails without screening, but it succeeds after reducing the model size by about 43% via the exclusion of the accident sequences in each integrated single-unit model with a CDF contribution of less than 0.1%. The results show that the minimal cut sets obtained in each case cover many POS combinations and that most non-risk-significant POS combinations can be truncated by the cutoff value of 1E-14/yr. In addition, comparing the quantification results according to the stepwise screening criteria shows that the proposed approach can effectively reduce the computational burden in MUPSA without losing much accuracy or realism.
1. Introduction
1.1. Modeling POS Combinations as an Issue in MUPSA
Since the Fukushima Dai-ichi nuclear accident in 2011, interest and investment in multi-unit probabilistic safety assessment (MUPSA) for nuclear power plants (NPPs) has surged in many countries as well as at the International Atomic Energy Agency (IAEA) and the Nuclear Energy Agency [1]. Following the seminal Ottawa workshop in 2014 [2], significant progress has been made in several technical areas, such as MUPSA infrastructure, selection of initiating events (IEs), accident sequence modeling and quantification, and site-based risk metrics. However, some unresolved issues remain one of which is how to consider numerous combinations of plant operational states (POSs), including full-power (FP) operation for each reactor unit [1]. The recently published IAEA safety report on MUPSA (final draft) [3] includes this issue as one of six areas that require further development and investigation.
A low-power and shutdown (LPSD) single-unit PSA (SUPSA) typically considers ten or more POSs according to the plant conditions, such as the reactor power level and the reactor coolant system (RCS) temperature, pressure, and level. Therefore, as the number of units involved in MUPSA increases, the number of possible combinations of POSs increases exponentially. For example, if there are three units at a site and each unit has 10 POSs, a total of 1000 combinations of POSs need to be considered. Accordingly, it is impractical to develop separate MUPSA models and assess the risk for each POS combination, even in two-unit cases.
1.2. Limitation of Existing Studies
One way to deal with the above issue is to select a manageable number of POS combinations and perform MUPSA for each selected combination. The recently published IAEA-TECDOC-1804 provides a comprehensive set of full-scope Level 1 PSA attributes, some of which are related to MUPSA [4]. As far as POS combinations are concerned, the report also describes the selection of representative combinations and further grouping of POSs as follows.
- Special attribute (OS-A01-S2): “For multi-unit PSAs, a representative set of combinations of POSs for each unit is selected to account for the most likely combinations. The selected combinations include at least one with all reactors in operation at full power and one for each reactor unit in an LPSD POS.”
- Special attribute (OS-B01-S1): “Further grouping of POSs for each reactor unit in a multi-unit PSA may be required to keep the combination of POSs modeled to a manageable level. Such further grouping is done so as not to mask the potential for initiating events that impact multiple reactor units concurrently.”
Therefore, most existing studies on MUPSA have considered only one combination of all units in FP operation or a very limited number of representative combinations of POSs. Table 1 summarizes recent studies in this regard.

Table 1.
Summary of recent studies on MUPSA.
However, to select a representative set of POS combinations, one should consider both the frequency or fraction of time of each selected POS combination and its conditional risk, such as conditional core damage probability (CCDP). This is not an easy task, though, particularly when considering a large number of units. To avoid this difficulty, it is common to select some of the most conservative combinations in terms of a given risk metric, such as core damage frequency (CDF), as representatives. The study conducted by Korea Hydro & Nuclear Power Co., Ltd. (KHNP) in Table 1 is an example (see also Annex IV in [3] for details).
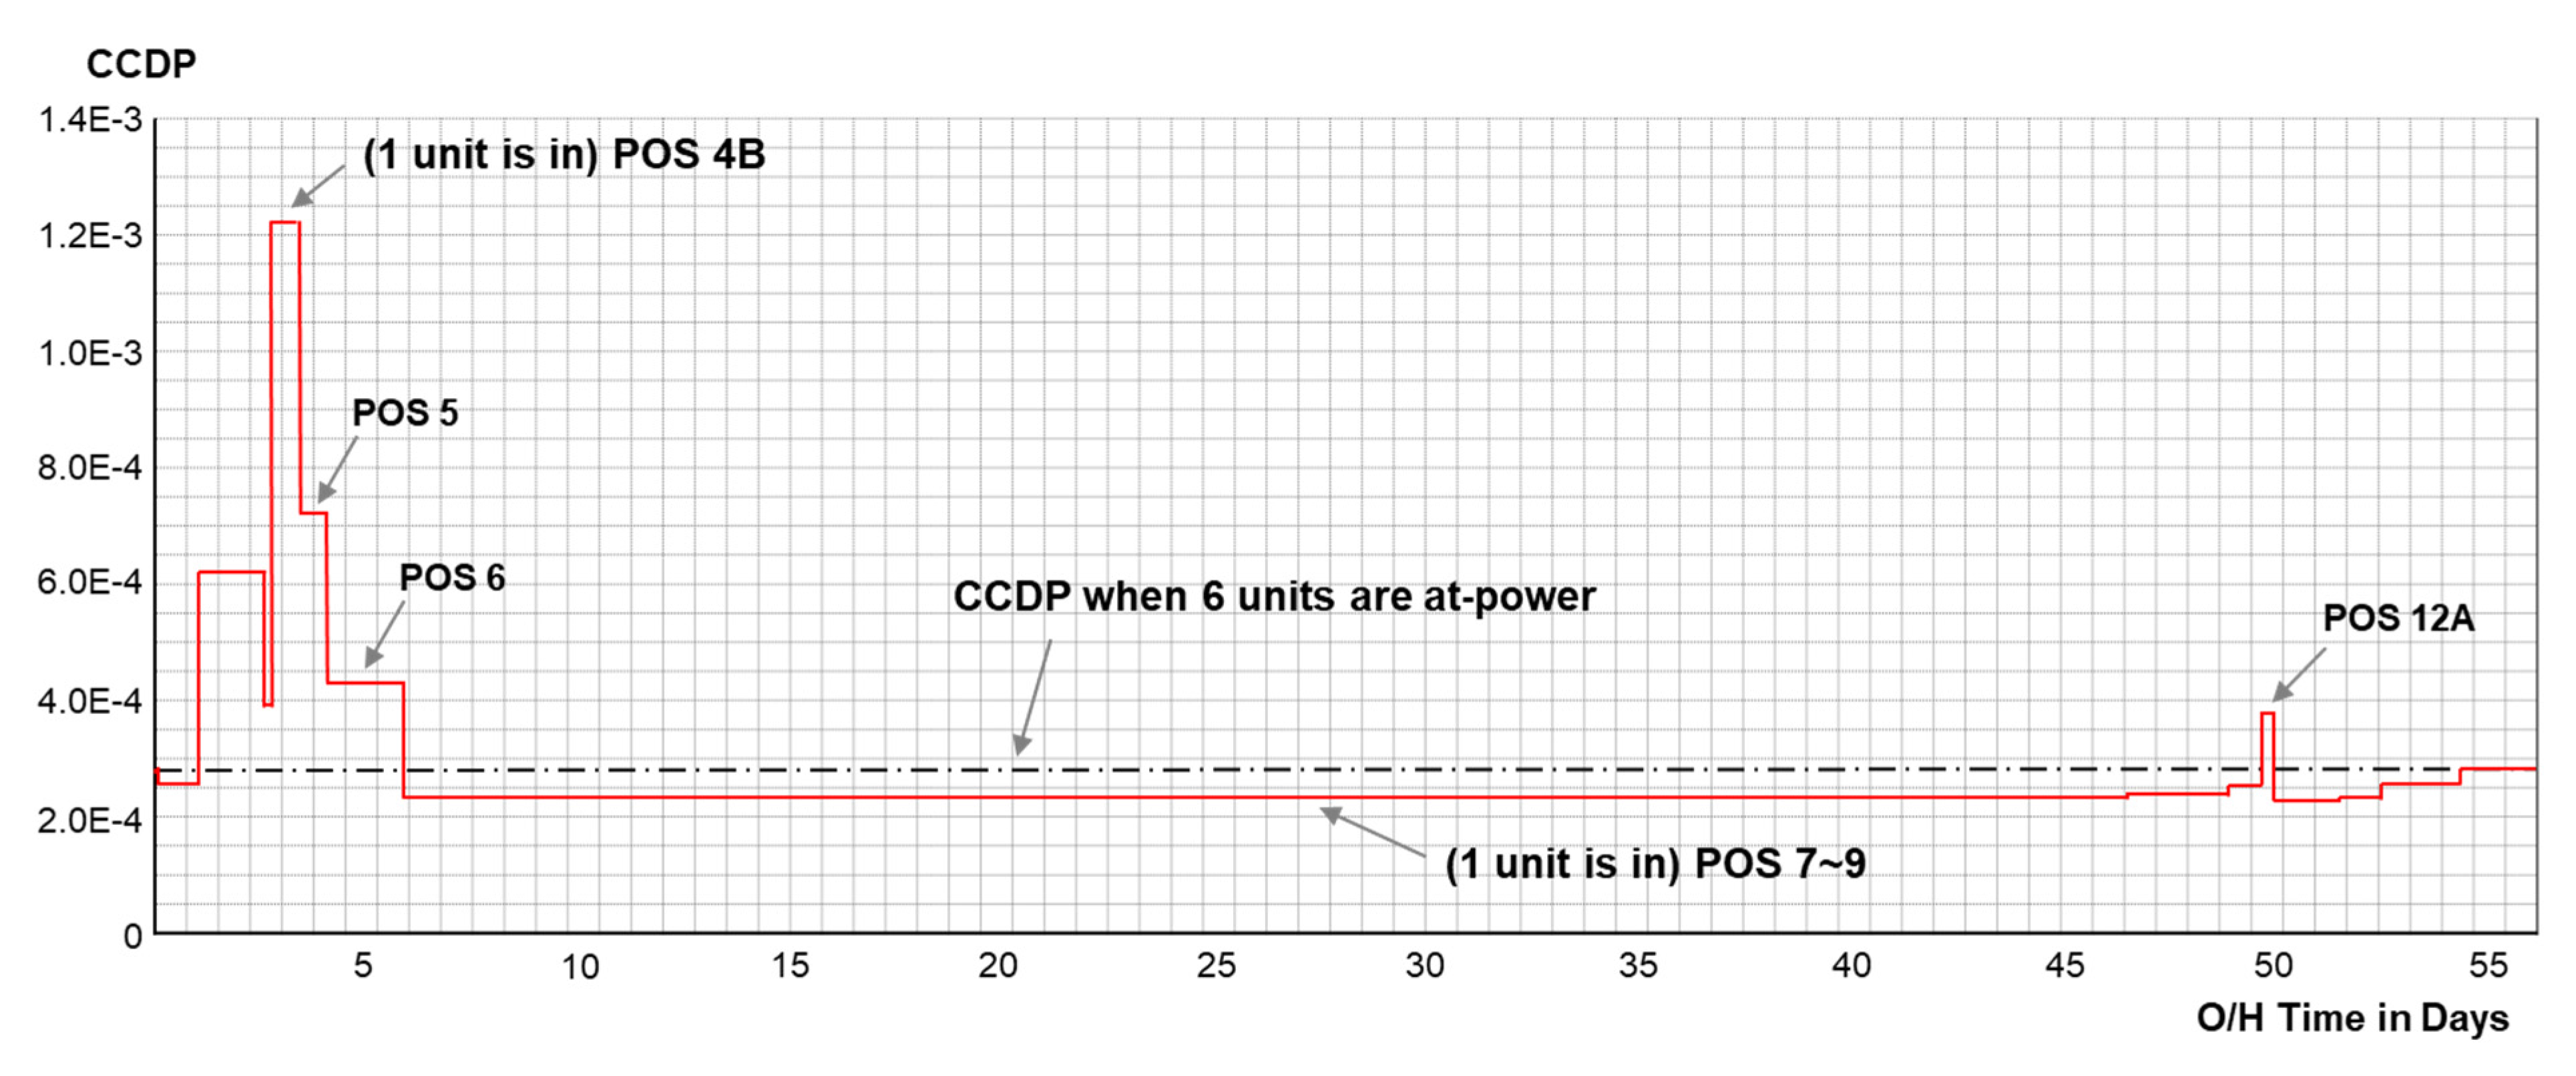
One issue with such an approach is that it can reduce the information that should be obtained from MUPSA, especially related to multi-unit accident sequences, and another is that it can produce overly conservative results because, commonly, the fraction of time spent in POSs with higher risk is relatively short compared to POSs with lower risk. Figure 1 shows the change in site CCDP given the occurrence of a multi-unit loss of offsite power (MU-LOOP) IE in all units over an O/H period of 56 days for a reference site with six identical units where one unit is in shutdown and five units are at power [14]. Since the CCDP in POS 7, 8, 9, and 12B is 0 for the unit in shutdown, the site CCDPs when the unit is in these POSs correspond to those obtained from the five units at-power. When one unit is in a certain POS, such as POS 4B, the site CCDP is up to four times higher than when all six units are at power. However, the time fractions of POSs with a higher CCDP are low, while those of POSs with a lower CCDP are high. This case illustrates how assuming only the POSs with a higher CCDP for the entire O/H period can lead to conservative results.
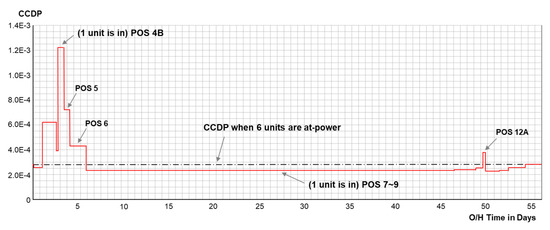
Figure 1.
Example of POS-dependent site CCDP profile (one unit in shutdown, five units at power).
Since existing studies have focused on selecting a number of representative combinations, in many cases using the term “site operating state (SOS)”, they have limitations in reducing this conservatism. It is difficult to find published research that has attempted to model as many combinations as possible to solve this problem. Therefore, there is a strong need to develop a pragmatic approach that can reduce the conservatism caused by selecting a small number of POS combinations.
1.3. Objective and Scope of This Study
To address the above issues, this paper provides a pragmatic approach in which all possible combinations of POSs are modeled without selecting a limited number of representative combinations. Instead, according to quantification results, the non-risk-significant accident sequences for each unit are screened out by applying three levels of screening criteria in a stepwise fashion. This is the main feature that distinguishes the proposed approach from existing ones. The effectiveness and applicability of the approach are demonstrated by application to four MUPSA cases with different numbers of reactor units at a site, from 2 to 10. To the best of our knowledge, this is the first study to model and quantify all possible POS combinations for MUPSA involving up to 10 reactor units.
The remainder of this article is organized as follows. Section 2 explains the proposed approach to modeling POS combinations in MUPSA, covering the overall procedure and detailed methods for each step. Section 3 presents the process and results of a case study in which the proposed approach is applied to four MUPSA cases with different numbers of reactor units. Section 4 concludes the paper and discusses future work.
2. Proposed Approach to Modeling POS Combinations in MUPSA
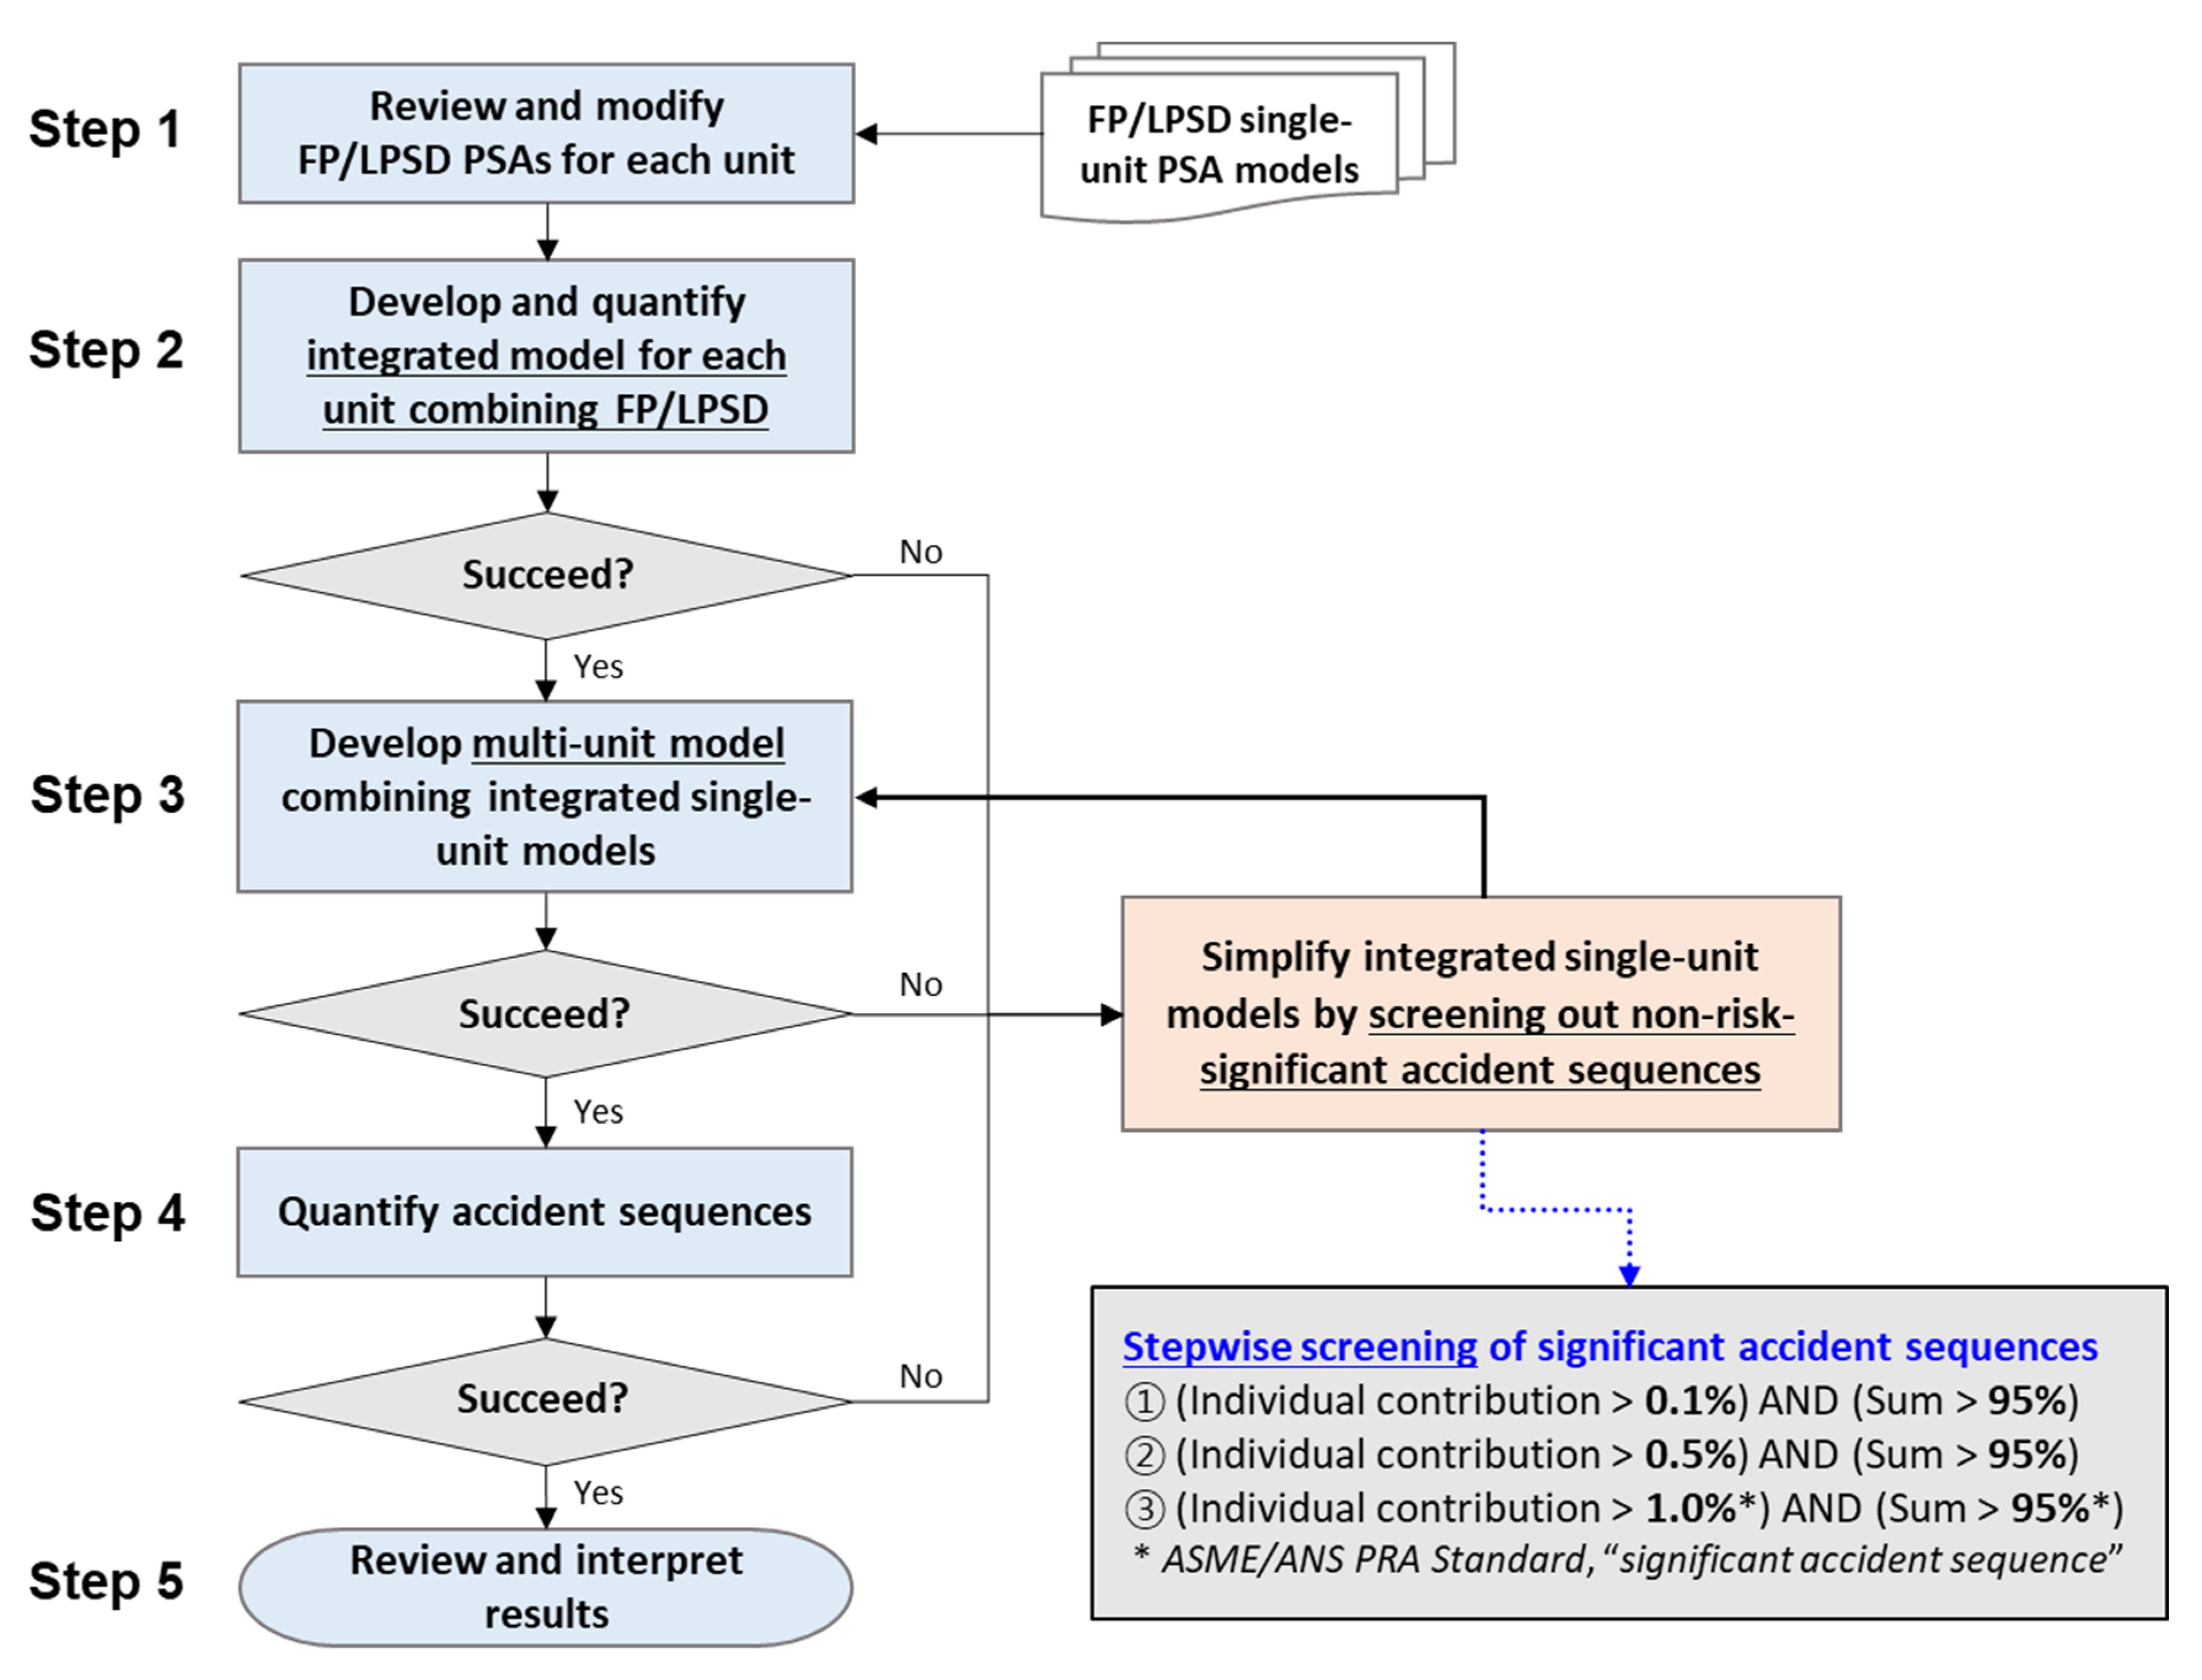
In this section, a new approach to modeling combinations of POSs in MUPSA is proposed. Figure 2 shows the procedure of the proposed approach, which consists of five main steps and one additional screening step. This procedure assumes that FP and LPSD SUPSA models are available for each unit and that the scope of the MUPSA, including hazards and IEs to be analyzed, and the risk metrics (e.g., site CDF, multi-unit CDF) have been determined. The approach generally focuses on Level 1 MUPSA but can be extended to Level 2 MUPSA. The following subsections describe each of the steps in detail.

Figure 2.
Procedure of MUPSA considering POS combinations.
2.1. Step 1: Review and Modification of PSA Models for Each Unit
In the first step, each unit’s FP and LPSD SUPSA models are reviewed from the MUPSA perspective and revised as necessary. The main tasks usually performed here are as follows.
- Considering the scope of the MUPSA and the risk metrics, the FP and LPSD SUPSA models for each unit are reviewed to check whether they contain all the information necessary to develop a MUPSA model, and if necessary, the SUPSA models are revised.
- The SUPSA models for different units are thoroughly reviewed to check for lack of consistency in terms of key factors, such as hazards or IE grouping, event tree/fault tree models, data used, and major assumptions. If it is judged that the effects that the lack of consistency between the units may have on the MUPSA results are not negligible, the SUPSA models are revised to ensure inter-unit consistency.
- For both FP and LPSD models for each unit, event tree and fault tree logics unrelated to the IE being analyzed (e.g., multi-unit loss of offsite power) are removed or set to FALSE, leaving only the logics related to the IE. This can reduce the size of the models for each unit.
- “Unit identifiers” (e.g., “U1-XXX”) are added to the names of all gates and basic events in order to distinguish between units. An identifier involving the corresponding units (e.g., “U12-XXX”) is attached for those related to a system or component shared between two or more units. For those treated as completely dependent between units (e.g., multi-unit IE), the same gate or basic event is applied equally to all corresponding unit models with no unit identifiers.
2.2. Step 2: Development and Quantification of an Integrated Model for Each Unit
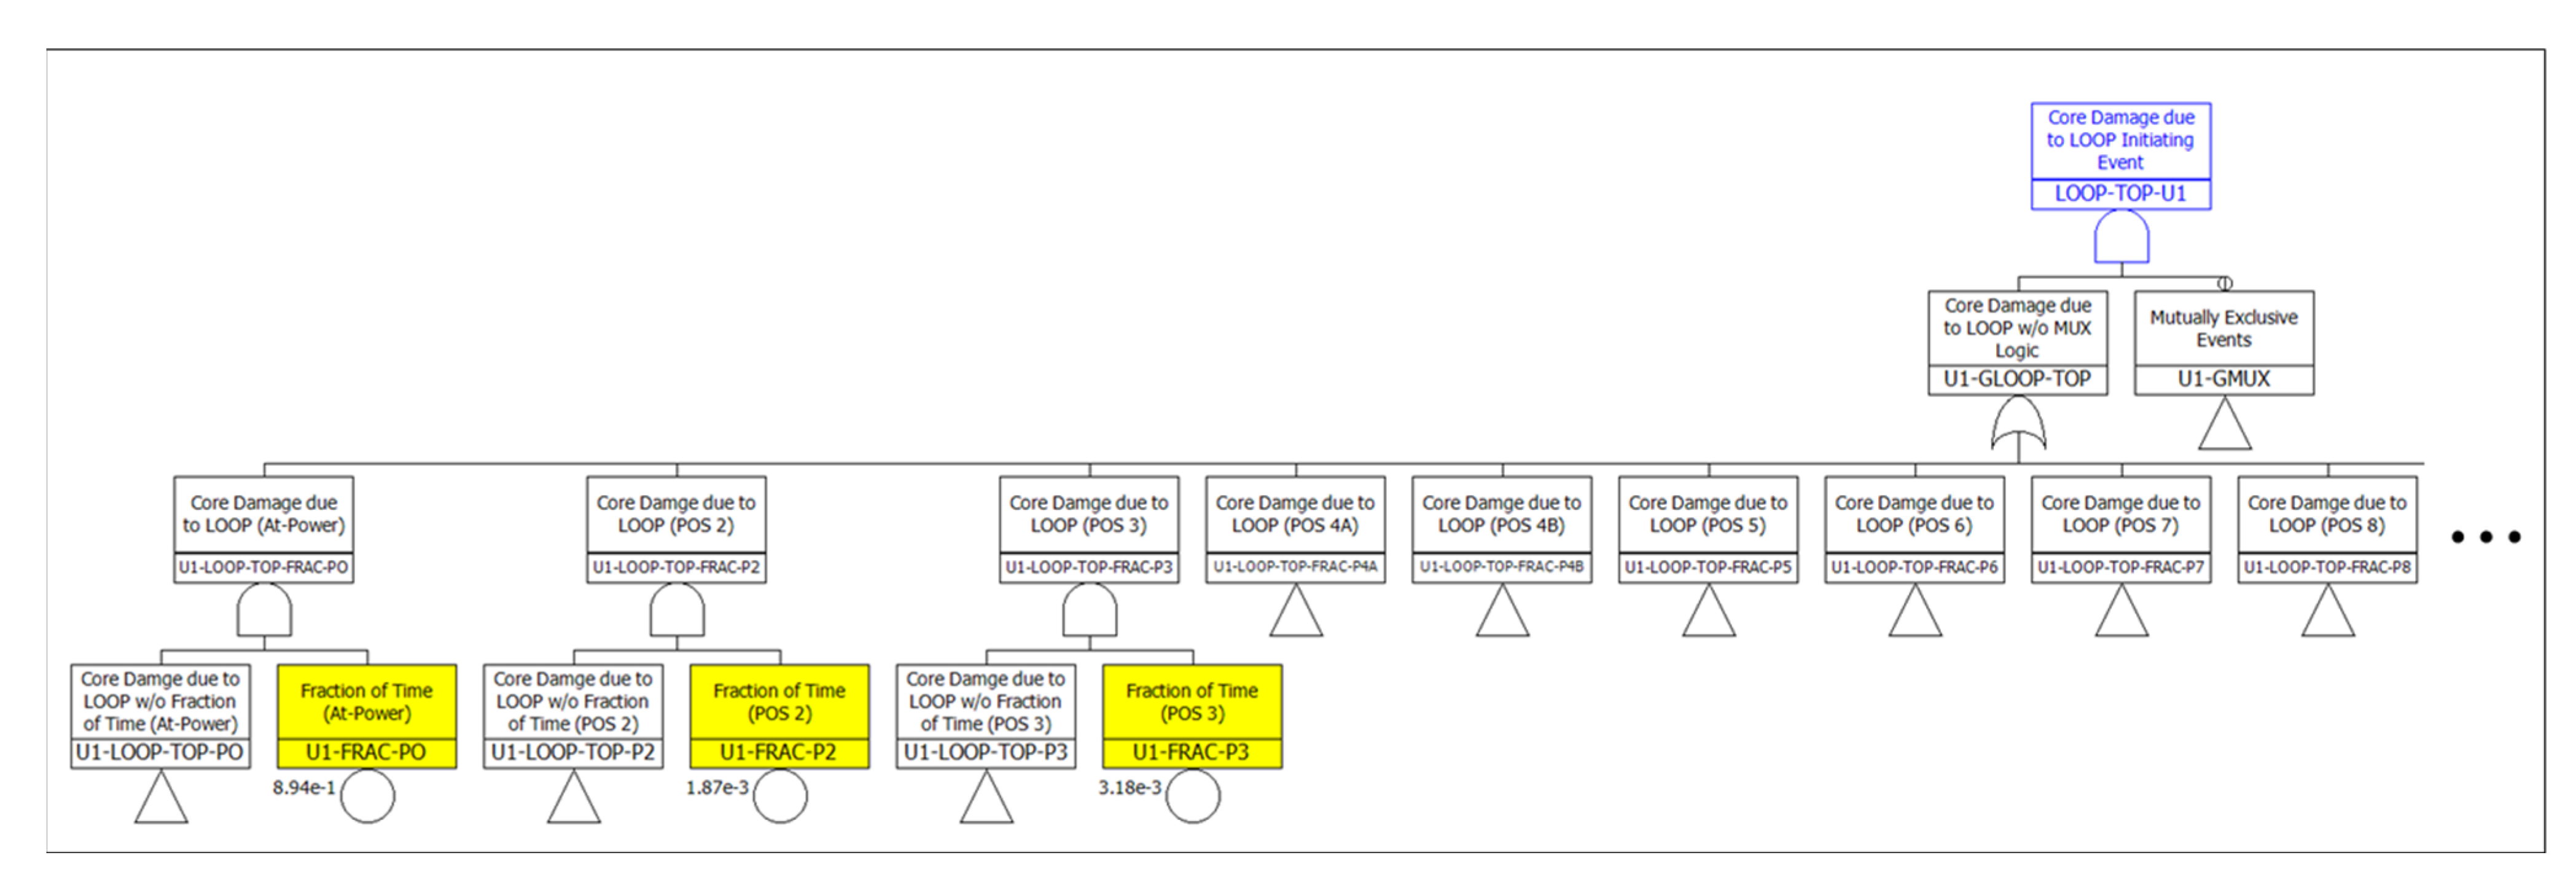
In the second step, an integrated model for each unit is developed by combining its FP and LPSD PSA models into a single-top fault tree. The top event, in this case, is defined by a given risk metric and the IE to be analyzed. Figure 3 shows an example of an integrated single-unit model where the top event corresponds to core damage in Unit 1 due to a LOOP IE. Here, the following tasks should be performed to combine the FP and LPSD models into one and quantify it effectively.
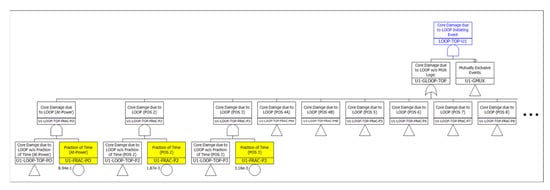
Figure 3.
Example integrated single-unit model combining FP and LPSD PSA models.
- Depending on the POS, gates with the same name may have different logic, and basic events with the same name may have different probabilities. Therefore, in order to distinguish such gates and basic events between POSs, “POS identifiers” are added to the names of all gates and basic events (e.g., “XXX-P2”).
- “POS basic events” that represent the fraction of time spent in each POS are added (e.g., U1-FRAC-PO, U1-FRAC-P2, and U1-FRAC-P3 colored in yellow in Figure 3) and combined with the logic for the corresponding POS under AND gates. The fraction of time for each event can usually be calculated from the FP and LPSD SUPSA results, and the sum of these fractions should be 1.
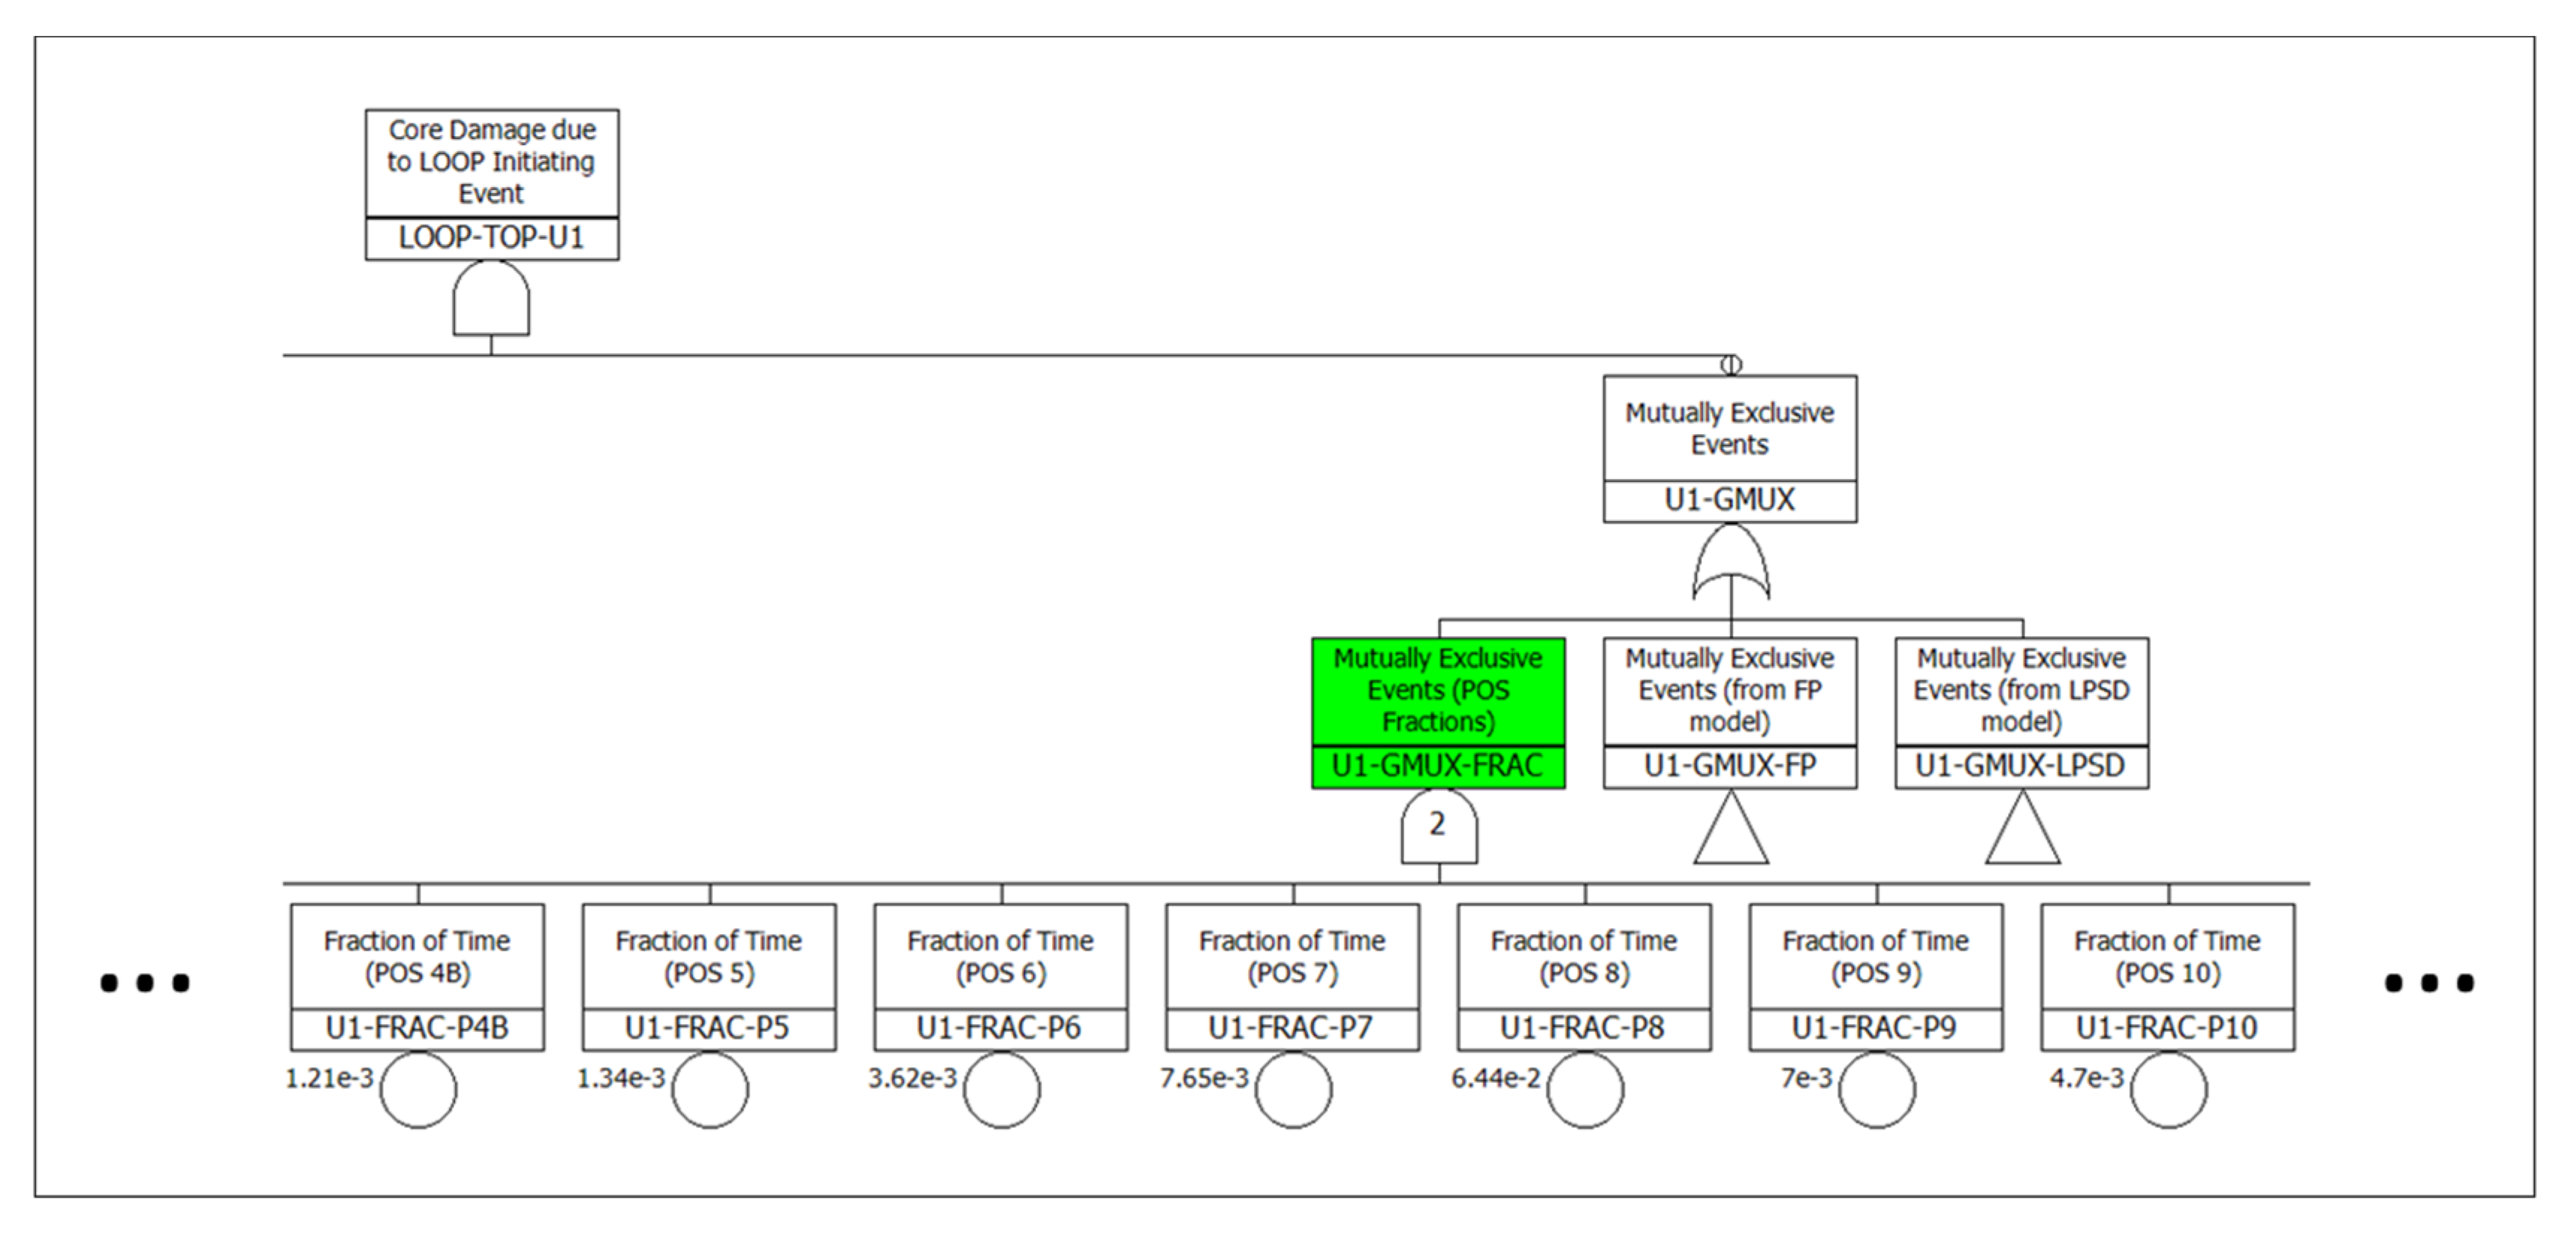
- Since each unit can only be in one POS at a time, the POS basic events are modeled as mutually exclusive events, as shown in Figure 4. This modeling may not be necessary depending on the logic of the MUPSA model.
 Figure 4. Example of modeling basic events representing the fraction of time for each POS as mutually exclusive events.
After the integrated single-unit model combining FP and LPSD models is developed, the accident sequence frequencies are quantified to confirm that quantification can be performed within an appropriate time. If the quantification succeeds, it is necessary to review whether the results are consistent with those of the original FP and LPSD SUPSA.
If the integrated single-unit model is very large or has very complex logic, such as logical loops, the quantification may fail to produce results within a reasonable time (e.g., an hour). In such cases, the integrated model should be simplified by screening out non-risk-significant accident sequences. The screening step highlighted in orange in Figure 2 is performed. This step can be entered from Steps 2, 3, or 4 and takes a stepwise approach that applies three levels of screening criteria according to the quantification results as follows.
- (1)
- Individual accident sequences with a contribution greater than 0.1% to the given risk metric are selected as long as the sum of the contributions from the selected sequences is greater than 95%. (If the quantification fails again after applying this criterion, the second-level criterion is applied.)
- (2)
- Individual accident sequences with a contribution greater than 0.5% to the given risk metric are selected as long as the sum of the contributions from the selected sequences is greater than 95%. (If the quantification fails again after applying this criterion, the third-level criterion is applied.)
- (3)
- Individual accident sequences with a contribution greater than 1% to the given risk metric are selected as long as the sum of the contributions from the selected sequences is greater than 95%.
These criteria were classified by considering both the contribution of individual accident sequences to a given risk metric and the sum of the contributions of the selected accident sequences. In the third-level criterion, 1% for the contribution of individual accident sequences and 95% for the summed contribution are taken from the definition of “significant accident sequence” used in the ASME/ANS PRA standard [15].
Screening out an accident sequence can be done by either (1) removing the corresponding gate logic from the integrated fault tree model or (2) setting the gate logic to FALSE. Both ways produce the same results, but the time taken for quantification may differ.
2.3. Step 3: Development of a Multi-Unit Model Combining Integrated Single-Unit Models
In the third step, the integrated single-unit models are combined into a MUPSA model, which is also in the form of a single-top fault tree.
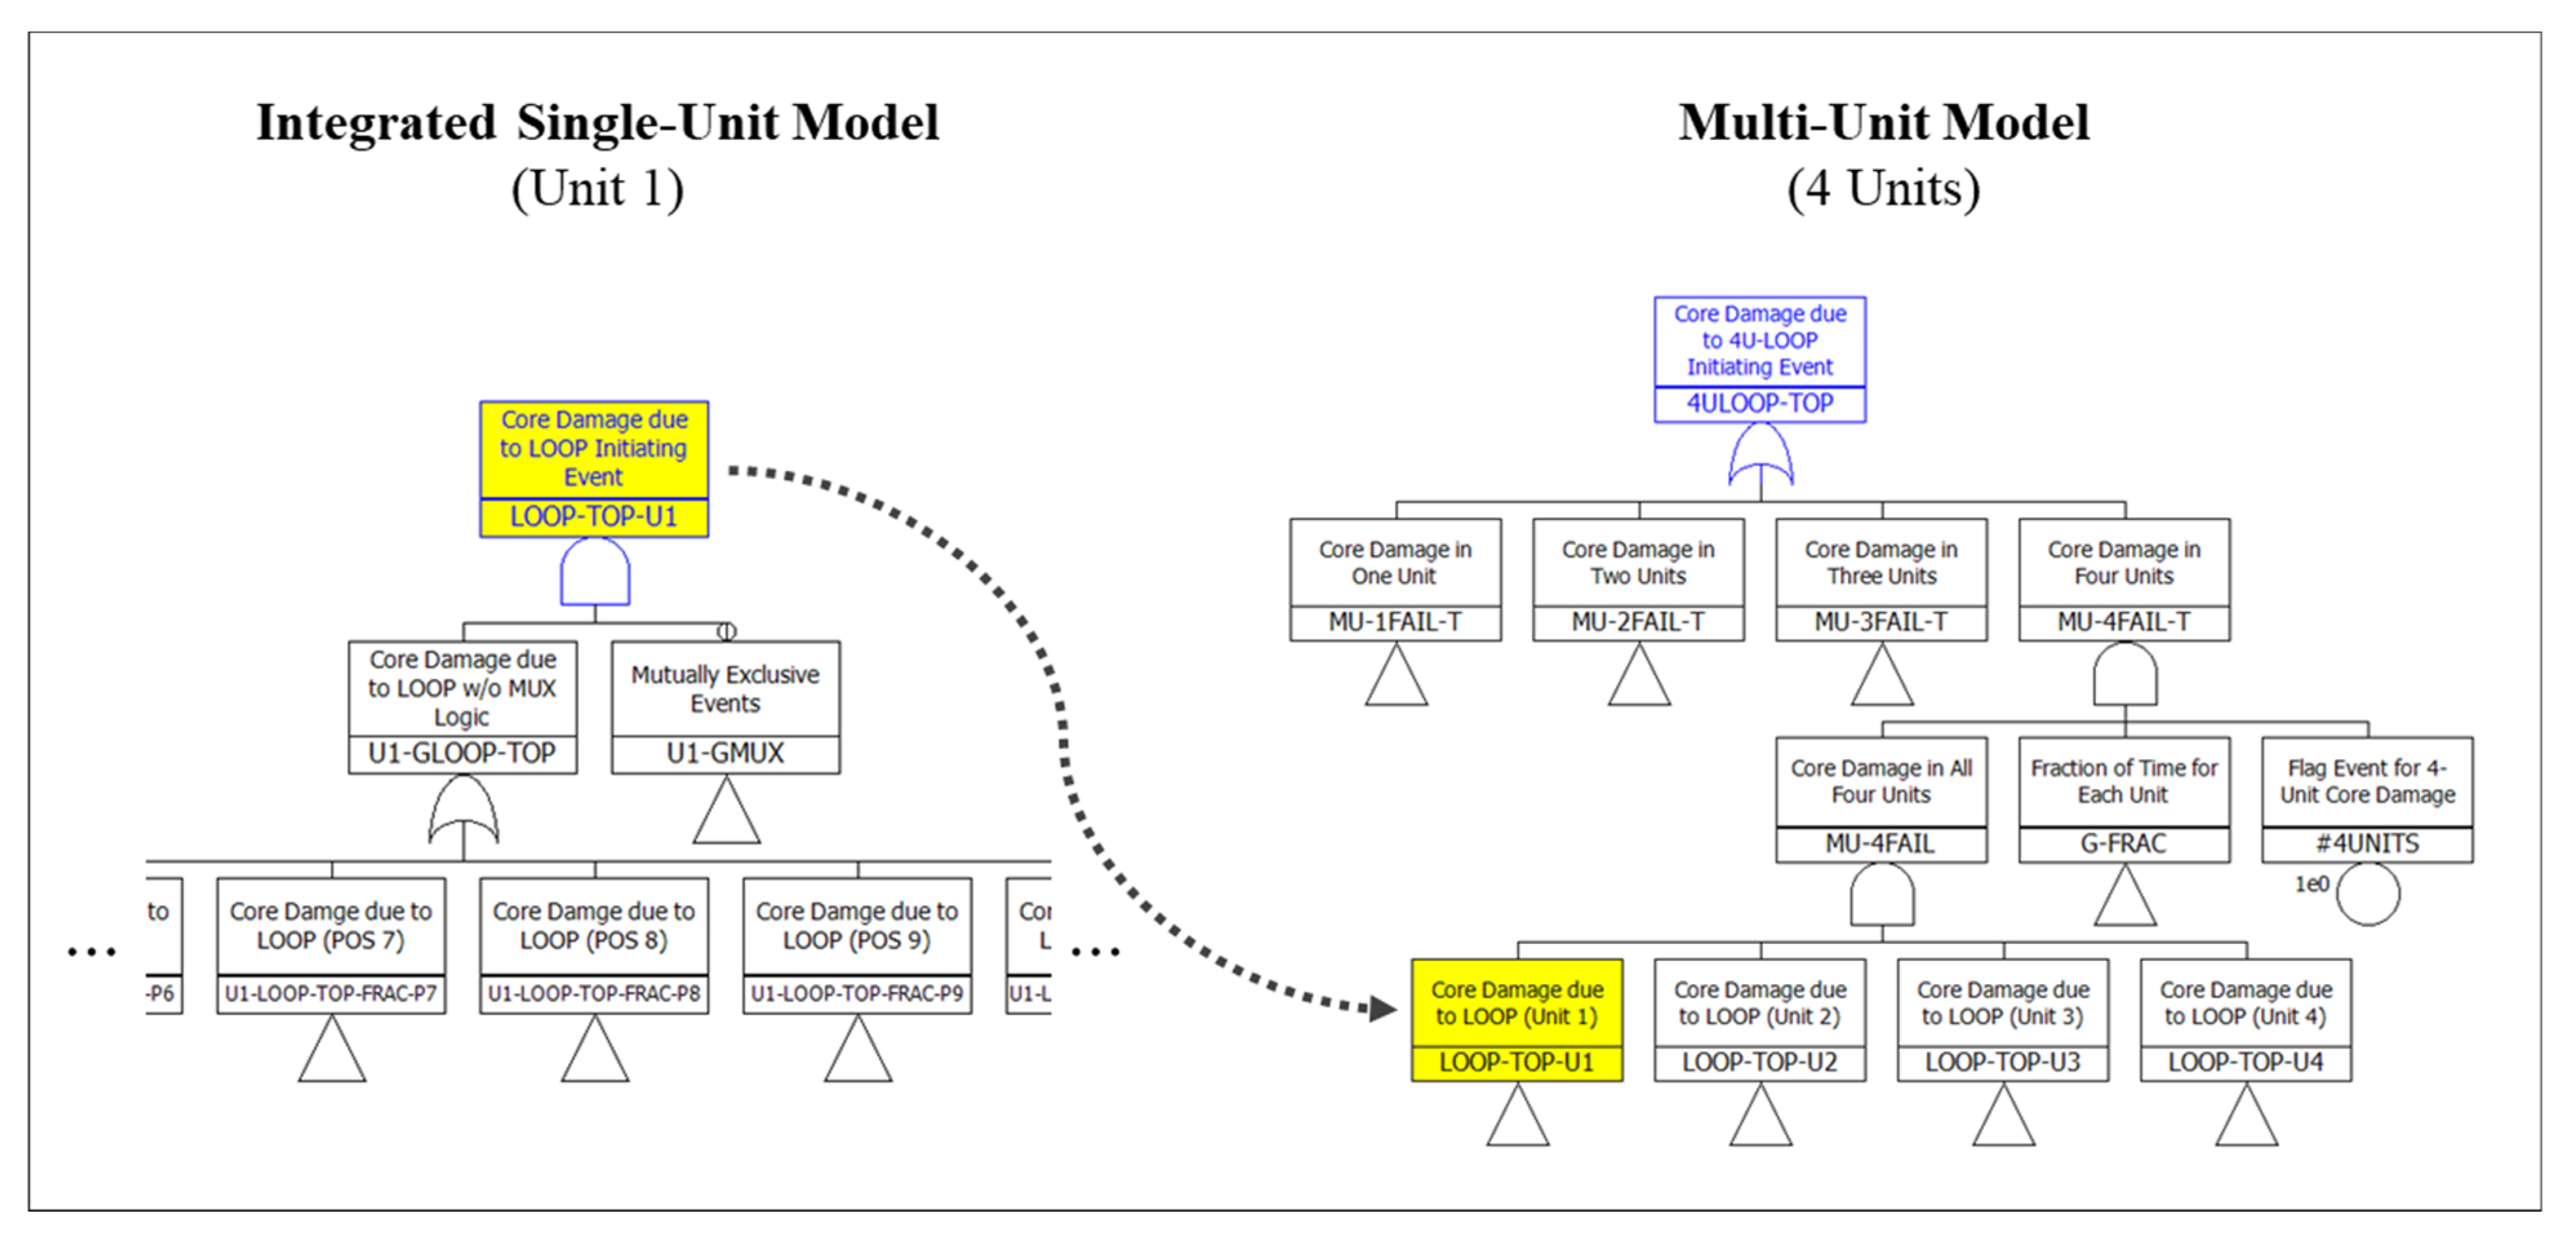
Figure 5 shows an example of a four-unit case. The right side of Figure 5 is a single-top fault tree logic for the MUPSA model, where the top event, 4ULOOP-TOP, represents core damage in at least one of the four units, and the number of failed units distinguishes the fault trees under it. For each number of failed units, a tag event with a probability of 1 (e.g., #4UNITS) is employed to prevent cut sets involving more units from being subsumed by cut sets involving fewer units. This kind of modeling approach enables the calculation of a given risk metric for each number of failed units (e.g., 1-, 2-, 3-, 4-unit CDF) as well as for the top event (e.g., site CDF) with a single quantification [5,16].
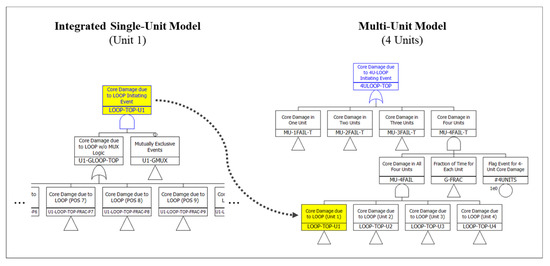
Figure 5.
Example multi-unit model combining integrated single-unit models (4-unit case).
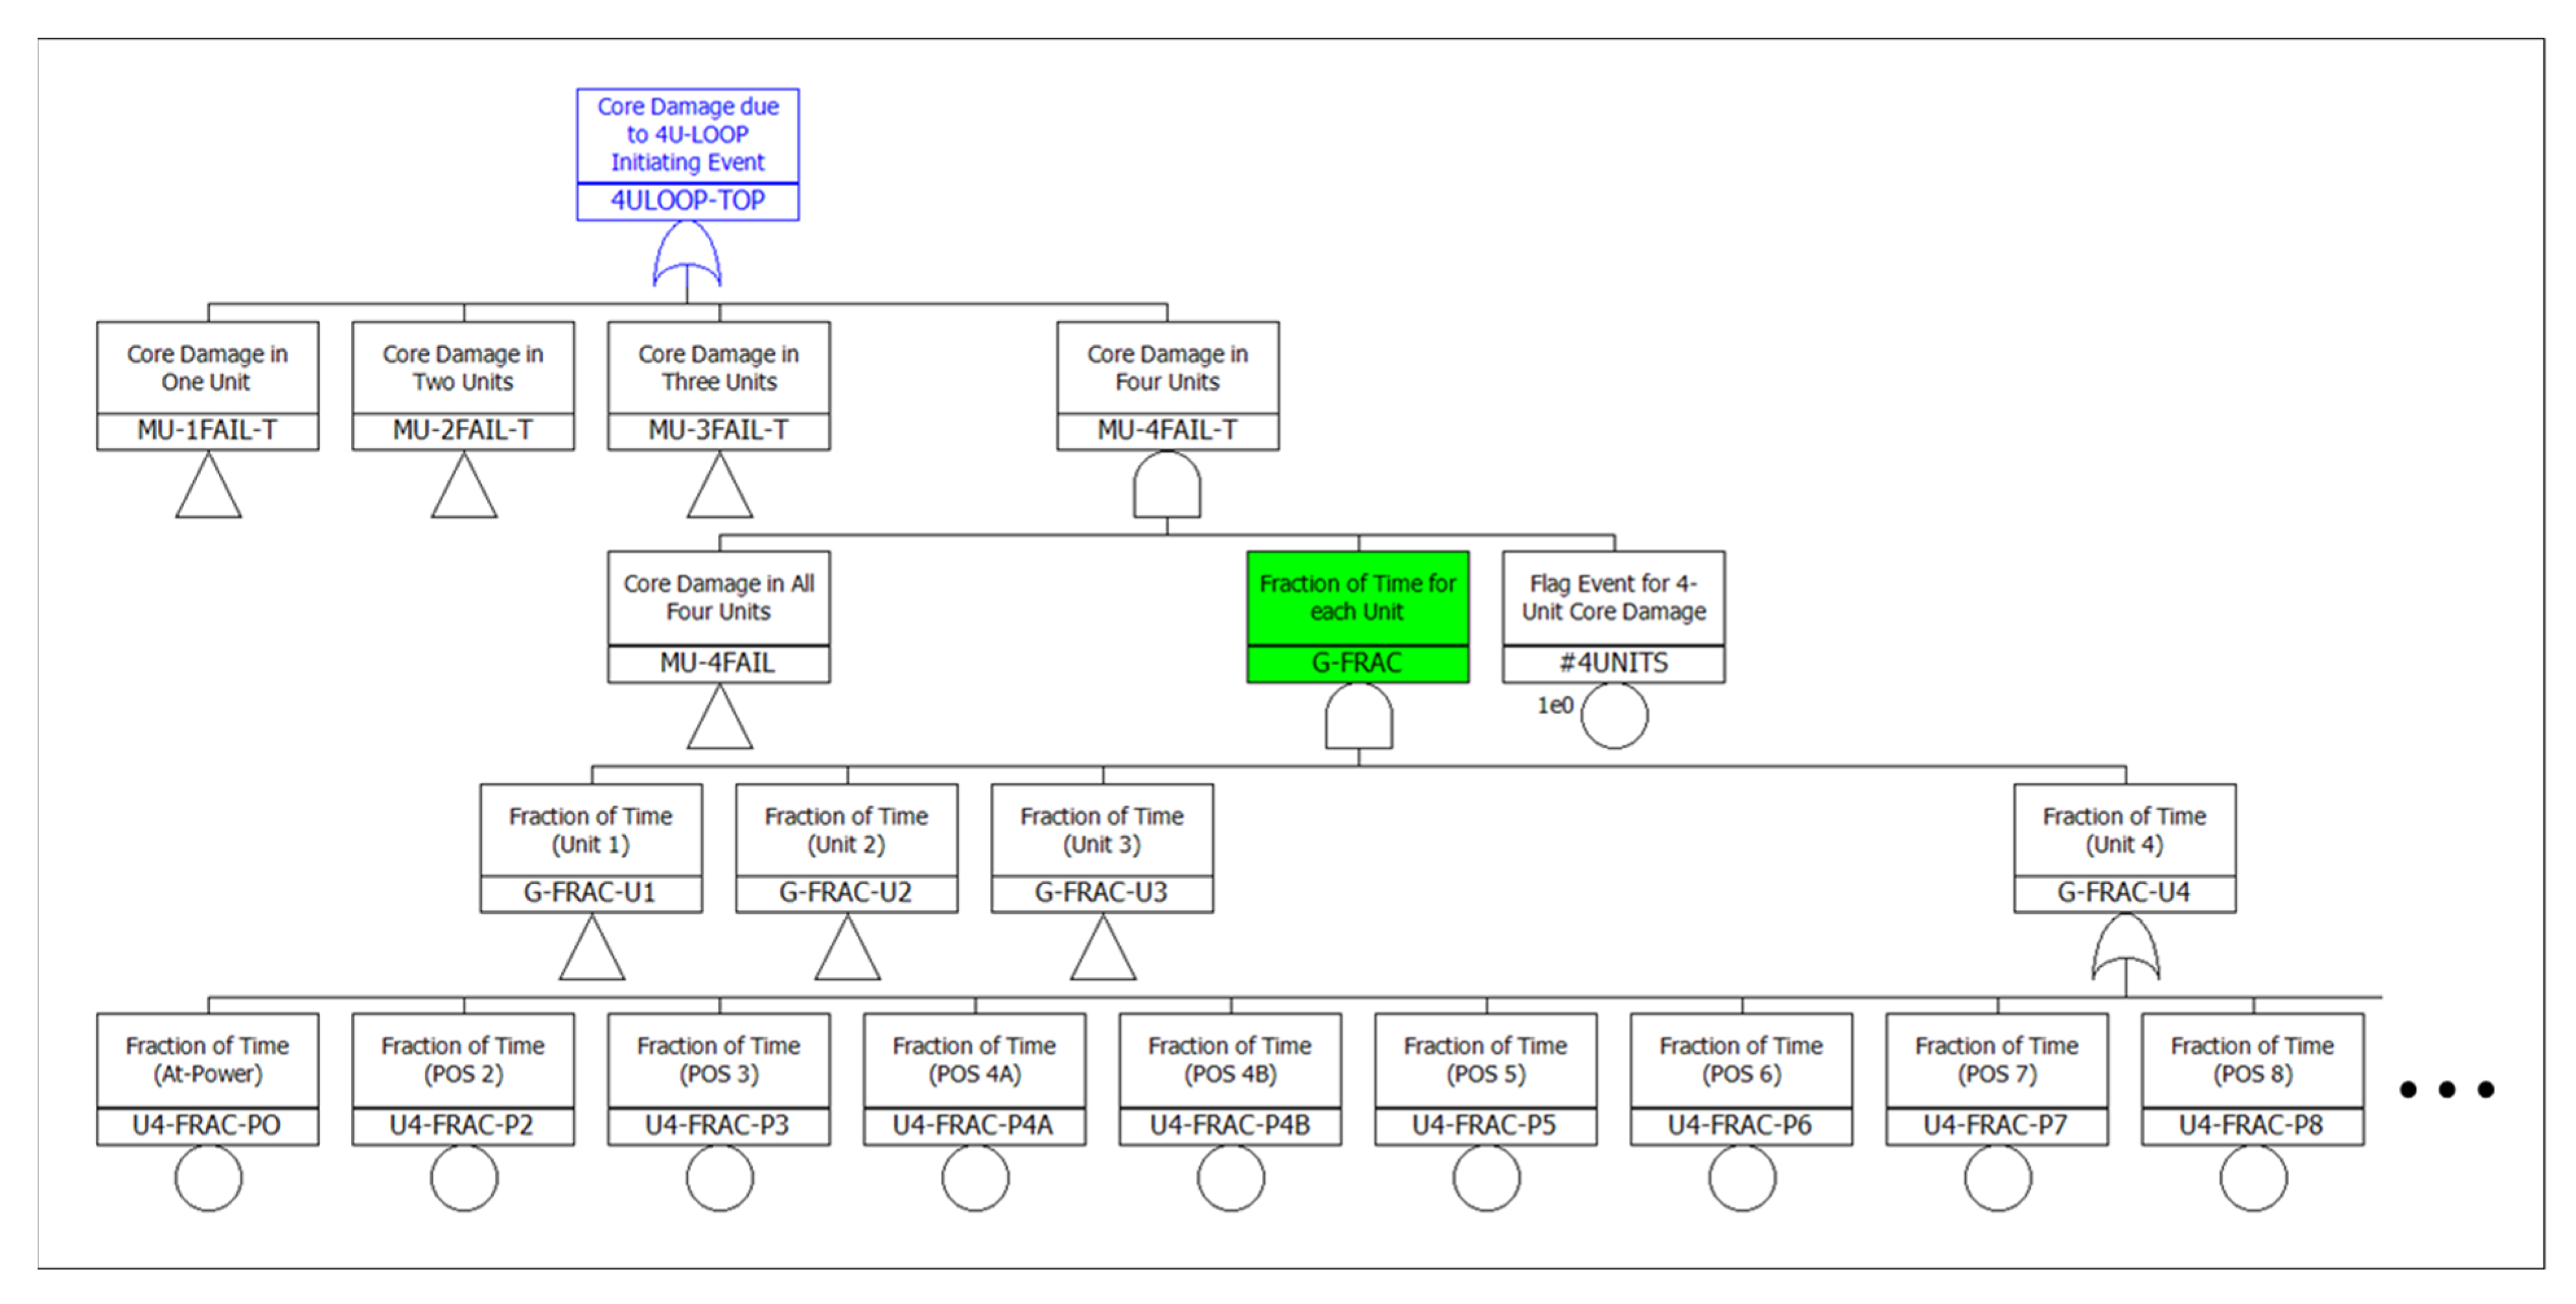
One of the essential tasks in this step is to add a fault tree logic for the POS basic events so that one of these events must occur for each unit, as shown in Figure 6. This gate logic is necessary because each unit should be in a particular POS at a certain time. Without this logic, the quantification of the model can generate nonsense cut sets, such as a cut set where core damage occurred only in one unit for which a POS basic event occurred and not in another unit for which a POS basic event did not occur, even though core damage would likely occur in both units. This is because, as in the example in Figure 3, the fault tree logic for each POS is modeled under an AND gate with the corresponding POS basic event with a probability of less than 1.
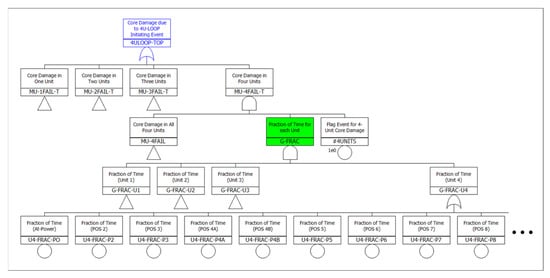
Figure 6.
Example logic gate to generate a POS basic event for each unit.
Another important task here is to reflect inter-unit dependencies in the MUPSA model. Shared components, inter-unit common cause failures (CCFs), inter-unit seismic correlation, and dependencies between human failure events (HFEs) in different units are representatives to be considered. Detailed approaches for this task can be found in many recently published documents (see for example [3,5]).
From the POS perspective, different types of inter-unit dependencies may need to be considered depending on the operational strategies used at the plant or site being analyzed. As an example of such strategies, refueling outages for twin units at the same time would not be planned, or even when two or more units are in refueling outages, it may be planned that no more than one unit can be in a specific POS containing a high-risk operation such as a mid-loop operation at the same time.
If the integrated single-unit models developed in Step 2 are very complex or the number of units is large, the generation of a MUPSA model in the form of a single-top fault tree by combining the single-unit models may fail before moving on to Step 4 for the quantification of the MUPSA model. In this case, as in Step 2, the screening step is performed, after which Step 3 recommences.
2.4. Step 4: Quantification of Accident Sequences for the Multi-Unit Model
In the fourth step, accident sequence frequencies are quantified for the MUPSA model developed in Step 3. As is usually done in SUPSA, the quantification here is also performed iteratively until the results converge to some degree by decreasing the cutoff value by an order of magnitude. Detailed methods for quantifying a MUPSA model can be found in existing papers [5,16].
Using the modeling approach described in Section 2.2 and Section 2.3, the results for all possible “unit combinations” and “POS combinations” can be obtained through a single quantification. In addition, non-risk-significant POS combinations are automatically truncated by the given cutoff value. In other words, it is expected that the minimal cut sets (MCSs) involving the most unlikely combinations, such as four or more units being in shutdown POSs except for at-power, are mostly eliminated by the cutoff value, while the MCSs involving the most likely combinations such as all units being at-power account for the majority.
When each integrated single-unit model is very complex, or the number of units is large, even if a MUPSA model is successfully generated by combining the single-unit models in Step 3, it may become too complicated to be quantified using available software, such as FTREX [17]. If the quantification fails to produce results within a reasonable time for this reason, as in Steps 2 and 3, the screening step is performed, and then Steps 3 and 4 are repeated.
2.5. Step 5: Review and Interpretation of Results
In the final step, the quantification results from Step 4 are reviewed and interpreted, and the conclusions of the MUPSA are drawn. This process can be performed in a similar manner as in SUPSA; a general method for reviewing and interpreting MUPSA results can be found in [3].
Regarding the approach proposed in this paper, the review should also include whether the risk for each POS combination is appropriately assessed. For example, it should be confirmed that the risk for the most likely combinations is not underestimated and that the risk for the most unlikely combinations is not overestimated. In addition, if the screening step is applied, it is essential to check whether the accident sequences for each unit screened out in terms of a given single-unit risk metric are risk-significant in terms of a multi-unit risk metric, such as multi-unit CDF.
3. Case Study
To demonstrate the applicability and effectiveness of the proposed approach described in Section 2, the whole procedure was applied to MUPSA cases with different numbers of units at a site.
3.1. Data Collection and Estimation of the Fraction of Time for Each POS
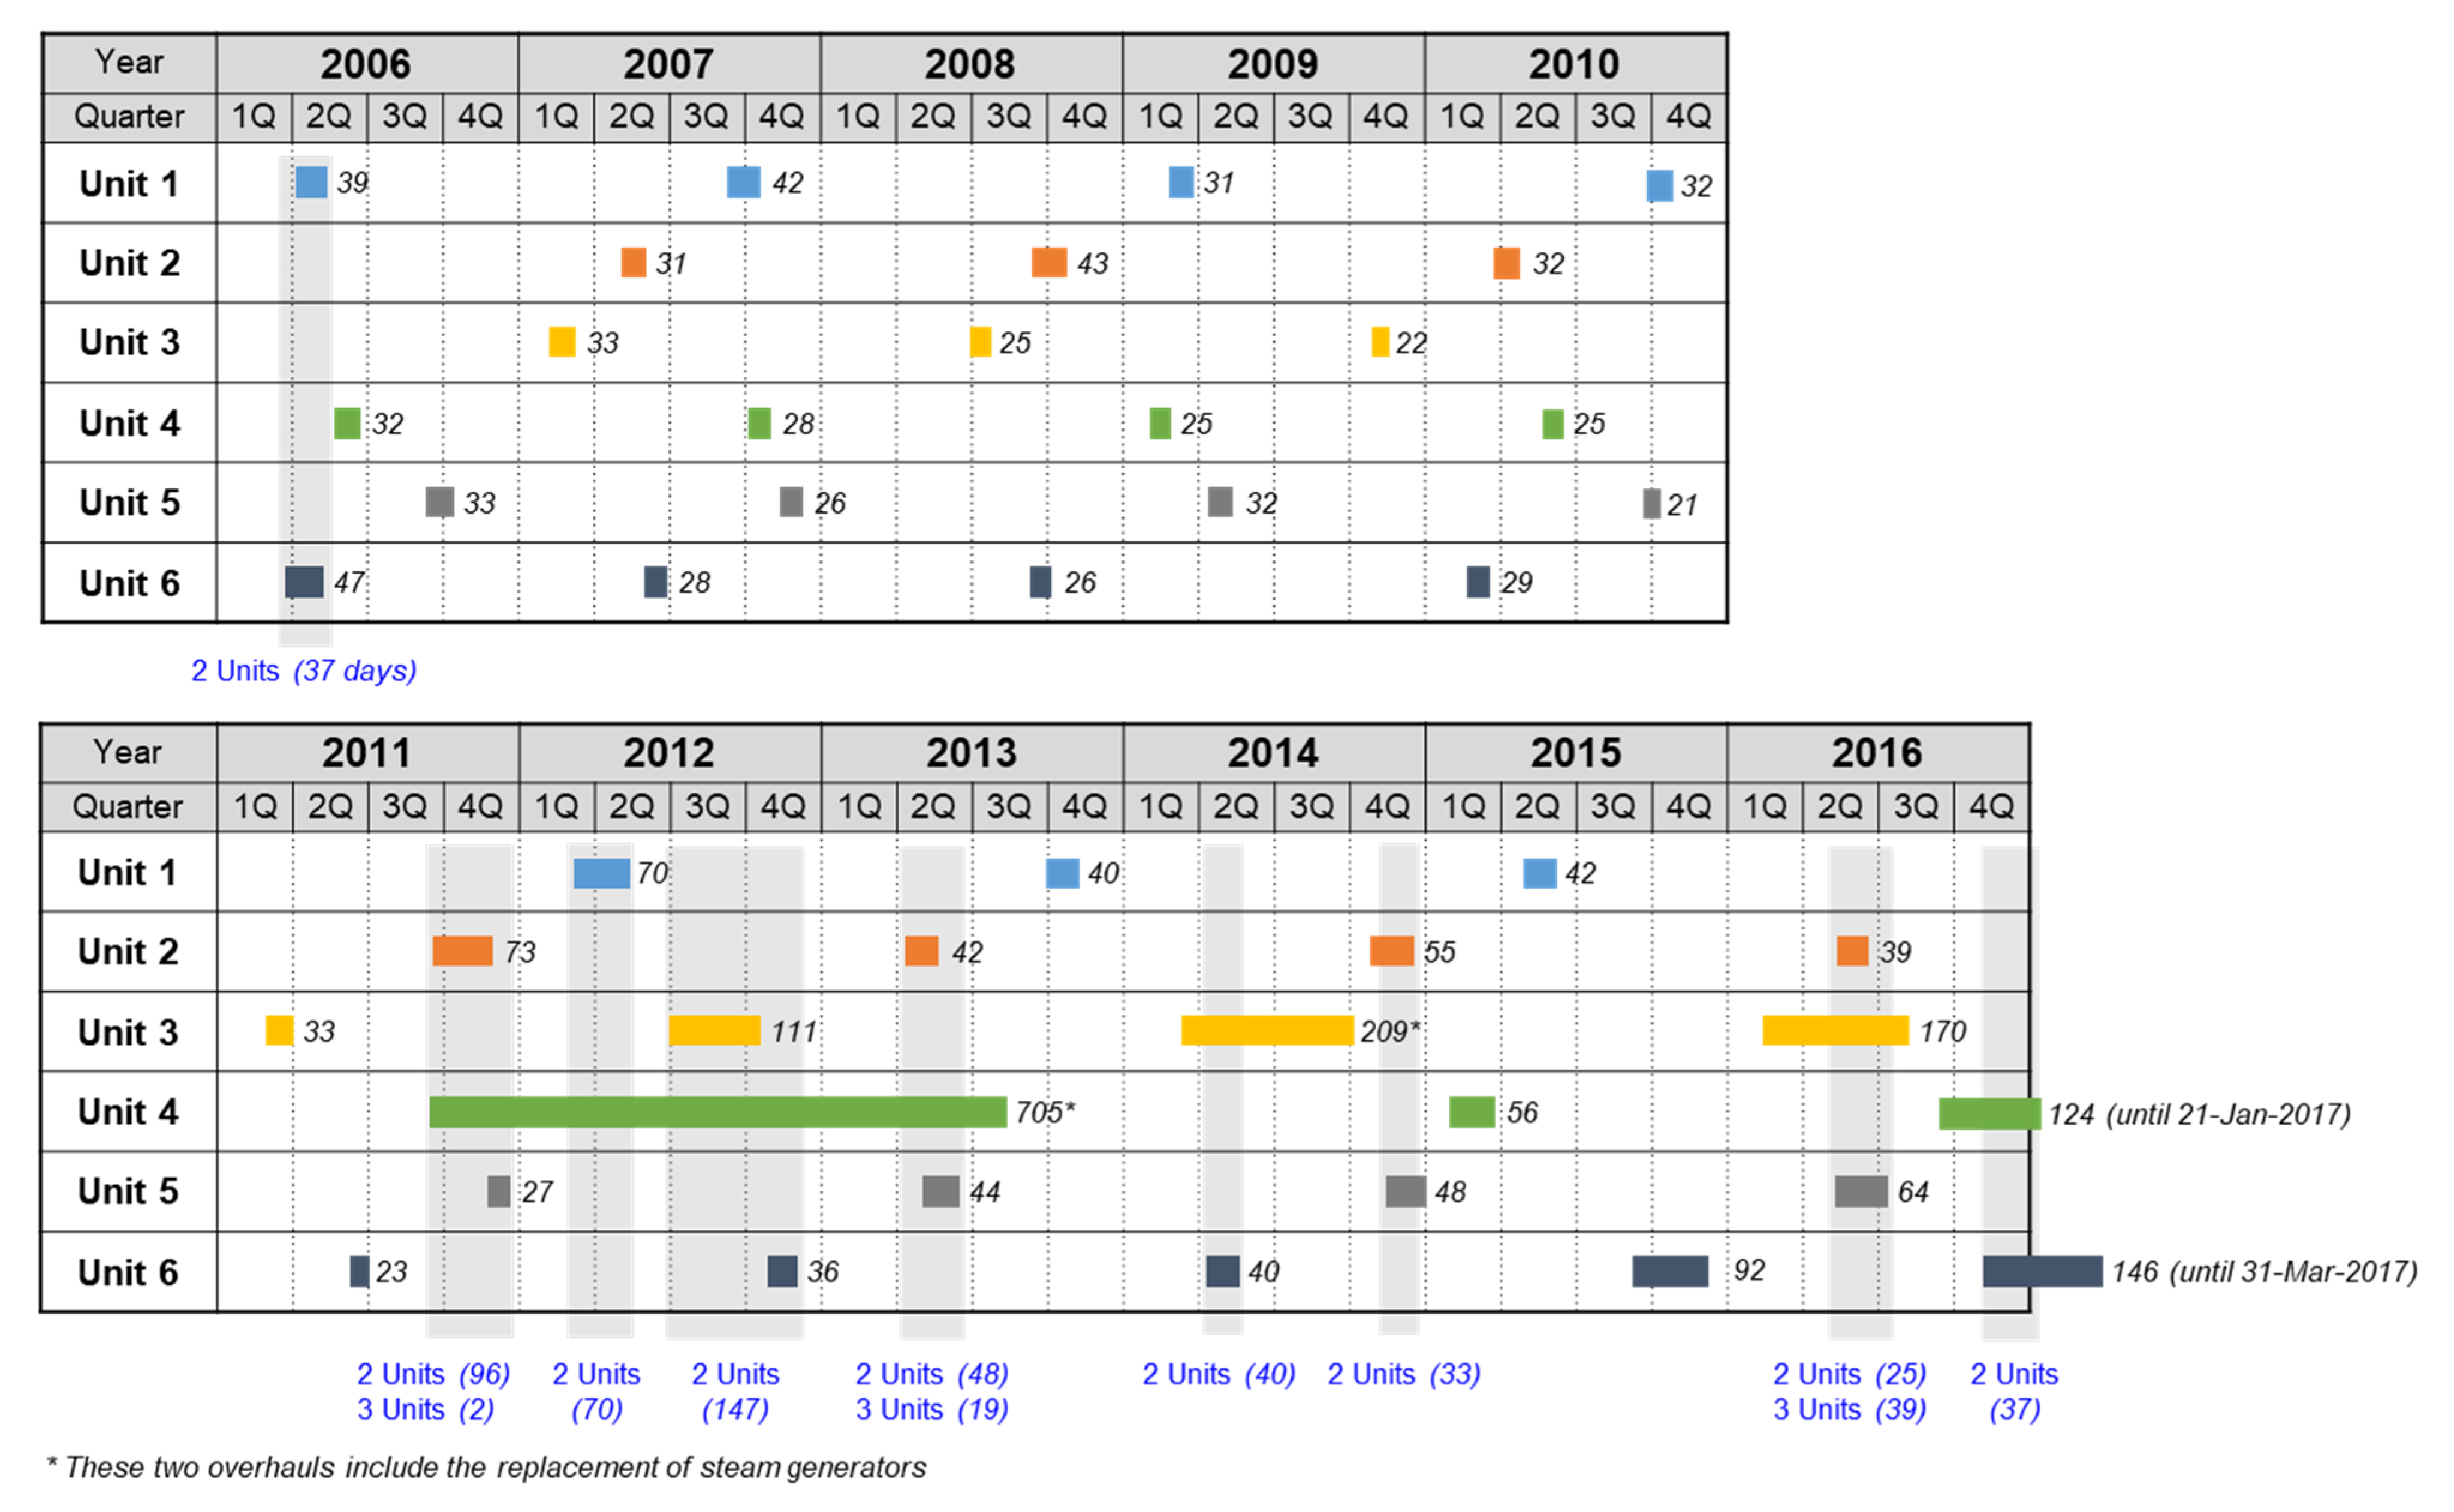
To estimate the fraction of time spent in each POS for each unit in the case study, the Hanul NPP site with six reactor units in the Republic of Korea was selected as the reference site, and its refueling outage (O/H) experience, in other words, the start and end dates of each O/H, during the period 2006–2016 was collected from the KHNP website. Unscheduled plant outages were excluded because refueling outages account for the majority of outages in Korean NPPs [13]. There were 45 refueling outages with an average duration of 66 days. Figure 7 shows the periods during which the individual units were in O/H from 2006 to 2016. The gray shaded areas represent periods where two or more units were in O/H at the same time.
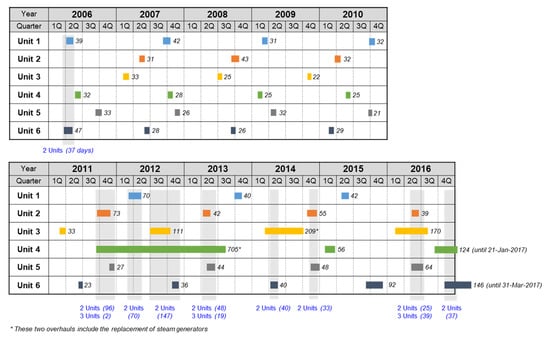
Figure 7.
Refueling outage experience of Hanul Units 1–6 during 2006–2016.
Table 2 shows the fraction of time for different numbers of units being in O/H. It can be seen that up to three units were in O/H at the same time. However, the fraction of time for three units being in O/H was only 1.5%, while the case where all six units were in full-power operation accounted for about 50% of the total period.
Table 2.
Fraction of time for each number of units in O/H.
The KHNP website only provides the duration of each O/H, not the duration of each POS. Therefore, for each of the six units, the fraction of time spent in each POS was estimated using the O/H durations shown in Figure 7 and the duration in hours of each POS applied in an LPSD PSA for an OPR1000 plant, where the O/H experience for 10 OPR1000 units during 2003–2012 was analyzed in detail [18].
The duration of each O/H is different, but generally, there is no significant difference in the durations of the other POSs except for POS 8, where maintenance work is intensively performed on a defueled unit. For this reason, in this study, after calculating the average O/H duration for each unit, for example, 55.3 days for Unit 1, the durations used in the LPSD PSA [18] were equally applied to the POSs (e.g., 2.2 h for POS 1, 22.6 h for POS 2) except for the duration of POS 8, which was applied differently.
Table 3 shows the results of estimating the fraction of time spent in each POS of Hanul Units 1–6. The first POS here, “At-Power,” includes POS 1 (from low-power operation to reactor trip) and POS 15 (from reactor startup to low-power operation) in the LPSD PSA, as well as full-power operation. Accordingly, each fraction of time in Table 3 was calculated using the following equations:
where i is the POS number from 2 to 14 and j is the unit number from 1 to 6.
Table 3.
Estimated fraction of time spent in each POS of Hanul Units 1–6.
In the case of Units 3 and 4, it can be seen that the fraction of time for the at-power state is relatively low compared to the other units, while the fraction of time for POS 8 is relatively high because these two units replaced steam generators during the period as shown in Figure 7.
3.2. Example MUPSA Cases with Different Numbers of Units
3.2.1. Scope and Method
For this study, both site CDF, referring to core damage in one or more units, and multi-unit CDF, referring to core damage in two or more units, due to a MU-LOOP IE were estimated for four cases with different numbers of units at the site: 2-unit, 4-unit, 6-unit, and 10-unit cases.
This case study was not intended to perform a MUPSA for an actual NPP site and identify significant contributors to risk but to examine the applicability and effectiveness of the proposed approach. Therefore, the following assumptions were made to reduce the complexity of the case study.
- In each of the four cases, the reference site consists of one to five pairs of twin units.
- All units at the site are identical OPR1000 units. All structures, systems, and components except diesel generators (DGs) are identical across the units.
- Emergency DGs (EDGs) are identical for each pair of twin units (e.g., Units 1 and 2) but not between units in different pairs (e.g., Units 1 and 3).
- Each pair of twin units shares an alternative AC DG (AAC DG) of the same type as the EDGs. For each shared AAC DG, priority follows the unit number (e.g., Unit 1 → Unit 2).
- The MU-LOOP IE is a weather-related LOOP caused by severe weather conditions such as a typhoon, so it affects all units at the site simultaneously.
- Offsite power recovery actions are completely dependent across all units, while the other HFEs are independent between units because each unit has its own operating crew working in a physically separate control room or building.
- The adverse effects of core damage or radioactive release from one unit on operator actions in other adjacent units at the site [19] are negligible.
- Portable equipment that has already been or is planned to be installed as part of the Multi-barrier Accident Coping Strategy (MACST) for Korean NPPs is not credited.
To develop a base integrated single-unit model, the FP, and LPSD Level 1 PSA models for an OPR1000 plant [14] were used, and logics not related to the LOOP IE were removed. The LPSD model consists of 15 sub-models developed for each POS except POSs 1 and 15; hence the base integrated single-unit LOOP (SU-LOOP) model has 16 POSs, including at power (Table 3). The total number of events included in the final base SU-LOOP model is 58,084, with 37,112 gates and 20,972 basic events.
To develop a MUPSA model for each case, the base SU-LOOP model was duplicated to reflect the number of units and then differentiated using unit identifiers. Although all units were assumed to be identical, the fraction of time spent in each POS was applied differently for each unit using the values in Table 3. Specifically, for the 2-unit case, the fractions of Units 1 and 2 were applied; for the 4-unit case, those of Units 1 through 4; and for the 6-unit case, those of Units 1 through 6. For the 10-unit case, the fractions of Units 1 to 6 were applied to each corresponding unit, and those of Units 1 to 4 were applied once more to Units 7 to 10, respectively.
Inter-unit CCFs were modeled only for the DGs because the MCSs involving failures of one or more DGs contributed to over 90% of the total CDF in the integrated single-unit model. For each pair of twin units, five DGs, specifically four EDGs and one shared AAC DG, were grouped into a common-cause component group, and all possible CCF basic events (2-of-5, 3-of-5, 4-of-5, and 5-of-5) were modeled for two failure modes: failure to start and failure to run.
Regarding each AAC DG shared between twin units, its failure logic was developed using the assumption of unit priority mentioned above, namely that the AAC DG is available only to the first unit by number in cases where it is required at both units simultaneously. More details on this approach to modeling a shared component can be found in [5]. In addition, according to the assumptions related to the IE and HFEs, for the MU-LOOP IE and offsite power recovery actions, the same basic event was applied to all individual unit models without using unit identifiers.
In this study, MUPSA models were developed using AIMS-PSA software (Release 3, Rev. 1.0) [20], and the quantification of the accident sequence frequencies was performed using the FTREX quantification engine (Ver. 2.0, 64-bit) [17]. The cutoff value for the final quantification results of each model was set to 1E-14/yr.
3.2.2. Results
Table 4 summarizes the quantification results for five cases not applying the screening step, including the single-unit case. Here, the two risk metrics, site CDF and multi-unit CDF were calculated by the following equations, which are consistent with the definitions described in the IAEA safety report on MUPSA [3]:
where n is the number of units included in MUPSA.
(Site CDF) = ∑ (1-unit CDF + 2-unit CDF + … + n-unit CDF),
(Multi-unit CDF) = ∑ (2-unit CDF + … + n-unit CDF),
Table 4.
Comparison of quantification results by the number of units (without screening).
The points of interest from Table 4 are as follows.
- As the number of units involved increased, the model size, site CDF, and multi-unit CDF increased almost linearly while the run time and the number of MCSs increased exponentially.
- The quantification for the SU-LOOP model with about 58,000 events succeeded to produce results in less than a minute, eliminating the need to screen out non-risk-significant accident sequences in Step 2.
- For each number of units, the development of the MUPSA model in the form of a single-top fault tree was successful, so there was no need to go to the screening step in Step 3 either.
- In the 2-unit, 4-unit, and 6-unit cases, the quantification of the MUPSA model successfully yielded results within a reasonable time without performing the screening step. However, in the 10-unit case, the quantification failed without screening.
In the 10-unit case, the quantification succeeded after applying the first-level criterion described in Section 2.2, i.e., by screening out the accident sequences with a contribution of 0.1% or less to the CDF in each integrated single-unit model. In this case, about 80% of the accident sequences in each single-unit model were removed; hence the total number of events, or in other words the model size, decreased by about 43% to 327,622. The run time was 2345 s, and the total number of MCSs was about 25,000,000. The site CDF and multi-unit CDF were 1.01E-05/yr and 4.34E-07/yr, respectively.
Although the 6U-LOOP model was successfully quantified without screening, the run time was over 2000 s. If the model size increases or the logic becomes more complex, the computation time could become an issue. Therefore, in order to examine how the quantification results including the run time change when the three screening criteria are applied, the 6U-LOOP model was modified by applying each criterion in turn and re-quantified.
Table 5 compares the results according to the screening criteria. As the criterion level increased, by removing more and more non-risk-significant accident sequences, the model size and computation time decreased significantly, while the number of MCSs and the CDF values decreased relatively slightly. In particular, the multi-unit CDF was almost the same, with a difference of less than 1% between the four cases. These results indicate that the application of the screening criteria proposed in this study can effectively reduce the computational burden usually involved in MUPSA without losing much accuracy or realism.
Table 5.
Comparison of quantification results by screening criteria for the 6U-LOOP model.
Figure 8 shows the top 25 accident sequences in the order of CDF contribution among the 117 sequences included in the base integrated single-unit model and how the number changes as each selection criterion is applied. When the first-level criterion is applied, there are 24 accident sequences with a CDF contribution greater than 0.1%, and the sum of their contributions is 99.0%. By applying the second-level criterion, 11 sequences with a CDF contribution greater than 0.5% remain, and the contribution sum is 96.2%. Finally, when the third-level criterion is applied, only seven sequences with a CDF contribution greater than 1% survive, and the summed contribution is 93.5%. It can be seen that the ratio of the site CDF when applying each screening criterion to the site CDF of the “no screening” case—98.9%, 95.6%, and 92.5%—is very similar to the sum of the CDF contributions from the accident sequences selected in the integrated single-unit model: 99.0%, 96.2%, and 93.5%.
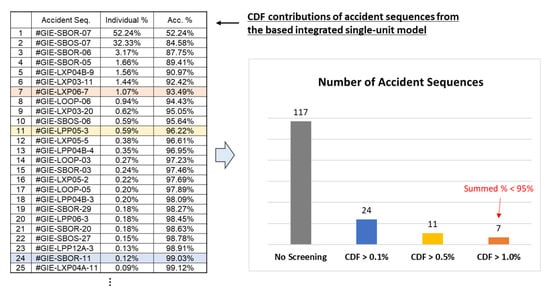
Figure 8.
Change in the number of accident sequences in the single-unit model by screening criteria.
Here, the sum of the CDF contributions resulting from applying the third-level criterion (93.5%) is less than the 95% specified in that criterion. For this reason, the third-level criterion cannot be applied in this case; its results are included in Table 5 only for comparison purposes.
In addition to the above results, it was found that the MCSs obtained in each case covered a large number of POS combinations and also that the MCSs involving very unlikely combinations, such as four or more units being in shutdown POSs except for at-power, were mostly truncated by the cutoff value of 1E-14/yr. For example, in the 6-unit case without screening, a total of 48,489 POS combinations were included in the MCSs. The sum of the contributions to the site CDF of the MCSs involving the most likely combination where all six units are at-power was 46.8%, while the summed contribution from the MCSs where four or more units are in shutdown POSs was less than 0.1%. Since the proposed approach models POS basic events as independent random events without considering the interdependence of the POSs for each unit, the resulting MCSs included POS combinations that were not in the actual O/H experience in Table 2. However, their CDF contribution was sufficiently low to be negligible (i.e., less than 0.1%).
4. Discussion and Conclusions
This paper proposed a pragmatic approach to modeling numerous combinations of POSs for each reactor unit, which is one of the unresolved issues in MUPSA. Unlike previous studies, this approach does not select a representative set of POS combinations. Instead, it first models all possible combinations and then screens out the non-risk-significant accident sequences for each unit in a stepwise manner according to the model quantification results. That is, this approach focuses on accident sequences for each unit rather than POS combinations themselves.
To demonstrate the effectiveness and applicability of the approach, a case study was conducted in which MUPSA models for estimating the site and multi-unit CDFs due to a MU-LOOP IE were developed and quantified for four cases with different numbers of units: 2, 4, 6, and 10 units. As the base single-unit model, a full-scale SUPSA model integrating the FP and LPSD Level 1 PSA models for an actual NPP was used.
The main results of this study are summarized as follows.
- Even though the base integrated single-unit model used in this study was very large, i.e., containing about 37,000 gates and 21,000 basic events, compared to a FP or LPSD SUPSA model for NPPs, the quantification of the MUPSA models combining the single-unit models succeeded within a reasonable time without screening any accident sequences for the 2-, 4-, and 6-unit cases.
- In the 10-unit case, the quantification failed without screening, but it succeeded after reducing the model size by about 43% by excluding the accident sequences in each integrated single-unit model with a CDF contribution of less than 0.1%.
- The MCSs obtained in each case covered a very large number of POS combinations, for example, about 50,000 combinations in the 6-unit case without screening.
- It was found that the MCSs involving very unlikely combinations, such as four or more units being in shutdown POSs, were mostly truncated by the cutoff value of 1E-14/yr, while the MCSs involving very likely combinations, such as all units being at-power, accounted for the majority.
- A comparison of the quantification results for the 6-unit case according to the three levels of screening criteria showed that as the level increases, the model size and computation time were significantly reduced by eliminating more accident sequences, while the reductions in the number of MCSs and CDF values were relatively small, especially for the multi-unit CDF with little change.
From the above results, the practical implications of the proposed approach can be derived as follows.
- This approach can be applied to site-level or multi-unit PSAs for actual NPP sites with a large number of reactor units. The case study was conducted for up to 10 units, but the approach applies to MUPSA involving more than 10 units depending on the size and logic complexity of each unit model.
- With this approach, there is no need to select a representative set of POS combinations. Therefore, it is possible to reduce the conservatism caused by selecting a small number of POS combinations.
- This approach can effectively reduce computational burden without losing much accuracy or realism by screening out non-risk-significant accident sequences in a stepwise manner according to the quantification results.
Although the case study demonstrated the effectiveness and applicability of the proposed approach, this study has the following limitations, which need to be addressed in future research.
- While the case study assumed all identical units for simplicity, many multi-unit NPP sites have different types of reactor units. For example, the Kori site in the Republic of Korea has four different types of operating units: WH600, WH900, OPR1000, and APR1400 [6,11]. Although the proposed approach has no limitations in application to MUPSAs involving non-identical units, application of this approach to various other cases, for example, MUPSAs involving non-identical units and other multi-unit IEs such as seismic events, will provide a better understanding of its strengths and limitations.
- Future work should also be directed toward further investigation of the three screening criteria levels. Quantification may still fail even if the model size is reduced by applying the screening criteria depending on the model to be analyzed, the software used for model development and quantification, and the environment in which the computer system operates. In such cases, rather than mechanically applying the screening criteria, it is necessary to consider more relaxed criteria, such as excluding the condition for the summed contribution to be greater than 95%, to obtain quantification results.
Author Contributions
Conceptualization/methodology, D.-S.K. and J.H.P.; formal analysis/writing—original draft preparation, D.-S.K.; writing—review & editing, J.H.P. All authors have read and agreed to the published version of the manuscript.
Funding
This work was supported by a National Research Foundation of Korea (NRF) grant funded by the Korean government (MSIT: Ministry of Science and ICT) (No. 2017M2A8A4015287, RS-2022-00143695).
Institutional Review Board Statement
Not applicable.
Informed Consent Statement
Not applicable.
Data Availability Statement
Not applicable.
Conflicts of Interest
The authors declare no conflict of interest.
Abbreviations
| AAC DG | Alternative AC Diesel Generator |
| APR1400 | Advanced Power Reactor 1400 MWe |
| CCDP | Conditional Core Damage Probability |
| CCF | Common Cause Failure |
| CDF | Core Damage Frequency |
| DG | Diesel Generator |
| EDG | Emergency Diesel Generator |
| FP | Full Power |
| HFE | Human Failure Event |
| IE | Initiating Event |
| KHNP | Korea Hydro & Nuclear Power, Co., Ltd. |
| LOOP | Loss of Offsite Power |
| LPSD | Low Power and Shutdown |
| MCS | Minimal Cut Set |
| MUPSA | Multi-Unit Probabilistic Safety Assessment |
| NPP | Nuclear Power Plant |
| O/H | Overhaul |
| OPR1000 | Optimized Power Reactor 1000 MWe |
| POS | Plant Operational State |
| PSA | Probabilistic Safety Assessment |
| SOS | Site Operating State |
| SUPSA | Single-Unit Probabilistic Safety Assessment |
| WH | Westinghouse |
References
- Zhou, T.; Modarres, M.; Droguett, E.L. Multi-unit nuclear power plant probabilistic risk assessment: A comprehensive survey. Reliab. Eng. Syst. Saf. 2021, 213, 107782. [Google Scholar] [CrossRef]
- Canadian Nuclear Safety Commission. Proceedings of the Summary Report of the International Workshop on Multi-Unit Probabilistic Safety Assessment, Ottawa, ON, Canada, 17–20 November, 2014.
- International Atomic Energy Agency. Multi-Unit Probabilistic Safety Assessment. In Safety Reports Series No. 110, Final Draft; IAEA: Vienna, Austria, 2021. [Google Scholar]
- International Atomic Energy Agency. Attributes of Full Scope Level 1 Probabilistic Safety Assessment (PSA) for Applications in Nuclear Power Plants. In IAEA-TECDOC-1804; IAEA: Vienna, Austria, 2016. [Google Scholar]
- Kim, D.-S.; Han, S.H.; Park, J.H.; Lim, H.G.; Kim, J.H. Multiunit Level 1 probabilistic safety assessment: Approaches and their application to a six-unit NPP site. Nucl. Eng. Technol. 2018, 50, 1217–1233. [Google Scholar] [CrossRef]
- Jang, S.; Kim, Y.; Jae, M. A site risk assessment for internal events: A case study. Reliab. Eng. Syst. Saf. 2021, 215, 107876. [Google Scholar] [CrossRef]
- Ferrante, F.; Maioli, A.; Kiper, K.; Trull, C.; Sivori, A.A. Practical insights for assessing multi-unit risk to support risk-informed decision-making. In Proceedings of the ANS PSA 2021 International Topical Meeting on Probabilistic Safety Assessment and Analysis, Columbus, OH, USA, 7–12 November 2021. [Google Scholar]
- Kiper, K.; Maioli, A. A Framework for addressing site integrated risk. In Proceedings of the ANS PSA 2015 International Topical Meeting on Probabilistic Safety Assessment and Analysis, Sun Valley, ID, USA, 26–30 April 2015. [Google Scholar]
- Sivori, A.; Kiper, K.; Maioli, A.; Teolis, D. Further development of a framework for addressing site integrated risk. In Proceedings of the ANS PSA 2017 International Topical Meeting on Probabilistic Safety Assessment and Analysis, Pittsburgh, PA, USA, 24–28 September 2017. [Google Scholar]
- Mandelli, D.; Parisi, C.; Alfonsi, A.; Maljovec, D.; Boring, R.; Ewing, S.; St Germain, S.; Smith, C.; Rabiti, C.; Rasmussen, M. Multi-unit dynamic PRA. Reliab. Eng. Syst. Saf. 2019, 185, 303–317. [Google Scholar] [CrossRef]
- Jeon, H.; Oh, K.; Park, J. Approach to developing Level 1 multi-unit PSA models and insights from the models. In Proceedings of the Asian Symposium on Risk Assessment and Management (ASRAM) 2019, Gyeongju, Korea, 30 September–2 October 2019. [Google Scholar]
- Bareith, A. An initiative towards site-level risk assessment for Paks NPP. In Proceedings of the International Workshop on Status of Site Level PSA (including Multi-Unit PSA) Developments, Munich, Germany, 18–20 July 2018. [Google Scholar]
- Yoo, H.; Jin, K.; Heo, G. Study of combinations of site operating states for multi-unit PSA. Nucl. Eng. Technol. 2021, 53, 3247–3255. [Google Scholar] [CrossRef]
- KAERI. Development of Site Risk Assessment and Management Technology Including Extreme External Events. In KAERI/RR-4225/2016; Korea Atomic Energy Research Institute: Daejeon, Korea, 2017. [Google Scholar]
- ASME/ANS. Addenda to ASME/ANS RA-S-2008, Standard for Level 1/Large Early Release Frequency Probabilistic Risk Assessment for Nuclear Power Plant Applications. In ASME/ANS RA-Sb-2013; The American Society of Mechanical Engineers & American Nuclear Society: New York, NY, USA, 2013. [Google Scholar]
- Han, S.H.; Oh, K.; Lim, H.G.; Yang, J.E. AIMS-MUPSA software package for multi-unit PSA. Nucl. Eng. Technol. 2018, 50, 1255–1265. [Google Scholar] [CrossRef]
- Jung, W.S.; Han, S.H.; Ha, J. A fast BDD algorithm for large coherent fault trees analysis. Reliab. Eng. Syst. Saf. 2004, 83, 369–374. [Google Scholar] [CrossRef]
- Korea Hydro & Nuclear Power Co., Ltd. LPSD Internal Events Level 1 PSA Report for Hanul Units 3 and 4; KHNP: Kyeongju, Korea, 2015. [Google Scholar]
- Yoon, J.Y.; Kim, D.-S. Estimating the adverse effects of inter-unit radioactive release on operator actions at a multi-unit site. Reliab. Eng. Syst. Saf. 2022, 228, 108764. [Google Scholar] [CrossRef]
- Han, S.H.; Lim, H.G.; Jang, S.C.; Yang, J.E. AIMS-PSA: A software for integrated PSA. In Proceedings of the 13th International Conference on Probabilistic Safety Assessment and Management (PSAM 13), Seoul, Korea, 2–7 October 2016. [Google Scholar]

Publisher’s Note: MDPI stays neutral with regard to jurisdictional claims in published maps and institutional affiliations. |
© 2022 by the authors. Licensee MDPI, Basel, Switzerland. This article is an open access article distributed under the terms and conditions of the Creative Commons Attribution (CC BY) license (https://creativecommons.org/licenses/by/4.0/).