Abstract
Continuous advancement in the health sector is essential to reduce costs and increase efficiency and quality of service. The widespread use of ultrasonography (USG) has made it possible to detect thyroid nodules with higher success rates. Some standard scoring systems have been developed to score thyroid nodules. Thyroid scoring systems are classification systems that determine the risk of cancer in thyroid nodules according to ultrasonographic characteristics and nodule size. Different scoring results for the same thyroid nodule may occur according to these different scoring systems, which can cause some unnecessary surgical interventions. In this study, some intelligent models are developed to assist thyroid scoring systems, with the aim to determine the correct surgical intervention and reduce operation costs by preventing unnecessary interventions and surgical procedures. The integration of current thyroid scoring systems (K-TIRADS, ACR-TIRADS, EU-TIRADS, ATA, and BTA) and machine learning methods provides radiologists and clinicians a decision-support mechanism in the evaluation of thyroid nodules. Correct diagnosis will help to reduce costs by helping prevent unnecessary procedures. The present dataset was retrospectively constructed using ultrasound images of thyroid nodules between 2014 and 2018. In determining the treatment process of thyroid nodules, Random Forest, Adaboost, J48 Decision Tree (J48 DT), and Support Vector Machine (SVM) models are used for increased prediction accuracy of thyroid scoring systems. The goal is to decrease redundant Fine Needle Aspiration (FNA) biopsies and surgical interventions of suspicious thyroid nodules. As a result of the study, higher degrees of accuracy are achieved in the determination of correct or incorrect surgical interventions of thyroid nodules using the J48 DT algorithm with the EU-TIRADS scoring system, with an accuracy rate of 99.7853%, compared to other classifiers.
1. Introduction
Careful and appropriate approaches should be adopted in healthcare, since it is among the industries posing a high risk to human health. Put differently, clinicians and healthcare systems are under immense pressure due to a rapidly changing population structure, managerial needs, insufficient workforce, and growing epidemics, as well as changes in demand and expectations for sustainable, competitive information technologies [1,2]. The underlying reasons for such stresses may be that system-related factors are often ignored in the industry [3]. Therefore, in prioritizing patients, staff should employ various mechanisms to analyze and promote healthcare systems [4].
Healthcare systems in developed countries consistently report medical treatment and other management errors such as over/undertreatment, over/underdiagnosis, and runaway costs and budgets [5]. Medical malpractice is defined as the harm that may occur to the patient because of the treatments performed by health personnel with insufficient knowledge, skills, experience, or interest [6]. However, not only does medical malpractice affect patient experience and efficiency in healthcare, but it also includes important negative factors such as delays, long waiting times, waiting lists for service delivery, lack or excess of capacity, lack or excess of inventory, patients who go to the hospital multiple times before service is delivered, and dissatisfied patients. A healthcare organization should value its patients and their relatives. Therefore, patient value should be the key to making responsible decisions. Patient value can be defined as the patient’s medical outcome divided by the cumulative cost [5].
Thyroid nodules are separate lesions located within the thyroid gland that have radiologically different features from the surrounding thyroid parenchyma [7]. They are relatively prevalent in the general population, with an incidence of 10–67% [8,9,10]. Although most thyroid nodules are benign, 9–15% are determined to be malignant according to the results of ultrasound-guided fine-needle aspiration (FNA) [7]. Therefore, evaluating the specific US findings that can distinguish benign thyroid nodules from malignant ones helps to avoid unnecessary FNA or frequent follow-up US. Also, early detection of benign and malignant thyroid nodules is considered vital to guide clinical treatment or, if necessary, to decide on operative methods. After evaluating a thyroid nodule, agreeing on the most appropriate strategy to manage malignant nodules may help avoid redundant procedures and surgery for benign nodules. In this sense, conventional ultrasound (US) is commonly preferred to evaluate thyroid nodules, since it is noninvasive and cost-effective [11]. The features of a malignant nodule on US include microcalcifications, marked hypoechogenicity, being microlobulated or irregularly circumscribed, and suspicious cervical lymph nodes with long axis perpendicular to the skin [7]. However, due to the complex nature of the nodules, there may be some some overlap between the features of benign and malignant nodules on complex US images. [12]. Therefore, they are not always satisfactorily distinguished by operator-dependent US. In recent years, some thyroid scoring systems have been developed (K-TIRADS, EU-TIRADS, ACR-TIRADS, ATA, BTA, etc.) to diagnose benign and malignant thyroid nodules. These scoring systems are used to score cancer rate. According to the cancer score ratio, clinicians determine whether to perform surgical intervention [13,14,15].
Now, machine learning and artificial intelligence are dominating various industries. Among them, medicine and healthcare may be ripe for these state-of-the-art applications. Machine learning has been widely adopted in different medical practices (blood count, sperm count, cancer screening, diagnoses, etc.), yielding high-performance results. The relevant literature also contains many studies oriented to machine learning applications for thyroid nodules [16,17,18,19,20,21,22].
In this study, we retrospectively investigated the thyroid treatment process, obtained through US imaging techniques, adopting different machine learning algorithms (Random Forest, J48 Decision Tree (J48 DT), Adaboost, and Support Vector Machine (SVM)) with current thyroid nodule scoring systems (K-TIRADS, EU-TIRADS, ACR-TIRADS, ATA, and BTA) with the aim to prevent unnecessary interventions and costs. Then, we compared the diagnostic performances of the hybrid algorithm with the evaluations of two experienced radiologists. In the end, we created a decision-support mechanism with high accuracy for radiologists. In other words, intelligent models were integrated into current thyroid nodule scoring systems. These hybrid models are used to distinguish benign from malignant nodules.
The main contributions of this paper can be summarized as follows:
- -
- An original dataset is collected to carry out this study.
- -
- Some intelligent models are employed for assisting thyroid scoring systems with the aim to determine the correct surgical intervention for thyroid nodules and to reduce operation costs by preventing unnecessary interventions and surgical procedures.
- -
- We aimed to increase the efficiency and robustness of the scoring systems. Therefore, while integrating the intelligent models to scoring systems, we attempted to prevent unnecessary operation costs.
- -
- We aimed to build a decision-support system to doctors.
2. Materials and Methods
2.1. Patients and Thyroid Nodules
The Ethics Committee of Canakkale Onsekiz Mart University granted ethical approval to our study for retrospective imaging and laboratory analyses (No: 2013-12). Two experienced radiologists evaluated US images obtained between 2014 and 2018 and classified them by five scoring systems (K-TIRADS, EU-TIRADS, ACR-TIRADS, ATA, and BTA). The relevant data (from January 2014 to November 2018) were obtained from the picture archiving and communication system (PACS) of the related hospital. Only the data of patients who underwent cytology and/or surgical histology (FNA) after examination and patients with a complete medical history who had not undergone any previous surgical treatment of nodules were obtained.
2.2. Ultrasound (US) Imaging of Thyroid Nodules
In this study, a Toshiba Aplio 500 ultrasound machine equipped with 10–12 MHz linear probes and 128XP sonographic scanners was used to obtain US images. US images of both transverse and thyroid lobes and isthmus were obtained, as well as longitudinal planes according to current thyroid scoring systems (K-TIRADS, EU-TIRADS, ACR-TIRADS, ATA, BTA, etc.). They were recorded on PACS workstations. Two independent experienced sonographers evaluated the US imaging of each thyroid nodule, blind to pathology.
When there was a disagreement between the evaluators, it was resolved by the consensus of a third evaluator. In this procedure, the following sonographic features of each nodule were investigated: size, contours (regular, irregular, or lobulated), aspect ratio (<1 or ≥1), hypoechoic halo, internal composition, echogenicity (anechoic, hyperechoic, isoechoic, isohyperechoic, hypoisoechoic, or hypoechoic), calcification pattern (none, microcalcification, macrocalcification, or both), vascularity, and cervical lymph nodes.
2.3. Machine Learning Algorithms
This section briefly summarizes Random Forest (RF), J48 DT, Ada Boost, and Support Vector Machines (SVM), which were utilized as machine learning algorithms.
2.4. Random Forest (RF)
RF is a simple-to-implement algorithm with high efficiency and accuracy, as it can avoid high variance and bias in classification or estimation problems. The RF method, which manages to give accurate results even in cases where there are missing data, makes use of the forest structure, from which it is named, while performing this process [23]. In the prediction process of the novel data, the data are voted row by row by existing trees, so that the tree with the most votes in the forest structure (all trees in the forest) is selected as the final classification result. At the beginning of the RF structure generation process, constituent trees are identified and subset in a randomly distributed manner. Thus, a community of trees with different properties is formed.
Based on the Random Forest method, there is a structure that makes use of the average of the group of trees, consisting of random selections. This structure has an important role in reducing the variance of the data. In case of a different x observation, the prediction class of the tree Db can be used for final class of DRF as in Equation (1).
2.5. J48 Decision Tree (J48 DT)
Due to the efficient error recession method, J48 DT was used in this study. It is a modified version of the C4.5 tree algorithm, introduced by Quinalan 1993. The J48 DT algorithm utilizes a normalized information gain to construct the tree based on the separation criteria, where T is the set of cases and Ti (i = 1 to s) are subsets of T with different attribute values [24]. Another advantage of the J48 DT algorithm is a measure of entropy defined as info (Ti) in Equation (2). While Equation (2) shows gain information, Equation (3) is used to calculate entropy [25].
where freq(Cj,T) represents the number of cases that belong to class Cj.
2.6. Adaptive Boosting (AdaBoost)
AdaBoost has a structure that aims to understand the shortcomings of methods with poor classification success and to improve them [26]. Unlike Random Forest adopting parallel joins, Adaboost uses “sequential joins”. It combines many low-performance classifiers to obtain a classifier with higher classification success. Although it increases the accuracy of the classification process, there is also the possibility of giving erroneous results in some cases due to overfitting. This is due to its adaptive structure. AdaBoost, which is highly affected by the presence of outliers in the data, is utilized to increase the classification success of methods based on decision trees [27].
2.7. Support Vector Machine (SVM)
The Support Vector Machines method shows successful performance in large datasets. If the parameters to be given to the method are not suitable, the probability of success is high. In addition, due to the structure of the model, it is more difficult to evaluate compared to other methods [28]. Support Vector Machine method tries to find a plane that will maximize the divergence between binary clusters. It is assumed that some kernel functions induced by K of the classifier are in reproducing kernel Hilbert space (RKHS), and the reproducible kernel is defined as H function. To solve the following problem, the classification Hk problem of SVM can be formulated as in Equation (5).
where > 0, Hk represents RKHS associated with the kernel K, denotes the norm of in RKHS, and x are the data samples. One of the solutions to this problem encountered in the SVM method is to apply the Karush–Kuhn–Tucker requirement to the binary transform of the target function.
2.8. Diagnostic Performance of Machine Learning Algorithms
As in Figure 1, firstly some characteristics features are obtained using thyroid evaluation reports of ultrasound images. The sonographic features of each nodule that were used as input are size, contours (regular, irregular, or lobulated), aspect ratio (<1 or ≥1), hypoechoic halo, internal composition, echogenicity (anechoic, hyperechoic, isoechoic, isohyperechoic, hypoisoechoic, or hypoechoic), calcification pattern (none, microcalcification, macrocalcification, or both), vascularity, and cervical lymph nodes. These features are submitted to different machine learning algorithms (Random Forest, Adaboost, J48 Decision Tree (J48 DT), and Support Vector Machine (SVM)) as input vectors. Then, current classification systems (K-TIRADS, EU-TIRADS, ACR-TIRADS, ATA, and BTA) results are given this model as outputs, respectively. Then, the diagnostic performances of the hybrid algorithm are compared by two experienced radiologists. Therefore, a decision-support mechanism is created according to current classification. At the end, correct or incorrect surgical interventions are determined.
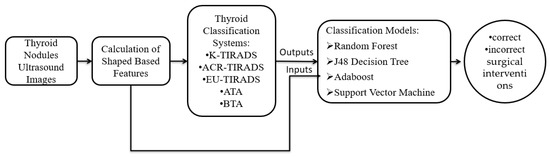
Figure 1.
Flow diagram of proposed algorithm.
All the mentioned classification algorithms were applied to the samples consisting of 3261 nodules, and then they were subjected to analysis. While obtaining performance metrics, 10 cross validation tests were used. Then, the diagnostic performance of the machine learning algorithms was measured. Internal validation was carried out using the remaining dataset after selecting the training set. After the training phase of this method was completed, scores were obtained from machine learning methods with training datasets. Then, considering these scores, classification methods were applied to the validation dataset. By using the probability of malignancy, our algorithms can assign a patient’s thyroid nodule(s) to a specific class (malignant or benign) within the classification system (TI-RADS, K-TIRADS, EU-TIRADS, ACR-TIRADS, ATA, and BTA).
2.9. Performance Criteria
In order to measure performance rate of classification models, some metrics such as accuracy, recall, precision, and f-measure were used in this study. Table 1 shows a confusion matrix for a binary classification problem.

Table 1.
Confusion matrix explanation for a binary classification problem.
TP (True Positive) represents positive actual values correctly predicted by the model, FN (False Negative) is incorrectly predicted negative actual classes, TN (True Negative) is negative actual values correctly predicted by the model, and FP (False Positive) represents positive actual values incorrectly predicted by the model.
Accuracy: It is the most used method among model performance criteria. It is obtained by dividing the number of samples that the model knows correctly by the total number of samples. The accuracy can be calculated from the ratio given in Equation (6).
Precision: It is calculated by dividing the number of positive classes that the model predicts correctly by the total number of positive classes. The precision value can be calculated from Equation (7).
Recall: It is calculated by dividing the number of positive classes that the model predicts correctly by the total number of positive predicted classes. The sensitivity value can be calculated from Equation (8).
f-Measure: Sensitivity and precision values do not make sense alone. The f-measure is found by the harmonic mean of the precision and sensitivity values. It is the most commonly used evaluation criterion after accuracy value. The F-score value can be calculated as seen in Equation (9).
ROC (Receiver Operator Characteristics) Area: Another commonly used criterion for classification problems is the ROC area. The ROC area is used to visualize performances in classification problems. In recent years, it is frequently used especially in medical decision making. The ROC curve has the FP ratio on the x-axis and the TP ratio on the y-axis. FP rate can be calculated from Equation (10) and the TP rate from Equation (11). It means a good classification is made in the ROC curve as the curve shifts to the upper left corner. As the curve shifts to the center, it means a poor classification.
3. Experimental Results
3.1. The Characteristics of Patients and Nodules
Sonographic features of thyroid nodules have led to the emergence of classification systems, and these systems have continuously been updated over the years. Sonographic features of thyroid nodules are indicated as marked for hypoechogenicity, hypoechogenicity, solidity, irregularity/lobulation in their contours, a long axis perpendicular to the skin, microcalcification, and malignancy.
In the present study, 3261 thyroid nodules are investigated, among which 2695 belong to female patients and 566 belong to male patients. While 2097 (64.3%) were benign, 807 (24.7%) were malignant. Another 357 (11%) were of nondiagnostic cytology.
Nodules for which an FNA biopsy was performed whereas they should have been followed up according to ACR-TIRADS: 722 in Category 2, 615 in Category 3 (528 needed to be followed up), 1248 in Category 4, (565 needed to be followed up), and 676 in Category 5 (216 needed to be followed up).
Nodules for which an FNA biopsy was performed whereas they should have been followed up according to K-TIRADS: 406 in Category 2, 852 in Category 3 (407 needed to be followed up), 1363 in Category 4, (260 needed to be followed up), and 640 in Category 5 (232 needed to be followed up).
Nodules for which an FNA biopsy was performed whereas they should have been followed up according to EU-TIRADS: 61 in Category 2, 1186 in Category 3 (860 needed to be followed up), 669 in Category 4, (185 needed to be followed up), and 1345 in Category 5 (215 needed to be followed up).
Nodules for which an FNA biopsy was performed whereas they should have been followed up according to ATA and BTA: the numbers of nodules in the very low-risk group were 310 (ATA) and 384 (BTA), while there were 803 (ATA) and 1066 (BTA) nodules in the low-risk group.
Random Forest, J48 DT, Adaboost, and SVM were used as prediction models to detect whether surgical interventions were correct or incorrect. In the models, a 10-fold cross-validation method was used to calculate performance metrics. As class labels, “1” indicates incorrect surgical interventions, and the label “0” indicates correct operations on the nodules.
For Random Forest, the number of leaves was set to 6, and the size of the tree was set to 11 for all experiments. For J48 DT, the confidence factor was set to 0.25, and the minimum number of instances per leaf was set to 2. For the Adaboost algorithm, the weight threshold for weight pruning was 100, the seed was 1, and number of iterations was 10. While training the SVM model, the hinge loss function was used as the loss function, the seed was 1, lambda was 10−4, the epochs were 500, and epsilon (e) was set to 0.001. For all experiments, optimization methods and hyperparameters were determined by trial and error.
3.2. Results of EU-TIRADS Classification System
Random Forest, J48 DT, Ada Boost, and SVM models were used with the EU-TIRADS system. The findings revealed that J48 DT yielded the top accuracy rate with 99.7853%. Table 2 shows the success rates for all classifiers. While Table 3 presents the confusion matrix generated for the J48 DT classifier, Table 4 demonstrates the evaluation metrics for J48 DT.
Table 2.
Comparative results for the classifiers.
Table 3.
Confusion matrix for J48 DT.
Table 4.
Evaluation metrics for J48 DT.
3.3. Results of ACR-TIRADS Classification System
Random Forest, J48 DT, Ada Boost, and SVM models were used to assist the ACR-TIRADS system. The findings revealed that J48 DT yielded the top accuracy rate with 98.5587%. Table 5 shows the success rates for all classifiers. While Table 6 presents the confusion matrix generated for the J48 DT classifier, Table 7 illustrates the evaluation metrics for J48 DT.
Table 5.
Comparative results for the classifiers.
Table 6.
Confusion matrix for J48 DT.
Table 7.
Evaluation metrics for J48 DT.
3.4. Results of ATA Classification System
Random Forest, J48 DT, Ada Boost, and SVM were used to evaluate the ATA scoring system. The findings revealed that J48 DT yielded the top accuracy rate with 96.2895%. Table 8 shows the success rates for all classifiers. While Table 9 presents the confusion matrix generated for the J48 DT classifier, Table 10 demonstrates the evaluation metrics for J48 DT.
Table 8.
Comparative results for the classifiers.
Table 9.
Confusion matrix for J48 DT.
Table 10.
Evaluation metrics for J48 DT.
3.5. Results of BTA Classification System
The BTA classification system was evaluated using 4 different classification methods: Random Forest, J48 DT, Ada Boost, and SVM. The findings revealed that J48 DT yielded the top accuracy rate with 97.7308%. Table 11 shows the success rates for all classifiers. While Table 12 presents the confusion matrix generated for the J48 DT classifier, Table 13 demonstrates the evaluation metrics for J48 DT.
Table 11.
Comparative results for the classifiers.
Table 12.
Confusion matrix for J48 DT.
Table 13.
Evaluation metrics for J48 DT.
3.6. Results of K-TIRADS Classification System
Random Forest, J48 DT, Ada Boost, and SVM models were employed to test the K-TIRADS system. The findings revealed that SVM yielded the top accuracy rate with 99.5707%. Table 14 shows the success rates for all classifiers. While Table 15 presents the confusion matrix generated for the SVM classifier, Table 16 demonstrates the evaluation metrics for the SVM classifier.
Table 14.
Comparative results for the classifiers.
Table 15.
Confusion matrix for SVM.
Table 16.
Evaluation metrics for SVM.
Although the cross-validation test is a robust and reliable method to evaluate model performance, the external validation test was used to show model generalization capability in this study. To these ends, the EU-TIRADS scoring system, which achieved the best results, was selected for this experiment. In this experiment, 80% of the whole dataset (2609 of 3261) was selected randomly for training the model, and the remaining 20% of the dataset (652 of 3261), which was not used in training process of the model, was selected for testing the model. Random Forest, J48 DT, Ada Boost, and SVM models were used to perform this experiment. The results revealed that Random Forest yielded the top accuracy rate with 98.4663%, as shown in Table 17. While Table 18 presents the confusion matrix generated for the Random Forest classifier, Table 19 demonstrates the evaluation metrics for this classifier. As can be seen from the experimental results, the external validation test results provide proof for the generalization capability of the models and support the validity and reliability of the results obtained with the 10-fold cross-validation test. In addition, these results show that the proposed models can handle the overfitting problem.
Table 17.
Comparative results for the classifiers.
Table 18.
Confusion matrix for Random Forest.
Table 19.
Evaluation metrics for Random Forest.
3.7. Lean Manufacturing: Costing the Value Stream
In this study, we adopted value stream costing among lean costing methods. Lean manufacturing strategically promotes cutting costs, eliminating waste, and reducing conversion times through business practices based on value streams. In such a strategic environment, value stream costing provides significant cost management thanks to data extracted through links between lean concepts and strategies and accounting and production reports [29]. Value stream costing is often used to eliminate all redundant processes (waste) associated with production control, materials, and product costing. It is also a simple and efficient cost-management tool, eradicating the need for standard costing and allocating overhead costs [30]. Yet, in our case, the accounting elements (labor, overhead, raw materials, etc.) are common to all hospitals, and only the number/load of tasks shared across value streams relies on each hospital’s organizational processes.
Table 20 presents the number of redundant operations and biopsies with the help of available thyroid classification systems (K-TIRADS, ACR-TIRADS, EU-TIRADS, ATA, and BTA) and artificial intelligence machine learning methods.
Table 20.
Unnecessary operations and FNA biopsies by the classification systems.
Table 21 shows the costs of unnecessary operations and biopsies to the hospital through a lean costing tool with the help of current thyroid classification systems (K-TIRADS, ACR-TIRADS, EU-TIRADS, ATA, and BTA) and artificial intelligence machine learning methods.
Table 21.
Costs of the unnecessary operations to the hospital.
Meanwhile, all unnecessary operations and biopsies were invoiced by the hospital to the Social Security Institution (SSI) or private health insurance companies. Table 22 below presents these SSI-invoiced unnecessary costs, revealed with the help of current thyroid scoring systems (K-TIRADS, ACR-TIRADS, EU-TIRADS, ATA, and BTA) and machine learning methods.
Table 22.
SSI-invoiced unnecessary costs.
4. Discussion
FNA biopsy is a widely accepted technique for detecting nontoxic thyroid nodules. Evaluation and management of thyroid nodules with classification systems aims to triage patients who need surgery and then follow the surgical procedures appropriate for their disease [31]. In addition, due to uncertain cytological properties, FNA biopsy of a thyroid nodule is limited mainly to distinguishing between malignant or benign follicular neoplasms, follicular variants of papillary cancer, hyperplastic nodules, and Hurthle cells [32,33]. It should always be remembered that the results of an FNA biopsy are nondiagnostic, suspicious, or uncertain in 20–30% of cases [32]. Conventional clinical treatment for indeterminate aspirates is a repeated FNA biopsy; however, 38–48% uncertainty still exists even if IAA is repeated. Diagnostic surgery, which causes high cost and difficulties for the patient, can be applied [33].
In most cancer cases, there is only one nodule in the group. Yet, relevant literature reported no significant relationship between the number of nodules and [34]. Most of the community of scientists working on the subject think that the increase in the number of nodules does not affect the risk of malignancy [35]. Previous studies, including meta-analyses, compared US imaging and the results of FNA biopsies of thyroid nodules by US imaging criteria for the diagnosis of malignancy, including microcalcification, hypoechogenicity, a long axis perpendicular to the skin, and poorly defined (irregular, lobulated) borders [36,37,38]. Consistent with previous studies, we determined that the sonographic features of thyroid nodules, such as calcification pattern (microcalcification), contour features (irregular, lobulated), cervical lymph node involvement, echogenicity (significant hypoechogenicity/hypoechogenicity), and aspect ratio (taller than wide) were the strongest predictors of malignancy. One of the features that makes this study different from other studies is that the specificity of the evaluation of lymph nodes is high since each of the sonographic examinations is assumed to be of equal importance. Evaluation of cervical lymph nodes, which is a part of thyroid sonography, is deemed essential to detect any metastasis. Microcalcification in ipsilateral pathological lymph nodes, hypoechogenicity in their cortex, and an increase in cortex thickness and vascularization are significant regarding metastasis in malignant thyroid nodules [39,40,41].
This study presents widespread US properties regarding the hypoechoic halo, including thyroid nodules, capsule, contour, aspect ratio, shape, size, echogenicity, calcification pattern, color Doppler vascularity, internal composition, and the status of cervical lymph node. Another study found that if US imaging features are used to detect nodules, more efficient results can be obtained than nodule size. In line with this information, the researchers concluded that more studies are needed on the malignancy analysis of nodules in the thyroid [42]. Also in this study, it was determined that the malignancy was not affected by the size of the nodule.
This study includes a comparison of four different machine learning methods that evaluate thyroid nodules. Overall, across machine learning algorithms, J48 DT, which is a nonlinear machine learning algorithm, gave the best results compared to the other three machine learning methods. In addition to its successful results, its ease of use, reproducibility, and cost-effectiveness may encourage the use of this algorithm in the diagnosis of malignant tumors. Besides, it may conveniently be used to reveal excessive treatment and unnecessary operations that cause a significant financial burden on SSI.
5. Conclusions
Medical treatment and other management errors, such as undertreatment, over/underdiagnosis, and uncontrolled costs and budgets constitute a major source of financial burden on healthcare systems. These problems not only reduce the quality of healthcare services, but also boost medical expenditures. In this study, we aimed to identify medical treatment and management errors caused by classification. The identified medical errors were then dynamically designed to minimize medical errors with novel or updated classification systems. The goal is to provide superior predictive quality with good interpretability and high computational efficiency, promoting the prediction of medical errors by old-fashioned classification approaches to thyroid nodules, as well as to introduce a dynamic classification method to eliminate these errors.
Utilizing the database of hospitals in Turkey, we carried out this in-depth research to test various machine learning techniques to predict unnecessary operations. Estimations for redundant operations by the EU-TIRADS, ACR-TIRADS, ATA, BTA, and K-TIRADS scoring systems were measured considering six outstanding performance metrics. Then, we explored the relative values in the results of similar studies. We achieved higher degrees of accuracy in the determination of redundant surgical procedures thanks to the J48 DT algorithm and the EU-TIRADS classification system, with an accuracy rate of 99.7853%, compared to other classifiers. In the future, we hope to carry out a more rigorous study using a larger dataset, including state and university hospitals in Turkey. The design of this study may be employed on other potential medical data. Furthermore, an adaptation of our design into different fields is likely to contribute to the relevant literature.
Author Contributions
Conceptualization, E.A. (Erdal Ayvaz); methodology, K.K., E.A. (Erdal Ayvaz) and F.K.; software, K.K. and F.K.; validation, E.A. (Erdal Ayvaz), E.A. (Ednan Ayvaz) and H.T.; formal analysis, E.A. (Ednan Ayvaz); resources, E.A. (Ednan Ayvaz); data curation, E.A. (Erdal Ayvaz) and H.T.; writing—original draft preparation, E.A. (Ednan Ayvaz) and K.K.; writing—review and editing, E.A. (Ednan Ayvaz) and F.K. All authors have read and agreed to the published version of the manuscript.
Funding
This research received no specific grant from any funding agency in the public, commercial, or not-for-profit sectors.
Institutional Review Board Statement
Informed consent was obtained from all individual participants included in the study.
Informed Consent Statement
All procedures performed in studies involving human participants were in accordance with the ethical standards of the institutional and/or national research committee and with the 1964 Helsinki declaration and its later amendments or comparable ethical standards.
Data Availability Statement
Not applicable.
Conflicts of Interest
The authors declare that they have no known competing financial interest or personal relationships that could have appeared to influence the work reported in this paper.
References
- Hurst, J. Challenges for health systems in member countries of the Organisation for Economic Co-operation and Development. Bull. World Health Organ. 2000, 78, 751–760. [Google Scholar]
- Innes, G. Sorry—We’re full! Access block and accountability failure in the health care system. CJEM 2015, 17, 171–179. [Google Scholar] [CrossRef] [PubMed][Green Version]
- Henriksen, K.; Dayton, E.; Keyes, M.A.; Carayon, P.; Hughes, R. Understanding Adverse Events: A Human Factors Framework. In Patient Safety and Quality: An Evidence-Based Handbook for Nurses; Hughes, R.G., Ed.; Chapter 5; Agency for Healthcare Research and Quality (US): Rockville, MD, USA, 2008. [Google Scholar]
- Vincent, C. Understanding and responding to adverse events. N. Engl. J. Med. 2003, 348, 1051–1056. [Google Scholar] [CrossRef]
- Porter, M.E. What is value in health care? N. Engl. J. Med. 2010, 363, 2477–2481. [Google Scholar] [CrossRef]
- Reason, J. Understanding adverse events: Human factors. Qual. Health Care 1995, 4, 80–89. [Google Scholar] [CrossRef] [PubMed]
- Haugen, B.R.; Alexander, E.K.; Bible, K.C.; Doherty, G.M.; Mandel, S.J.; Nikiforov, Y.E.; Pacini, F.; Randolph, G.W.; Sawka, A.M.; Schlumberger, M.; et al. 2015 American Thyroid Association Management Guidelines for Adult Patients with Thyroid Nodules and Differentiated Thyroid Cancer: The American Thyroid Association Guidelines Task Force on Thyroid Nodules and Differentiated Thyroid Cancer. Thyroid 2016, 26, 1–133. [Google Scholar] [CrossRef] [PubMed]
- Yoon, J.H.; Lee, H.S.; Kim, E.K.; Moon, H.J.; Kwak, J.Y. Malignancy Risk Stratification of Thyroid Nodules: Comparison between the Thyroid Imaging Reporting and Data System and the 2014 American Thyroid Association Management Guidelines. Radiology 2016, 278, 917–924. [Google Scholar] [CrossRef]
- Cooper, D.S. American Thyroid Association (ATA) guidelines taskforce on thyroid nodules and differentiated thyroid cancer. Revised American Thyroid Association management guidelines for patients with thyroid nodules and differentiated thyroid cancer. Thyroid 2009, 19, 1167–1214. [Google Scholar] [CrossRef] [PubMed]
- Frates, M.C.; Benson, C.B.; Charboneau, J.W.; Cibas, E.S.; Clark, O.H.; Coleman, B.G.; Cronan, J.J.; Doubilet, P.M.; Evans, D.B.; Goellner, J.R.; et al. Society of Radiologists in Ultrasound. Management of thyroid nodules detected at US: Society of Radiologists in Ultrasound consensus conference statement. Radiology 2005, 237, 794–800. [Google Scholar] [CrossRef]
- Kaur, K.; Sonkhya, N.; Bapna, A.S.; Mital, P. A comparative study of fine needle aspiration cytology, ultrasonography and radionuclide scan in the management of solitary thyroid nodule: A prospective analysis of fifty cases. Indian J. Otolaryngol. Head Neck Surg. 2002, 54, 96–101. [Google Scholar] [CrossRef]
- Shin, J.H.; Baek, J.H.; Chung, J.; Ha, E.J.; Kim, J.H.; Lee, Y.H.; Lim, H.K.; Moon, W.J.; Na, D.G.; Park, J.S.; et al. Korean Society of Thyroid Radiology (KSThR) and Korean Society of Radiology. Ultrasonography Diagnosis and Imaging-Based Management of Thyroid Nodules: Revised Korean Society of Thyroid Radiology Consensus Statement and Recommendations. Korean J. Radiol. 2016, 17, 370–395. [Google Scholar] [CrossRef] [PubMed]
- Xia, J.; Chen, H.; Li, Q.; Zhou, M.; Chen, L.; Cai, Z.; Fang, Y.; Zhou, H. Ultrasound-based differentiation of malignant and benign thyroid Nodules: An extreme learning machine approach. Comput. Methods Programs Biomed. 2017, 147, 37–49. [Google Scholar] [CrossRef] [PubMed]
- Zhu, L.C.; Ye, Y.L.; Luo, W.H.; Su, M.; Wei, H.P.; Zhang, X.B.; Wei, J.; Zou, C.L. A model to discriminate malignant from benign thyroid nodules using artificial neural network. PLoS ONE 2013, 8, e82211. [Google Scholar] [CrossRef] [PubMed]
- Oberije, C.; Nalbantov, G.; Dekker, A.; Boersma, L.; Borger, J.; Reymen, B.; van Baardwijk, A.; Wanders, R.; De Ruysscher, D.; Steyerberg, E.; et al. A prospective study comparing the predictions of doctors versus models for treatment outcome of lung cancer patients: A step toward individualized care and shared decision making. Radiother. Oncol. 2014, 112, 37–43. [Google Scholar] [CrossRef] [PubMed]
- Sollini, M.; Cozzi, L.; Chiti, A.; Kirienko, M. Texture analysis and machine learning to characterize suspected thyroid nodules and differentiated thyroid cancer: Where do we stand? Eur. J. Radiol. 2018, 99, 1–8. [Google Scholar] [CrossRef] [PubMed]
- Ouyang, F.S.; Guo, B.L.; Ouyang, L.Z.; Liu, Z.W.; Lin, S.J.; Meng, W.; Yang, S.M. Comparison between linear and nonlinear machine-learning algorithms for the classification of thyroid nodules. Eur. J. Radiol. 2019, 113, 251–257. [Google Scholar] [CrossRef]
- Colakoglu, B.; Alis, D.; Yergin, M. Diagnostic value of machine learning-based quantitative texture analysis in differentiating benign and malignant thyroid nodules. J. Oncol. 2019, 2019, 6328329. [Google Scholar] [CrossRef] [PubMed]
- Daniels, K.; Gummadi, S.; Zhu, Z.; Wang, S.; Patel, J.; Swendseid, B.; Eisenbrey, J. Machine learning by ultrasonography for genetic risk stratification of thyroid nodules. JAMA Otolaryngol.—Head Neck Surg. 2020, 146, 36–41. [Google Scholar] [CrossRef]
- Thomas, J.; Ledger, G.A.; Mamillapalli, C.K. Use of artificial intelligence and machine learning for estimating malignancy risk of thyroid nodules. Curr. Opin. Endocrinol. Diabetes Obes. 2020, 27, 345–350. [Google Scholar] [CrossRef]
- Ma, X.; Xi, B.; Zhang, Y.; Zhu, L.; Sui, X.; Tian, G.; Yang, J. A machine learning-based diagnosis of thyroid cancer using thyroid nodules ultrasound images. Curr. Bioinform. 2020, 15, 349–358. [Google Scholar] [CrossRef]
- Gild, M.L.; Chan, M.; Gajera, J.; Lurie, B.; Gandomkar, Z.; Clifton-Bligh, R.J. Risk stratification of indeterminate thyroid nodules using ultrasound and machine learning algorithms. Clin. Endocrinol. 2021, 96, 646–652. [Google Scholar] [CrossRef] [PubMed]
- Genuer, R.; Poggi, J.M.; Tuleau-Malot, C. VSURF: An R package for variable selection using random forests. R J. 2015, 7, 19–33. [Google Scholar] [CrossRef]
- Sahu, S.K.; Mehtre, B.M. Network intrusion detection system using J48 Decision Tree. In Proceedings of the 2015 International Conference on Advances in Computing, Communications and Informatics (ICACCI), Kochi, India, 10–13 August 2015; pp. 2023–2026. [Google Scholar]
- Chandrasekar, P.; Qian, K.; Shahriar, H.; Bhattacharya, P. Improving the Prediction Accuracy of Decision Tree Mining with Data Preprocessing. In Proceedings of the 2017 IEEE 41st Annual Computer Software and Applications Conference (COMPSAC), Turin, Italy, 4–8 July 2017; pp. 481–484. [Google Scholar] [CrossRef]
- Freund, Y.; Schapire, R.E. Experiments with a new boosting algorithm. In Proceedings of the Thirteenth International Conference on International Conference on Machine Learning, Bari, Italy, 3–6 July 1996; Volume 96, pp. 148–156. [Google Scholar]
- Pedregosa, F.; Varoquaux, G.; Gramfort, A.; Michel, V.; Thirion, B.; Grisel, O.; Blondel, M.; Prettenhofer, P.; Weiss, R.; Dubourg, V.; et al. Scikit-learn: Machine learning in python. J. Mach. Learn. Res. 2011, 12, 2825–2830. [Google Scholar]
- Amaral, D.G.; Schumann, C.M.; Nordahl, C.W. Neuroanatomy of autism. Trends Neurosci. 2008, 31, 137–145. [Google Scholar] [CrossRef]
- Stenzel, C.; Stenzel, J. Essentials of Cost Management; Wiley: New York, NY, USA, 2003. [Google Scholar]
- Maskell, B.H.; Baggaley, B.L. Lean Accounting: What’s It All About? Target Vol. 2006, 22, 35–43. [Google Scholar]
- Werga, P.; Wallin, G.; Skoog, L.; Hamberger, B. Expanding role of fine-needle aspiration cytology in thyroid diagnosis and management. World J. Surg. 2000, 24, 907–912. [Google Scholar] [CrossRef] [PubMed]
- Theoharis, C.G.; Schofield, K.M.; Hammers, L.; Udelsman, R.; Chhieng, D.C. The Bethesda thyroid fine-needle aspiration classification system: Year 1 at an academic institution. Thyroid 2009, 19, 1215–1223. [Google Scholar] [CrossRef]
- Mathur, A.; Weng, J.; Moses, W.; Steinberg, S.M.; Rahbari, R.; Kitano, M.; Khanafshar, E.; Ljung, B.M.; Duh, Q.Y.; Clark, O.H.; et al. A prospective study evaluating the accuracy of using combined clinical factors and candidate diagnostic markers to refine the accuracy of thyroid fine needle aspiration biopsy. Surgery 2010, 148, 1170–1176; discussion 1176–1177. [Google Scholar] [CrossRef] [PubMed]
- Chammas, M.C.; de Araujo Filho, V.J.; Moysés, R.A.; Brescia, M.D.; Mulatti, G.C.; Brandão, L.G.; Cerri, G.G.; Ferraz, A.R. Predictive value for malignancy in the finding of microcalcifications on ultrasonography of thyroid nodules. Head Neck 2008, 30, 1206–1210. [Google Scholar] [CrossRef]
- Iqbal, M.; Mehmood, Z.; Rasul, S.; Inamullah HShah, S.S.; Bokhari, I. Carcinoma thyroid in multi and uninodular goiter. J. Coll. Physicians Surg. Pak. 2010, 20, 310–312. [Google Scholar]
- Zahir, S.T.; Vakili, M.; Ghaneei, A.; Sharahjin, N.S.; Heidari, F. Ultrasound Assistance In Differentiating Malignant Thyroid Nodules From Benign Ones. J. Ayub. Med. Coll. Abbottabad 2016, 28, 644–649. [Google Scholar] [PubMed]
- Rahimi, M.; Farshchian, N.; Rezaee, E.; Shahebrahimi, K.; Madani, H. To differentiate benign from malignant thyroid nodule comparison of sonography with FNAC findings. J. Med. Sci. 2013, 29, 77–80. [Google Scholar] [CrossRef] [PubMed]
- Kim, E.K.; Park, C.S.; Chung, W.Y.; Oh, K.K.; Kim, D.I.; Lee, J.T.; YooPak, H.S. New sonographic criteria for recommending fine-needle aspiration biopsy of nonpalpable solid nodules of the thyroid. AJR Am. J. Roentgenol. 2002, 178, 687–691. [Google Scholar] [CrossRef] [PubMed]
- Lim, K.; Choi, C.S.; Yoon, D.Y.; Chang, S.; Kim, K.; Han, H.; Kim, S.; Lee, J.; Jeon, Y. Computer-Aided Diagnosis for the Differentiation of Malignant from Benign Thyroid Nodules on Ultrasonography. Acad. Radiol. 2008, 15, 853–858. [Google Scholar] [CrossRef] [PubMed]
- Chang, Y.; Paul, A.K.; Kim, N.; Baek, J.H.; Choi, Y.J.; Ha, E.J.; Lee, K.D.; Lee, H.S.; Shin, D.; Kim, N. Computer-aided diagnosis for classifying benign versus malignant thyroid nodules based on ultrasound images: A comparison with radiologist-based assessments. Med. Phys. 2016, 43, 554. [Google Scholar] [CrossRef]
- Gitto, S.; Grassi, G.; De Angelis, C.; Monaco, C.G.; Sdao, S.; Sardanelli, F.; Sconfienza, L.M.; Mauri, G. A computer-aided diagnosis system for the assessment and characterization of low-to-high suspicion thyroid nodules on ultrasound. La Radiol. Med. 2019, 124, 118–125. [Google Scholar] [CrossRef]
- Jeong, E.Y.; Kim, H.L.; Ha, E.J.; Park, S.Y.; Cho, Y.J.; Han, M. Computer-aided diagnosis system for thyroid nodules on ultrasonography: Diagnostic performance and reproducibility based on the experience level of operators. Eur. Radiol. 2019, 29, 1978–1985. [Google Scholar] [CrossRef]

Publisher’s Note: MDPI stays neutral with regard to jurisdictional claims in published maps and institutional affiliations. |
© 2022 by the authors. Licensee MDPI, Basel, Switzerland. This article is an open access article distributed under the terms and conditions of the Creative Commons Attribution (CC BY) license (https://creativecommons.org/licenses/by/4.0/).