
Dust Dispersion Characteristics of Open Stockpiles and the Scale of Dust Suppression Shed

Abstract
:1. Introduction
2. Numerical Methods
2.1. Site Measurement
2.2. Numerical Models
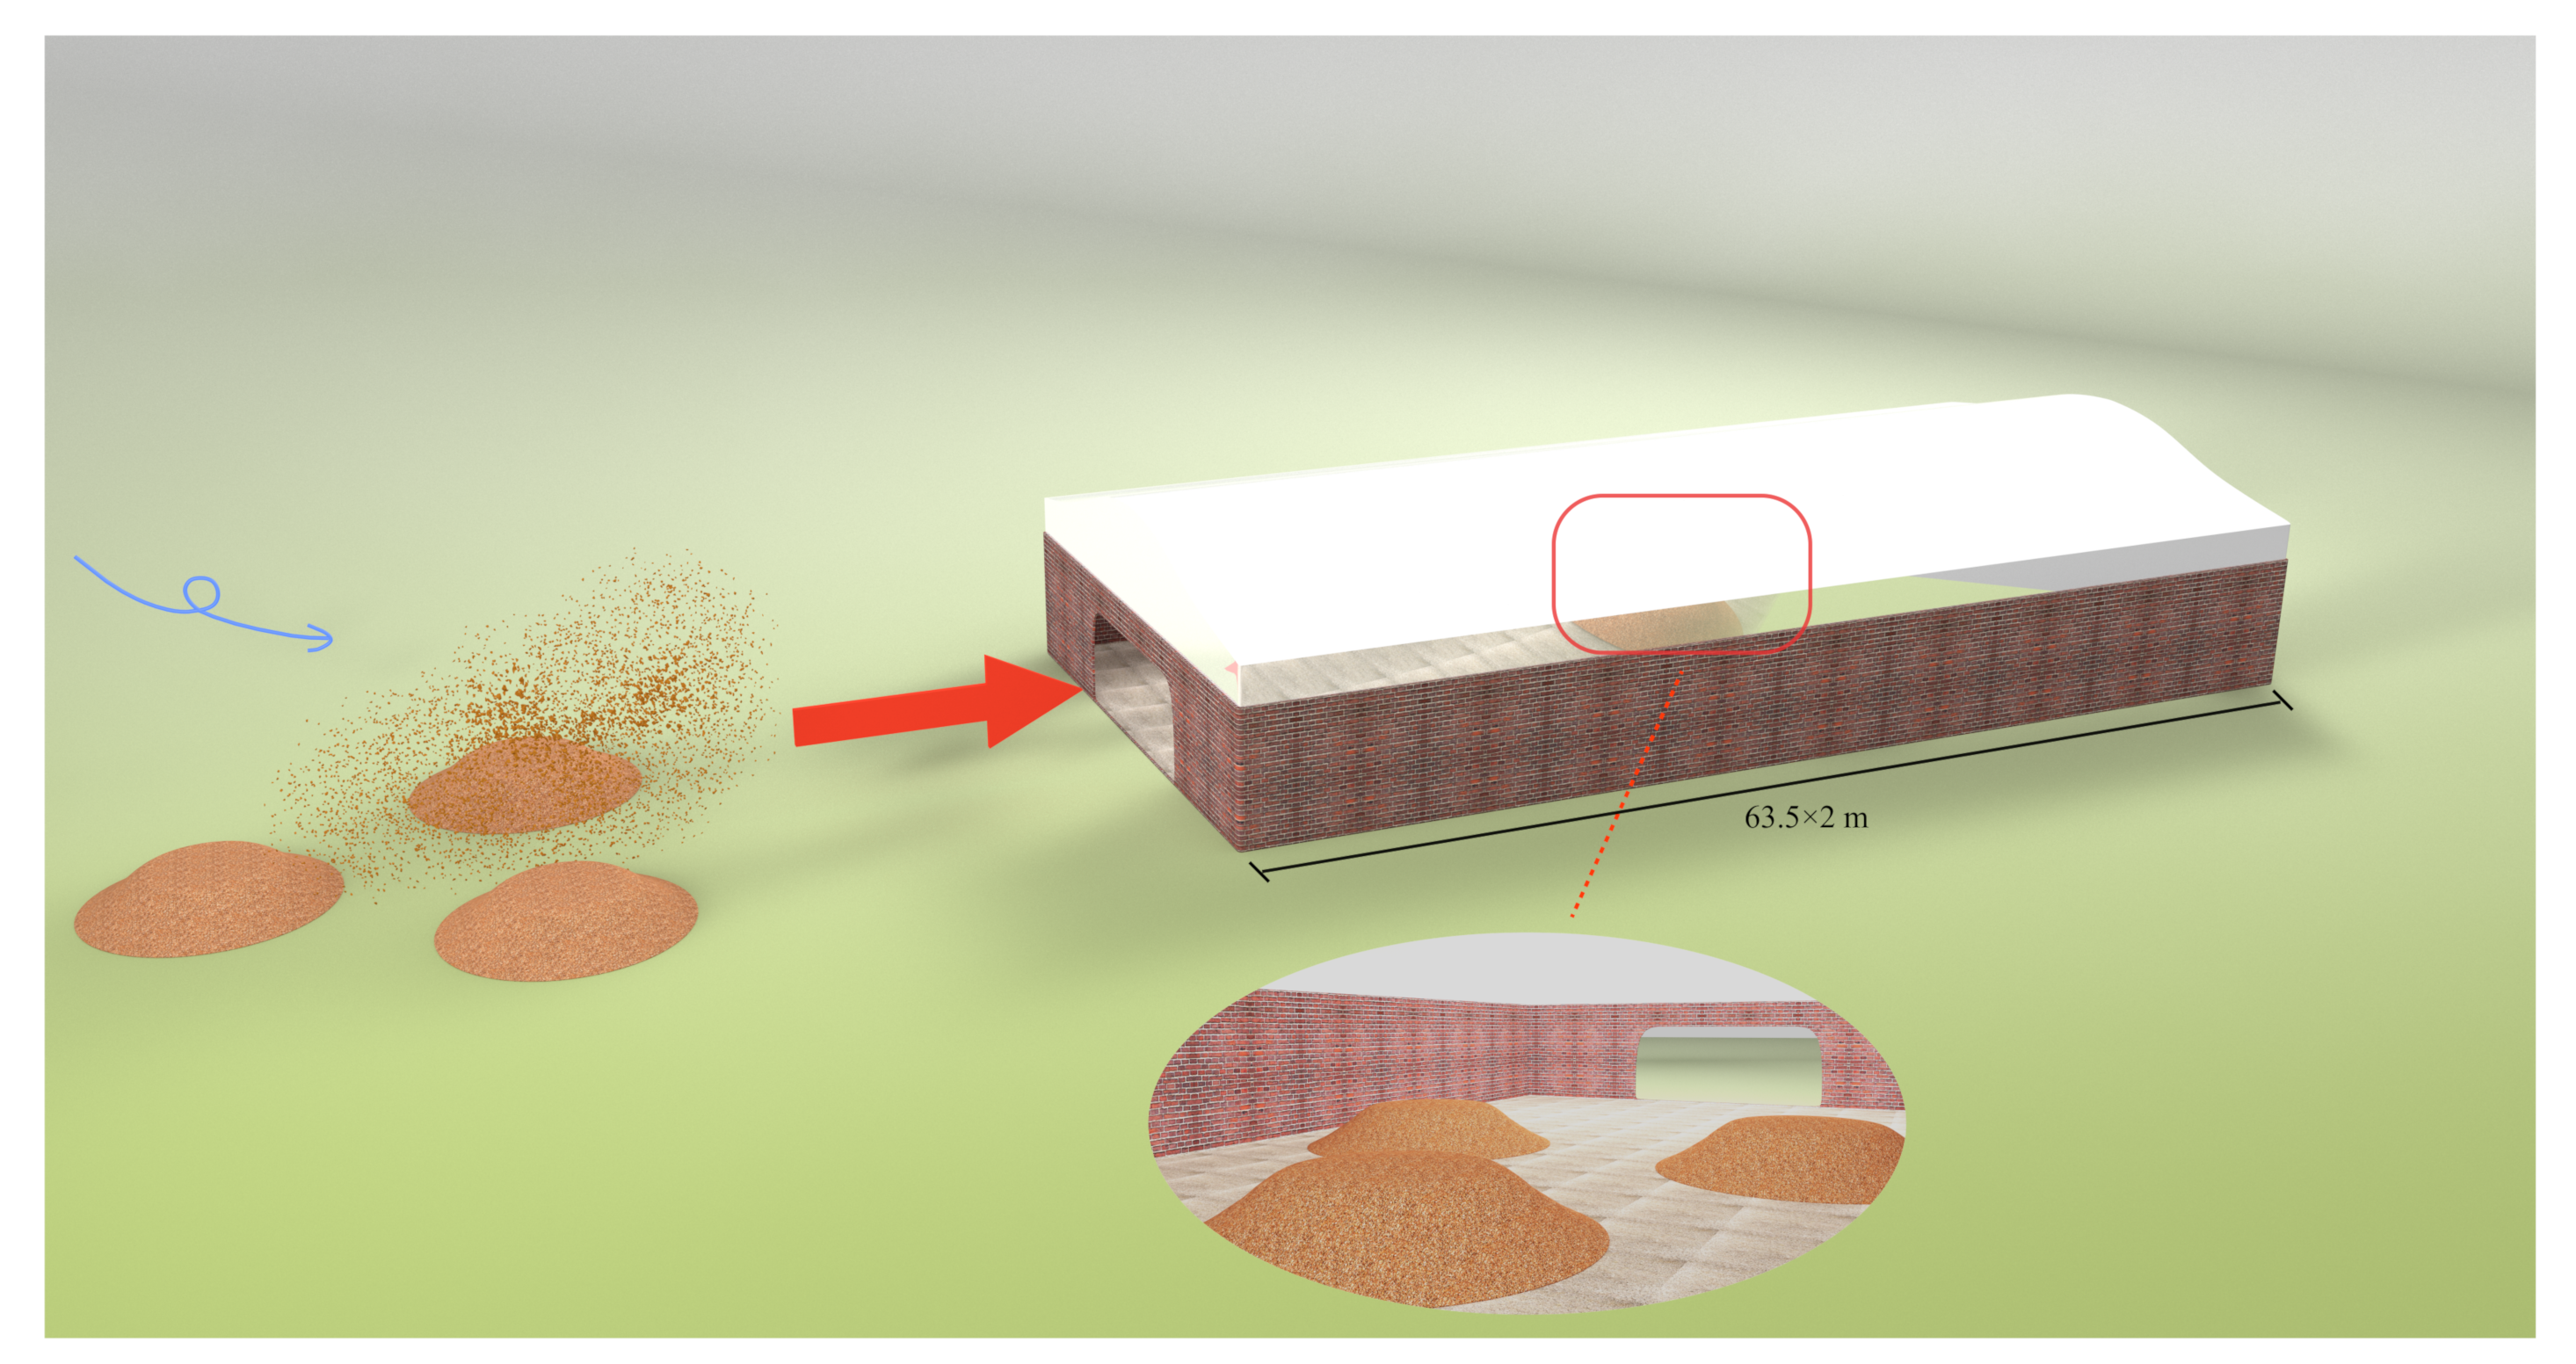
2.2.1. Physical Model
2.2.2. Simulation Setup
2.3. Governing Equations of Airflow and Particles
2.3.1. Governing Equations of Airflow
2.3.2. Particle Transport Equations
2.4. Dust Exposure Assessment
3. Results and Discussion
3.1. Validation
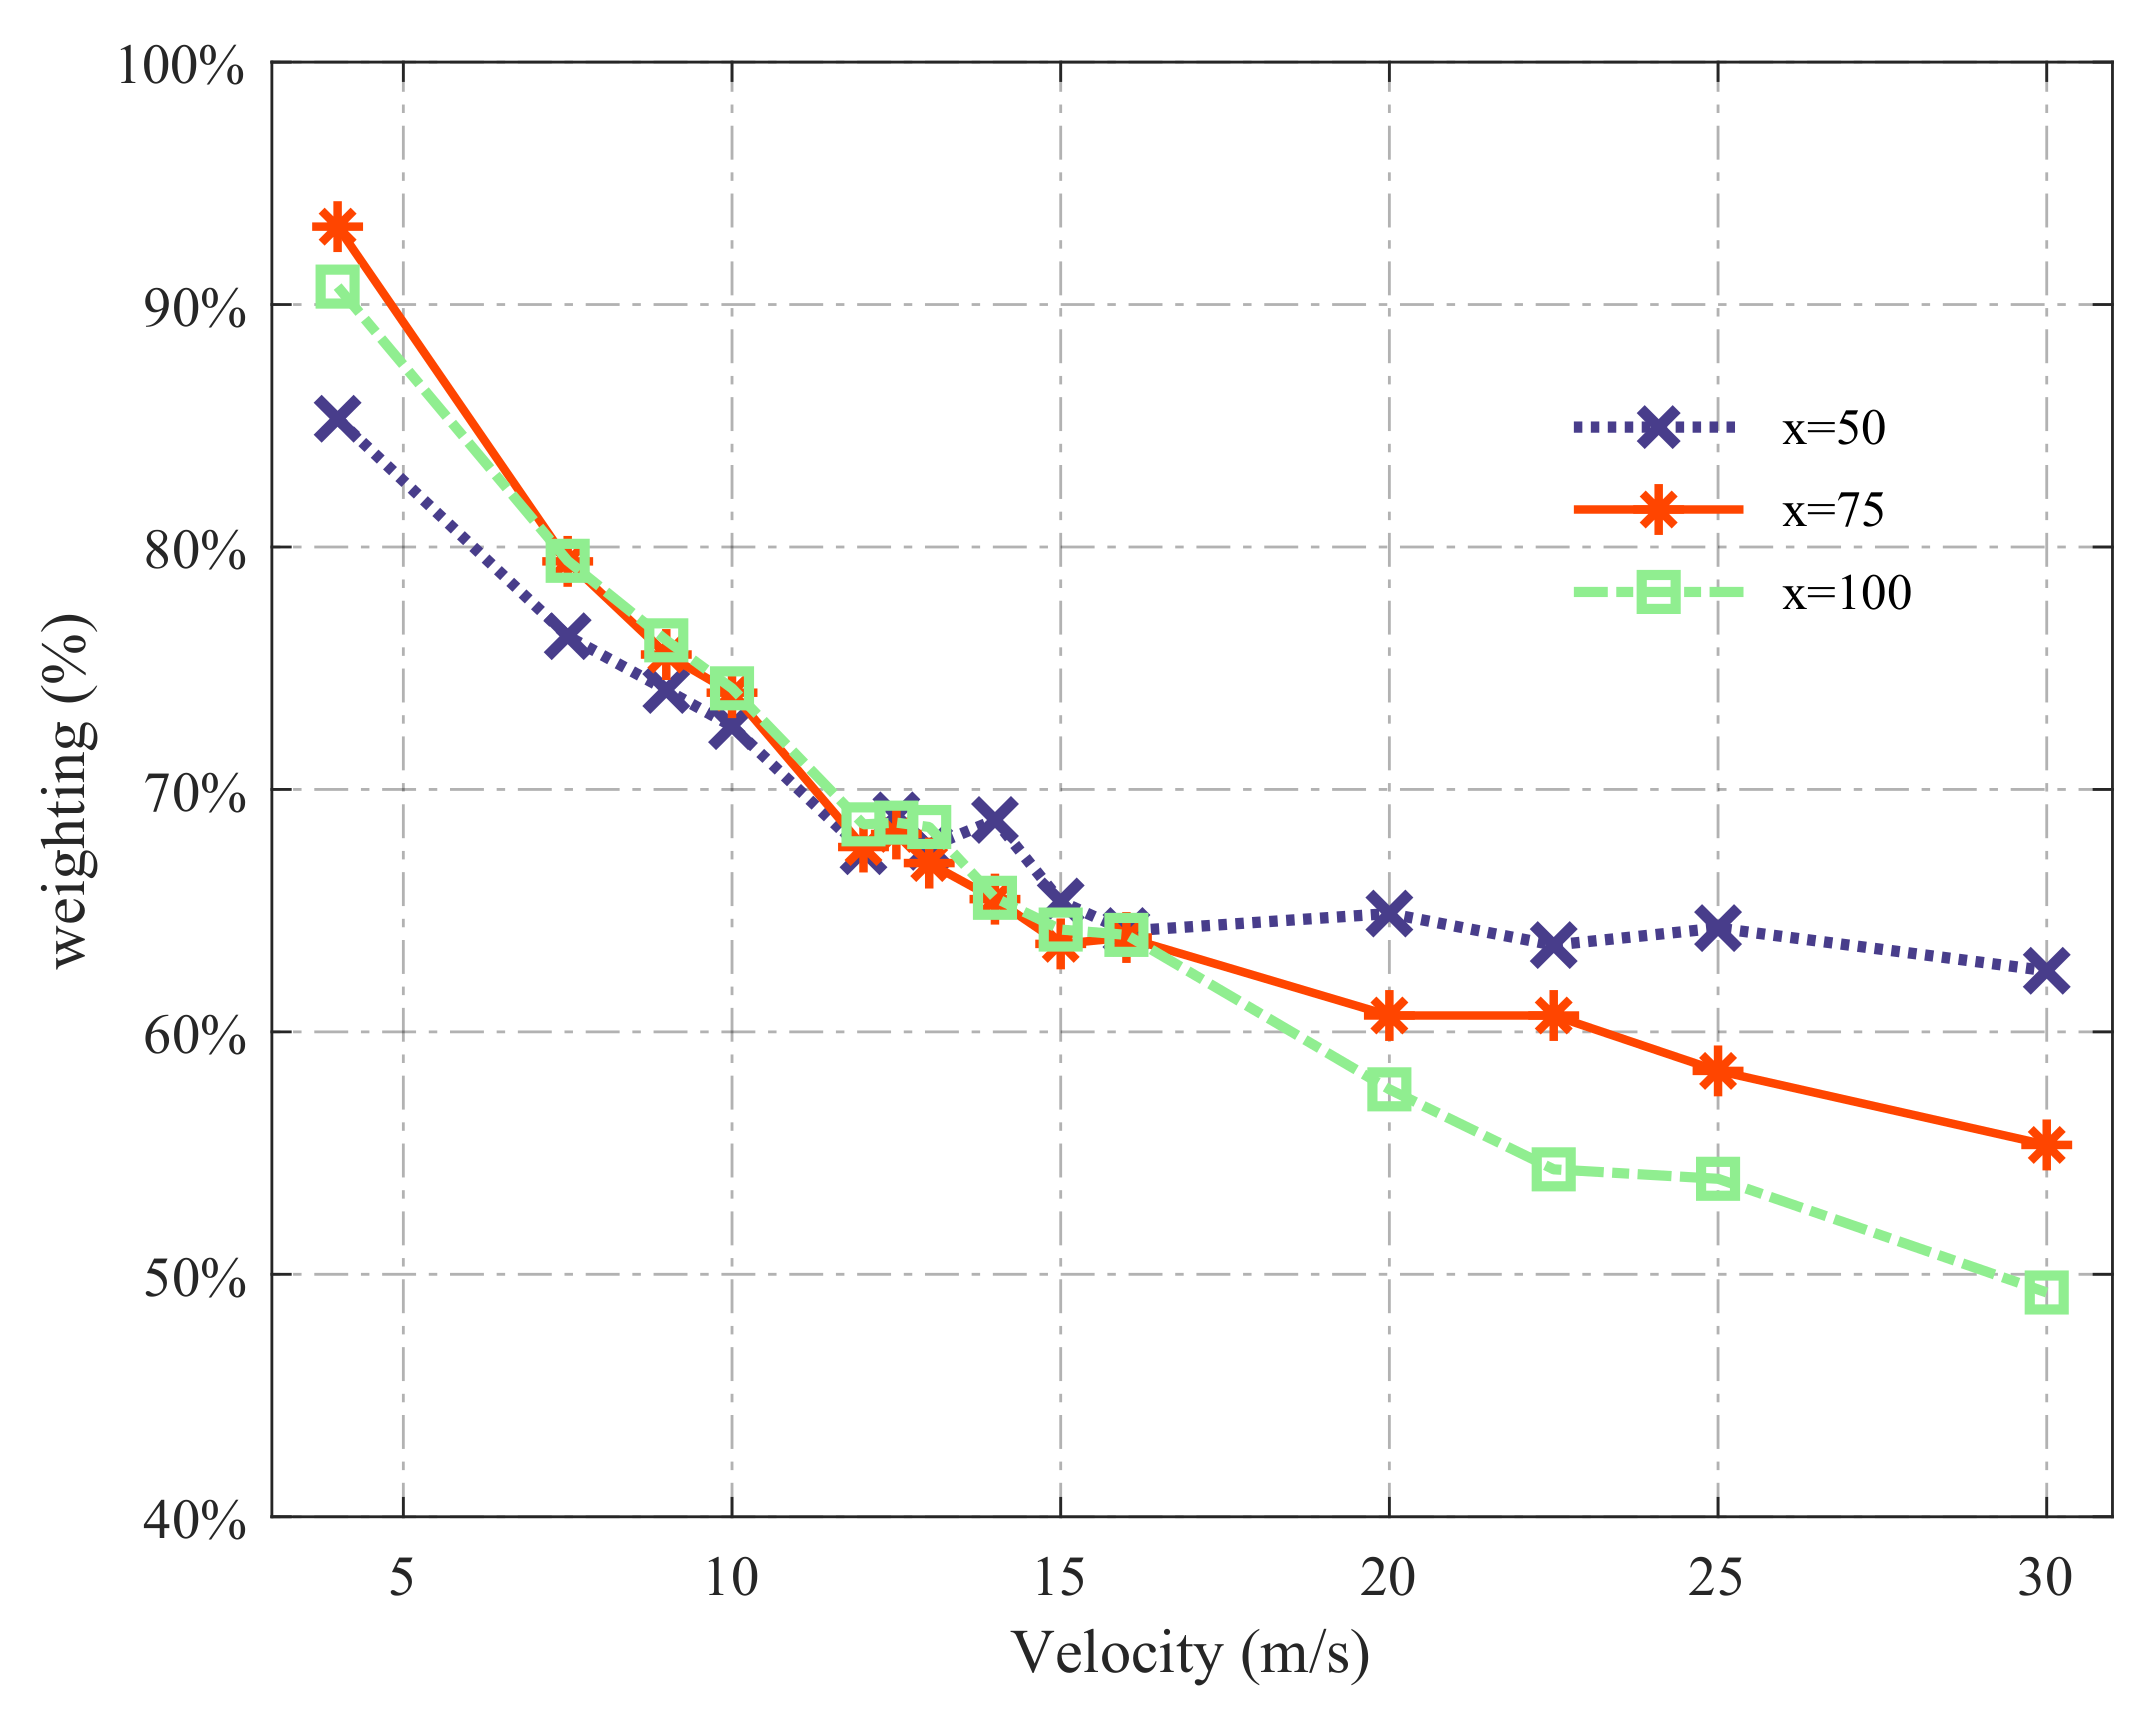
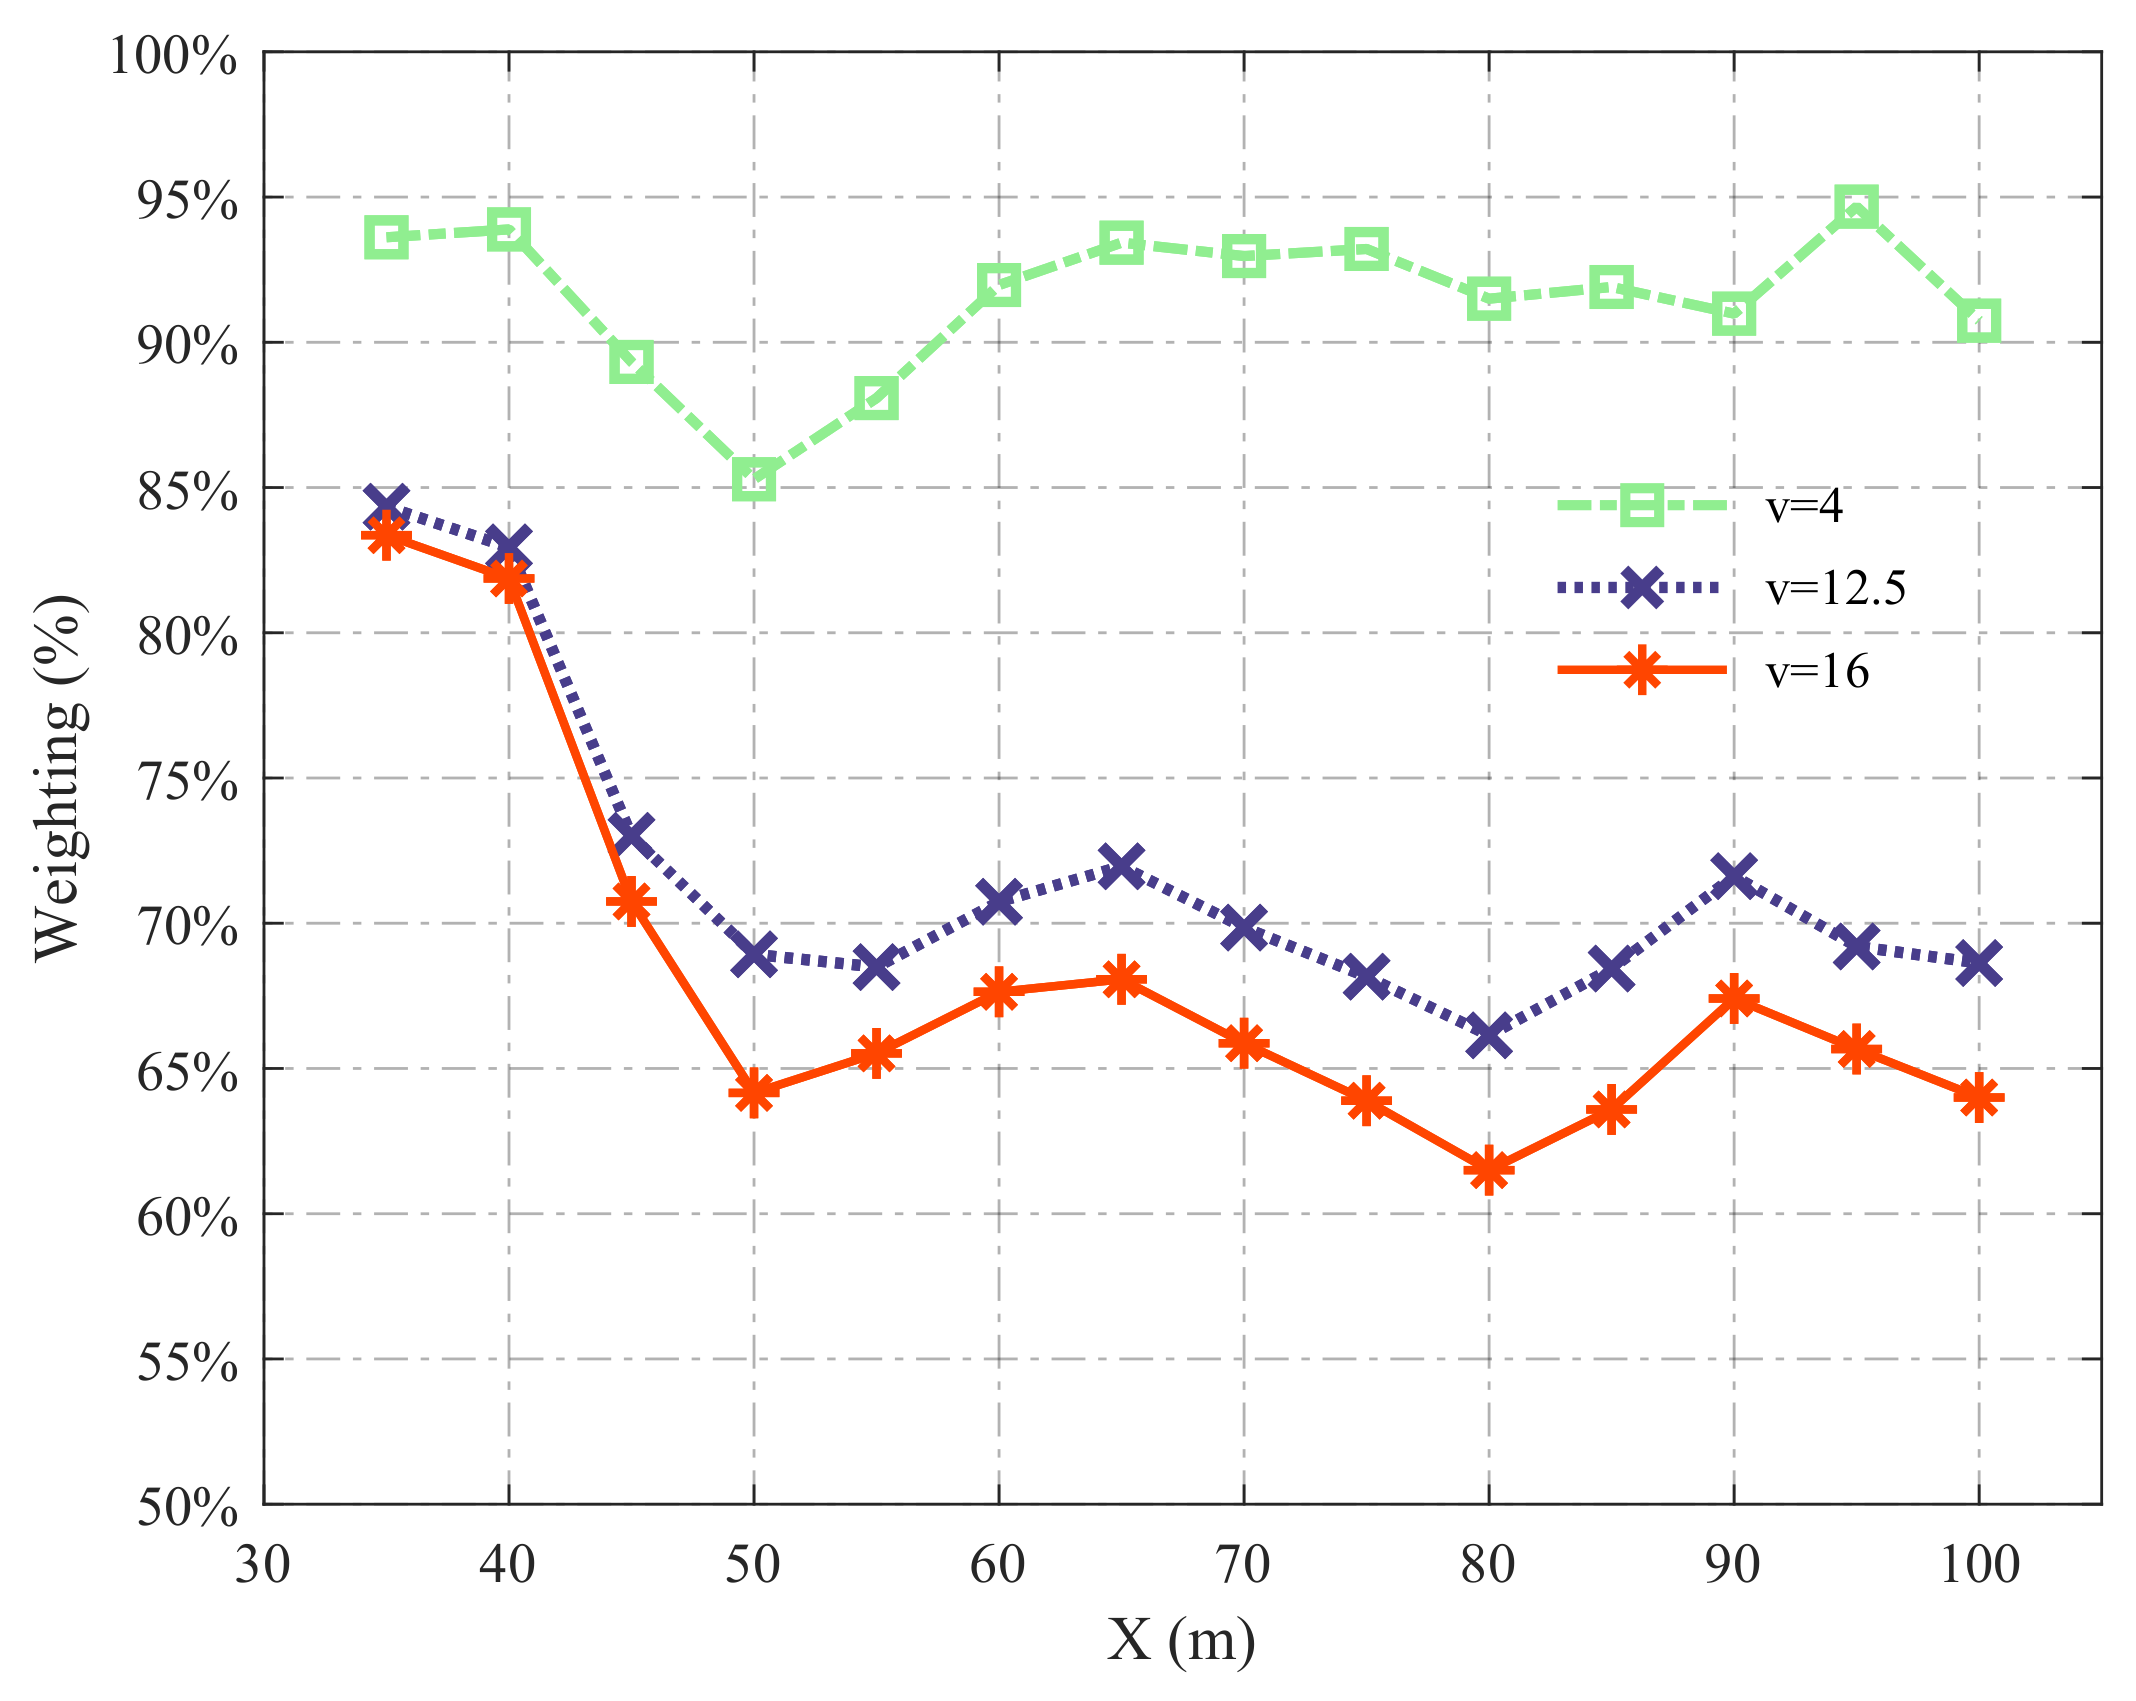
3.2. Studied Cases
4. Conclusions
Author Contributions
Funding
Conflicts of Interest
References
- Chalvatzaki, E.; Aleksandropoulou, V.; Glytsos, T.; Lazaridis, M. The effect of dust emissions from open storage piles to particle ambient concentration and human exposure. Waste Manag. 2012, 32, 2456–2468. [Google Scholar] [CrossRef] [PubMed]
- Bizjan, B.; Horvat, B.; Orbanic, A.; Novak, L.; Pranikar, J. Numerical Modeling of Dust Lifting from a Complex-Geometry Industrial Stockpile. J. Mech. Eng. 2015, 61, 621–631. [Google Scholar]
- Xuan, J.; Robins, A. The effects of turbulence and complex terrain on dust emissions and depositions from coal stockpiles. Atmos. Environ. 1994, 28, 1951–1960. [Google Scholar] [CrossRef]
- Diego, I.; Pelegry, A.; Torno, S.; Torao, J.; Menendez, M. Simultaneous CFD evaluation of wind flow and dust emission in open storage piles. Appl. Math. Model. 2009, 33, 3197–3207. [Google Scholar] [CrossRef]
- Zhao, Y.; Ambrose, R. Modeling dust dispersion and suspension pattern under turbulence. J. Loss Prev. Process Ind. 2019, 62, 103934. [Google Scholar] [CrossRef]
- Turpin, C.; Harion, J.L. Numerical modeling of flow structures over various flat-topped stockpiles height: Implications on dust emissions. Atmos. Environ. 2009, 43, 5579–5587. [Google Scholar] [CrossRef]
- Cong, X.C.; Yang, S.L.; Cao, S.Q.; Chen, Z.L.; Dai, M.X.; Peng, S.T. Effect of aggregate stockpile configuration and layout on dust emissions in an open yard. Appl. Math. Model. 2012, 36, 5482–5491. [Google Scholar] [CrossRef]
- Toraño, J.; Rodriguez, R.; Diego, I.; Rivas, J.; Pelegry, A. Influence of the pile shape on wind erosion CFD emission simulation. Appl. Math. Model. 2007, 31, 2487–2502. [Google Scholar] [CrossRef]
- Badr, T.; Harion, J.L. Effect of aggregate storage piles configuration on dust emissions. Atmos. Environ. 2007, 41, 360–368. [Google Scholar] [CrossRef]
- Krull, F. Influence of the surface roughness on the collision behavior of fine particles in ambient fluids. Powder Technol. 2021, 392, 58–68. [Google Scholar] [CrossRef]
- Mejia, J.F.; Gillies, J.A.; Etyemezian, V.; Glick, R. A very-high resolution (20 m) measurement-based dust emissions and dispersion modeling approach for the Oceano Dunes, California. Atmos. Environ. 2019, 218, 116977. [Google Scholar] [CrossRef]
- Qian, G.; Yang, Z.; Tian, M.; Dong, Z.; Liang, A.; Xing, X. From dome dune to barchan dune: Airflow structure changes measured with particle image velocimetry in a wind tunnel. Geomorphology 2021, 382, 107681. [Google Scholar] [CrossRef]
- Huang, C.H.; Lin, P.Y. Influence of spatial layout on airflow field and particle distribution on the workspace of a factory. Build. Environ. 2014, 71, 212–222. [Google Scholar] [CrossRef]
- Wei, H.; Ge, Y.; Li, M.; Li, Y.; Yu, Y. DEM study of the porosity distribution of pellet sandpile formed by ternary size particles. Powder Technol. 2019, 360, 1337–1347. [Google Scholar] [CrossRef]
- Yen, P.H.; Chen, W.H.; Yuan, C.S.; Tseng, Y.L.; Lee, J.S.; Wu, C.C. Exploratory investigation on the suppression efficiency of fugitive dust emitted from coal stockpile: Comparison of innovative atomizing and traditional spraying technologies. Process Saf. Environ. Prot. 2021, 154, 348–359. [Google Scholar] [CrossRef]
- Xu, G.; Chen, Y.; Eksteen, J.; Xu, J. Surfactant-aided coal dust suppression: A review of evaluation methods and influencing factors. Sci. Total Environ. 2018, 639, 1060–1076. [Google Scholar] [CrossRef]
- Guo, L.; Nie, W.; Yin, S.; Liu, Q.; Hua, Y.; Cheng, L.; Cai, X.; Xiu, Z.; Du, T. The dust diffusion modeling and determination of optimal airflow rate for removing the dust generated during mine tunneling. Build. Environ. 2020, 178, 106846. [Google Scholar] [CrossRef]
- Hou, Q.F. DEM study of particles flow on an industrial-scale roller screen. Adv. Powder Technol. 2020, 31, 4445–4456. [Google Scholar]
- Schulz, D.; Schwindt, N.; Schmidt, E.; Kruggel-Emden, H. Modelling of dust emissions induced by flow over stockpiles and through packed beds. Particuology 2020, 59, 55–63. [Google Scholar] [CrossRef]
- Stone, L.; Hastie, D.; Zigan, S. Using a coupled CFD – DPM approach to predict particle settling in a horizontal air stream. Adv. Powder Technol. 2019, 30, 869–878. [Google Scholar] [CrossRef]
- Pfa, B.; Jz, B.; Ql, B.; Tc, B.; Fz, B.; Yh, C.; Liang, M.A.; Gx, A.; Hwa, B. DPM simulation of particle revolution and high-speed self-rotation in different pre-self-rotation cyclones. Powder Technol. 2021, 394, 290–299. [Google Scholar]
- Gaillard, S.; Sarver, E.; Cauda, E. A field study on the possible attachment of DPM and respirable dust in mining environments. J. Sustain. Min. 2019, 18, 100–108. [Google Scholar] [CrossRef] [PubMed]
- Wang, K. Effect of Windbreak on the Diffusion Law of Dust in Open-Yard Stockpile in Local Area. Ph.D. Thesis, Qingdao University of Science & Technology, Qingdao, China, 2019. [Google Scholar]
- Islam, M.S.; Gu, Y.; Farkas, A.; Paul, G.; Saha, S.C. Helium-Oxygen Mixture Model for Particle Transport in CT-Based Upper Airways. Int. J. Environ. Res. Public Health 2020, 17, 3574. [Google Scholar] [CrossRef]
- Moskal, A.; Sosnowski, T.R. Dynamics of aerosol pulse in a simplified mouth-throat geometry and its significance for inhalation drug delivery. Inz. Chem. I Proces. 2009, 30, 545–558. [Google Scholar]
- Morsi, S.A.; Alexander, A.J. An investigation of particle trajectories in two-phase flow systems. J. Fluid Mech. 1972, 55, 193–208. [Google Scholar] [CrossRef]
- Luo, Q.; Huang, L.; Xue, X.; Chen, Z.; Hua, J. Occupational health risk assessment based on dust exposure during earthwork construction. J. Build. Eng. 2021, 44, 103186. [Google Scholar] [CrossRef]
- Huang, Y.H.; Gang, T.; Qin, J.P.; Gang, L.; Yan, B.L. Characteristics of Fugitive Dust Pollution in Different Construction Phases. Huan Jing Ke Xue 2008, 28, 2885–2888. [Google Scholar]
- Rice, G.; Swartout, J.; Mahaffey, K.; Schoeny, R. Derivation of U.S. EPA’s oral Reference Dose (RfD) for methylmercury. Drug Chem. Toxicol. 2000, 23, 41. [Google Scholar] [CrossRef]
- Epa, U.S. Guidelines for Exposure Assessment. Fed. Regist. 1992, 57, 46304–46312. [Google Scholar]
- Wang, F.M.; Chen, L.; Jiao, J.; Zhang, L.B.; Sun, Z.R. Pollution characteristics of phthalate esters derived from household dust and exposure assessment. Zhongguo Huanjing Kexue/China Environ. Sci. 2012, 32, 780–786. [Google Scholar]
- Zhou, G.; Zhang, Q.; Bai, R.; Fan, T.; Wang, G. The diffusion behavior law of respirable dust at fully mechanized caving face in coal mine: CFD numerical simulation and engineering application. Process Saf. Environ. Prot. 2017, 106, 117–128. [Google Scholar] [CrossRef]


| Bulk Particle Properties (DPM) | |
|---|---|
| Material | |
| Density | |
| Particle diameter | |
| Inject source | Surface-injection |
| Gas Phase Properties (CFD) | |
| Material | Air |
| Density | |
| Turbulence models | Shear-stress transport (SST) model |
Publisher’s Note: MDPI stays neutral with regard to jurisdictional claims in published maps and institutional affiliations. |
© 2022 by the authors. Licensee MDPI, Basel, Switzerland. This article is an open access article distributed under the terms and conditions of the Creative Commons Attribution (CC BY) license (https://creativecommons.org/licenses/by/4.0/).
Share and Cite
Ma, W.; Du, W.; Guo, J.; Wu, S.; Li, L.; Zeng, Z. Dust Dispersion Characteristics of Open Stockpiles and the Scale of Dust Suppression Shed. Appl. Sci. 2022, 12, 11568. https://doi.org/10.3390/app122211568
Ma W, Du W, Guo J, Wu S, Li L, Zeng Z. Dust Dispersion Characteristics of Open Stockpiles and the Scale of Dust Suppression Shed. Applied Sciences. 2022; 12(22):11568. https://doi.org/10.3390/app122211568
Chicago/Turabian StyleMa, Weiwu, Weiqiang Du, Jiaxin Guo, Shuyuan Wu, Liqing Li, and Zheng Zeng. 2022. "Dust Dispersion Characteristics of Open Stockpiles and the Scale of Dust Suppression Shed" Applied Sciences 12, no. 22: 11568. https://doi.org/10.3390/app122211568