Author Contributions
Conceptualization, Y.Y. and S.R.; methodology, Y.Y.; software, S.R.; validation, T.C., Y.Y. and S.R.; formal analysis, J.L.; investigation, J.C.; resources, C.S.; data curation, S.Y.; writing—original draft preparation, J.L.; writing—review and editing, S.R.; visualization, S.Y.; supervision, J.C.; project administration, Y.Y.; funding acquisition, T.C. All authors have read and agreed to the published version of the manuscript.
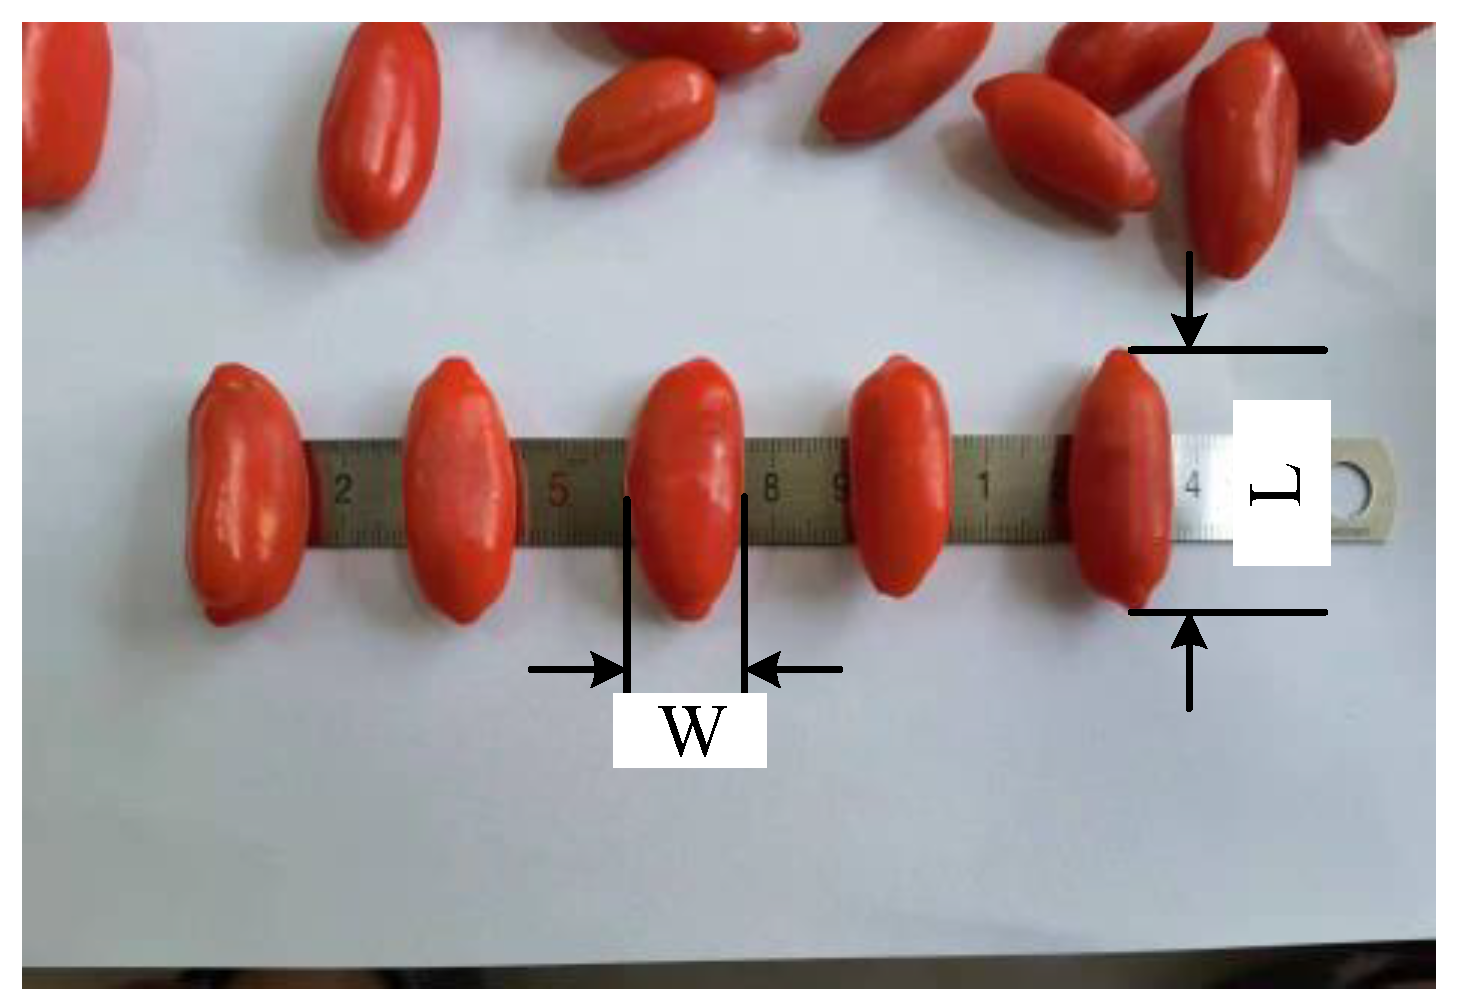
Figure 1.
The shape of fresh goji berries.
Figure 1.
The shape of fresh goji berries.
Figure 2.
Compression experiment of fresh goji berry.
Figure 2.
Compression experiment of fresh goji berry.
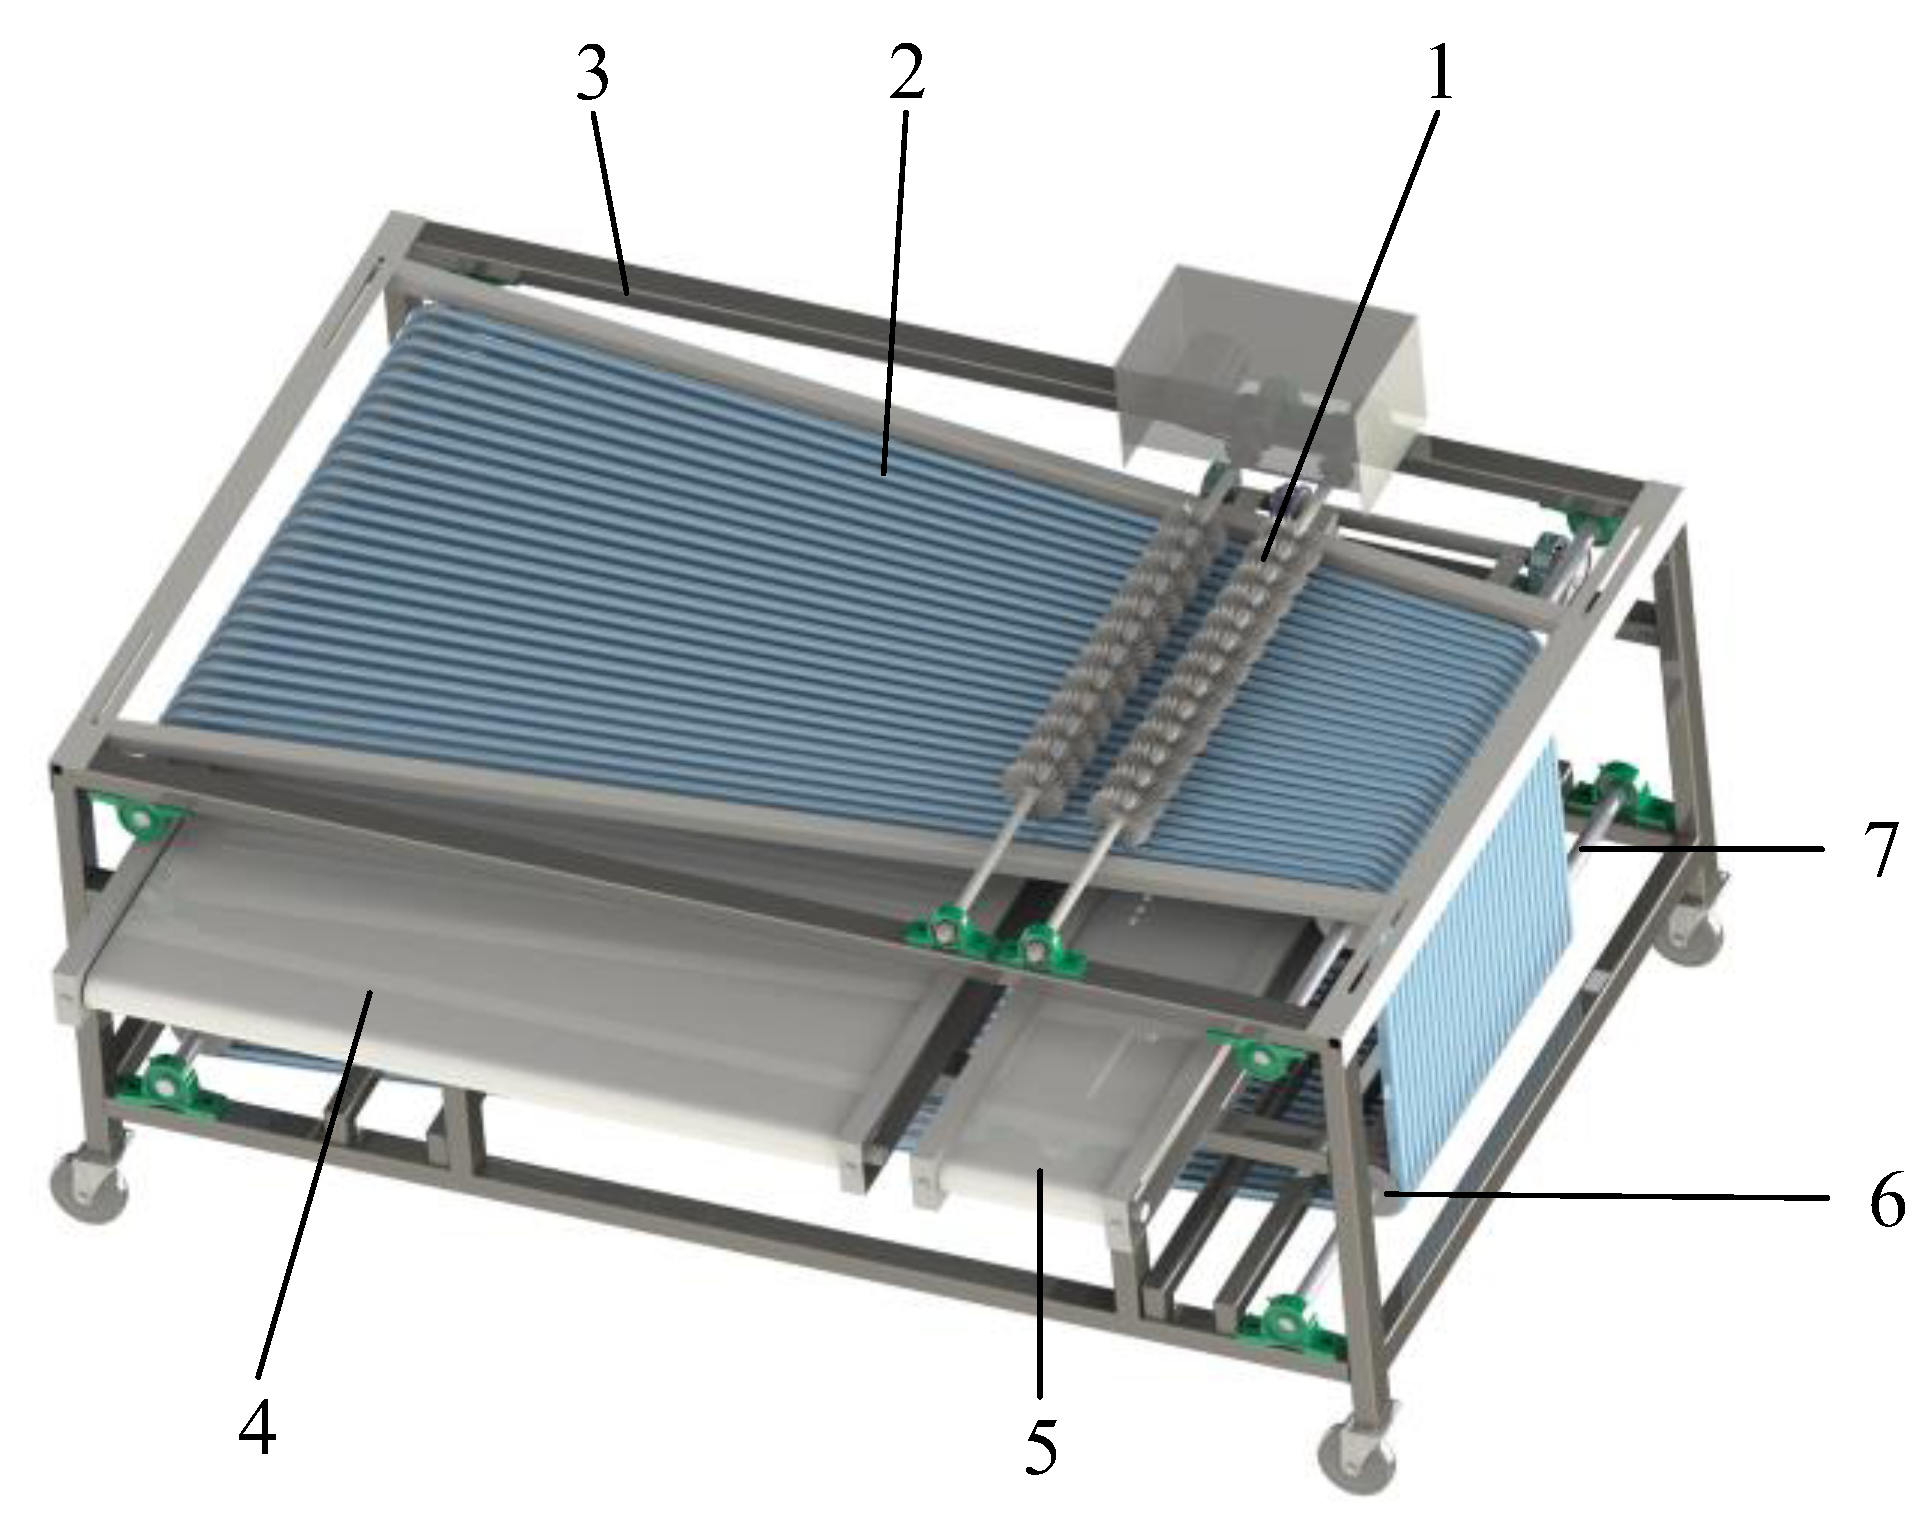
Figure 3.
Structure of variable gap-type fresh goji berry grading machine. 1. Directional brush. 2. Belt. 3. Frame. 4. Belt conveyor for large fruit discharge. 5. Belt conveyor for small fruit discharge. 6. Belt pulley. 7. Drive shaft.
Figure 3.
Structure of variable gap-type fresh goji berry grading machine. 1. Directional brush. 2. Belt. 3. Frame. 4. Belt conveyor for large fruit discharge. 5. Belt conveyor for small fruit discharge. 6. Belt pulley. 7. Drive shaft.
Figure 4.
The shape of grading belt. (a) Assembly of grading belt and guide groove; (b) Cross-sectional shape of belt; (c) A grading belt in kind. 1. Grading belt. 2. Pulley. 3. Support clip. 4. Belt guide groove.
Figure 4.
The shape of grading belt. (a) Assembly of grading belt and guide groove; (b) Cross-sectional shape of belt; (c) A grading belt in kind. 1. Grading belt. 2. Pulley. 3. Support clip. 4. Belt guide groove.
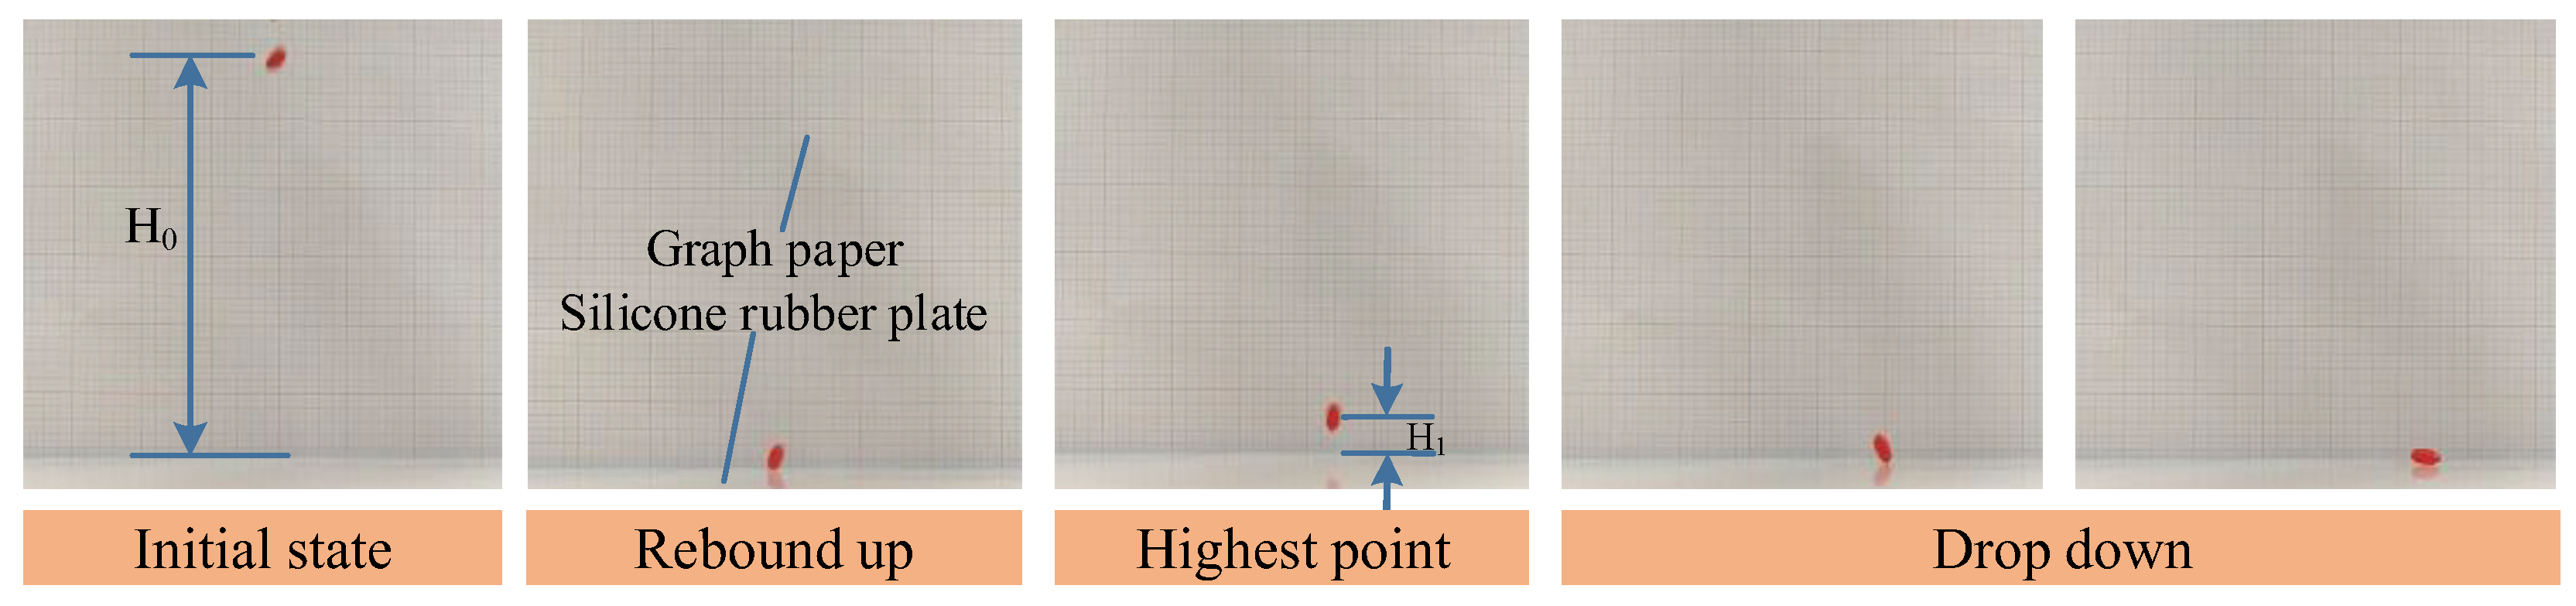
Figure 5.
Physical experiment for calibrating the collision restitution coefficient of fresh goji berry–silicone rubber material.
Figure 5.
Physical experiment for calibrating the collision restitution coefficient of fresh goji berry–silicone rubber material.
Figure 6.
Physical experiment for calibrating the collision restitution coefficient of fresh goji berry–fresh goji berry.
Figure 6.
Physical experiment for calibrating the collision restitution coefficient of fresh goji berry–fresh goji berry.
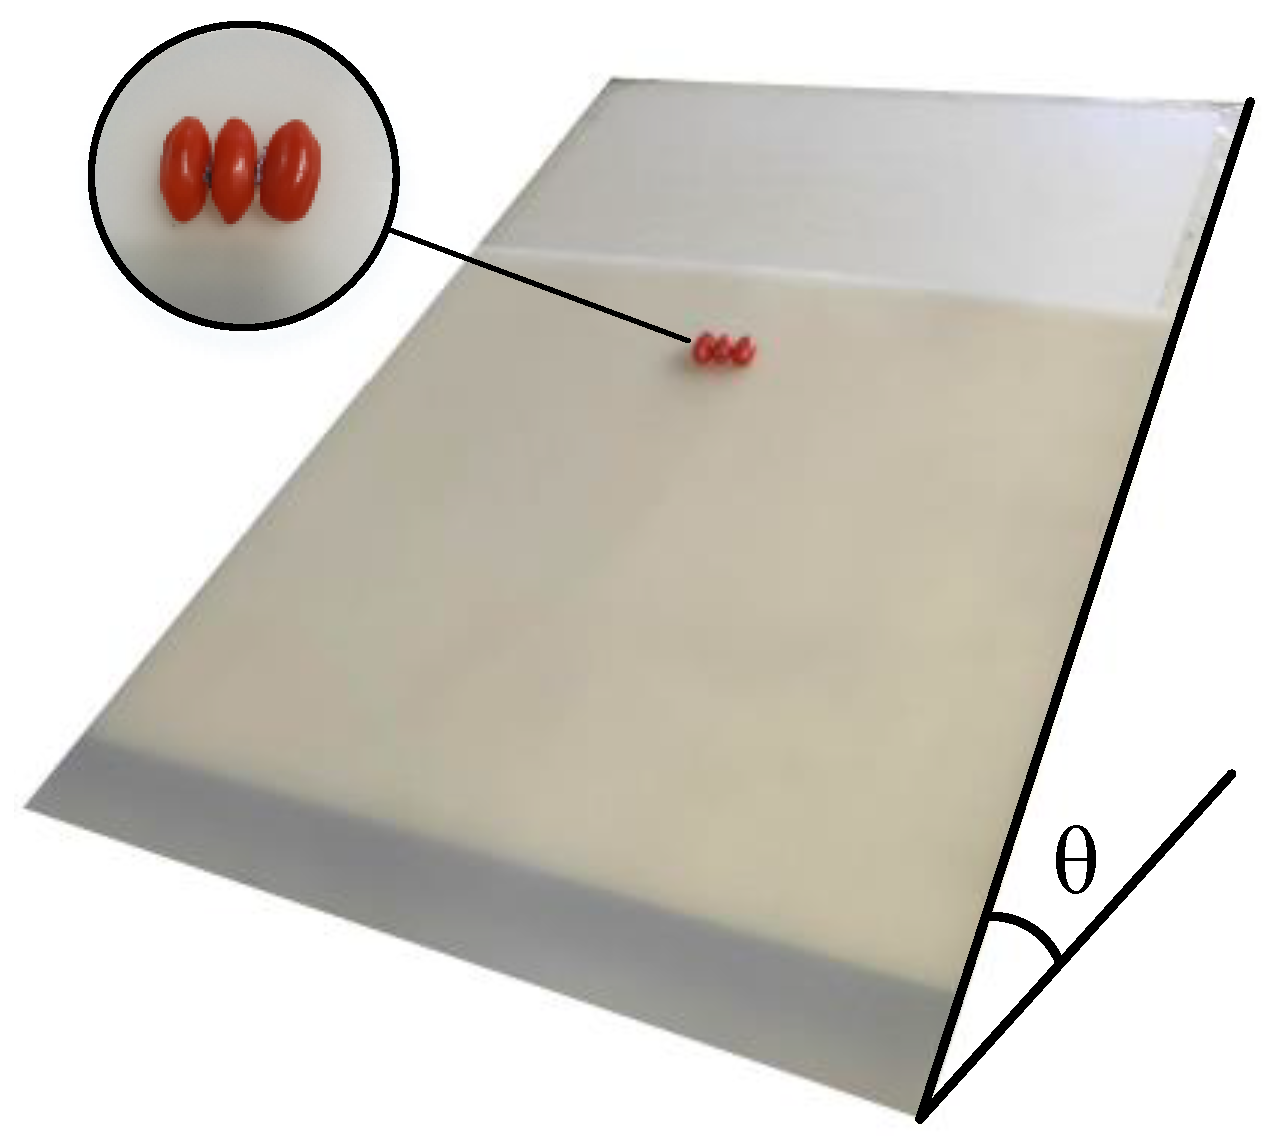
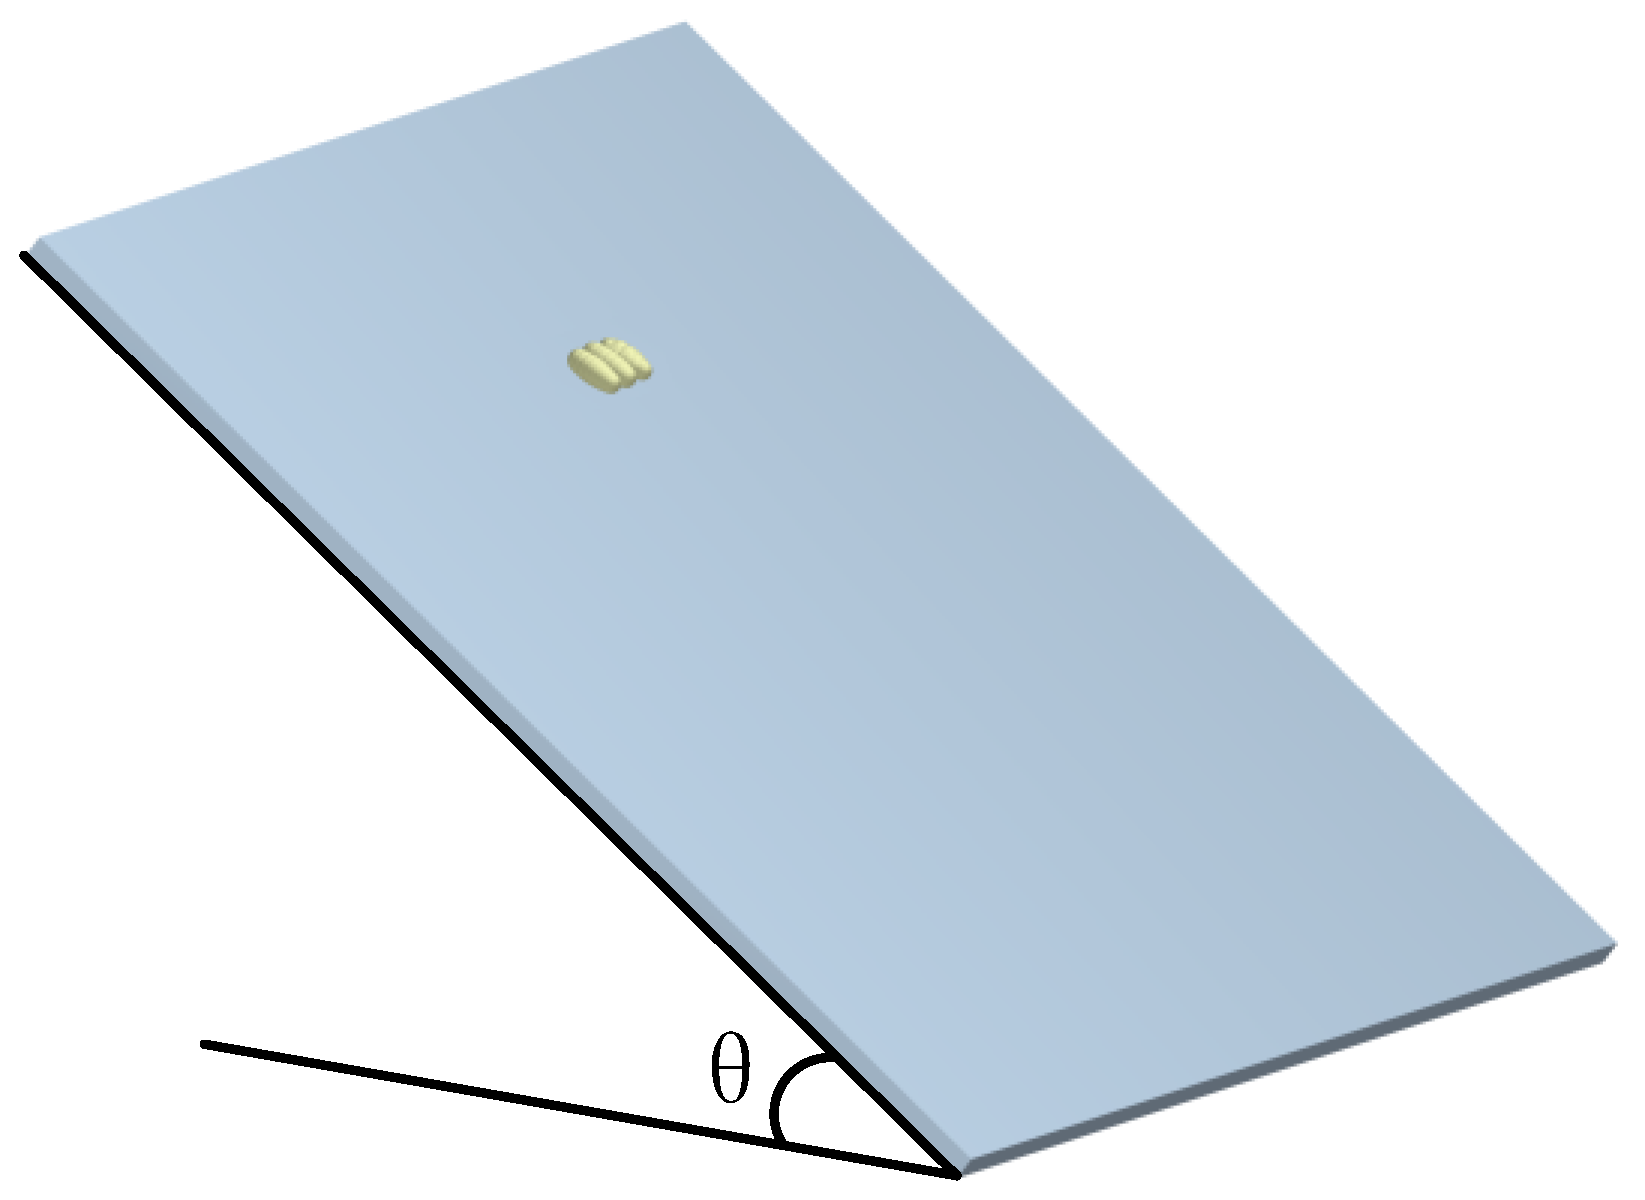
Figure 7.
Physical experiment for calibrating the static friction coefficient of fresh goji berry–silicone rubber material.
Figure 7.
Physical experiment for calibrating the static friction coefficient of fresh goji berry–silicone rubber material.
Figure 8.
Physical experiment for calibrating the rolling friction coefficient of fresh goji berry–silicone rubber material.
Figure 8.
Physical experiment for calibrating the rolling friction coefficient of fresh goji berry–silicone rubber material.
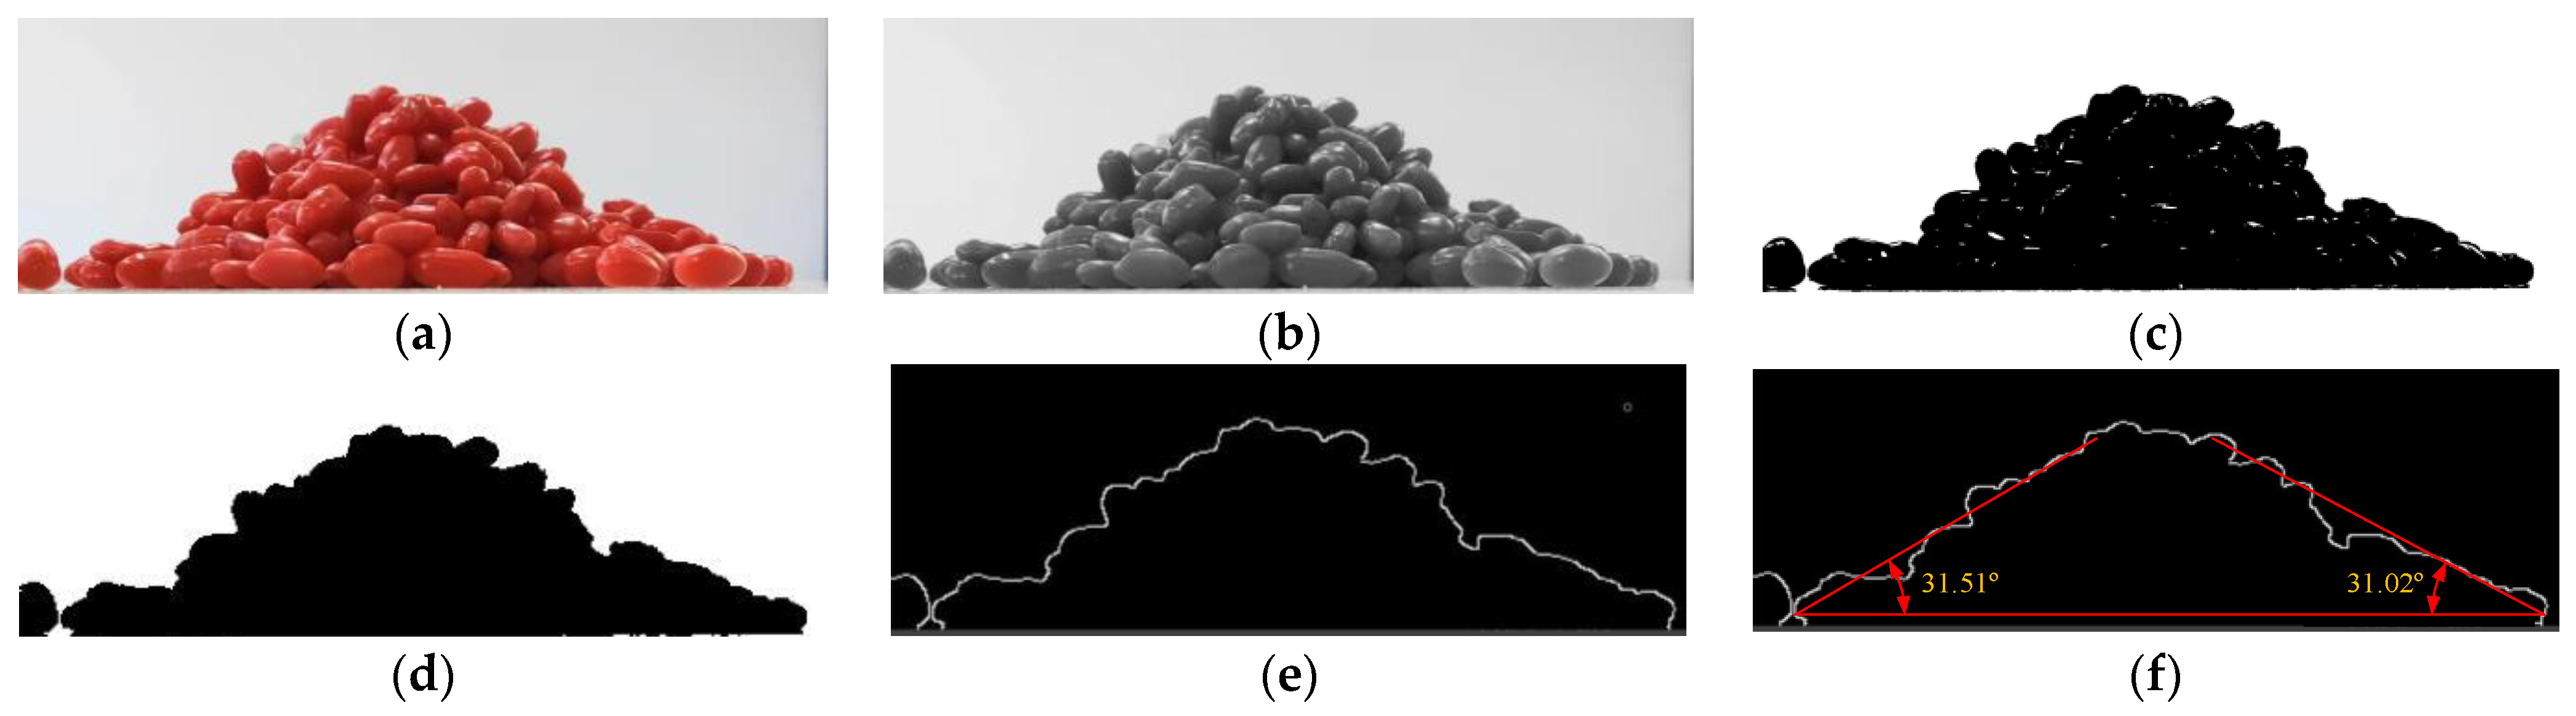
Figure 9.
The analysis process of the value of AoR. (a) Original image; (b) Grayscale processing; (c) Binarization processing; (d) Hole filling processing; (e) Boundary extraction; (f) Least-squares fitting.
Figure 9.
The analysis process of the value of AoR. (a) Original image; (b) Grayscale processing; (c) Binarization processing; (d) Hole filling processing; (e) Boundary extraction; (f) Least-squares fitting.
Figure 10.
The process of inverse acquisition of a 3D model of fresh goji berry.
Figure 10.
The process of inverse acquisition of a 3D model of fresh goji berry.
Figure 11.
Simulation experiment for calibrating the collision restitution coefficient of fresh goji berry–silicone rubber material.
Figure 11.
Simulation experiment for calibrating the collision restitution coefficient of fresh goji berry–silicone rubber material.
Figure 12.
Simulation experiment for calibrating the collision restitution coefficient of fresh goji berry–fresh goji berry.
Figure 12.
Simulation experiment for calibrating the collision restitution coefficient of fresh goji berry–fresh goji berry.
Figure 13.
Simulation experiment for calibrating the static friction coefficient of fresh goji berry–silicone rubber material.
Figure 13.
Simulation experiment for calibrating the static friction coefficient of fresh goji berry–silicone rubber material.
Figure 14.
Simulation experiment for calibrating the rolling friction coefficient of fresh goji berry–silicone rubber material.
Figure 14.
Simulation experiment for calibrating the rolling friction coefficient of fresh goji berry–silicone rubber material.
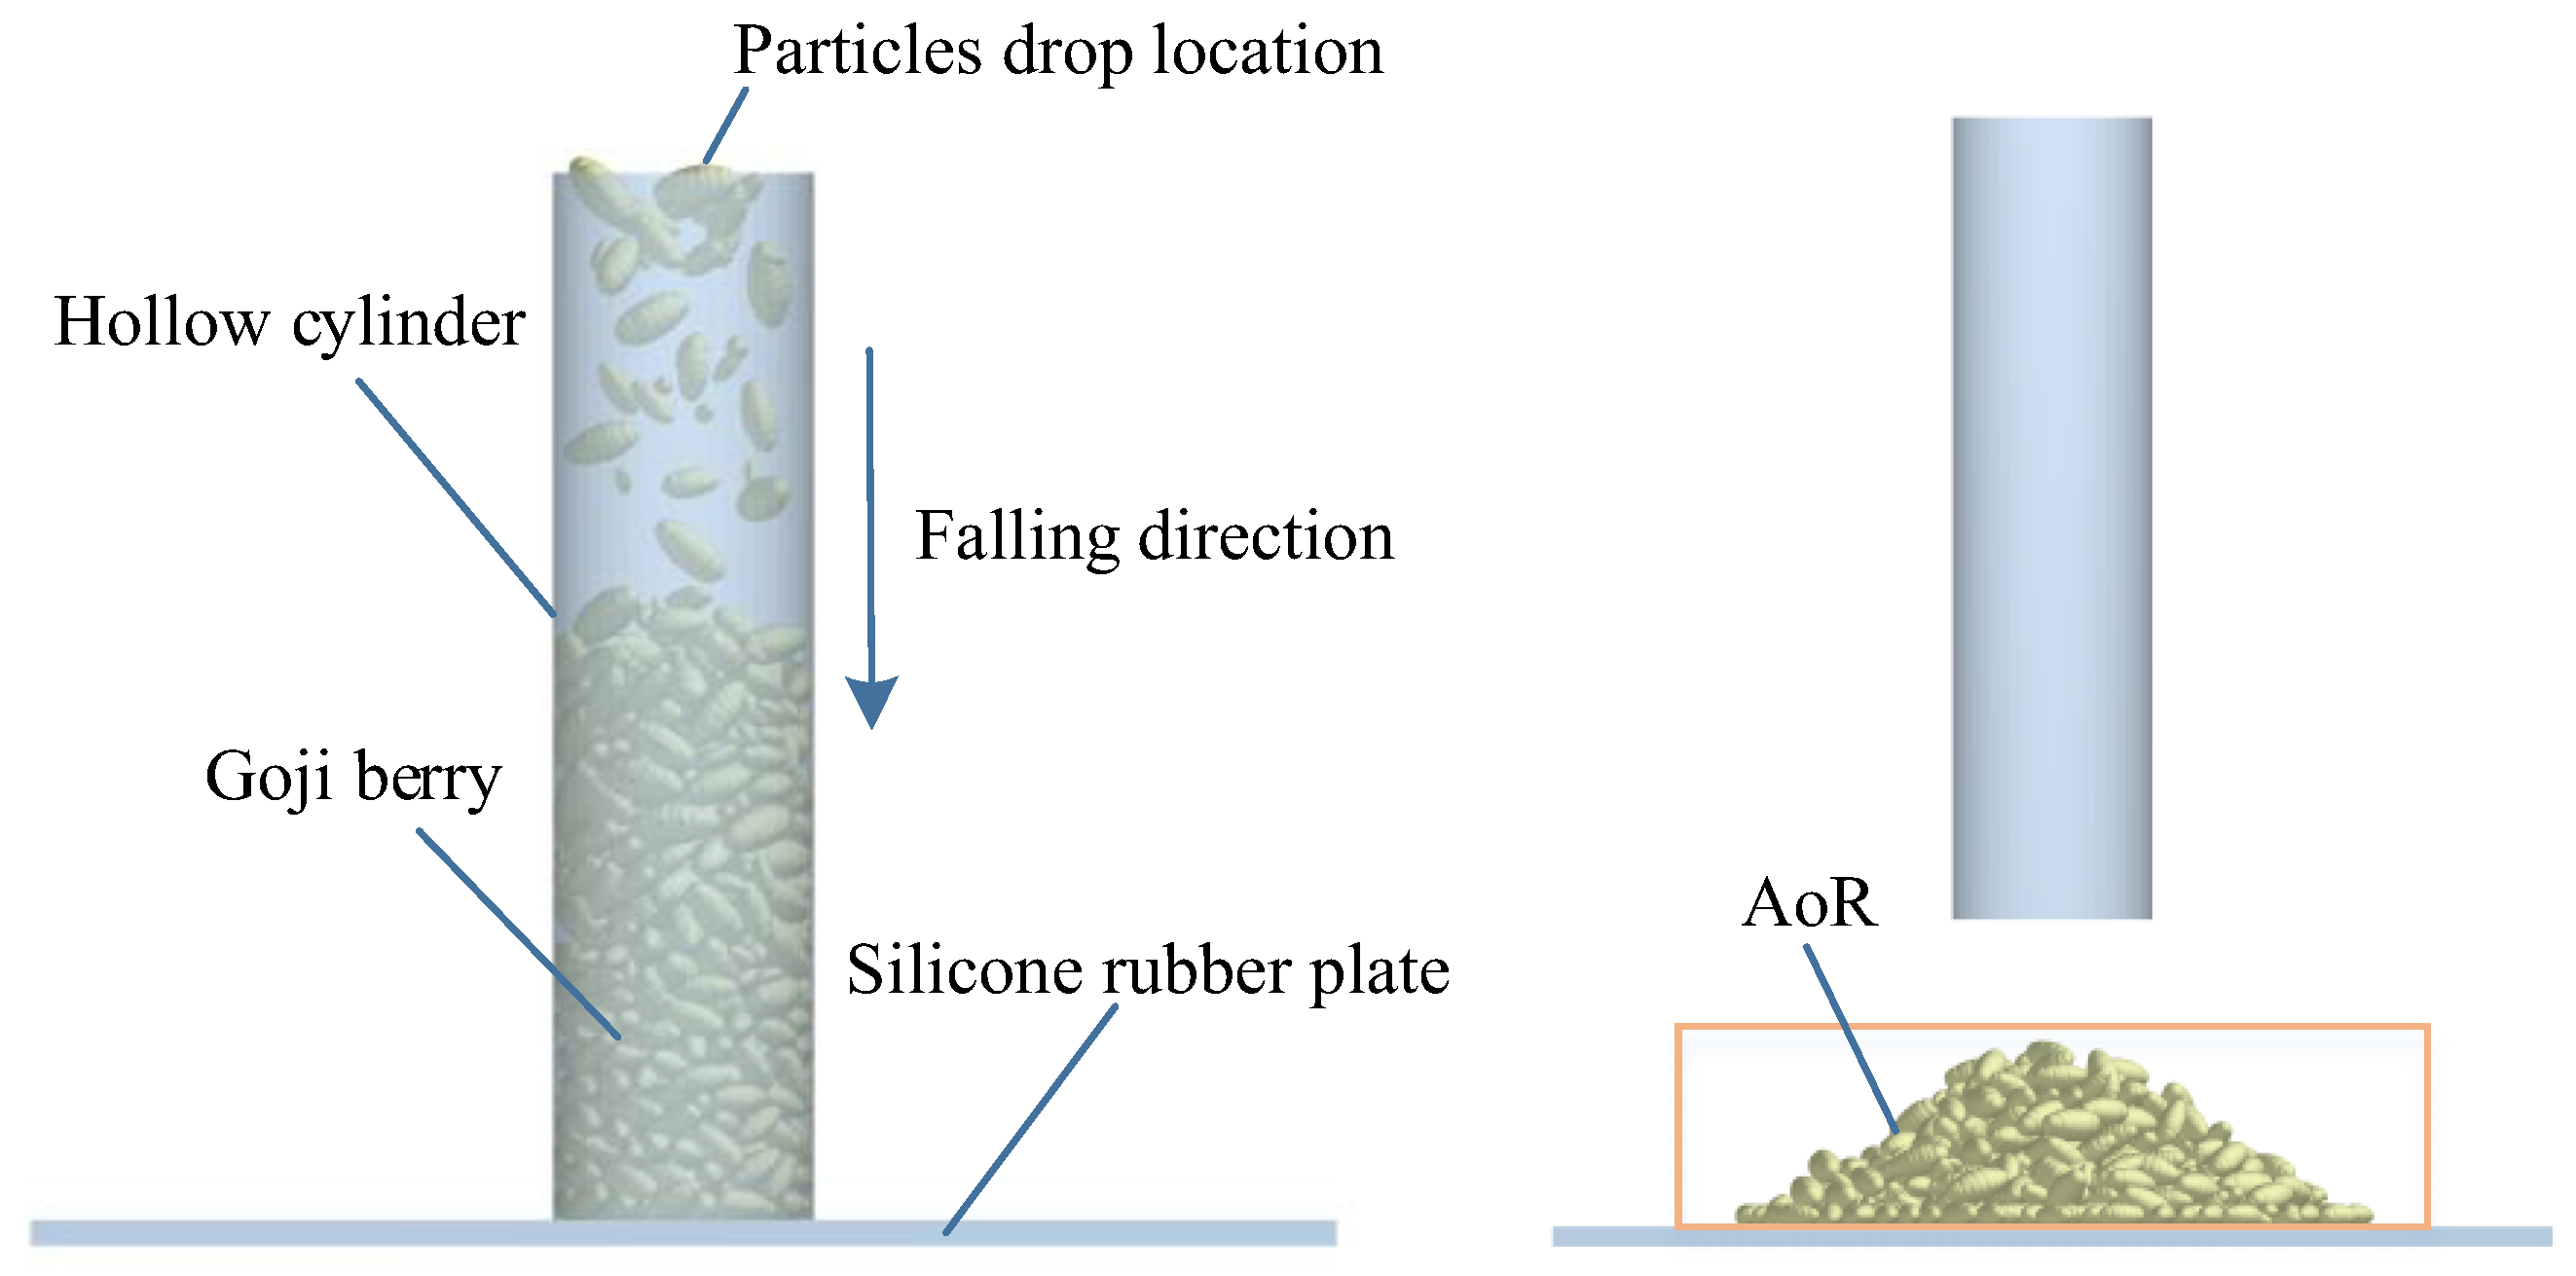
Figure 15.
Simulation experiment for calibrating the AoR.
Figure 15.
Simulation experiment for calibrating the AoR.
Figure 16.
Geometric model of the grading machine. 1. Grading belt. 2. Directional brush. 3. Slipway. 4. Particles factory. 5. Infeed conveyor belt. 6. Discharge conveyor belt. 7. Five mass sensors.
Figure 16.
Geometric model of the grading machine. 1. Grading belt. 2. Directional brush. 3. Slipway. 4. Particles factory. 5. Infeed conveyor belt. 6. Discharge conveyor belt. 7. Five mass sensors.
Figure 17.
Experimental equipment for field tests. (a) The experiment target is mature fresh goji berries of Ningqi No.5; (b) A variable gap-type fresh goji berry grading machine.
Figure 17.
Experimental equipment for field tests. (a) The experiment target is mature fresh goji berries of Ningqi No.5; (b) A variable gap-type fresh goji berry grading machine.
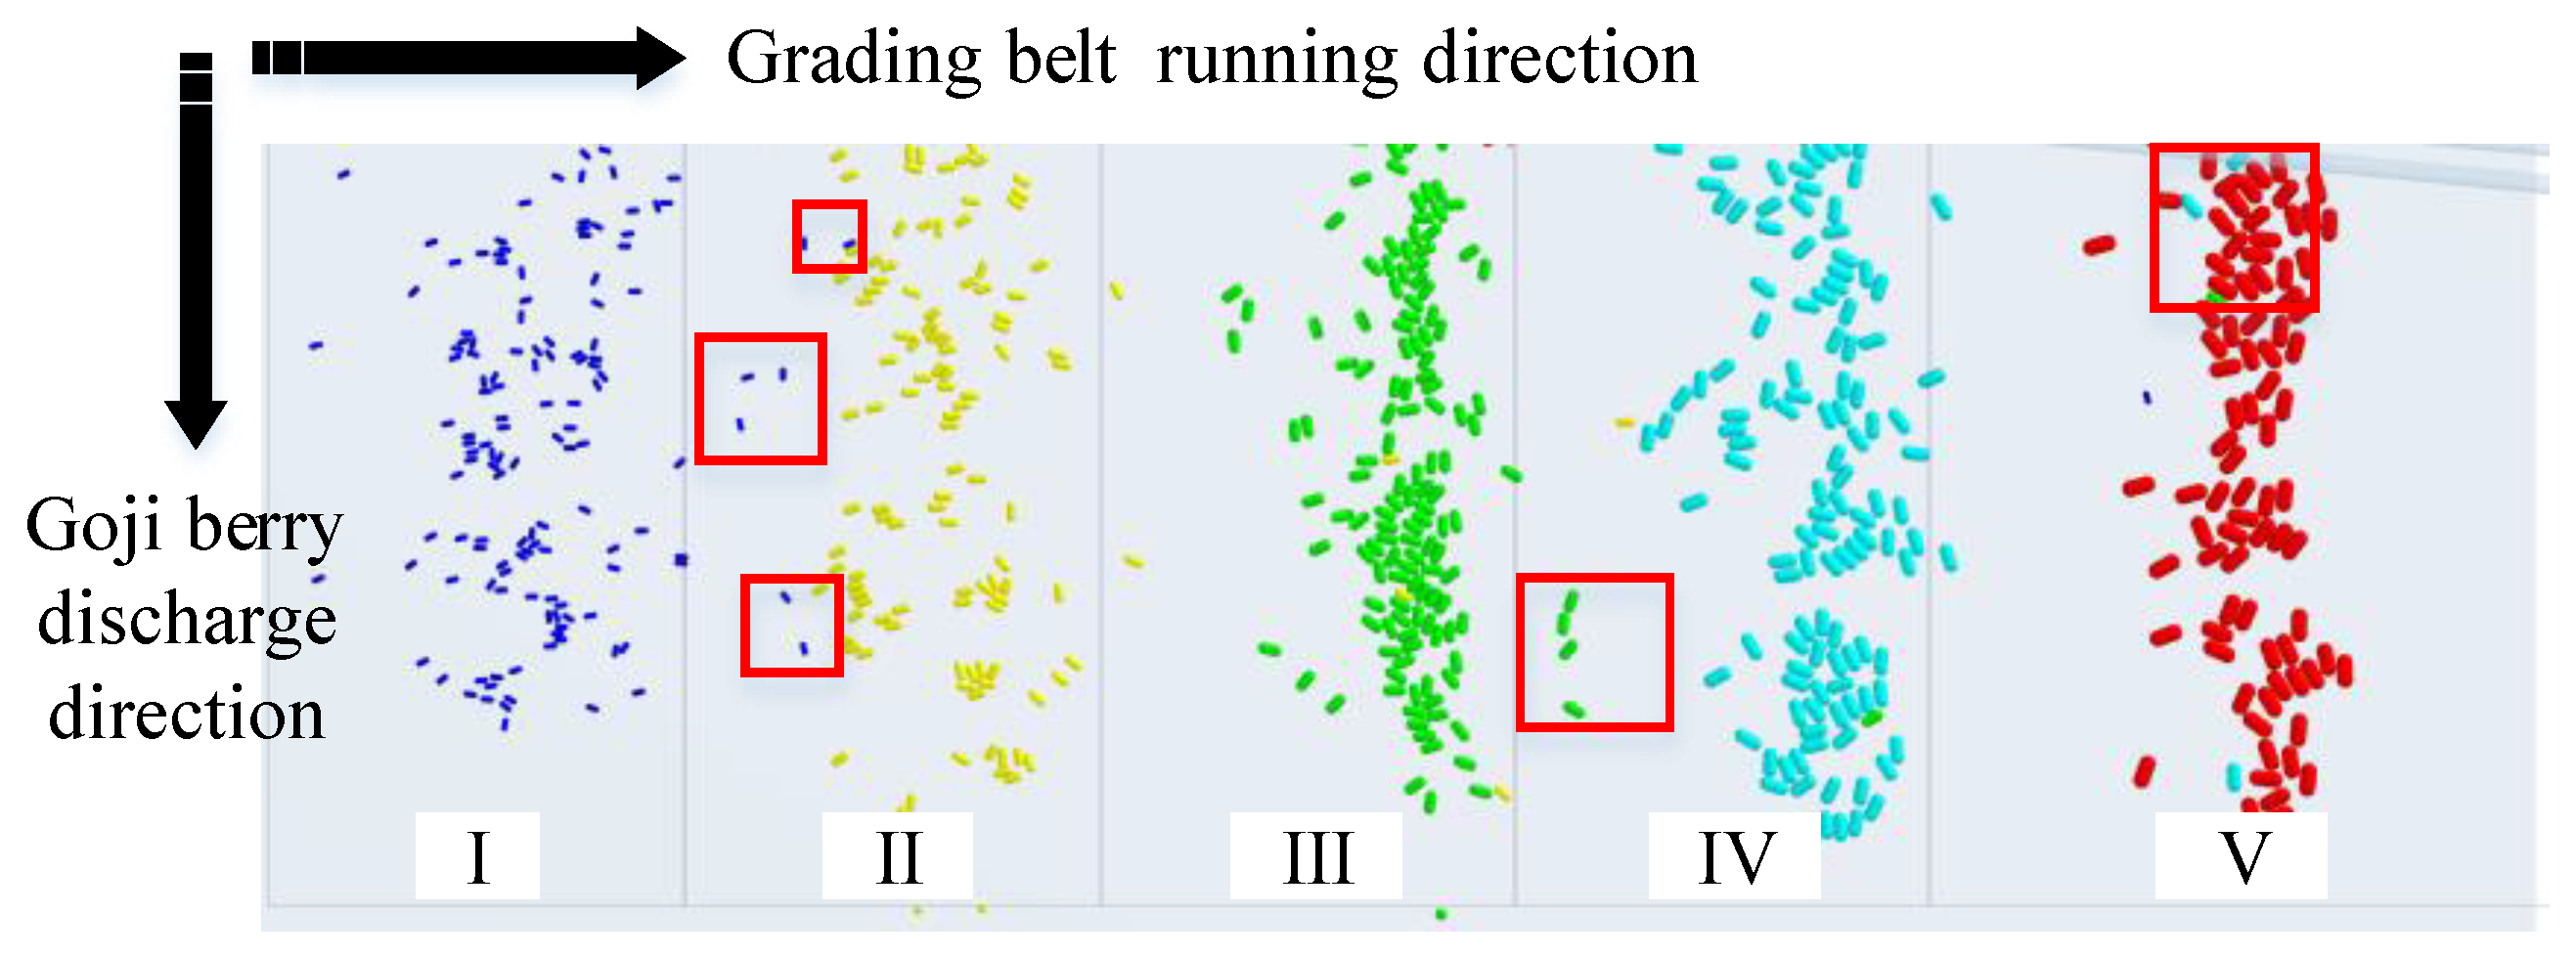
Figure 18.
Evaluation index of grading accuracy. The five colored particles represent five different granularities of fresh goji berries, and the red boxes show the goji berries mixed with other granularities.
Figure 18.
Evaluation index of grading accuracy. The five colored particles represent five different granularities of fresh goji berries, and the red boxes show the goji berries mixed with other granularities.
Figure 19.
Results of the simulation tests. (a) Second-order polynomial fitting curve of the collision restitution coefficient of fresh goji berry–silicone rubber material; (b) Height–time curve of the particle motion.
Figure 19.
Results of the simulation tests. (a) Second-order polynomial fitting curve of the collision restitution coefficient of fresh goji berry–silicone rubber material; (b) Height–time curve of the particle motion.
Figure 20.
Results of the simulation tests. (a) Second-order polynomial fitting curve of the collision restitution coefficient of fresh goji berry–fresh goji berry; (b) Height–time curve of the motion of the two particles.
Figure 20.
Results of the simulation tests. (a) Second-order polynomial fitting curve of the collision restitution coefficient of fresh goji berry–fresh goji berry; (b) Height–time curve of the motion of the two particles.
Figure 21.
Results of the simulation tests. (a) Second-order polynomial fitting curve of the static friction coefficient of fresh goji berry–silicone rubber material; (b) Velocity–time curve of the particle motion.
Figure 21.
Results of the simulation tests. (a) Second-order polynomial fitting curve of the static friction coefficient of fresh goji berry–silicone rubber material; (b) Velocity–time curve of the particle motion.
Figure 22.
Results of the simulation tests. (a) Second-order polynomial fitting curve of the rolling friction coefficient of fresh goji berry–silicone rubber material; (b) Rolling distance–time curve of the particle motion.
Figure 22.
Results of the simulation tests. (a) Second-order polynomial fitting curve of the rolling friction coefficient of fresh goji berry–silicone rubber material; (b) Rolling distance–time curve of the particle motion.
Figure 23.
Simulation of grading process.
Figure 23.
Simulation of grading process.
Figure 24.
Result of field test.
Figure 24.
Result of field test.
Table 1.
Material properties of silicone rubber material.
Table 1.
Material properties of silicone rubber material.
| Material Properties | Values |
|---|
| Shore A hardness/HA | 55 |
| Elongation/% | 200~600 |
| Tensile strength/Pa | 5 × 10⁶~10 × 106 |
| Density/kg·m−3 | 1150 |
| Poisson’s ratio | 0.480 |
| Elastic modulus/Pa | 1.30 × 10⁶ |
Table 2.
Design scheme and results of free-fall experiment.
Table 2.
Design scheme and results of free-fall experiment.
| Group No. | Ex1 | H1/mm |
|---|
| 1 | 0.1 | 2.214 |
| 2 | 0.2 | 14.220 |
| 3 | 0.3 | 30.659 |
| 4 | 0.4 | 43.573 |
| 5 | 0.5 | 74.025 |
| 6 | 0.6 | 110.760 |
| 7 | 0.7 | 151.756 |
| 8 | 0.8 | 198.919 |
| 9 | 0.9 | 256.737 |
Table 3.
Design scheme and results of suspension collision experiment.
Table 3.
Design scheme and results of suspension collision experiment.
| Group No. | Ex2 | Ha/mm | Hb/mm |
|---|
| 1 | 0.1 | 11.488 | 16.523 |
| 2 | 0.2 | 8.066 | 20.650 |
| 3 | 0.3 | 7.417 | 25.301 |
| 4 | 0.4 | 6.003 | 33.752 |
| 5 | 0.5 | 5.223 | 39.096 |
| 6 | 0.6 | 4.143 | 44.803 |
| 7 | 0.7 | 3.575 | 52.447 |
| 8 | 0.8 | 1.947 | 55.170 |
| 9 | 0.9 | 0.530 | 60.933 |
Table 4.
Design scheme and results of static friction coefficient experiment.
Table 4.
Design scheme and results of static friction coefficient experiment.
| Group No. | μs1 | θ/° |
|---|
| 1 | 0.1 | 5.696 |
| 2 | 0.2 | 14.745 |
| 3 | 0.3 | 19.388 |
| 4 | 0.4 | 22.130 |
| 5 | 0.5 | 27.012 |
| 6 | 0.6 | 31.447 |
| 7 | 0.7 | 35.240 |
| 8 | 0.8 | 39.457 |
| 9 | 0.9 | 43.503 |
Table 5.
Design scheme and results of rolling friction coefficient experiment.
Table 5.
Design scheme and results of rolling friction coefficient experiment.
| Group No. | μr1 | Y/mm |
|---|
| 1 | 0.01 | 1396.870 |
| 2 | 0.02 | 1031.026 |
| 3 | 0.03 | 813.731 |
| 4 | 0.04 | 670.109 |
| 5 | 0.05 | 403.698 |
| 6 | 0.06 | 238.752 |
| 7 | 0.07 | 163.066 |
| 8 | 0.08 | 104.283 |
| 9 | 0.09 | 59.407 |
Table 6.
Design scheme and results of central composite design experiment. (μs2 is the static friction coefficient of fresh goji berry–fresh goji berry, and μr2 is the rolling friction coefficient of fresh goji berry–fresh goji berry.)
Table 6.
Design scheme and results of central composite design experiment. (μs2 is the static friction coefficient of fresh goji berry–fresh goji berry, and μr2 is the rolling friction coefficient of fresh goji berry–fresh goji berry.)
| Group No. | μs2 | μr2 | ε/% |
|---|
| 1 | 0.5 | 0.0279289 | 7.04 |
| 2 | 0.5 | 0.035 | 2.33 |
| 3 | 0.5 | 0.035 | 2.50 |
| 4 | 0.570711 | 0.035 | 5.81 |
| 5 | 0.5 | 0.035 | 1.98 |
| 6 | 0.5 | 0.035 | 2.07 |
| 7 | 0.45 | 0.04 | 0.62 |
| 8 | 0.429289 | 0.035 | 0.95 |
| 9 | 0.5 | 0.0420711 | 1.77 |
| 10 | 0.55 | 0.04 | 4.82 |
| 11 | 0.5 | 0.035 | 2.29 |
| 12 | 0.55 | 0.03 | 6.92 |
| 13 | 0.45 | 0.03 | 3.71 |
Table 7.
All discrete element simulation parameters of the model.
Table 7.
All discrete element simulation parameters of the model.
| Material Properties | Fresh Goji Berry | Silicone Rubber Material |
|---|
| Poisson’s ratio | 0.420 | 0.480 |
| Elastic modulus/Pa | 2.217 × 10⁶ | 1.30 × 10⁶ |
| Density/kg·m−3 | 689.550 | 1150 |
| Contact Parameters | Fresh Goji Berry–
Fresh Goji Berry | Fresh Goji Berry–
Silicone Rubber Material |
| Collision restitution coefficient | 0.158 | 0.195 |
| Static friction coefficient | 0.454 | 0.377 |
| Rolling friction coefficient | 0.037 | 0.063 |
Table 8.
Analysis of variance for regression model.
Table 8.
Analysis of variance for regression model.
| Error Source | Sum of Squares | Freedom | Mean Square | F-Value | p-Value |
|---|
| Model | 55.89 | 5 | 11.18 | 88.72 | <0.0001 ** |
| A-A | 25.50 | 1 | 25.50 | 202.41 | <0.0001 ** |
| B-B | 19.98 | 1 | 19.98 | 158.59 | <0.0001 ** |
| AB | 0.2450 | 1 | 0.2450 | 1.94 | 0.2058 |
| A2 | 2.54 | 1 | 2.54 | 20.16 | 0.0028 ** |
| B2 | 8.68 | 1 | 8.68 | 68.86 | <0.0001 ** |
| Residual | 0.8819 | 7 | 0.1260 | | |
| Lack of fit | 0.7074 | 3 | 0.2358 | 5.40 | 0.0684 |
| Pure error | 0.1745 | 4 | 0.0436 | | |


