

Selection of Kinematic and Temporal Input Parameters to Define a Novel Upper Body Index Indicator for the Evaluation of Upper Limb Pathology
 ,
,  , , ,
, , ,  ,
,
Abstract
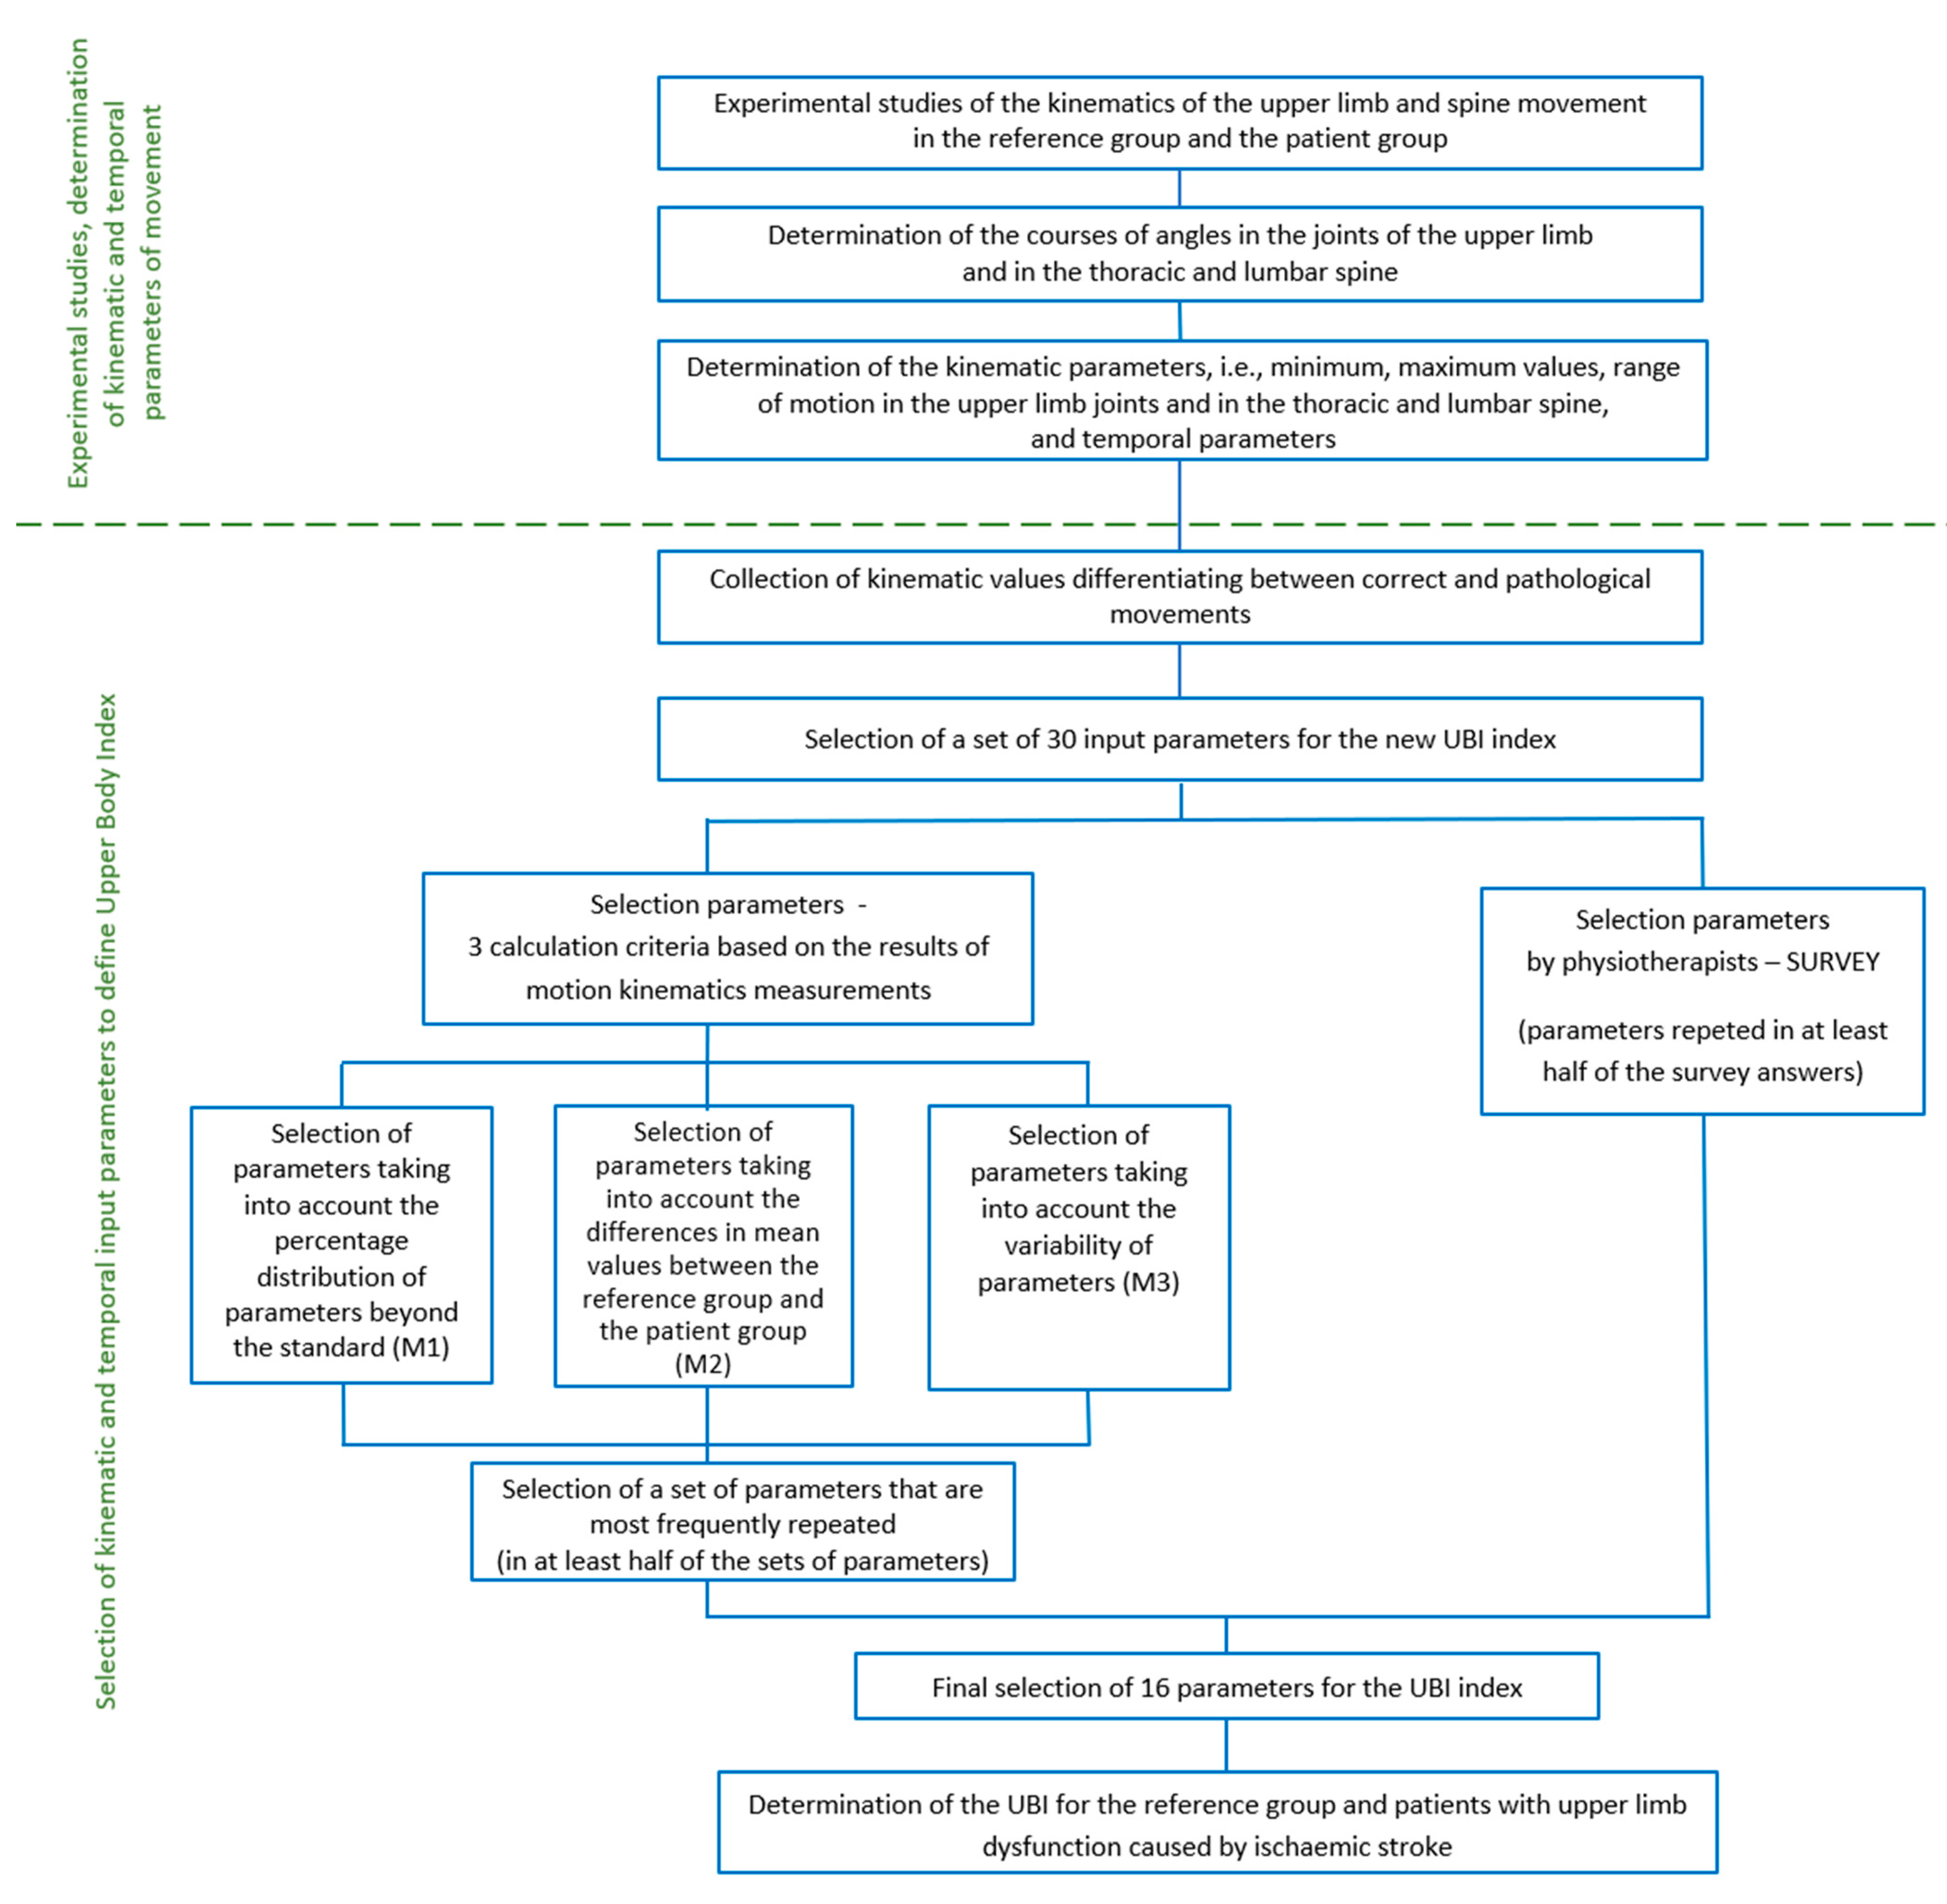
:1. Introduction
- Collection of kinematic values differentiating between correct and pathological movements;
- Selection of a set of input parameters for the new index.
- Determination of the UBI for the reference group and patients with upper limb dysfunction caused by ischaemic stroke.
2. Materials and Methods
2.1. Participants
2.2. Experimental Testing
2.3. Mathematical Algorithm of the Indicator
2.4. Selection of Input Parameters
- P1—Duration of the lifting phase t1 [s]—time from the moment of gripping the mug to the beginning of the drinking phase, which was defined as the lips touching the mug;
- P2—Duration of the lowering phase t2 [s]—time from the moment of the beginning of the movement after the drinking phase to the moment of placing the mug back onto its starting position;
- P3—Minimum flexion/extension angle of the shoulder joint;
- P4—Maximum flexion/extension angle of the shoulder joint;
- P5—Minimum abduction/adduction angle of the shoulder joint;
- P6—Maximum abduction/adduction angle of the shoulder joint;
- P7—Minimum external/internal rotation angle of the shoulder joint;
- P8—Maximum external/internal rotation angle of the shoulder joint;
- P9—Minimum flexion/extension angle of the elbow joint;
- P10—Maximum flexion/extension angle of the elbow joint;
- P11—Minimum supination/pronation angle of the elbow joint;
- P12—Maximum supination/pronation angle of the elbow joint;
- P13—Minimum palmar flexion/dorsiflexion angle of the wrist joint;
- P14—Maximum palmar flexion/dorsiflexion angle of the wrist joint;
- P15—Minimum elbow/radial abduction angle of the wrist joint;
- P16—Maximum elbow/radial abduction angle of the wrist joint;
- P17—Minimum spine anteversion angle;
- P18—Maximum spine anteversion angle;
- P19—Minimum spine rotation angle;
- P20—Maximum spine rotation angle;
- P21—Minimum spine anteversion angle in section Th1-Th12;
- P22—Maximum spine anteversion angle in section Th1-Th12;
- P23—Minimum spine rotation angle in section Th1-Th12;
- P24—Maximum spine rotation angle in section Th1-Th12;
- P25—Minimum spine anteversion angle in section L1-L5;
- P26—Maximum spine anteversion angle in section L1-L5;
- P27—Minimum spine rotation angle in section L1-L5;
- P28—Maximum spine rotation angle in section L1-L5;
- P29—Abduction/adduction motion range of the shoulder joint;
- P30—External/internal rotation motion range of the shoulder joint.
- The percentage distribution of parameters beyond the standard (M1);
- The differences in mean values between the reference group and the patient group (M2);
- The variability of parameters (M3).
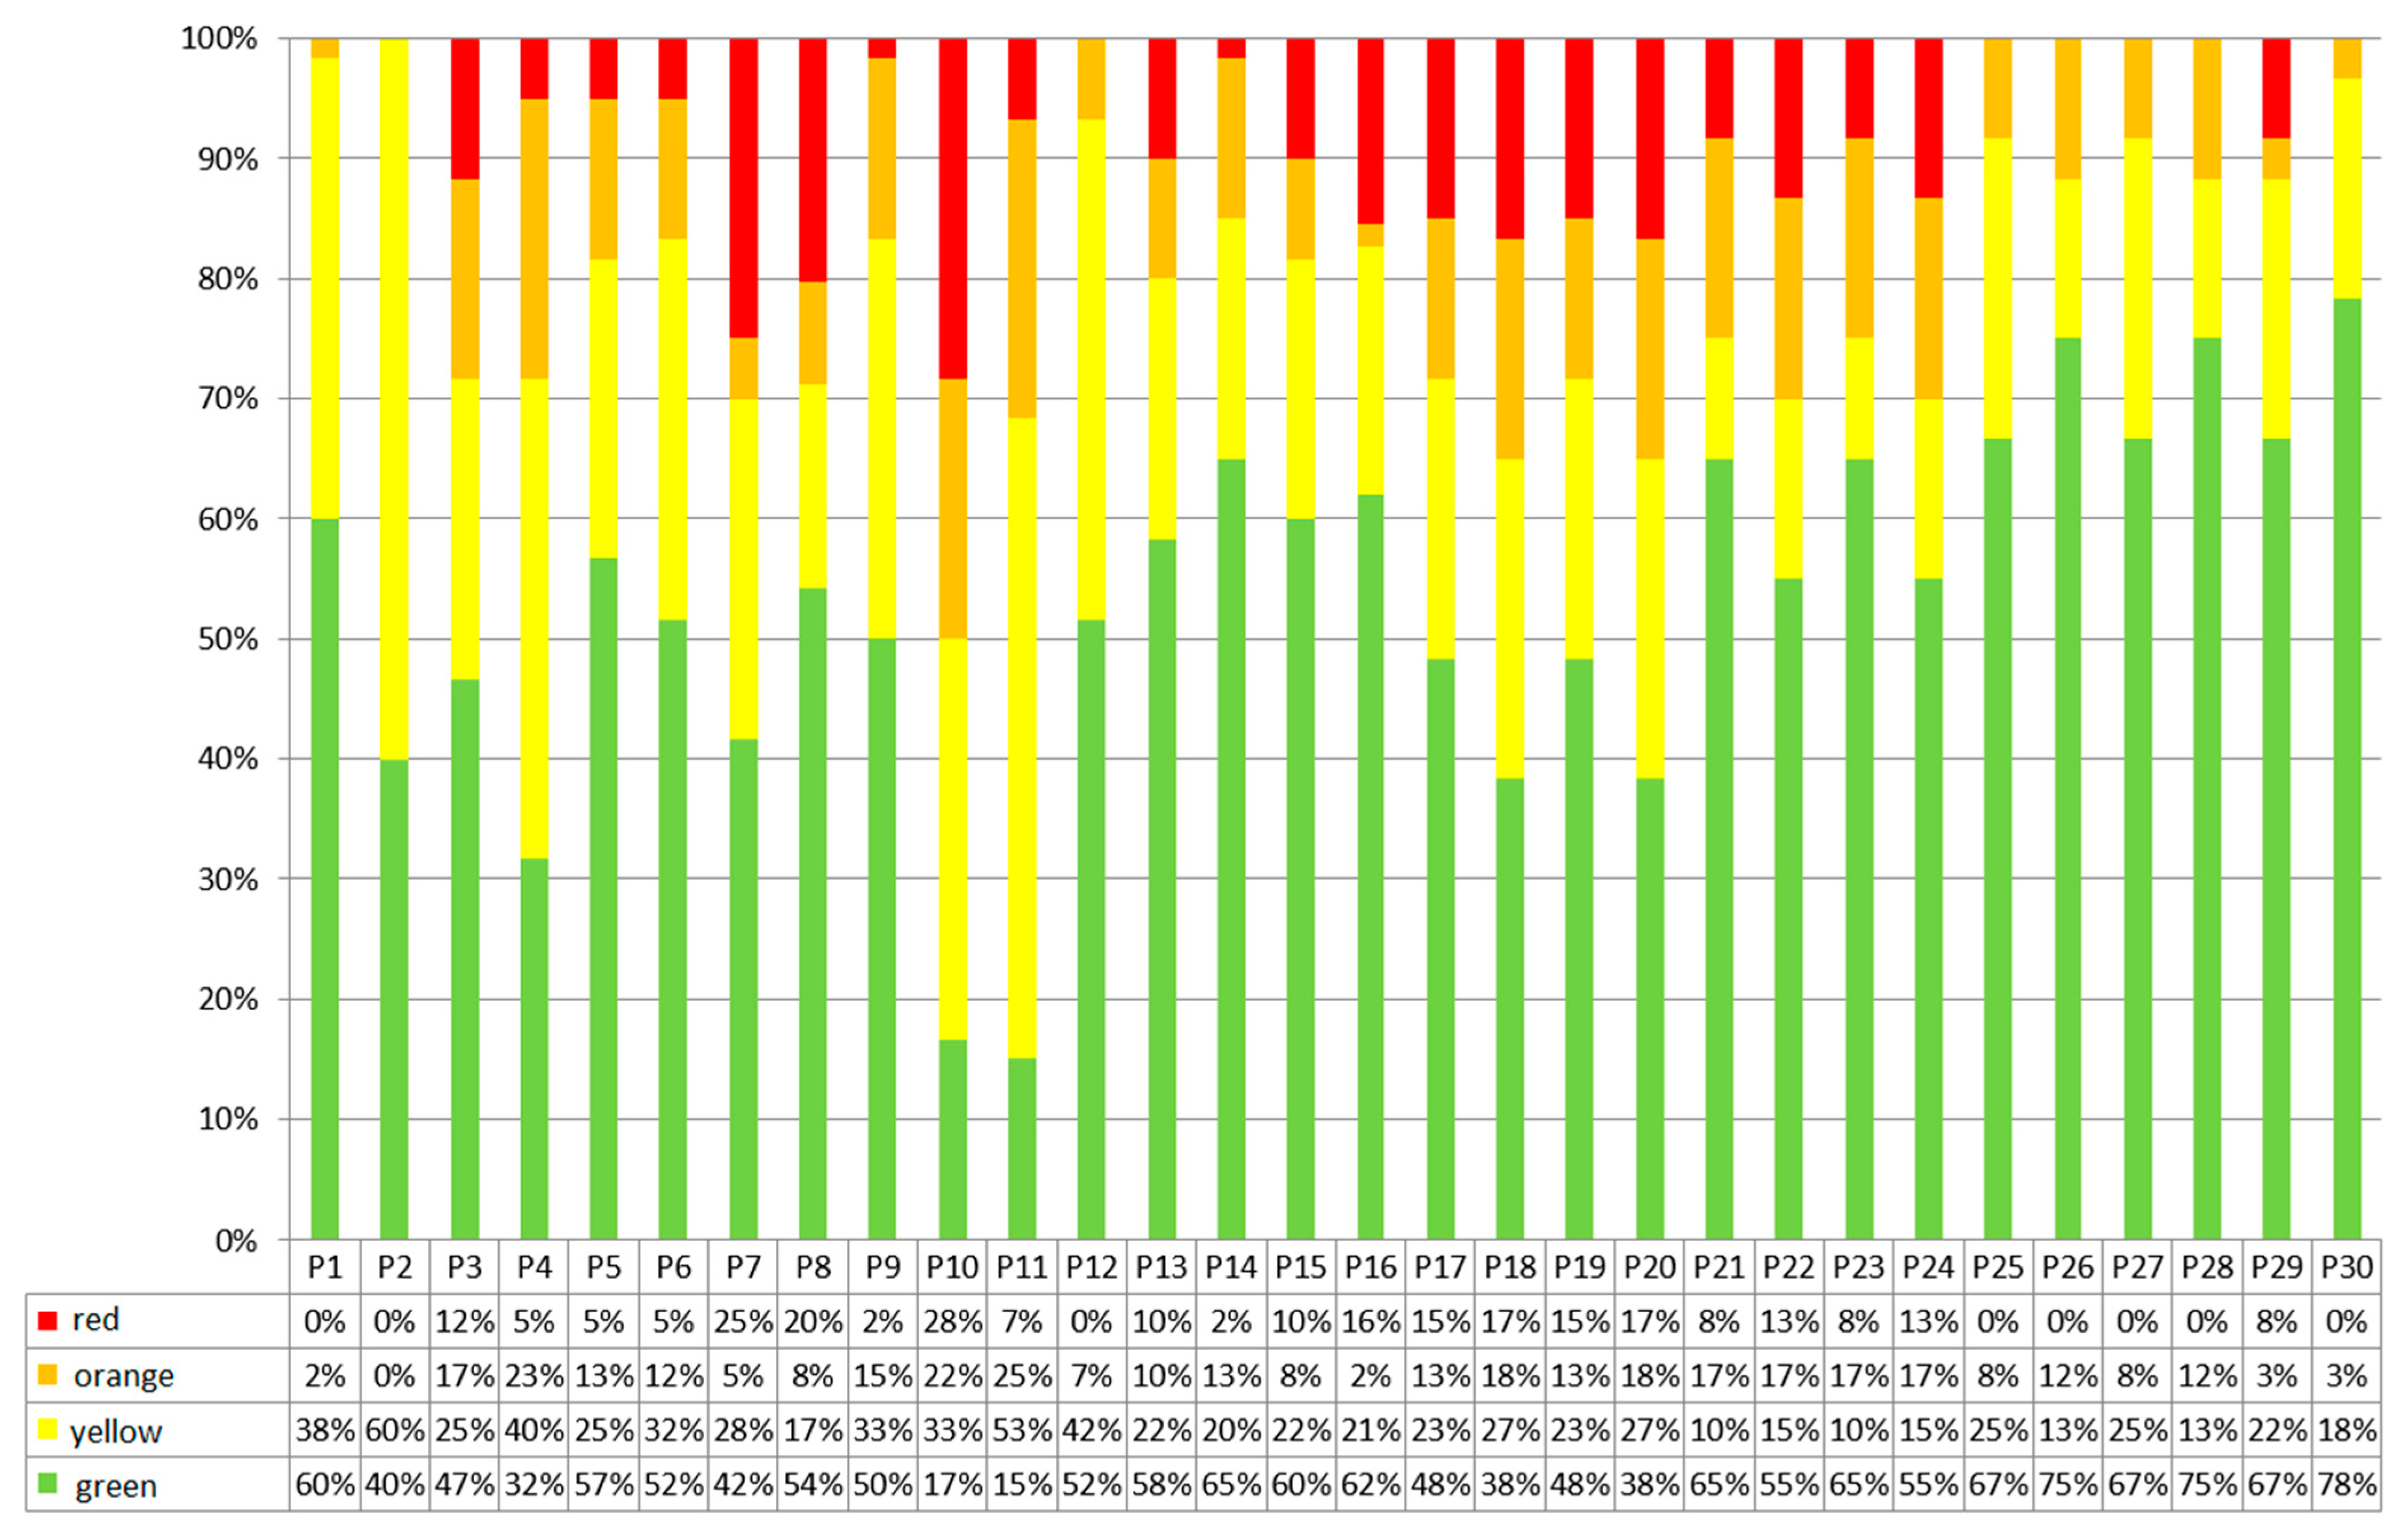
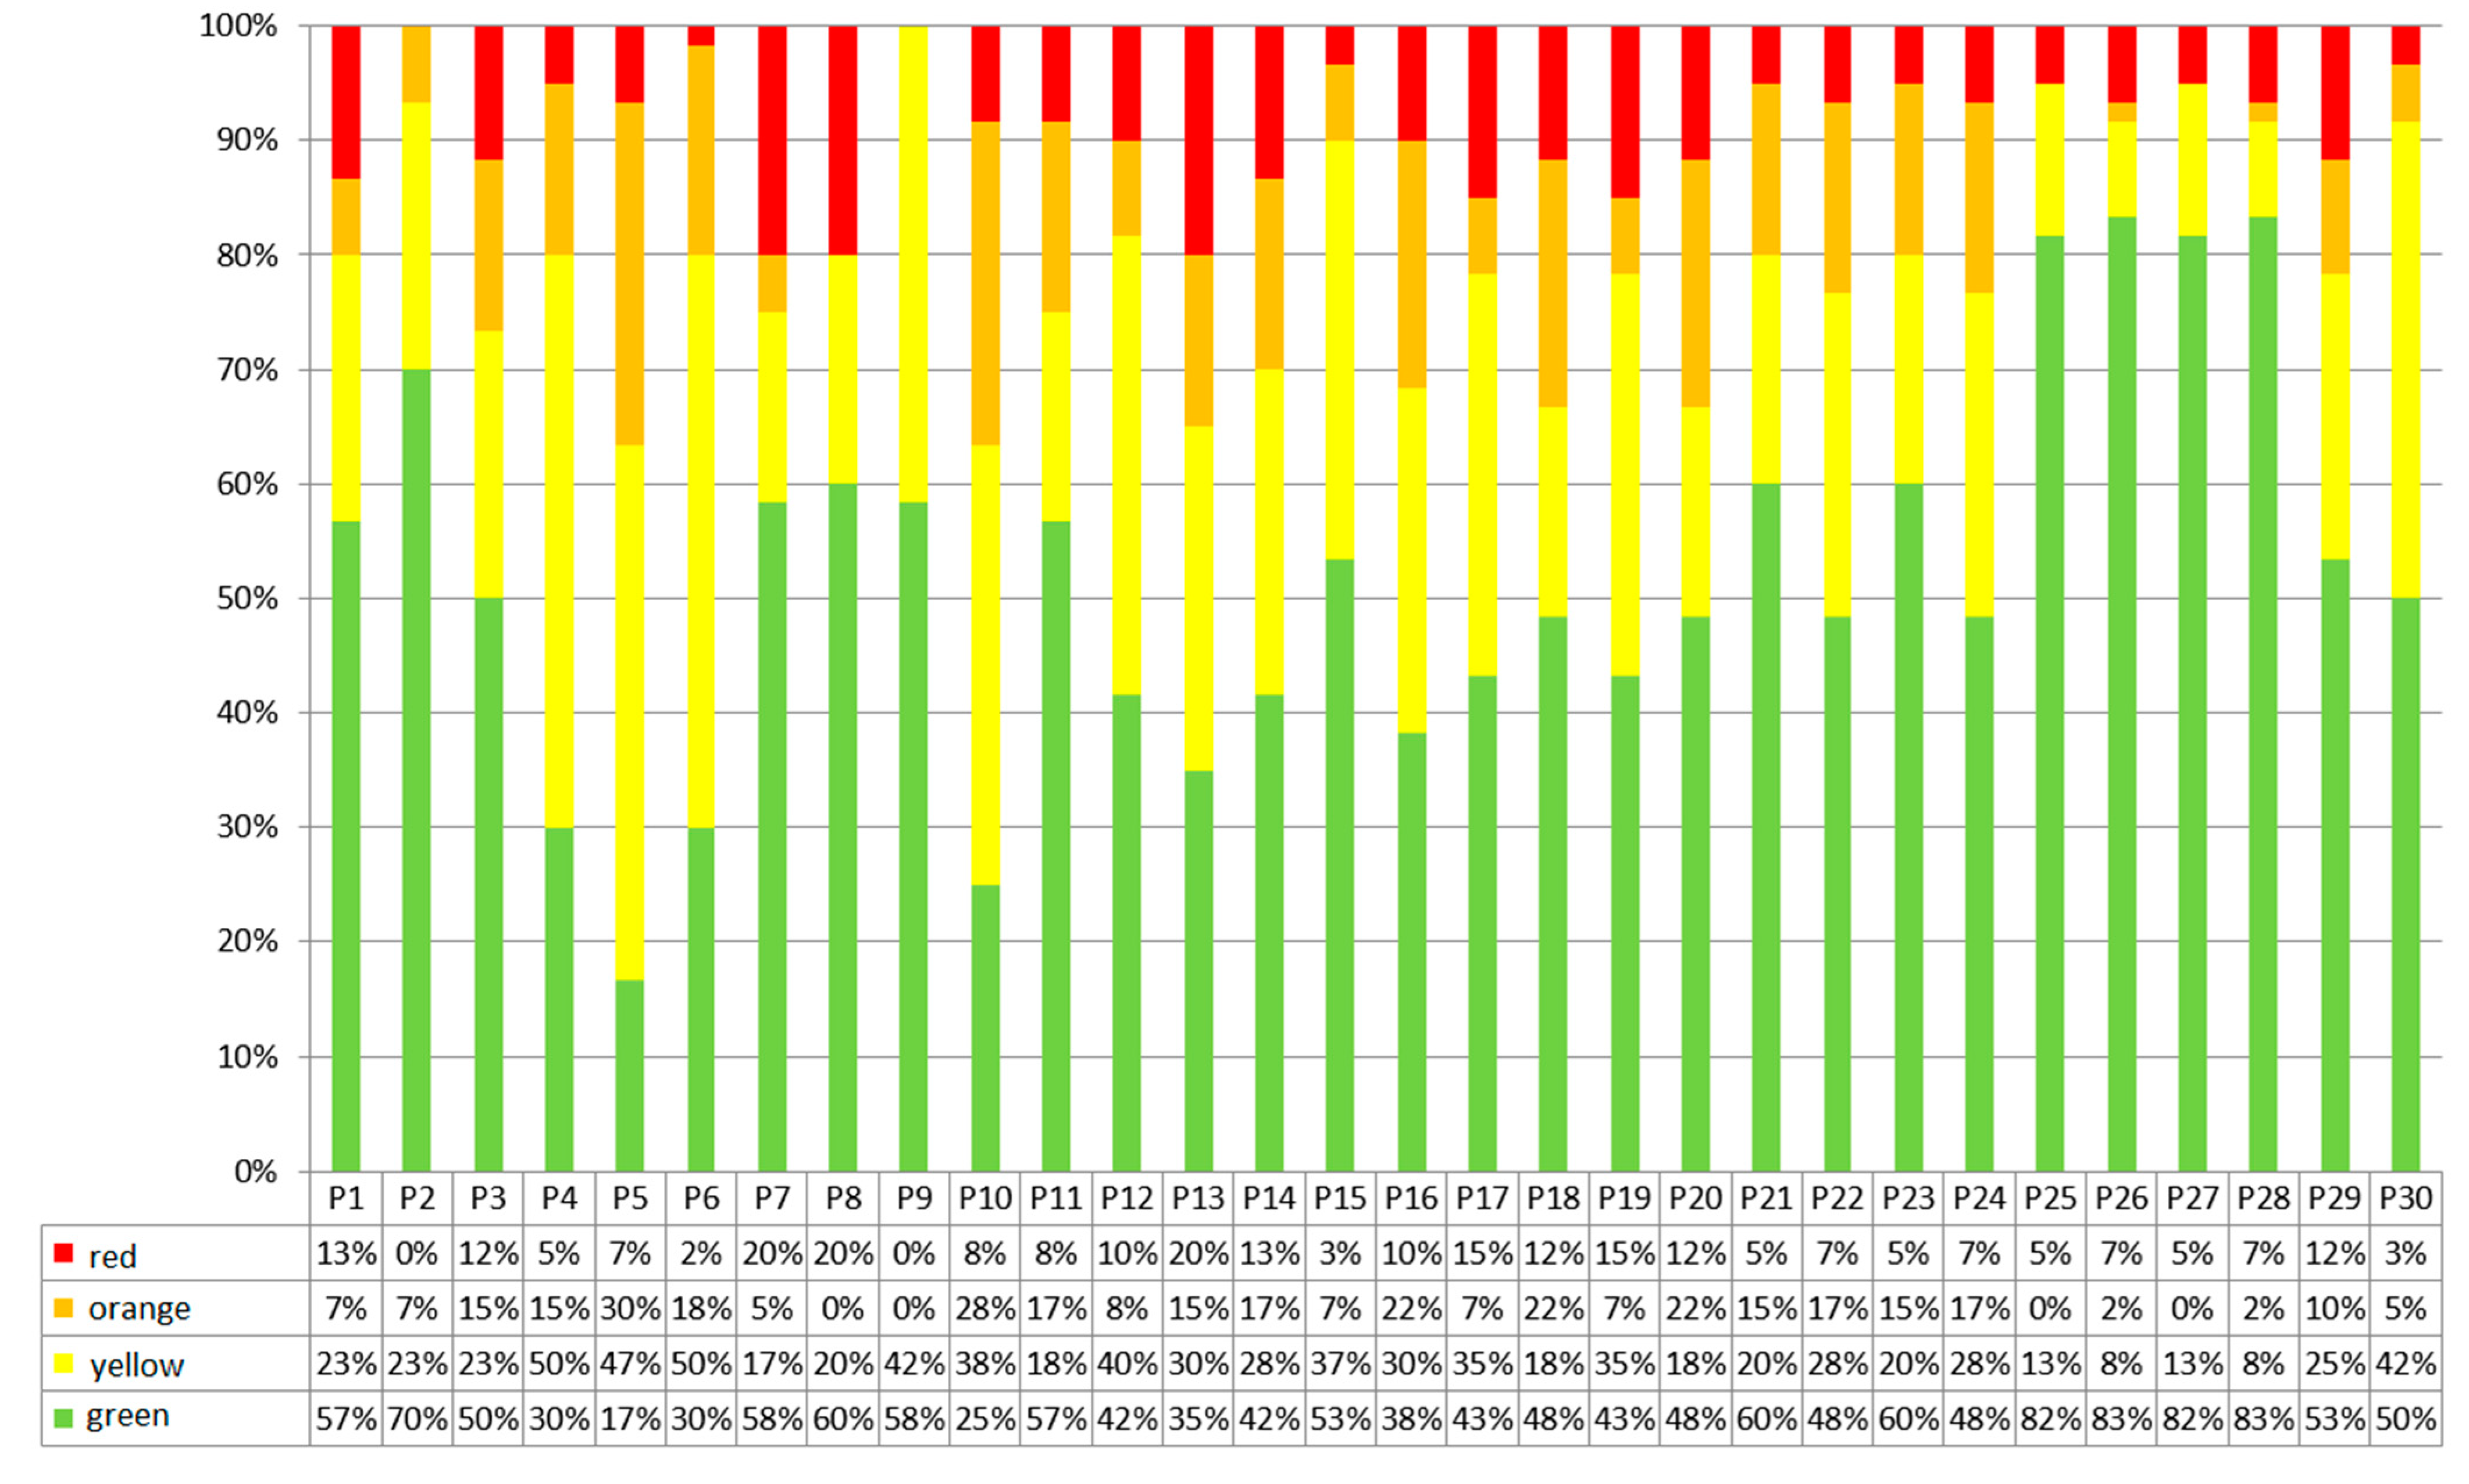
2.4.1. Selection of Parameters Taking into Account the Percentage Distribution of Parameters beyond the Standard (M1)
2.4.2. Selection of Parameters Taking into Account the Differences in Mean Values between the Reference Group and the Stroke Patient Group (M2)
2.4.3. Selection of Parameters Taking into Account the Variability of Parameters (M3)
2.4.4. Final Selection of Parameters
2.4.5. Statistical Analysis
3. Results
3.1. Selected Input Parameters
3.2. Selection of Input Parameters Taking into Account the Percentage Distribution of Parameters beyond the Standard
3.3. Selection of Input Parameters Taking into Account the Differences in Mean Values between the Reference Group and Stroke Patient Group
3.4. Selection of Input Parameters Taking into Account the Variability of Parameters
3.5. Final Selection of Input Parameters
- For upper limb motion evaluation, it is necessary to select mainly parameters that define maximum joint angles and motion ranges of the joints;
- Kinematic parameters measured for the spine should consider the possibility of detecting compensation movements, which may be a result of limb paresis;
- Appropriate velocity of the performed movement proves physical efficiency and ability of the upper limb.
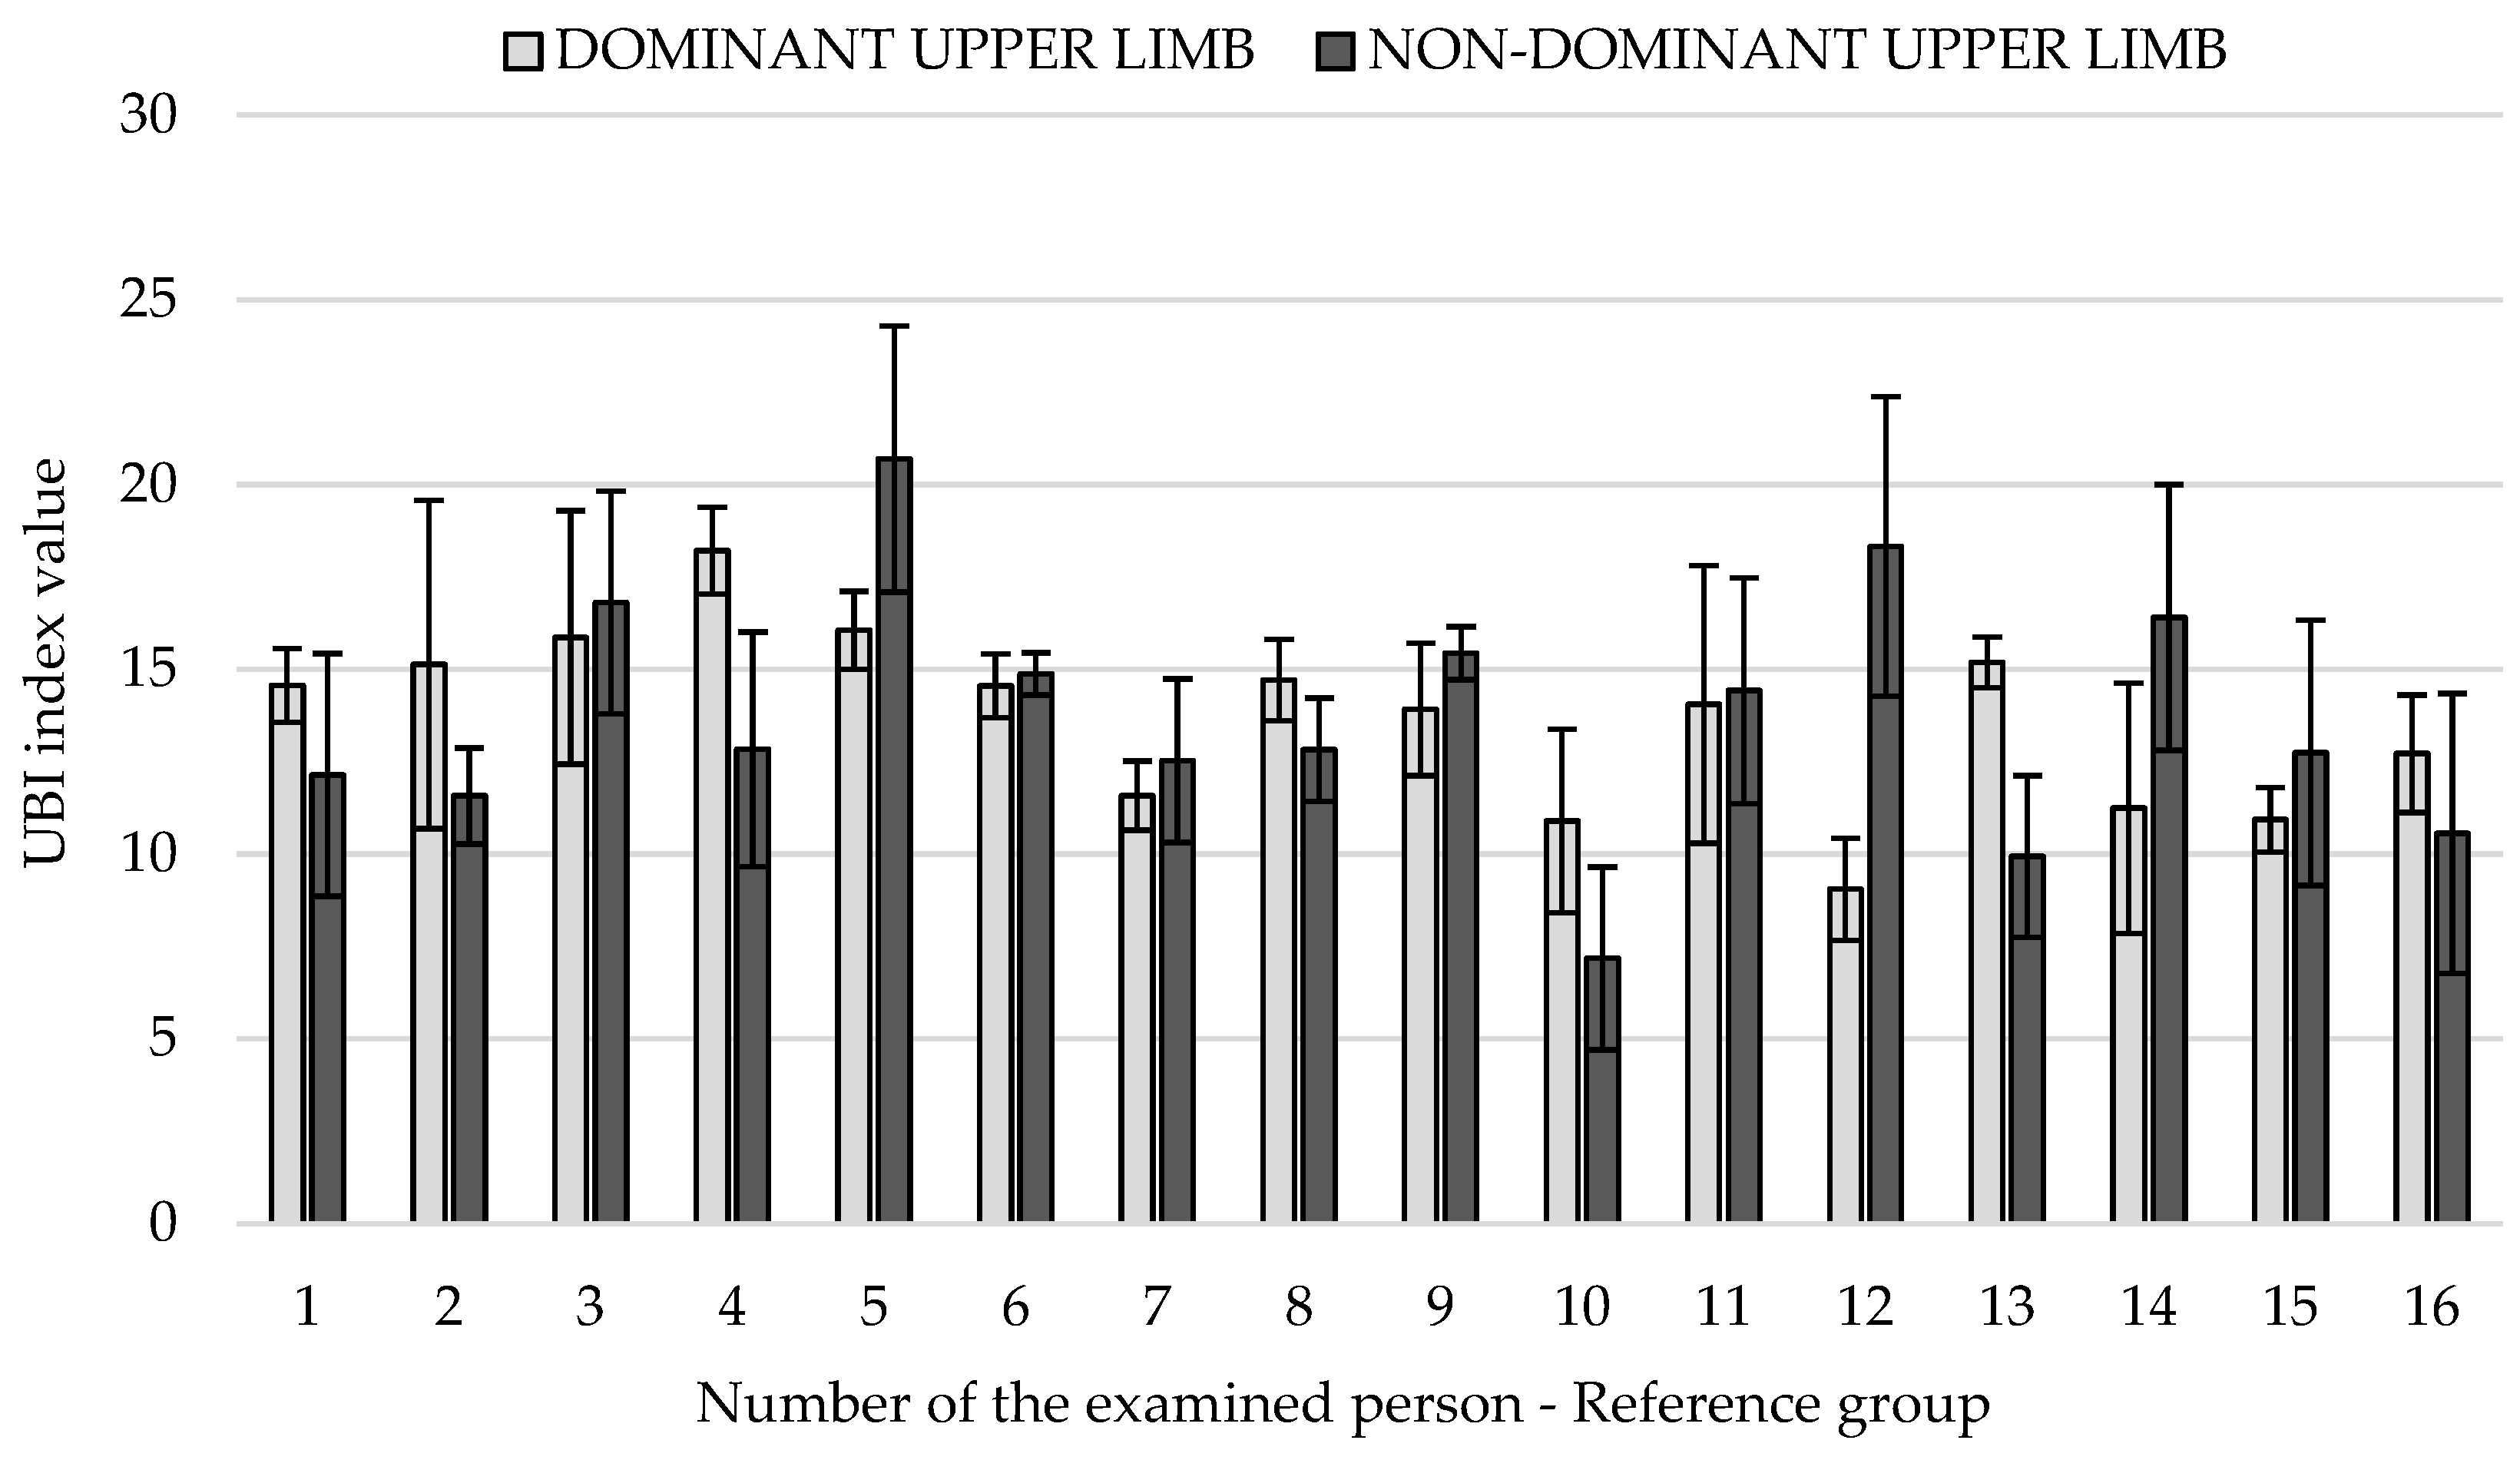
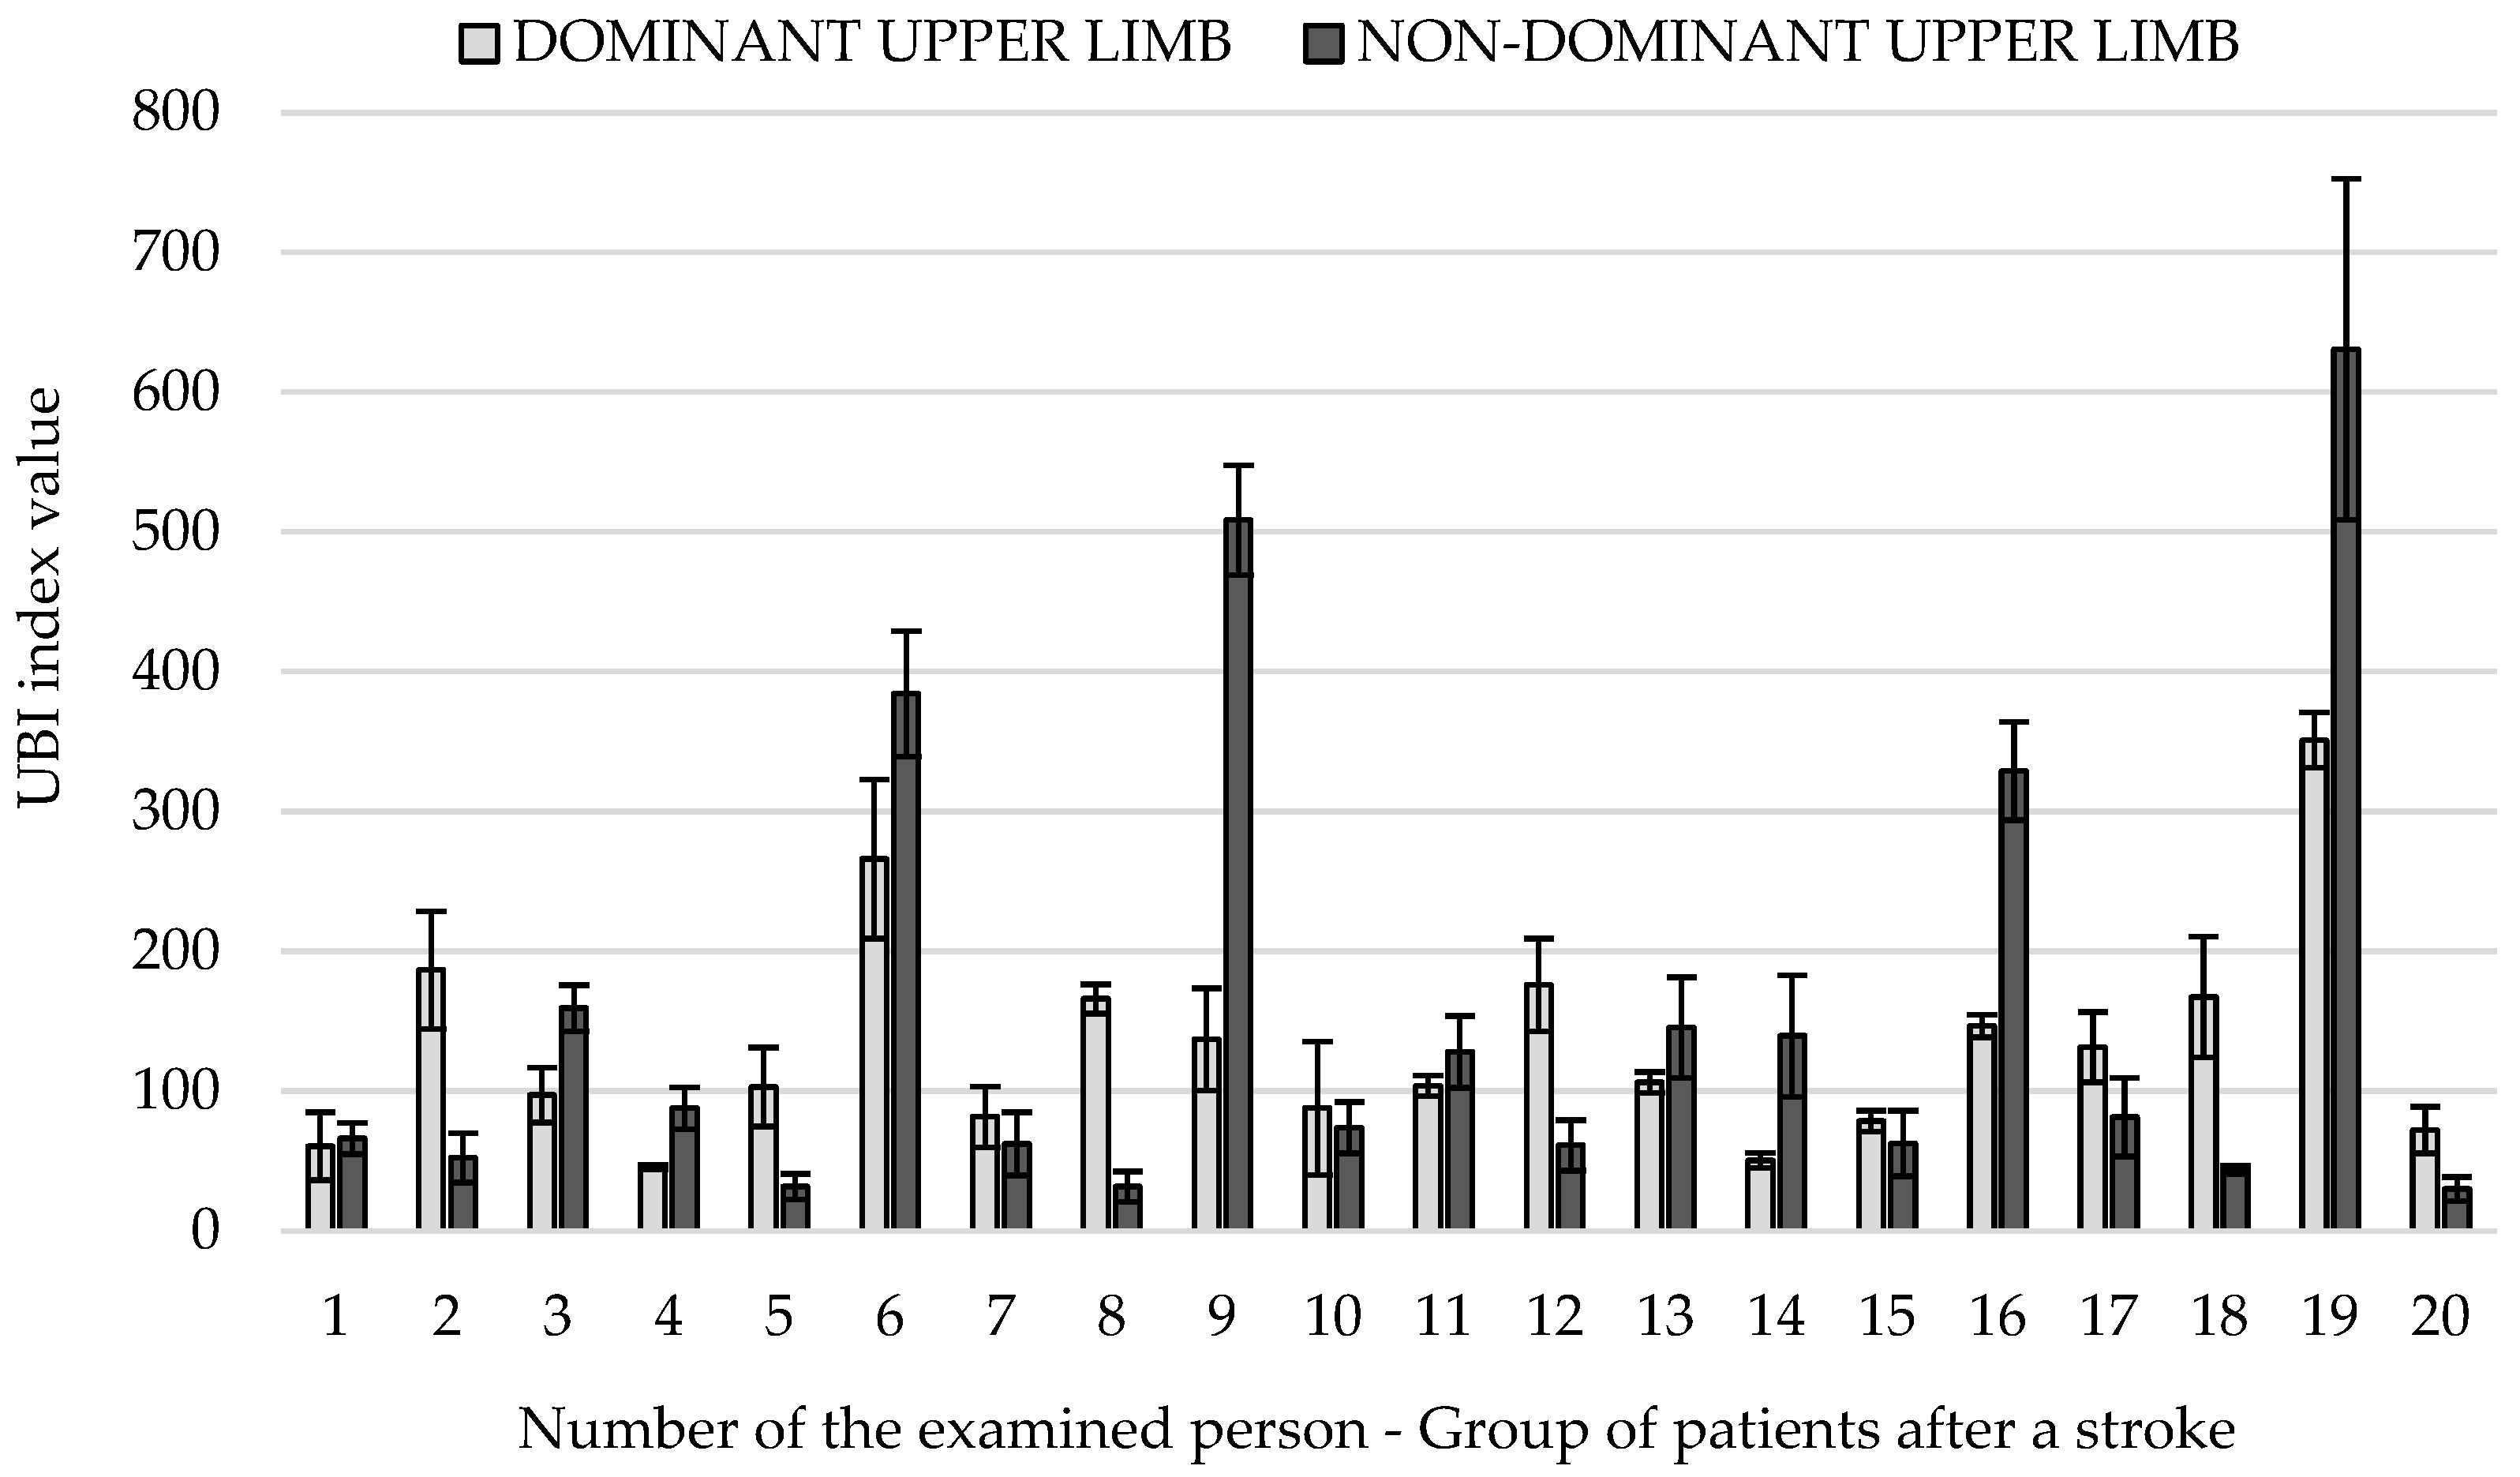
3.6. UBI Indicator Results
4. Discussion
5. Conclusions
6. Directions for Future Research
Author Contributions
Funding
Institutional Review Board Statement
Informed Consent Statement
Data Availability Statement
Conflicts of Interest
References
- Assi, A.; Bakouny, Z.; Karam, M.; Massaad, A.; Skalli, W.; Ghanem, I. Three-dimensional kinematics of upper limb anatomical movements in asymptomatic adults: Dominant vs. non-dominant. Hum. Mov. Sci. 2016, 50, 10–18. [Google Scholar] [CrossRef] [PubMed]
- Michnik, R.; Jurkojć, J.; Rak, Z.; Mężyk, A.; Paszenda, Z.; Rycerski, W.; Janota, J.; Brandt, J. Kinematic Analysis of Complex Therapeutic Movements of the Upper Limbs. In Information Technologies in Biomedicine, Advances in Soft Computing; Pietka, E., Kawa, J., Eds.; Springer: Berlin/Heidelberg, Germany, 2008; Volume 47, pp. 551–558. [Google Scholar]
- Chang, J.J.; Wu, T.I.; Wu, W.L.; Su, F.C. Kinematical measure for spastic reaching in children with cerebral palsy. Clin. Biomech. 2005, 20, 381–388. [Google Scholar] [CrossRef] [PubMed]
- Guzik, A.; Michnik, R.; Rycerski, W. The estimation of rehabilitation progress in patients with psychomotor diseases of upper limb based on modeling and experimental research. Acta Bioeng. Biomech. 2006, 8, 79–87. [Google Scholar]
- Zawadzki, J.; Siemieński, J. Maximal frequency, amplitude, kinetic energy and elbow joint stiffness in cyclic movement. Acta Bioeng. Biomech. 2010, 12, 55–64. [Google Scholar]
- Machado, L.; Heathcock, J.; Carvalho, R.; Pereira, N.; Tudella, E. Kinamatic characteristics of arm and trunk when drinking form the glass in children with and without celebral palsy. Clin. Biomech. 2019, 63, 201–206. [Google Scholar] [CrossRef] [PubMed]
- Stansfield, B.; Rooney, S.; Brown, L.; Kay, M.; Spoettl, L.; Shanmugam, S. Distal upper limb kinematics during functional everyday tasks. Gait Posture 2018, 61, 135–140. [Google Scholar] [CrossRef] [Green Version]
- Kim, K.; Song, W.-K.; Lee, J.; Lee, H.-Y.; Park, D.S.; Ko, B.-W.; Kim, J. Kinematic analysis of upper extremity movement during drinking in hemiplegic subjects. Clin. Biomech. 2014, 29, 248–256. [Google Scholar] [CrossRef]
- Artiheiro, M.; Correa, J.; Cimolin, V.; Lima, M.; Galli, M.; Godoy, W.; Lucareli, P. Three-dimensional analysis of performance of an upper limb functional task among adults with dyskinetic celebral palsy. Gait Posture 2014, 39, 875–881. [Google Scholar]
- Murphy, M.; Willen, C.; Sunnerhagen, K. Kinematic Variables Quantyfying Upper-Extremity Performance After Stroke During Reasearching and Drinking from a Glass. Neurorehabil. Neural Repair 2011, 25, 71–80. [Google Scholar] [CrossRef] [Green Version]
- Guzik-Kopyto, A.; Michnik, R.; Wodarski, P.; Chuchnowska, I. Determination of Loads in the Joints of the Upper Limb During Activities of Daily Living. In Information Technologies in Medicine. Advances in Intelligence Systems and Computing; Piętka, E., Badura, P., Kawa, J., Wieclawek, W., Eds.; Springer: Berlin/Heidelberg, Germany, 2016; Volume 472, pp. 99–108. [Google Scholar]
- Valevicius, A.; Boser, Q.; Lavoie, E.; Chapman, C.; Pilarski, P.; Hebert, J.; Vette, A. Charakterisation of normative angular joint kinematics during two functional upper limb tasks. Gait Posture 2019, 69, 176–186. [Google Scholar] [CrossRef]
- Engdahl, S.; Gates, D. Reliability of upper limb and trunk joint angles in healthy adults during activites of daily living. Gait Posture 2018, 60, 41–47. [Google Scholar] [CrossRef] [PubMed]
- Jaspers, E.; Desloovere, K.; Bruyninckx, H.; Klingels, K.; Molenaers, G.; Aertbelien, E.; Gestel, L.; Feys, H. Three-dimensional upper limb movement characteristics in children with hemiplegic celebral palsy an typically developing children. Res. Dev. Disabil. 2011, 32, 2283–2294. [Google Scholar] [CrossRef] [PubMed]
- Jaspers, E.; Feys, H.; Bruyninckx, H.; Klingels, K.; Molenaers, G.; Desloovere, K. The Arm Profile Score: A new summary index to assess Upper limb movement pathology. Gait Posture 2011, 34, 227–233. [Google Scholar] [CrossRef] [PubMed]
- Reid, S.; Elliott, C.; Alderson, J.; Lloyd, D.; Elliott, B. Reapeatability of upper limb kinematics for children with ona without celebral palsy. Gait Posture 2010, 32, 10–17. [Google Scholar] [CrossRef]
- Butler, E.; Rose, J. The Pediatric Upper Limb Motion Index and a temporal- spatial logistic regression: Quantitative analysis of Upper limb movement disorders Turing the Rash & Grasp cycle. J. Biomech. 2012, 45, 945–951. [Google Scholar]
- Jurkojć, J.; Wodarski, P.; Michnik, R.; Nowakowska, K.; Bieniek, A.; Gzik, M. The Upper Limb Motion Deviation Index: A new comprehensive index of upper limb motion pathology. Acta Bioeng. Biomech. 2017, 19, 175–185. [Google Scholar]
- Johansson, G.; Frykberg, G.; Grip, H.; Brostrom, E.; Hager, C. Assessment of arm movements during gait stroke-The Arm Profile Score. Gait Posture 2014, 40, 549–555. [Google Scholar] [CrossRef]
- Corona, F.; Gervasoni, E.; Coghe, G.; Cocco, E.; Ferrarin, M.; Pau, M.; Cattaneo, D. Validation of the Arm Profile Score in assessing Upper limb funcional impairments in people with multiple sclerosis. Clin. Biomech. 2018, 51, 45–50. [Google Scholar] [CrossRef]
- Riad, J.; Coleman, S.; Lundh, D.; Brostorm, E. Arm Profile Score and arm movement during walking: A comprehensive assessment in spastic hemiplegic celebral palsy. Gait Posture 2011, 33, 48–53. [Google Scholar] [CrossRef]
- Darras, N.; Vanezis, A.; Pasparakis, D.; Nestoridis, C.; Pons, R. Global Upper Limb Deviation index. A new method for quantifying movement pathology. Gait Posture 2017, 39, S25. [Google Scholar] [CrossRef]
- Papavasiliou, A.; Darras, N.; Vanezis, A.; Pasparakis, D.; Pons, R. Face validity of the Global Upper Limb Deviation index (GULDI). Eur. J. Paediatr. Neurol. 2015, 19, S53. [Google Scholar]
- Schwartz, M.; Rozumalski, A. The gait deviation index: A new comprehensive index of gait pathology. Gait Posture 2008, 28, 351–357. [Google Scholar] [CrossRef] [PubMed]
- Schutte, L.M.; Narayanan, U.; Stout, J.L.; Selber, P.; Gage, J.R.; Schwartz, M.H. An index for quantifying deviations from normal gait. Gait Posture 2000, 11, 25–31. [Google Scholar] [CrossRef] [Green Version]
- Michnik, R.; Nowakowska, K.; Jurkojć, J.; Jochymczyk-Woźniak, K.; Kopyta, I. Motor functions assessment method based on energy changes in gait cycle. Acta Bioeng. Biomech. 2017, 19, 63–75. [Google Scholar] [PubMed]
- Nowakowska, K.; Michnik, R.; Jochymczyk-Woźniak, K.; Jurkojć, J.; Mandera, M.; Kopyta, I. Application of gait index assessment to monitor the treatment progress in patients with cerebral palsy. In Information Technologies in Medicine. Advances in Intelligent System and Computing; Piętka, E., Badura, P., Kawa, J., Wieclawek, W., Eds.; Springer: Berlin/Heidelberg, Germany, 2016; Volume 472, pp. 75–85. [Google Scholar]
- Jochymczyk-Woźniak, K.; Nowakowska, K.; Michnik, R.; Konopelska, A.; Luszawski, J.; Mandera, M. Assessment of locomotor functions of patients suffering from cerebral palsy qualified to treat by different methods. In Innovation in Biomedical Engineering. Advances in Intelligent System and Computing; Gzik, M., Tkacz, E., Paszenda, Z., Piętka, E., Eds.; Springer International Publishing: Berlin/Heidelberg, Germany, 2018; Volume 623, pp. 225–233. [Google Scholar]
- Cretual, A.; Bervet, K.; Ballaz, L. Gillette Gait Index in adults. Gait Posture 2010, 32, 307–310. [Google Scholar] [CrossRef] [PubMed]
- Wodarski, P.; Michnik, R.; Gzik, M.; Jurkojć, J.; Bieniek, A.; Nowakowska, K. Variants of Upper Limb Motion Index Calculations in the assessment of upper limb motion dysfunction. In Engineering Mechanics 2017, Proceedings of the 23rd International Conference, 15–18 May 2017; Fuis, V., Ed.; Institute of Solid Mechanics: Svratka, Czech Republic, 2017; pp. 1058–1061. [Google Scholar]

| Evaluation of the Results | Colour | Range of Results |
|---|---|---|
| Results in the norm | Green | |
| Results at the limit of the norm | Yellow | |
| Results beyond the norm | Orange | |
| Results beyond the norm significantly | Red | (−∞; mean−3std)∪(mean+3std; +∞) |
| Parameter | Reference Group | Stroke Patients Group | |||
|---|---|---|---|---|---|
| Dominant Limb | Non-Dominant Limb | dl vs. ndl p-Value | Dominant Limb | Non-Dominant Limb | |
| Mean ± Std (Min–Max) | Mean ± Std (Min–Max) | Mean ± Std (Min–Max) | Mean ± Std (Min–Max) | ||
| P1 | 2.3 ± 0.9 (1.1–5.4) | 2.2 ± 0.8 (0.6–4.5) | 0.823 | 1.9 ± 0.8 (0.4–3.9) | 2.8 ± 1.7 (0.6–9.1) |
| P2 | 2.3 ± 0.6 (1.2–4.1) | 2.1 ± 0.7 (1.2–4.6) | 0.027 * | 1.8 ± 0.6 (1.1–3.4) | 2.1 ± 0.6 (1.3–3.9) |
| P3 | 46.3 ± 8.2 (26.5–56.3) | 43.3 ± 9.7 (18.8–59.6) | 0.061 | 40.79 ± 13.9 (19.2–79.1) | 36.2 ± 16.4 (−11–68.1) |
| P4 | 80.4 ± 11.5 (58.6–103.6) | 75.9 ± 11.4 (51.5–93.2) | 0.062 | 64.4 ± 11.3 (43–84.7) | 63.4 ± 15.8 (26–108.4) |
| P5 | 24.8 ± 8.8 (7.1–40.9) | 29.6 ± 7.7 (16.1–52.1) | 0.001 * | 18.9 ± 11.7 (−19.8–38.5) | 16.6 ± 6.1 (4.1–30.7) |
| P6 | 34.9 ± 8.5 (21.4–50.4) | 38.7 ± 8.9 (23.5–62.6) | 0.002 * | 32.3 ± 12.6 (−0.8–54) | 29.4 ± 10.9 (11–63.5) |
| P7 | 10.6 ± 8.6 (−4.9–30.1) | 4.6 ± 9.5 (−15.3–32.2) | 0.016 * | 20.1 ± 25.1 (−12.9–85.5) | 16.3 ± 22.2 (−11.4–75.8) |
| P8 | 22.9 ± 10.3 (6.3–41.7) | 17.5 ± 9.2 (0.5–41.6) | 0.043 * | 32.6 ± 24.5 (−0.8–101.4) | 30.7 ± 24.8 (6.7–97.8) |
| P9 | 77.5 ± 18.6 (42.5–129.2) | 81.3 ± 21.3 (41.2–137.8) | 0.199 | 57.4 ± 17 (17.7–100.7) | 68 ± 15.6 (43.1–111.4) |
| P10 | 128.5 ± 9.9 (102.5–148.1) | 134.5 ± 9.5 (115.2–156.2) | 0.001 * | 108.5 ± 15.2 (76.7–145.1) | 131.3 ± 19 (104.2–177.5) |
| P11 | 23.2 ± 22.6 (−19.6–58.3) | 6.9 ± 24.9 (−36.6–51.7) | 0.001 * | 61.3 ± 16.7 (29.8–98) | 16.9 ± 45.8 (−179.3–113.2) |
| P12 | 67.7 ± 24.3 (6.5–119.2) | 55.6 ± 22.1 (1.2–83.7) | 0.001 * | 93.1 ± 17.5 (57.6–133.4) | 81.5 ± 32.3 (32.4–179.7) |
| P13 | −23.4 ± 10.4 (−45.1–−4.4) | −21.8 ± 6.8 (−37.6–−7.9) | 0.239 | −22.5 ± 16.6 (−56.2–20.3) | −19.5 ± 16.4 (−68.8–5.6) |
| P14 | −7 ± 13 (−39.8–19.5) | −2.2 ± 9.3 (−21.8–15.3) | 0.012 * | −0.3 ± 17 (−28.5–43.9) | 2.2 ± 20.3 (−61–55.9) |
| P15 | −6.6 ± 7.4 (−20.6–11.2) | −11.3 ± 9.5 (−26.9–3.3) | 0.004 * | −12.4 ± 12.6 (−51.7–5.1) | −6.6 ± 11.9 (−33.5–23.8) |
| P16 | 6.2 ± 7.7 (−6–23.6) | 3.3 ± 7.9 (−9.8–17.6) | 0.041 * | 2.9 ± 14.7 (−33.3–34.4) | 11.1 ± 12.5 (−26.4–33.3) |
| P17 | 0.1 ± 0.1 (0–0.2) | 0.1 ± 0.1 (0–0.3) | 0.422 | 0.2 ± 0.1 (0–0.4) | 0.1 ± 0.1 (0–0.5) |
| P18 | 0.1 ± 0.1 (0–0.3) | 0.1 ± 0.1 (0–0.3) | 0.203 | 0.2 ± 0.1 (0–0.4) | 0.2 ± 0.1 (0–0.6) |
| P19 | 4 ± 3.3 (0.3–13.8) | 3.5 ± 3.3 (0.4–14.1) | 0.421 | 8.4 ± 5.9 (0.3–22.6) | 7.9 ± 6.5 (0–30.8) |
| P20 | 5.8 ± 3.4 (1.3–16.3) | 5.9 ± 3.8 (2.1–18.9) | 0.203 | 11 ± 6.3 (2.7–24.7) | 11.5 ± 7.3 (2.5–37.1) |
| P21 | 0.1 ± 0.1 (0–0.4) | 0.1 ± 0.1 (0–0.4) | 0.739 | 0.2 ± 0.1 (0–0.5) | 0.2 ± 0.1 (0–0.6) |
| P22 | 0.2 ± 0.1 (0.1–0.5) | 0.2 ± 0.1 (0–0.5) | 0.043 * | 0.3 ± 0.1 (0.1–0.5) | 0.3 ± 0.1 (0.1–0.7) |
| P23 | 7.6 ± 5.5 (0.8–23.7) | 7.4 ± 5.3 (0.7–24) | 0.739 | 12.7 ± 7.1 (1.8–26.5) | 11.8 ± 7.2 (1.9–33.7) |
| P24 | 9.8 ± 5.4 (3.6–26.4) | 10.4 ± 5.9 (2.6–29.6) | 0.043 | 15.8 ± 7.3 (3–28.8) | 16.1 ± 8.2 (3.2–40.8) |
| P25 | 0.1 ± 0.1 (0–0.3) | 0.1 ± 0.1 (0–0.3) | 0.267 | 0.1 ± 0.1 (0–0.3) | 0.1 ± 0.1 (0–0.5) |
| P26 | 0.1 ± 0.1 (0–0.3) | 0.2 ± 0.1 (0–0.4) | 0.747 | 0.1 ± 0.1 (0–0.4) | 0.2 ± 0.1 (0.1–0.6) |
| P27 | 6.6 ± 4.8 (0.4–17.5) | 6.5 ± 4.7 (0.7–19.1) | 0.267 | 5.2 ± 4.8 (0–18.3) | 5.6 ± 5.7 (0.2–27.6) |
| P28 | 8.1 ± 4.8 (1.6–19.6) | 8.3 ± 4.6 (1.9–20.2) | 0.043 * | 7.4 ± 5.3 (1.2–20.9) | 8.5 ± 6.4 (3.2–33.7) |
| P29 | 10.1 ± 4.6 (2.5–19) | 8.7 ± 4 (3.5–20.4) | 0.109 | 13.3 ± 5.9 (4.6–30.3) | 12.8 ± 7.1 (3.9–34.1) |
| P30 | 12.3 ± 6.2 (3.8–27.4) | 12.2 ± 4.7 (5.7–24.4) | 0.848 | 12.5 ± 5.6 (3.3–29.5) | 14.5 ± 6.8 (2.9–41.9) |
| Parameter | Reference Group vs. Stroke Patients Group p-Value Dominant Limb | Reference Group vs. Stroke Patients Group p-Value Non-Dominant Limb |
|---|---|---|
| P1 | 0.011 * | 0.098 |
| P2 | <0.001 * | 0.632 |
| P3 | 0.010 * | 0.005 * |
| P4 | <0.001 * | <0.001 * |
| P5 | 0.016 * | <0.001 * |
| P6 | 0.714 | <0.001 * |
| P7 | 0.371 | 0.006 * |
| P8 | 0.164 | 0.006 * |
| P9 | <0.001 * | 0.001 * |
| P10 | <0.001 * | <0.001 * |
| P11 | <0.001 * | 0.078 |
| P12 | <0.001 * | <0.001 * |
| P13 | 0.165 | 0.765 |
| P14 | 0.160 | 0.07 |
| P15 | 0.052 | 0.021 * |
| P16 | 0.891 | <0.001 * |
| P17 | <0.001 * | <0.001 * |
| P18 | <0.001 * | <0.001 * |
| P19 | <0.001 * | <0.001 * |
| P20 | <0.001 * | <0.001 * |
| P21 | <0.001 * | <0.001 * |
| P22 | <0.001 * | <0.001 * |
| P23 | <0.001 * | <0.001 * |
| P24 | <0.001 * | <0.001 * |
| P25 | 0.085 | 0.171 |
| P26 | 0.291 | 0.619 |
| P27 | 0.085 | 0.171 |
| P28 | 0.291 | 0.619 |
| P29 | 0.008 * | <0.001 * |
| P30 | 0.635 | 0.066 |
| No. | Dominant Limb | Non-Dominant Limb | ||
|---|---|---|---|---|
| Selected Parameters | Percentage Distribution of Selected Parameters within the Standard (Green Classifier) | Selected Parameters | Percentage Distribution of Selected Parameters within the Standard (Green Classifier) | |
| 1 | P11 | 15% | P5 | 17% |
| 2 | P10 | 17% | P10 | 25% |
| 3 | P4 | 32% | P4 | 30% |
| 4 | P18 | 38% | P6 | 30% |
| 5 | P20 | 38% | P13 | 35% |
| 6 | P2 | 40% | P16 | 38% |
| 7 | P7 | 42% | P14 | 42% |
| 8 | P3 | 47% | P12 | 42% |
| 9 | P17 | 48% | P17 | 43% |
| 10 | P19 | 48% | P19 | 43% |
| 11 | P9 | 50% | P18 | 48% |
| 12 | P6 | 52% | P20 | 48% |
| 13 | P12 | 52% | P22 | 48% |
| 14 | P8 | 54% | P24 | 48% |
| 15 | P22 | 55% | P3 | 50% |
| 16 | P24 | 55% | P30 | 50% |
| No. | Dominant Limb | Non-Dominant Limb | ||
|---|---|---|---|---|
| Selected Parameters | Differences in Mean Values [°] | Selected Parameters | Differences in Mean Values [°] | |
| 1 | P11 | 38.18 | P12 | 25.96 |
| 2 | P12 | 25.38 | P9 | 13.30 |
| 3 | P9 | 20.10 | P8 | 13.24 |
| 4 | P10 | 19.93 | P5 | 13.03 |
| 5 | P4 | 16.07 | P4 | 12.58 |
| 6 | P8 | 9.70 | P7 | 11.67 |
| 7 | P7 | 9.51 | P11 | 10.02 |
| 8 | P14 | 6.67 | P6 | 9.27 |
| 9 | P24 | 5.97 | P16 | 7.82 |
| 10 | P5 | 5.85 | P3 | 7.05 |
| 11 | P15 | 5.74 | P24 | 5.64 |
| 12 | P3 | 5.53 | P20 | 5.57 |
| 13 | P20 | 5.19 | P15 | 4.69 |
| 14 | P23 | 5.08 | P23 | 4.44 |
| 15 | P19 | 4.36 | P14 | 4.44 |
| 16 | P16 | 3.30 | P19 | 4.42 |
| No. | Dominant Limb | Non-Dominant Limb | ||
|---|---|---|---|---|
| Selected Parameters | Selected Parameters | |||
| 1 | P11 | 3.59 | P16 | 2.12 |
| 2 | P12 | 1.92 | P7 | 1.50 |
| 3 | P21 | 1.30 | P11 | 1.33 |
| 4 | P23 | 1.30 | P23 | 1.18 |
| 5 | P22 | 1.19 | P21 | 1.18 |
| 6 | P24 | 1.19 | P19 | 1.15 |
| 7 | P19 | 1.16 | P17 | 1.15 |
| 8 | P17 | 1.16 | P9 | 1.14 |
| 9 | P30 | 1.13 | P22 | 1.13 |
| 10 | P15 | 1.09 | P24 | 1.13 |
| 11 | P29 | 1.03 | P2 | 1.05 |
| 12 | P18 | 1.02 | P12 | 1.00 |
| 13 | P20 | 1.02 | P18 | 1.00 |
| 14 | P1 | 0.88 | P20 | 1.00 |
| 15 | P28 | 0.84 | P29 | 0.83 |
| 16 | P26 | 0.84 | P30 | 0.82 |
| Parameter | M1_R | M1_L | M2_R | M2_L | M3_R | M3_L | NRR | NRR Selected | Survey |
|---|---|---|---|---|---|---|---|---|---|
| P1 | ✓ | 1 | ✓ | ||||||
| P2 | ✓ | ✓ | 2 | ✓ | |||||
| P3 | ✓ | ✓ | ✓ | ✓ | 4 | ✓ | ✓ | ||
| P4 | ✓ | ✓ | ✓ | ✓ | 4 | ✓ | ✓ | ||
| P5 | ✓ | ✓ | ✓ | 3 | ✓ | ||||
| P6 | ✓ | ✓ | ✓ | 3 | ✓ | ✓ | |||
| P7 | ✓ | ✓ | ✓ | ✓ | 4 | ✓ | |||
| P8 | ✓ | ✓ | ✓ | 3 | ✓ | ✓ | |||
| P9 | ✓ | ✓ | ✓ | ✓ | 4 | ✓ | |||
| P10 | ✓ | ✓ | ✓ | 3 | ✓ | ✓ | |||
| P11 | ✓ | ✓ | ✓ | ✓ | ✓ | 5 | ✓ | ||
| P12 | ✓ | ✓ | ✓ | ✓ | ✓ | ✓ | 6 | ✓ | ✓ |
| P13 | ✓ | 1 | |||||||
| P14 | ✓ | ✓ | ✓ | 3 | ✓ | ✓ | |||
| P15 | ✓ | ✓ | ✓ | 3 | ✓ | ||||
| P16 | ✓ | ✓ | ✓ | ✓ | 4 | ✓ | ✓ | ||
| P17 | ✓ | ✓ | ✓ | ✓ | 4 | ✓ | |||
| P18 | ✓ | ✓ | ✓ | ✓ | 4 | ✓ | ✓ | ||
| P19 | ✓ | ✓ | ✓ | ✓ | ✓ | ✓ | 6 | ✓ | |
| P20 | ✓ | ✓ | ✓ | ✓ | ✓ | ✓ | 6 | ✓ | ✓ |
| P21 | ✓ | ✓ | 2 | ||||||
| P22 | ✓ | ✓ | ✓ | ✓ | 4 | ✓ | ✓ | ||
| P23 | ✓ | ✓ | ✓ | ✓ | 4 | ✓ | |||
| P24 | ✓ | ✓ | ✓ | ✓ | ✓ | ✓ | 6 | ✓ | ✓ |
| P25 | 0 | ||||||||
| P26 | ✓ | 1 | |||||||
| P27 | 0 | ||||||||
| P28 | ✓ | 1 | ✓ | ||||||
| P29 | ✓ | ✓ | 2 | ✓ | |||||
| P30 | ✓ | ✓ | ✓ | 3 | ✓ | ✓ |
| No. | Parameter | Name of Parameter |
|---|---|---|
| 1 | P1 | Duration of the lifting phase t1 [s] |
| 2 | P2 | Duration of the lowering phase t2 [s] |
| 3 | P3 | Minimum flexion/extension angle of the shoulder joint |
| 4 | P4 | Maximum flexion/extension angle of the shoulder joint |
| 5 | P6 | Maximum abduction/adduction angle of the shoulder joint |
| 6 | P8 | Maximum external/internal rotation angle of the shoulder joint |
| 7 | P10 | Maximum flexion/extension angle of the elbow joint |
| 8 | P12 | Maximum supination/pronation angle of the elbow joint |
| 9 | P14 | Maximum palmar flexion/dorsiflexion angle of the wrist joint |
| 10 | P16 | Maximum elbow/radial abduction angle of the wrist joint |
| 11 | P18 | Maximum spine anteversion angle |
| 12 | P20 | Maximum spine rotation angle |
| 13 | P22 | Maximum spine anteversion angle in section Th1-Th12 |
| 14 | P24 | Maximum spine rotation angle in section Th1-Th12 |
| 15 | P29 | Abduction/adduction motion range of the shoulder joint |
| 16 | P30 | External/internal rotation motion range of the shoulder joint |
| Dominant Limb | Non-Dominant Limb | |
|---|---|---|
| mean ± std | 13.67 ± 2.40 | 13.71 ± 3.36 |
| min–max | 9.05–18.21 | 7.18–20.70 |
| Dominant Limb | Non-Dominant Limb | |
|---|---|---|
| mean ± std | 130.86 ± 75.07 | 155.58 ± 170.76 |
| min–max | 45.85–351.03 | 30.17–630.59 |
Publisher’s Note: MDPI stays neutral with regard to jurisdictional claims in published maps and institutional affiliations. |
© 2022 by the authors. Licensee MDPI, Basel, Switzerland. This article is an open access article distributed under the terms and conditions of the Creative Commons Attribution (CC BY) license (https://creativecommons.org/licenses/by/4.0/).
Share and Cite
Guzik-Kopyto, A.; Nowakowska-Lipiec, K.; Krysiak, M.; Jochymczyk-Woźniak, K.; Jurkojć, J.; Wodarski, P.; Gzik, M.; Michnik, R. Selection of Kinematic and Temporal Input Parameters to Define a Novel Upper Body Index Indicator for the Evaluation of Upper Limb Pathology. Appl. Sci. 2022, 12, 11634. https://doi.org/10.3390/app122211634
Guzik-Kopyto A, Nowakowska-Lipiec K, Krysiak M, Jochymczyk-Woźniak K, Jurkojć J, Wodarski P, Gzik M, Michnik R. Selection of Kinematic and Temporal Input Parameters to Define a Novel Upper Body Index Indicator for the Evaluation of Upper Limb Pathology. Applied Sciences. 2022; 12(22):11634. https://doi.org/10.3390/app122211634
Chicago/Turabian StyleGuzik-Kopyto, Agata, Katarzyna Nowakowska-Lipiec, Mikołaj Krysiak, Katarzyna Jochymczyk-Woźniak, Jacek Jurkojć, Piotr Wodarski, Marek Gzik, and Robert Michnik. 2022. "Selection of Kinematic and Temporal Input Parameters to Define a Novel Upper Body Index Indicator for the Evaluation of Upper Limb Pathology" Applied Sciences 12, no. 22: 11634. https://doi.org/10.3390/app122211634