
CORSIA Lower Carbon Aviation Fuels: An Assessment of the Greenhouse Gas Emission Reduction Potential


 and
and
Abstract
:1. Introduction
2. Materials and Methods
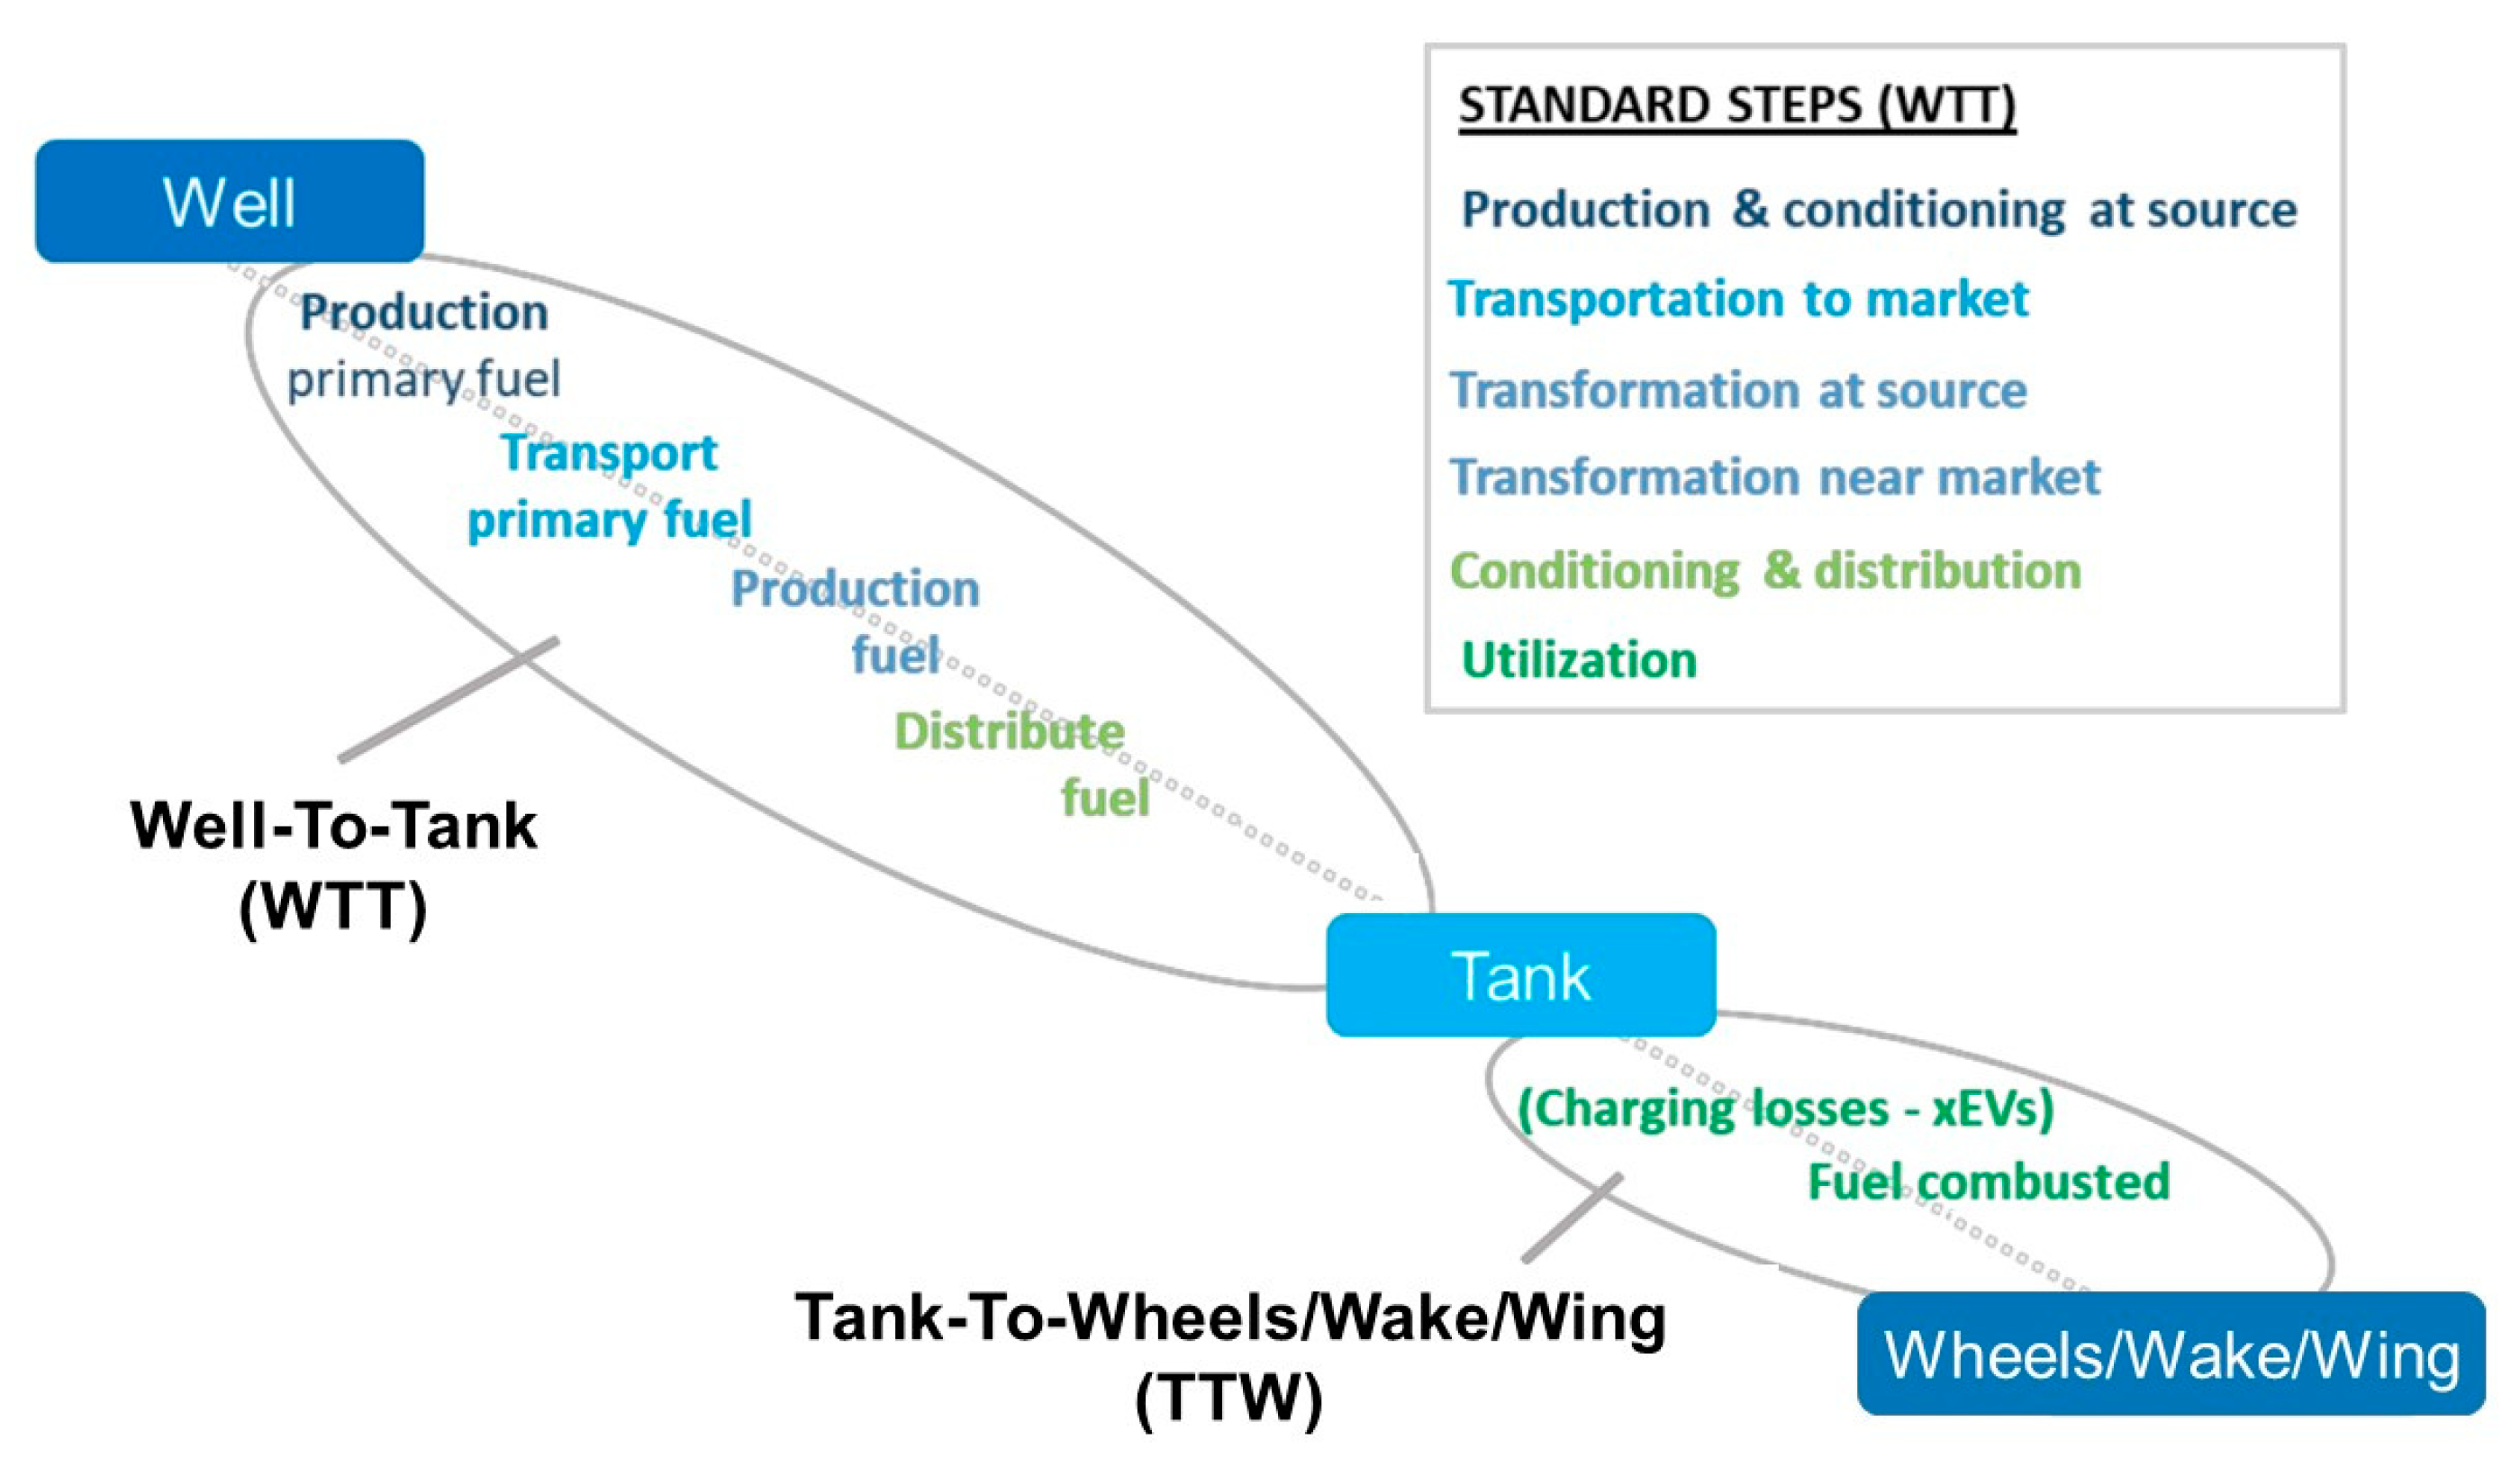
2.1. LCA and Methodological Choices
- Energy use to get the oil out of the formation and for pre-processing before shipment;
- Fugitive emissions of methane from process equipment via seals, purges, etc.;
- Deliberate venting of produced gases, where it is considered uneconomic to collect them;
- Flaring as an alternative to venting, as well as flaring at start-up/shutdown or as a part of the pressure relief system.
2.2. Production of Conventional Jet Fuel from Crude Oil
2.3. The GHG Intensity of Conventional Jet Fuel
- Upstream emissions: Emissions from crude production, from process energy use, flaring of produced gas and methane emissions from venting and fugitive sources. These are assumed to be independent of each other allowing the GHG intensity for the LCAF cases to be calculated simply by assuming a net reduction in upstream emissions.
- Refining emissions: Refinery GHG emissions, stemming from process energy use and from production of hydrogen, both of which are linked to the type and throughput of the process units within the refinery. These in turn depend on the type of crude-oil run by the refinery and the amount/properties of the products that the refinery is required to make. The supply of process energy includes refinery by-products (refinery fuel-gas; coke) supplemented by imports (natural gas; electricity; steam). Hydrogen is supplied partly as a by-product of catalytic reform to allow gasoline to be supplemented by imported hydrogen.
2.3.1. GHG Emissions from Upstream Activities
2.3.2. GHG Emissions from Downstream Activities
2.4. Identification of Levers for Reducing GHG Emissions
2.4.1. GHG Emissions Reduction from Upstream Activities
- Upstream energy efficiency improvements and use of renewable energy: IEA suggests that energy consumption represents approximately 27% of GHG of upstream emissions. These emissions could be reduced by:
- Implementing energy efficiency improvements, e.g., by using better/newer equipment and energy management;
- Replacing fossil energy with renewable power from the grid or generated locally or using renewable heat.
- Flaring reduction: Approximately 14% of upstream emissions arise from flaring operations. Factors for reducing flaring include [30]: better operational management, particularly during start-ups, shutdowns and upsets; flare gas recovery for re-injection as fuel or gas export; flare gas recovery for local conversion to syncrudes (e.g., a modular Fischer–Tropsch process). A complete ban on flaring is technically achievable, therefore the technical potential for GHG emissions reduction is 14%. There is a “Zero Routing Flaring by 2030” aspiration supported by the European Commission, oil majors and national governments, but specific targets and regulations vary between countries.
- Methane emissions reduction: Methane emissions are the main source of GHG emissions in upstream crude extraction and production. A weighted average of 59% of total emissions could be considered. Reducing methane emissions can be achieved by several actions: eliminating “economic” venting and replacing it with flaring; eliminating fugitive emissions, e.g., from seals and purges; improving operational practices to avoid gas release, e.g., during well completion. A complete reduction in these emissions is technically feasible; therefore, the maximum GHG reduction accounts for the 59% of upstream emissions.
2.4.2. GHG Emission Reduction Applied Refinery-Wide
- Refinery energy efficiency improvement: Refineries need energy for distillation, to drive endothermic chemical reactions and to power pumps, compressors, lighting, heating, etc. On average, the energy demand is broadly equivalent to 6–7% of the crude intake, but it could vary between 4–5% for a simple refinery and between 8–9% for a complex refinery with more energy-intensive processes [29]. Much of a refinery’s energy demand is satisfied by burning refinery by-products such as fuel-gas and low-value oils. Changes in product demand and product quality regulation impact both the refinery process intensity and energy use. Historically, the average energy efficiency of the EU refining industry has been improving by around 0.5% annually, driven by a combination of energy costs, national energy efficiency programs and carbon costs (e.g., under the EU ETS). Many of the lower-cost opportunities may have already been implemented, leaving only the more challenging and expensive options. However, there is still potential for efficiency improvements by 2050; limited by refinery design and economical deployment, this study assumes that 22% improvement might be technically feasible by 2050 [29].
- Renewable energy use: There are several ways in which renewable energy might be used to provide power and heat in a refinery; for instance, imported fossil power could be replaced by imported low-carbon power, either through decarbonisation of the electricity grid or by a dedicated low-carbon power source. Imported natural gas or fuel oil used to provide fired heat could be replaced by low-carbon fuels (e.g., biogas, low-carbon hydrogen). Conventional heaters fired using hydrocarbon fuels could be replaced by electrical heaters using low carbon electricity. The technical potential for the use of renewable energy assumes that all energy inputs other than those linked to unavoidable self-produced gas and FCC coke are replaced by zero-carbon energy. The technical limit for the average EU refinery to reduce CO2 emissions by using renewable energy imports is roughly one-third.
- Refinery Carbon Capture and Storage (CCS): Nearly all a refinery’s direct CO2 emissions could be captured, but implementation is hampered by the wide range of CO2 sources in a refinery. This leads to either a multitude of CO2 capture plants and large amounts of CO2 pipework, or a large amount of infrastructure to gather flue gases for a centralised refinery capture unit [29,34]. While 100% of refinery CO2 emissions could be captured (including all of the emissions associated with running the capture plant), a lower level of CO2 capture would be expected. The JRC report [19] considers that CCS reduces the GHG intensity of SMR hydrogen from 104 to 39.7 gCO2eq/MJ H2—70% mitigation. This paper considers two CCS lever cases: in the first case the refinery deploys site-wide CCS but continues to import hydrogen without CCS; in the second case the refinery has its own SMR unit that is included within the site-wide CCS; the providers of imported electricity and steam are assumed not to have CCS in both cases. These two cases lead to a 64% and 83% reduction in refinery CO2 emissions, respectively. The reductions in refinery emissions have been used to adjust the overall WTW emissions, leading to overall potential for reduction of 4.6 and 5.7 gCO2eq/MJ jet fuel for the two CCS lever cases, or reductions of 4.0 and 5.3%, respectively.
- Large-scale low carbon hydrogen: Hydrogen is used extensively in refineries for hydrodesulphurisation and hydrocracking, so the demand depends on the type of refinery and sulphur content in the processed crudes. Hydrogen production currently accounts for around 19% of refining emissions, which is expected to rise to as much as 30% by 2030 due to growing demand for hydrogen. The opportunities for local production of low-carbon hydrogen include onsite electrolysis using imported low-carbon electricity and importing third-party low-carbon hydrogen produced either by (a) steam methane reforming (SMR) of natural gas with CCS or (b) electrolysis. SMR with CCS is a known concept, but despite the fact that SMR is the main route nowadays to hydrogen production [35], CCS continues to represent a huge barrier to widespread deployment for SMR with CCS. Renewable hydrogen production is rapidly getting momentum, driven by several policy initiatives [36], but several technical and non-technical barriers regarding its production are still yet to be overcome. The technical limit of this lever is the fraction of a refinery’s hydrogen supply that is made on purpose, i.e., in an SMR. On average, this fraction is between 50–60% of the total hydrogen demand, which makes up 19% of total refinery CO2 emissions. All on purpose hydrogen can be supplied as zero-carbon energy using either SMR with full carbon capture (100%) or electrolysis using renewable electricity. As a result, refined GHG emissions could be reduced by 19% compared to the base case. This reduction in refining emissions is applied to the full WTW distribution, showing an overall potential for reduction of 1 gCO2eq/MJ jet fuel or 1.0%.
2.4.3. GHG Emission Reduction Applied Specifically to Kerosene Production at Refinery Level
2.4.4. Methodological Frame and Results Boundaries
3. Results
3.1. Upstream GHG Emissions Reduction Levers
3.2. Refinery GHG Emissions Reduction Levers
3.3. Jet Fuel-Specific GHG Emissions Reduction Levers
3.4. Summary of the Potential GHG Emission Reductions
4. Discussion
5. Conclusions
- Upstream emissions account for 53% of WTT emissions and comprise flaring, energy use and methane emissions. Of the three, methane emissions contribute most significantly to upstream emissions and therefore have the greatest potential for emissions reduction. There are a range of measures that can be implemented to reduce emissions, some of which relate to new technologies or use of low-carbon energy sources whilst others are more focussed on changes to operation management, e.g., elimination of economic venting of methane.
- Refining emissions account for 38% of WTT emissions. At this level, several actions can be considered for reducing emissions: energy efficiency improvements, renewable energy, low-carbon hydrogen and CCS, which in theory have the technical potential to mitigate almost all of a refinery’s carbon emissions; exceptions might include short-term flaring for safety reasons. Considering the technical potential of these levers, it was found that CCS has the greatest potential to reduce refining emissions but faces a number of technical and financial barriers to wide-scale deployment.
Author Contributions
Funding
Informed Consent Statement
Conflicts of Interest
Disclaimer
Abbreviations
| CCS | Carbon capture and storage |
| CEF | CORSIA-Eligible Fuels |
| CI | Carbon intensity |
| CORSIA | Carbon Offsetting and Reduction Scheme for International Aviation |
| EC | European Commission |
| EOR | Enhanced oil recovery |
| EU | European Union |
| FCC | Fluid catalytic cracking |
| GHG | Greenhouse gas |
| ILUC | Indirect land use change |
| ICAO | International Civil Aviation Organization |
| KHT | Kerosene hydrotreating |
| LCA | Lifecycle assessment |
| LCAFs | Lower carbon aviation fuels |
| LPG | Liquefied petroleum gas |
| OGCI | Oil and Gas Climate Initiative |
| RED | Renewable Energy Directive |
| SAFs | Sustainable aviation fuels |
| SMR | Steam methane reforming |
| TTW | Tank-to-wheel/wake/wing |
| WTT | Well-to-tank |
| WTW | Well-to-wheel |
References
- Eurostat. Energy, Transport and Environment Indicators; Eurostat: Luxembourg, 2017; ISBN 978-92-76-20736-8. [Google Scholar]
- EASA. European Aviation Environmental Report; EASA: Cologne, Germany, 2022. [Google Scholar] [CrossRef]
- EASA. European Aviation Environmental Report 2019; EASA: Cologne, Germany, 2019. [Google Scholar] [CrossRef]
- EC. Sustainable and Smart Mobility Strategy—Putting European Transport on Track for the Future; COM(2020) 789 final; European Commission: Luxembourg, 2020. [Google Scholar]
- Chiaramonti, D.; Talluri, G.; Scarlat, N.; Prussi, M. The challenge of forecasting the role of biofuel in EU transport decarbonisation at 2050: A meta-analysis review of published scenarios. Renew. Sustain. Energy Rev. 2021, 139, 110715. [Google Scholar] [CrossRef]
- ICAO. Carbon Offsetting and Reduction Scheme for International Aviation (CORSIA); ICAO: Montreal, ON, Canada; Available online: https://www.icao.int/environmental-protection/CORSIA/pages/default.aspx (accessed on 20 June 2022).
- ICAO. CORSIA Sustainability Criteria for CORSIA Eligible Fuels. International Civil Aviation Organization. 2021. Available online: https://www.icao.int/environmental-protection/CORSIA/Documents/ICAO%20document%2005%20-%20Sustainability%20Criteria%20-%20November%202021.pdf (accessed on 20 June 2022).
- ICAO. CORSIA Default Life Cycle Emisssions Values for CORSIA Eligible Fuels; International Civil Aviation Organization: Montreal, ON, Canada, 2022; Available online: https://www.icao.int/environmental-protection/CORSIA/Documents/CORSIA_Eligible_Fuels/ICAO%20document%2006%20-%20Default%20Life%20Cycle%20Emissions%20-%20June%202022.pdf (accessed on 5 September 2022).
- CORSIA. Guidance to Sustainability Certification Schemes (SCS) for application of CORSIA Sustainability Criteria, Themes 3 to 7, for CORSIA Sustainable Aviation Fuel Produced on or after 1 January 2024. Available online: https://www.icao.int/environmental-protection/CORSIA/Documents/Guidance%20on%20Sustainability%20Themes%203-7.pdf (accessed on 20 June 2022).
- ICAO. CORSIA Methodology for Calculating Actual Life Cycle Emissions Values; International Civil Aviation Organization: Montreal, ON, Canada, 2021; Available online: https://www.icao.int/environmental-protection/CORSIA/Documents/CORSIA_Eligible_Fuels/ICAO%20document%2007%20-%20Methodology%20for%20Actual%20Life%20Cycle%20Emissions%20-%20June%202022.pdf (accessed on 5 September 2022).
- Prussi, M.; Lee, U.; Wang, M.; Malina, R.; Valin, H.; Taheripour, F.; Velarde, C.; Staples, M.D.; Lonza, L.; Hileman, J.I. CORSIA: The first internationally adopted approach to calculate life-cycle GHG emissions for aviation fuels. Renew. Sustain. Energy Rev. 2021, 150, 111398. [Google Scholar] [CrossRef]
- Hu, Y.J.; Yang, L.; Cui, H.; Wang, H.; Li, C.; Tang, B.J. Strategies to Mitigate Carbon Emissions for Sustainable Aviation: A Critical Review from a Life-cycle Perspective. Sustain. Prod. Consum. 2022, 33, 788–808. [Google Scholar] [CrossRef]
- Timmons, D.; Terwel, R. Economics of aviation fuel decarbonization: A preliminary assessment. J. Clean. Prod. 2021, 369, 133097. [Google Scholar] [CrossRef]
- Shahriar, F.; Khanal, A. The current techno-economic, environmental, policy status and perspectives of sustainable aviation fuel (SAF). Fuel 2022, 325, 124905. [Google Scholar] [CrossRef]
- Mussatto, S.I.; Motta, I.L.; Maciel Filho, R.; van der Wielen, L.; Capaz, R.; Seabra, J.; Osseweijer, P.; Posada, J.A.; Goncalves, M.; Scorza, P.R.; et al. Sustainable Aviation Fuels: Production, Use and Impact on Decarbonization. In Comprehensive Renewable Energy, 2nd ed.; Letcher, T.M., Ed.; Elsevier: Amsterdam, The Netherlands, 2022; pp. 348–371. [Google Scholar]
- Prussi, M.; O’Connell, A.; Lonza, L. Analysis of current aviation biofuel technical production potential in EU28. Biomass Bioenergy 2019, 130, 105371. [Google Scholar] [CrossRef]
- Chiaramonti, D.; Taluri, G.; Vourliotakis, G.; Testa, L.; Prussi, M.; Scarlat, N. Can Lower Carbon Aviation Fuels (LCAF) Really Complement Sustainable Aviation Fuel (SAF) towards EU Aviation Decarbonization? Energies 2021, 14, 6430. [Google Scholar] [CrossRef]
- EC. Directive (EU) 2018/2001 on the Promotion of the Use of Energy from Renewable Sources (Recast); European Commission: Luxembourg, 2018. [Google Scholar]
- Prussi, M.; Yugo, M.; De Prada, L.; Padella, M.; Edwards, R.; Lonza, L. JEC Well-to-Tank Report v5. 2020. Available online: https://op.europa.eu/en/publication-detail/-/publication/a857087a-fe0c-11ea-b44f-01aa75ed71a1/language-en (accessed on 20 June 2022).
- Huss, A. JEC Tank-to-Wheels Report v5: Passenger Cars. 2020. Available online: https://op.europa.eu/en/publication-detail/-/publication/13db0e2b-feda-11ea-b44f-01aa75ed71a1/language-en (accessed on 20 June 2022).
- Eurostat. Oil and Petroleum Products—A Statistical Overview. Available online: https://ec.europa.eu/eurostat/statistics-explained/index.php?title=Oil_and_petroleum_products_-_a_statistical_overview (accessed on 20 June 2022).
- Masnadi, M.; Al, E. Global carbon intensity of crude oil production. Science 2018, 361, 6405. [Google Scholar] [CrossRef] [PubMed]
- FuelsEurope. Statistical Report 2022. Available online: https://www.fuelseurope.eu/uploads/files/modules/publications/1664962555_DEF_FE_2022SR_LR.pdf (accessed on 20 June 2022).
- OGJ. 2021 Worldwide Refining Capacity Summary. Available online: https://www.ogj.com/ogj-survey-downloads/worldwide-refining (accessed on 20 June 2022).
- McKinsey. European Refineries. 2020. Available online: https://www.mckinseyenergyinsights.com/resources/refinery-reference-desk/# (accessed on 20 June 2022).
- ICAO. CORSIA SARPS. Annex 16, Volume IV. 2018. Available online: https://www.icao.int/environmental-protection/CORSIA/Pages/SARPs-Annex-16-Volume-IV.aspx (accessed on 20 June 2022).
- CONCAWE. Estimating the Marginal CO2 Footprints of Refinery Products. Report no. 1/17. Brussels, Belgium. 2017. Available online: https://www.concawe.eu/wp-content/uploads/2017/04/Rpt_17-1-1.pdf (accessed on 20 June 2022).
- IEA. Methane Tracker 2020. Available online: https://www.iea.org/reports/methane-tracker-2020/methane-from-oil-gas (accessed on 20 June 2022).
- CONCAWE. CO2 Reduction Technologies. Opportunities within the EU Refining System (2030/2050). 2019. Available online: https://www.concawe.eu/wp-content/uploads/Rpt_19-8.pdf (accessed on 20 June 2022).
- IPIECA. Green Completion. 2014. Available online: https://www.ipieca.org/resources/energy-efficiency-solutions/units-and-plants-practices/green-completions/ (accessed on 20 June 2022).
- DECC. Optimization of CO2 Storage in CO2 Enhanced Oil Recovery Projects. 2010. Available online: https://assets.publishing.service.gov.uk/government/uploads/system/uploads/attachment_data/file/47992/1006-optimization-of-co2-storage-in-co2-enhanced-oil-re.pdf (accessed on 20 June 2022).
- NETL. Carbon Dioxide Enhanced Oil Recovery. 2010. Available online: https://www.netl.doe.gov/sites/default/files/netl-file/co2_eor_primer.pdf (accessed on 20 June 2022).
- NREL. Enhanced Oil Recovery. 2020. Available online: https://www.energy.gov/fe/science-innovation/oil-gas-research/enhanced-oil-recovery (accessed on 20 June 2022).
- IEAGHG. Understanding the Cost of Retrofitting CO2 Capture in an Integrated Oil Refinery. 2017. Available online: https://www.sintef.no/globalassets/project/recap/2017-tr8-recap-project.pdf (accessed on 20 June 2022).
- Younas, M.; Shafique, S.; Hafeez, A.; Javed, F.; Rehman, F. An Overview of Hydrogen Production: Current Status, Potential, and Challenges. Fuel 2022, 316, 123317. [Google Scholar] [CrossRef]
- EC. A Hydrogen Strategy for a Climate-Neutral Europe; Communication from the Commission to the European Parliament, the Council, the European Economic and Social Committee and the Committee of the Regions; COM (2020) 301 Final; European Commission: Luxembourg, 2020. [Google Scholar]
- Clean Hydrogen Partnership. Projects Repository. 2022. Available online: https://www.clean-hydrogen.europa.eu/projects-repository_en?page=28 (accessed on 20 February 2010).
- Hydrogen Europe. Path to Hydrogen Competitiveness: A Cost Perspective. 2020. Available online: https://hydrogencouncil.com/wp-content/uploads/2020/01/Path-to-Hydrogen-Competitiveness_Full-Study-1.pdf (accessed on 20 June 2022).
- Ma, J.; Li, L.; Wang, H.; Du, Y.; Ma, J.; Zhang, X. Carbon Capture and Storage: History and the Road Ahead. Engineering 2022, 14, 33–43. [Google Scholar] [CrossRef]
- Holz, F.; Scherwath, T.; del Granado, P.C.; Skar, C.; Olmos, L.; Ploussard, Q.; Ramos, A.; Herbst, A. A 2050 perspective on the role for carbon capture and storage in the European power system and industry sector. Energy Econ. 2021, 104, 105631. [Google Scholar] [CrossRef]
- Hong, W.Y. Carbon Capture Science & Technology A techno-economic review on carbon capture, utilisation and storage systems for achieving a net-zero CO2 emissions future. Carbon Capture Sci. Technol. 2022, 3, 100044. [Google Scholar] [CrossRef]


| Product WTW | Diesel (gCO2eq/MJdiesel) | Gasoline (gCO2eq/MJgasoline) | Jet Fuel (gCO2eq/MJjetfuel) |
|---|---|---|---|
| Production at source (crude production emissions) | 10.0 | 9.6 | 8.4 |
| Transport to market | 0.8 | 0.8 | 0.6 |
| Transformation in market (refining emissions) | 7.2 | 5.5 | 6.0 |
| Distribution in market | 0.9 | 1.0 | 0.8 |
| WTT emissions | 18.9 | 16.9 | 15.8 |
| Combustion (TTW emissions) | 73.2 | 73.3 | 73.2 |
| WTW emissions | 92.1 | 90.2 | 89.0 |
| % of GHG Emissions | TOTAL | Q1 | Q2 | Q3 | Q4 |
|---|---|---|---|---|---|
| Energy use | 27 | 28 | 32 | 22 | 27 |
| Flaring | 14 | 14 | 7 | 19 | 14 |
| Methane emissions | 59 | 57 | 61 | 58 | 58 |
| Energy Source (EU Aggregate) | % of CO2 Emissions | % |
|---|---|---|
| Manufactured H2 | 19 | 19 |
| Purchased natural gas | 14 | 29 |
| Purchased steam | 4 | |
| Purchased power | 11 | |
| Self-produced fuel gas | 32 | 50 |
| Self-produced liquid fuels | 5 | |
| FCC coke | 13 | |
| Other | 2 | 2 |
| Product WTW (gCO2eq/MJ) | Base Case | Energy Efficiency Improvements | Flare Reduction | Methane Control |
|---|---|---|---|---|
| Crude production | 8.4 | 6.1 | 7.2 | 3.4 |
| Crude transport to market | 0.6 | 0.6 | 0.6 | 0.6 |
| Refining | 6.0 | 6.0 | 6.0 | 6.0 |
| Product distribution | 0.8 | 0.8 | 0.8 | 0.8 |
| Combustion (TTW) | 73.2 | 73.2 | 73.2 | 73.2 |
| Total WTW | 89.0 | 86.7 | 87.8 | 84.0 |
| Technical potential for GHG reduction | - | 2.6% | 1.3% | 5.6% |
| Product WTW (gCO2eq/MJ) | Base Case | Refinery Energy Efficiency | Renewable Energy | CCS Excl. H2 Production | CCS INCL. H2 Production | Low-Carbon H2 |
|---|---|---|---|---|---|---|
| Crude production | 8.4 | 8.4 | 8.4 | 8.4 | 8.4 | 8.4 |
| Crude transport to market | 0.6 | 0.6 | 0.6 | 0.6 | 0.6 | 0.6 |
| Refining | 6.0 | 4.7 | 4.0 | 2.2 | 1.0 | 4.9 |
| Product distribution | 0.8 | 0.8 | 0.8 | 0.8 | 0.8 | 0.8 |
| Combustion (TTW) | 73.2 | 73.2 | 73.2 | 73.2 | 73.2 | 73.2 |
| Total WTW | 89.0 | 87.7 | 87.0 | 85.1 | 84.0 | 87.9 |
| % technical limit for reduction | - | 1.5% | 2.2% | 4.3% | 5.6% | 1.3% |
| Product WTW (gCO2eq/MJ) | Base Case | SMR-CCS H2 to KHT | Electrolyser H2 to KHT | Renewable Power to KHT | Alternative Desulphurisation |
|---|---|---|---|---|---|
| Crude production | 8.4 | 8.4 | 8.4 | 8.4 | 8.4 |
| Crude transport | 0.6 | 0.6 | 0.6 | 0.6 | 0.6 |
| Refining | 6.0 | 5.3 | 5.3 | 5.4 | 4.7 |
| Product distribution | 0.8 | 0.8 | 0.8 | 0.8 | 0.8 |
| Combustion | 73.2 | 73.2 | 73.2 | 73.2 | 73.2 |
| Total WTW | 89.0 | 88.3 | 88.3 | 88.4 | 87.6 |
| % technical potential for reduction | - | 0.8% | 0.8% | 0.7% | 1.5% |
| Lever | WTW Emissions (gCO2eq/MJ) | % Technical Potential for Reduction | |
|---|---|---|---|
| Base Case | 89.0 | - | |
| Upstream levers | Energy use | 86.7 | 2.6% |
| Flaring reduction | 87.8 | 1.3% | |
| Methane emissions control | 84.0 | 5.6% | |
| Refinery-wide levers | Energy efficiency improvements | 87.7 | 1.5% |
| Renewable energy | 87.0 | 2.2% | |
| Refinery-wide CCS excl. H2 production | 85.1 | 4.3% | |
| Refinery-wide CCS incl. H2 production | 84.0 | 5.6% | |
| Use of low-carbon hydrogen | 87.9 | 1.3% | |
| Jet fuel-specific levers | Use of low-carbon hydrogen in KHT (SMR-CCS or electrolyser H2) | 88.3 | 0.8% |
| Use of renewable power in KHT | 88.4 | 0.7% | |
| Alternative desulphurisation | 87.6 | 1.5% | |
Publisher’s Note: MDPI stays neutral with regard to jurisdictional claims in published maps and institutional affiliations. |
© 2022 by the authors. Licensee MDPI, Basel, Switzerland. This article is an open access article distributed under the terms and conditions of the Creative Commons Attribution (CC BY) license (https://creativecommons.org/licenses/by/4.0/).
Share and Cite
Bauen, A.; Harris, A.; Sim, C.; Gudde, N.; Prussi, M.; Scarlat, N. CORSIA Lower Carbon Aviation Fuels: An Assessment of the Greenhouse Gas Emission Reduction Potential. Appl. Sci. 2022, 12, 11818. https://doi.org/10.3390/app122211818
Bauen A, Harris A, Sim C, Gudde N, Prussi M, Scarlat N. CORSIA Lower Carbon Aviation Fuels: An Assessment of the Greenhouse Gas Emission Reduction Potential. Applied Sciences. 2022; 12(22):11818. https://doi.org/10.3390/app122211818
Chicago/Turabian StyleBauen, Ausilio, Anisha Harris, Christopher Sim, Nick Gudde, Matteo Prussi, and Nicolae Scarlat. 2022. "CORSIA Lower Carbon Aviation Fuels: An Assessment of the Greenhouse Gas Emission Reduction Potential" Applied Sciences 12, no. 22: 11818. https://doi.org/10.3390/app122211818
APA StyleBauen, A., Harris, A., Sim, C., Gudde, N., Prussi, M., & Scarlat, N. (2022). CORSIA Lower Carbon Aviation Fuels: An Assessment of the Greenhouse Gas Emission Reduction Potential. Applied Sciences, 12(22), 11818. https://doi.org/10.3390/app122211818