1. Introduction
Petroleum refining economics favor increased production of light oil products (boiling below 360 °C) at the expense of decreased production of heavy oils (boiling above 360 °C) [
1,
2]. The yields of light oil products depend not only on the characteristics of the crude oil processed and the conversion level in the heavy oil conversion units, such as fluid catalytic cracking, hydrocracking, and thermal cracking (visbreaking, or coking), but also on the efficiency of the distillation columns separating the light oils from the heavy oils [
3,
4,
5,
6]. The efficiency of the distillation column performance is typically controlled by examination of the amount of light oil content remaining in the heavy oil and the amount of heavy oil remaining in the light oil [
7]. This is carried out by laboratory distillation tests following the ASTM standards of the distillation column products. Over the years, gas chromatography (GC) simulated distillation methods have found widespread application in the refining industry to help control the quality of fractionation taking place in commercial oil refining distillation columns, especially in those which fractionate mixtures containing heavy oils [
8,
9,
10,
11,
12,
13,
14,
15,
16,
17,
18,
19,
20,
21,
22,
23]. Because of their greater precision, lower cost per sample, reduced manual work, and safer process, simulated distillation methods replaced the physical vacuum distillation methods ASTM D 1160 and ASTM D 5236 [
20]. Nevertheless, the suppliers of simulated distillation gas chromatography equipment provide correlations to convert the simulated distillation data into the physical distillation methods ASTM D 86 and ASTM D 1160 for more convenient use by the refiners. While the GC simulated distillation ASTM D 2887 was proved to be equivalent to the true boiling point (TBP) distillation according to the standard ASTM D 2892 [
24] for light oils, the high temperature simulated distillation HTSD (ASTM D 7169) has not yet proved its equivalency to the TBP distillation for heavy oils. The different boiling point distributions reported by the HTSD and the ASTM D 1160 raise the following question: which distillation method provides more reliable and valid information about the remaining amount of the more valuable light oil in the less valuable heavy oil?
Figure 1 illustrates the lower yield of diesel fraction in samples of heavy oils (atmospheric residue, straight run vacuum distillate, hydrotreated vacuum distillate, H-Oil heavy atmospheric gas oil (HAGO), light vacuum gas oil (LVGO), heavy vacuum gas oil (HVGO), and fluid catalytic cracking (FCC) feed hydrotreater diesel fraction when the ASTM D 1160 method is used.
Understandably, the question arises whether it is possible to extract more diesel from the heavy oils. If one uses the ASTM D 1160 distillation data, the answer to this question could be no, but if the ASTM D 7169 is used, the answer could be yes. Another important question, which is also related to the evaluation of the feasibility to extract more diesel fraction from the heavy oil products, is which distillation data should be used in the process of the commercial distillation column performance simulation? Kaes [
25], for example, recommends the use of the ASTM D 1160 standard to characterize heavy oils instead of the simulation distillation in process simulation. While, Golden et al. [
26,
27,
28] strongly recommend the employment of ASTM D 7169 when commercial distillation column operation simulation is concerned. A commercial distillation test at an operating distillation column separating mixtures containing heavy oils and simulation of its performance by a software process simulator may give an answer which laboratory distillation method ASTM D 7169 or ASTM D 1160 reports the correct value for the heavy oil diesel fraction content. For that reason, a commercial test at a FCC feed hydrotreater main fractionator was organized and performed in which the heavy oil streams were characterized by ASTM D 7169 and ASTM D 1160 methods. A simulation of the FCC feed hydrotreater main fractionator operation was carried out using a software process simulator and both ASTM D 7169, andASTM D 1160 distillation data.
The aim of this research is to verify which method: the ASTM D 7169 or ASTM D 1160, provides more reliable and valid information about the distillation characteristics of heavy oils, which can be used to optimize the process of extraction of the more valuable diesel fraction from heavy oils.
2. Materials and Methods
2.1. Materials and Laboratory Tests
Heavy atmospheric gas oil (HAGO), light vacuum gas oil (LVGO), and heavy vacuum gas oil (HVGO) from a commercial H-Oil ebullated bed vacuum residue hydrocracker with property range of variation shown in our recent research [
29] were subject to ASTM D 7169 and ASTM D 1160 distillation analysis. Besides, straight run vacuum distillate, stabilized hydrotreated vacuum distillate, and diesel fraction from a FCC feed hydrotreater were also subject to ASTM D 7169 [
30] and ASTM D 1160 [
31] distillation analysis. Density at 15 °C of the studied oils was measured in accordance to ASTM D 4052 method [
32].
The physical vacuum distillation analyses were carried out in Euro Dist MPS (ROFA) according to ASTM D-1160 requirements. The pressure in the Euro Dist MPS ASTM D-1160 apparatus during the whole analysis was 1 mm Hg.
The HTSD analyses were carried out with the Agilent Technologies GC System 7890B, which was equipped with FID (flame ionization detector). Liquid nitrogen was used as a coolant. The carrier gas was helium with 99.9999% purity (14 mL/min), the inlet pressure was 1.2 psi (8.27 kPa) with the total flow equal to 87 mL/min. Hydrogen was used as a fuel gas (40 mL/min) and nitrogen was a makeup gas (15 mL/min), both with high purity (99.999%). The installed column was 5 m long, 530 μm in diameter and the film thickness was 0.15 μm. The oven operated under the program from −20 °C to 430 °C at a ramp rate of 15 °C/min and a 4 min hold time at the maximum temperature. The injector was programmed to operate from 50 °C to 450 °C, at a rate of 15 °C/min, injected sample volume was 4 μL. Before the simulated distillation analyses of the studied oil samples they were stirred preliminary, accurately weighted to achieve 2 weight percent of studied oils dissolved in carbon disulphide (0.03 g of the sample dissolved in 1.5 mL CS2 (99.9%)). All prepared samples were stored at a temperature around 4 °C prior to analyses. The simulated distillation characteristics were automatically calculated by the SIMDIS software and the distillation curve boiling point in °C versus evaporate in wt.% was obtained. Minor intervention of the operator took place during the chromatograms processing. The HTSD GC was calibrated with a blend of normal paraffins having a carbon number between C5 and C120. The software (GC OpenLab CDS with Simdis program for ASTM D-7169) used in this application of HTSD allows estimating of the final boiling point of the residual oils higher than 750 °C.
The repeatability of both studied laboratory distillation methods ASTM D 7169 and ASTM D 1160 applied to the H-Oil heavy distillates investigated in this work are summarized in
Table 1. The data in
Table 1 also include the costs of performance of a single analysis by both methods, expressed in USD.
2.2. Commercial Distillation Test
The commercial test was carried out at the LUKOIL Neftohim Burgas (LNB) fluid catalytic cracking (FCC) complex unit. It consists of feed hydrotreating, FCC reactor-regenerator and fractionation sections. A process diagram of the LNB FCC complex is presented in
Figure 2. More details about the LNB FCC complex unit is presented in our earlier research [
33].
The commercial test consisted in processing of a definite quantity of a blend from H-Oil heavy atmospheric gas oil, light, and heavy vacuum gas oils which were characterized by the ASTM D 1160 method, and the ASTM D 7169 method in the stabilization column of the FCC feed hydrotreating section (see
Figure 2). The stabilization column of the FCC feed hydrotreating section has three beds filled with Sulzer structured packing and operates at an absolute pressure of 1.5 bars. It fractionates the reaction mixture leaving the FCCPT reactors into gas, naphtha, diesel, and stabilized hydrotreated vacuum gas oil (VGO). The diesel fraction is separated from the second packing bed and is stripped with steam in a stripping column as shown in
Figure 2. Two cases were studied in this work. The first one was that of the typical FCCPT stabilization column operation. The second one was that of the typical FCCPT stabilization column operation plus processing of additional 24.4 wt.% of H-Oil vacuum gas oils (of fresh FCCPT feed).
Figure 3 presents a flow chart describing the methodology and procedures to validate the diesel fraction content in H-Oil VGO measured by ASTM D 7169 and ASTM D 1160
Legend explanation:
G = content of diesel fraction, measured by ASTM D 7169, wt.%;
E = content of diesel fraction, measured by ASTM D 1160, vol.%
X = FCCPT fractionation section feed rate, t/h;
Y = FCCPT fractionation section diesel product rate, t/h;
Y + ΔY = FCCPT fractionation section diesel product rate when H-Oil VGO is processed, t/h;
Z = H-Oil VGO processed in FCCPT fractionation section, t/h;
B = H-Oil diesel flow rate estimated as a multiplication of H-Oil VGO flow rate by the content of diesel fraction, measured by ASTM D 7169, t/h;
C = H-Oil diesel flow rate estimated as a multiplication of H-Oil VGO flow rate by the content of diesel fraction, measured by ASTM D 1160, multiplied by the density of H-Oil diesel, t/h;
Comparison of ΔY with B, and C
If ΔY ≈ B (C), then ASTM D 7169 (ASTM D 1160) correctly quantifies diesel content in H-Oil VGO;
If ΔY > B (C), then ASTM D 7169 (ASTM D 1160) underestimates the diesel content in H-Oil VGO;
If ΔY < B (C), then ASTM D 7169 (ASTM D 1160) overestimates the diesel content in H-Oil VGO.
2.3. Commercial Distillation Process Simulation
A software process simulator was employed to simulate the FCCPT main fractionator operation for both cases using as input process stream characteristics those obtained by the ASTM D 1160, and the (ASTM D 7169 methods. All distillation curves were converted to True Boiling Point (TBP) curves using published in literature methods [
34,
35]. ASTM D86 distillation curves were converted with API Procedure 3A1.1 to TBP Curves [
34]. ASTM D1160 distillation data are entered as atmospheric pressure equivalent temperature curve (AET) and is converted to TBP using the procedure described in API Technical Data book [
35]. The ASTM D 2887 (simulated distillation) curve is converted by a two-step process—first to weight % ASTM D86 curve and then to TBP in accordance with the procedure described by Riazi [
34]. HTDS (ASTM D7169) distillation curves are entered as a weight % true boiling point curves for the lack of a correlation to convert it to TBP Curve. Standard methods were applied for the generation of the pseudo-components and their molecular weight, critical properties and physical properties: New API method (Riazi–Daubert extended method) for molecular weight prediction, API Method for critical properties prediction [
34].
Based on the measured flow rate of all outlet streams of the FCCPT stabilization column, the characteristics of the column inlet stream were obtained through summation. A simulation model was created for the stabilization section where the stabilization column is located. The Grayson–Streed equation [
36] was used for the phase equilibrium calculations and the Lee–Kesler equation [
37,
38] was used for the enthalpy calculations.
The simulation model was fine-tuned to match the instrument readings as close as possible. The instrument readings are from a snapshot of the FCCPT Stabilization Section actual operation at the moment the product samples were collected (usually at 8:00 am). The only variable that was left free was the flowrate of the diesel fraction from the side-stripper column K-102.
4. Discussion
The proper characterization of petroleum oils is important not only for distillation column design but also for correct evaluation of the existent separation equipment performance [
26,
27,
28]. Kaes [
25] states that an ASTM D 1160 apparatus can be used to extend the crude TBP data. He pointed out that the ASTM D 1160 distillation better approximates a TBP distillation because it is carried out under vacuum; can distill heavier materials than a TBP; much simpler to run than TBP; and it is the best test for refinery vacuum distillation unit calculations [
25]. Kaes considers the gas chromatographic simulated distillation method to be an unreliable method for conversion to TBP curve, and due to the fact that it derives the boiling data by using standard mixtures of n-paraffins, it is deemed to report inaccurate results for streams with significant aromatic content [
25].
Golden et al. [
26,
27,
28], however, argue that the use of the ASTM D 1160 method is worse than employing inaccurate TBP data in the design process of a vacuum distillation column. They conclude that few designers know the proper feed characterization techniques, including the use of a modern ASTM D 7169 chromatographic method. Golden et al. summarize that more than 50 vacuum distillation units have been field tested to confirm the validity of using ASTM D 7169 as a TBP curve to model crude and vacuum distillation unit operation [
35].
While Kaes [
25] seems to prefer using ASTM D 1160 for heavy oil characterization, Golden et al. [
26,
27,
28] categorically deny ASTM D 1160, and strongly recommend the use of ASTM D 7169 for characterization of heavy oils.
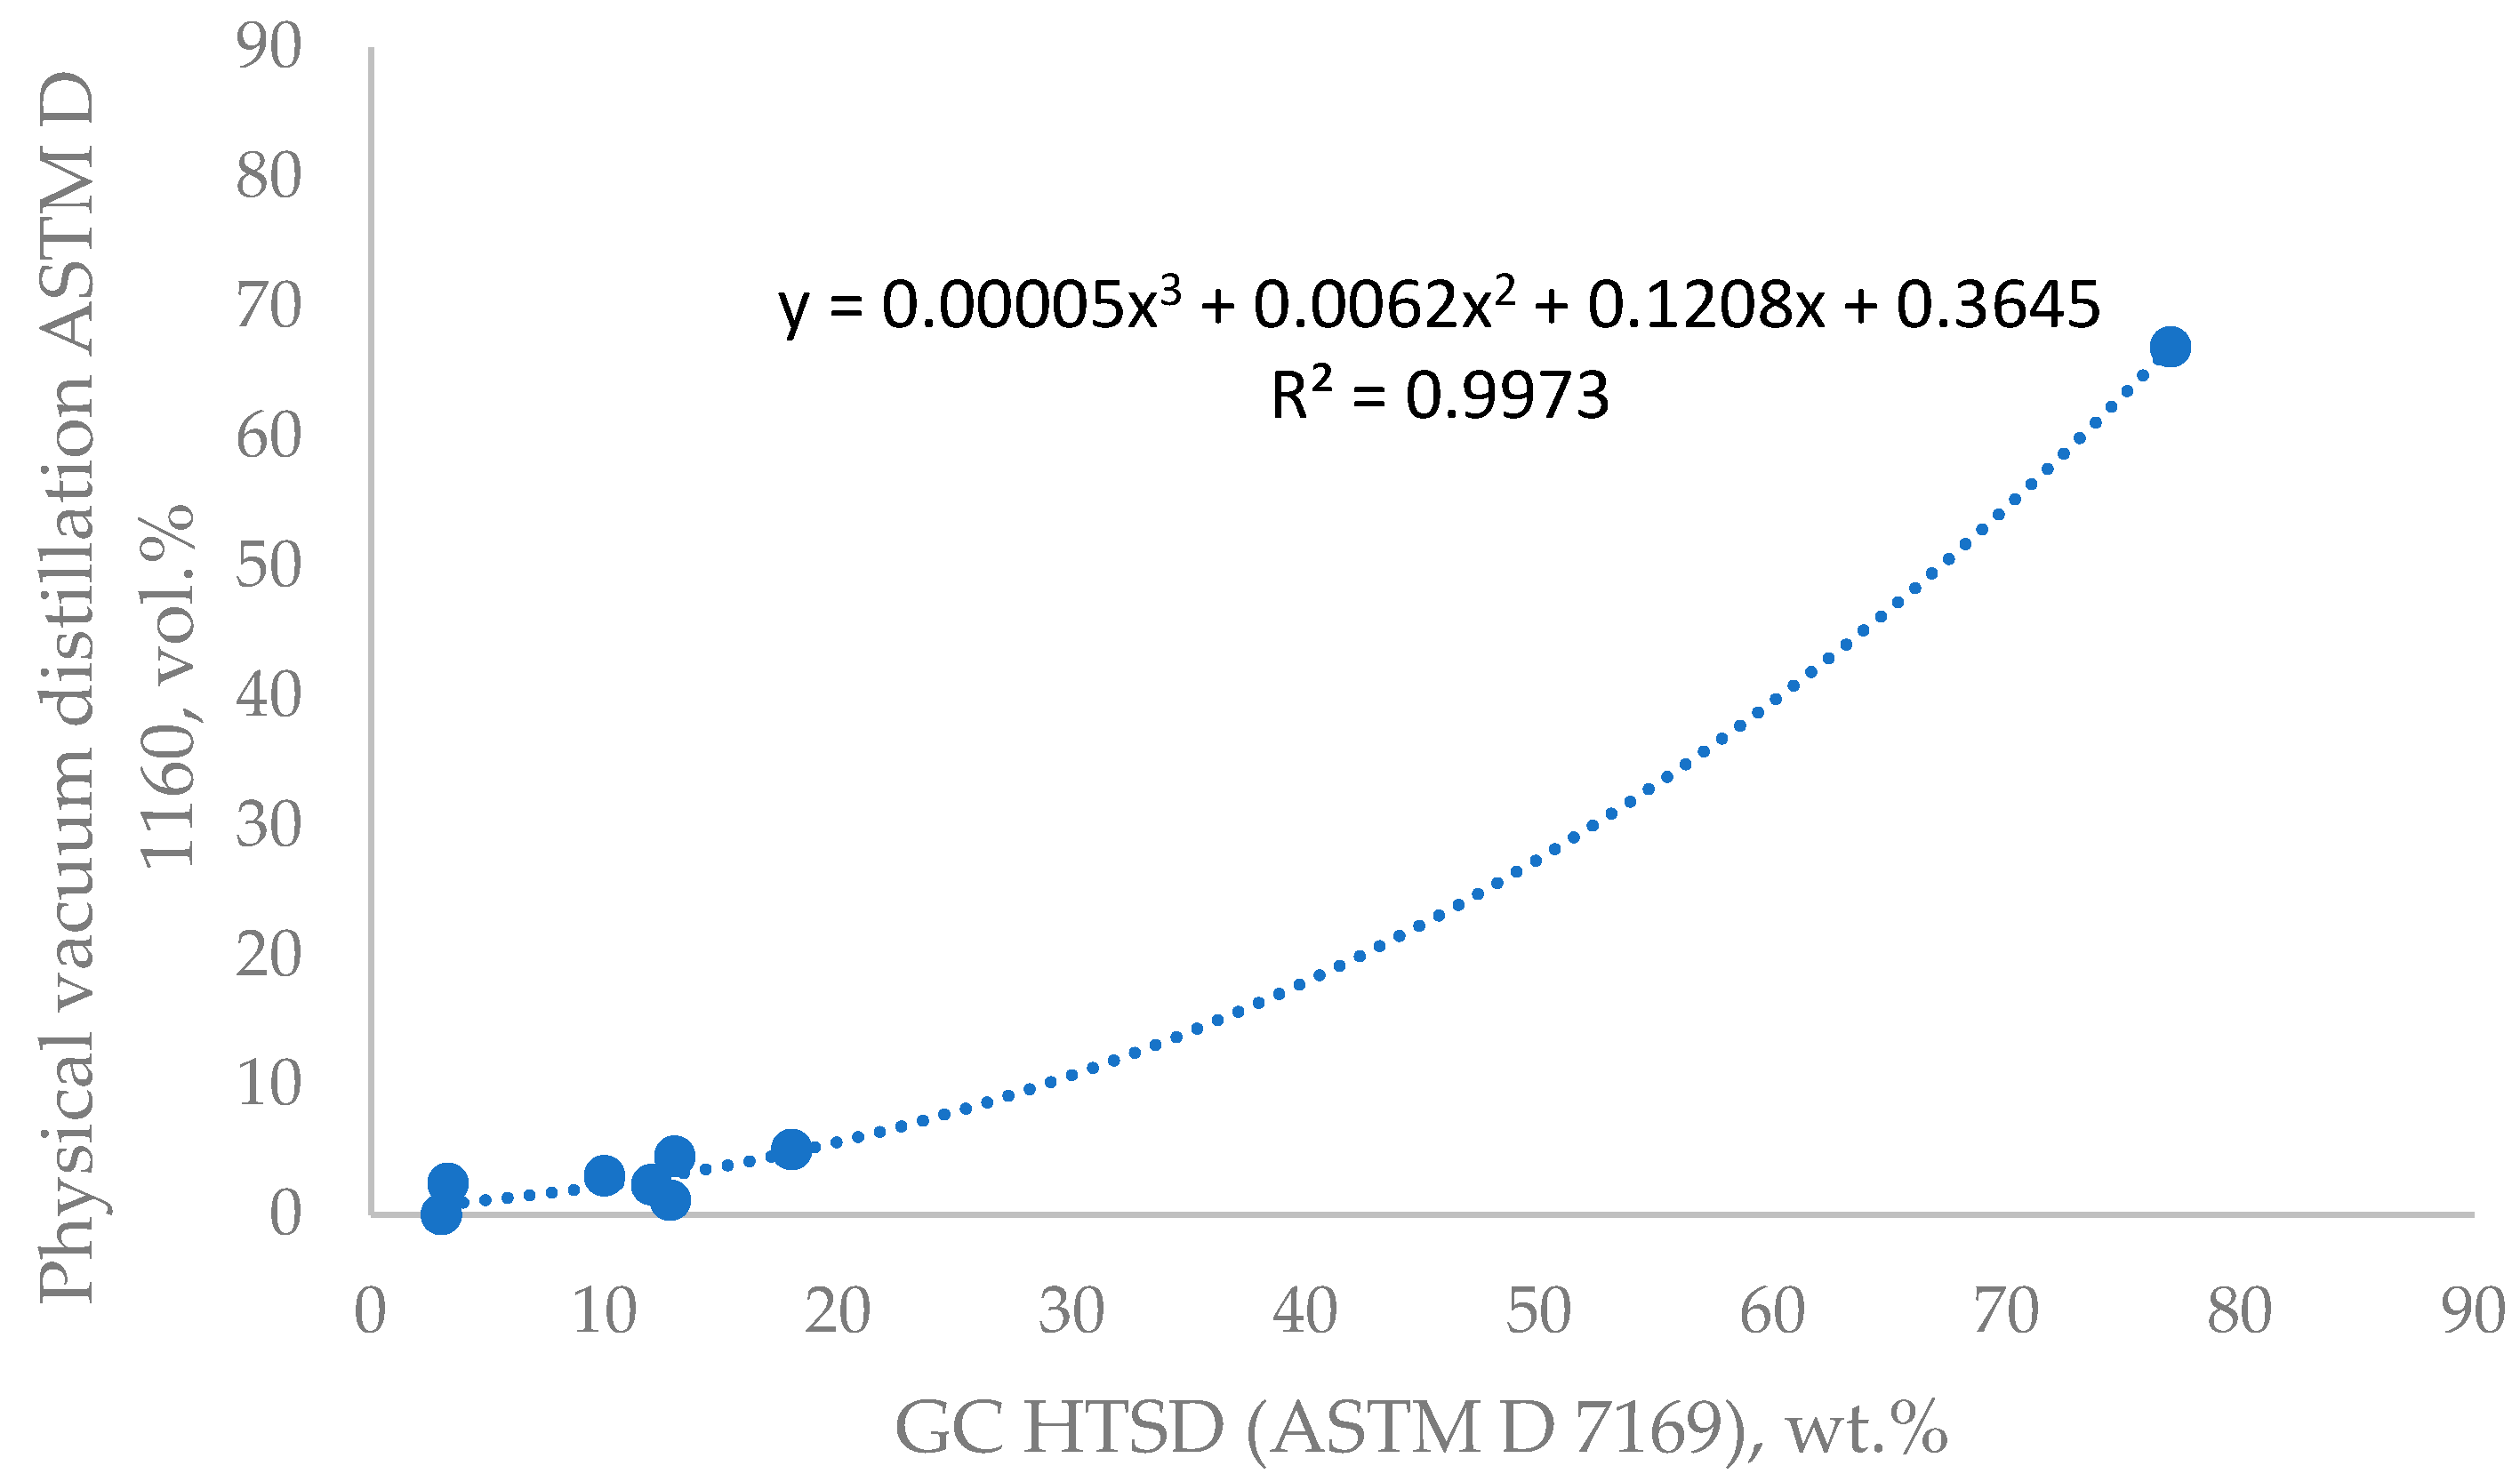
The data shown in
Figure 5 appear similar to the comparison of distillation curves of the ASTM D 86 and the simulated distillation (ASTM D 2887) reported by Riazi [
30]. The data in
Figure 5 also look similar to the ASTM D 86 and TBP curves reported by Riazi [
30] Both the TBP and simulation distillation curves lie below the ASTM D 86 and the ASTM D 1160 curves for evaporation lower than 50% and lie above these curves for evaporation higher than 50%. Riazi [
30] argues that the ASTM D 86 distillation data do not represent actual boiling point of components in a petroleum fraction, while the TBP, due to the high degree of fractionation, gives accurate component distribution for mixtures. Riazi also concludes that ASTM D 1160 distillation data is measured more accurately than ASTM D 86 since it is conducted at low pressure [
34]. For this reason, ASTM D 1160 curves are closer to TBP curves at the same pressure base. Nevertheless, the similar appearance of the difference in the distillation curves between TBP and ASTM D 86 and that observed in the data of
Figure 5 for ASTM D 7169 and ASTM D 1160 may suggest that ASTM D 7169 could be closer to TBP than the ASTM D 1160. Moreover, in our earlier research [
24], we proved that the simulated distillation method ASTM D 2887 is equivalent to TBP, even for high aromatic oils like the fluid catalytic cracking light and heavy gas oils. All these findings suggest that the gas chromatographic HTSD (ASTM D 7169) should be closer to the TBP than the physical vacuum distillation method ASTM D 1160, and therefore, it should better characterize the heavy petroleum fractions.
The data in
Table 2 show that the LNB FCC feed hydrotreating section operated at the same conditions in the hydrotreating reaction section (the same reaction temperature = 357 °C; the same feed rate = 160 t/h; and the same reaction pressure = 41 bar (g)) for both studied cases. Considering the same quality of the feed for the LNB FCC feed hydrotreating section (see the data in
Table S5), one can expect the same vacuum gas oil conversion to take place in the hydrotreating reaction section, and thus, the same amount of generated diesel fraction in this section for both studied cases. Therefore, a different diesel fraction quantity registration in both cases must be ascribed to a separation of an additional amount of diesel fraction from the H-Oil VGO blend processed in the stabilization column during Case 2. The higher fuel gas consumption in the heater, heating the stabilization column feed during Case 2 suggests a higher extent of evaporation occurring in the stabilization column feed during Case 2, which could be due to a higher amount of low boiling material in the column feed in Case 2. If one calculates the total fluid flow rate through the six passes of the heater from
Figure 6, it can be seen that for Case 1, it is 562 m
3/h, versus 552 m
3/h for Case 2. Irrespective of the lower total fluid flow rate in the heater in Case 2, the higher fuel gas consumption confirms the suggestion that the stabilization column feed should contain a higher amount of lighter material. The higher total fluid flow rate in Case 1, irrespective of the lower throughput (160 t/h feed rate for the FCCPT in Case 1) than in Case 2 (160 t/h feed rate for the FCCPT reaction section plus 39 t/h H-Oil VGO blend in the stabilization section), can be explained by the higher percent of recycling of stabilized HTVGO through the heater. This is evident from the higher percent of opening the valve providing recycling during the heater for Case 1.
The data in
Table 3 and
Table 4 indicate much better agreement between the separated diesel fraction from H-Oil VGO blend (8.7 wt.%) in the FCCPT stabilization column and that measured in the H-Oil VGO blend by ASTM D 7169 (9.6 wt.%) than the measured by ASTM D 1160 diesel fraction content in the H-Oil VGO blend (1.7 vol.%). Having in mind that the density of the diesel fraction (see the data in
Table S2) is lower than that of the H-Oil VGO blend, the amount of diesel fraction in H-Oil VGO blend becomes even lower; 1.6 wt.% based on the ASTM D 1160 distillation data. These results support the opinion of Golden et al. [
26,
27,
28] that the gas chromatographic method ASTM D 7169 better characterizes heavy oils than the ASTM D 1160 method. The separation efficiency of the FCCPT stabilization column seems to be higher than that of the ASTM D 1160 apparatus, and it is better matched to the ASTM D 7169 method.
The data in
Table 5 exhibit that the removal of the diesel fraction from the H-Oil VGO has a positive effect on the FCC unit performance leading to increased conversion by 0.53% that along with the increased diesel production in the FCCPT section resulted in improved refinery performance expressed by increased margin with 7.2 MM USD/year.
The results shown in
Figure S2 (Simulation Case 1) indicate a very good match between the operating data and the simulated data of the stabilization column. This suggests that the characterization of the streams of the stabilization column using ASTM D 86 distillation data for wild naphtha, and FCCP diesel, and the simulated distillation ASTM D 2887 data for the stabilized hydrotreated vacuum gas oil and the applied approach the FCCPT stabilization column operation simulation are correct.
The results shown in
Figure S4 (Simulation Case 2) show that agreement between the operating data and the simulated data of the stabilization column is not very good, especially for the draw-off of diesel fraction. The draw-off of diesel fraction is simulated to be 17,900 kg/h, while the actual draw-off of the diesel fraction was 20,150 kg/h. This is an indicator for underestimation of diesel fraction content in the feed for the stabilization column, which should be attributed to the lower content of diesel fraction in the heavy oils measured by the ASTM D 1160 method for the H-Oil VGO blend, and the stabilized hydrotreated vacuum gas oil. All attempts to increase the draw-off of diesel fraction like modifying operating conditions of the simulated stabilization column failed to give any positive results. This clearly implies that the column feed characterization is not sufficiently well defined when ASTM D 1160 is used.
The results shown in
Figure S6 (Simulation Case 3) show that agreement between the operating data and the simulated data of the stabilization column is very good. The draw-off of diesel fraction is simulated to be 20,150 kg/h, which exactly equals the measured diesel fraction draw off. However, this excellent agreement between measured and simulated diesel draw-off has been achieved by a slightly higher than the actual instrument readings draw-off temperature. This can be attributed to deviations of the predicted essential properties of the heavier (360 °C+) pseudo-components, such as molecular weight and critical properties, as was discussed in our earlier study [
39]. In opposition to Simulation Case 2, where the column feed characterization was based on ASTM D 1160 distillation data, Simulation Case 3 allowed for a fine-tuning of the column performance simulation, indicating that the ASTM D 7169 is superior to the ASTM D 1160 method. Another important finding in this simulation study is that the ASTM D 7169 entered as a TBP distillation in the software process simulator led to the obtaining of satisfactory simulation results. This implies that the ASTM D 7169 applied for heavy oils (boiling above 360 °C) characterization could be considered equivalent to TBP, as we found out in our earlier research that the simulation distillation method ASTM D 2887 was equivalent to TBP for petroleum oils boiling below 360 °C [
24].


 ,
, 


