Article

Burnt-Area Quick Mapping Method with Synthetic Aperture Radar Data

1
Department of Geography, Faculty of Mathematics and Natural Sciences, Universitas Indonesia, Depok 16424, Indonesia
2
Center for Environmental Studies, Universitas Budi Luhur, Jakarta 12260, Indonesia
3
Aeronautics and Space Research Organization, National Research and Innovation Agency, Jakarta 13710, Indonesia
*
Author to whom correspondence should be addressed.
Appl. Sci. 2022, 12(23), 11922; https://doi.org/10.3390/app122311922
Submission received: 3 October 2022 / Revised: 11 November 2022 / Accepted: 16 November 2022 / Published: 22 November 2022

Abstract

:
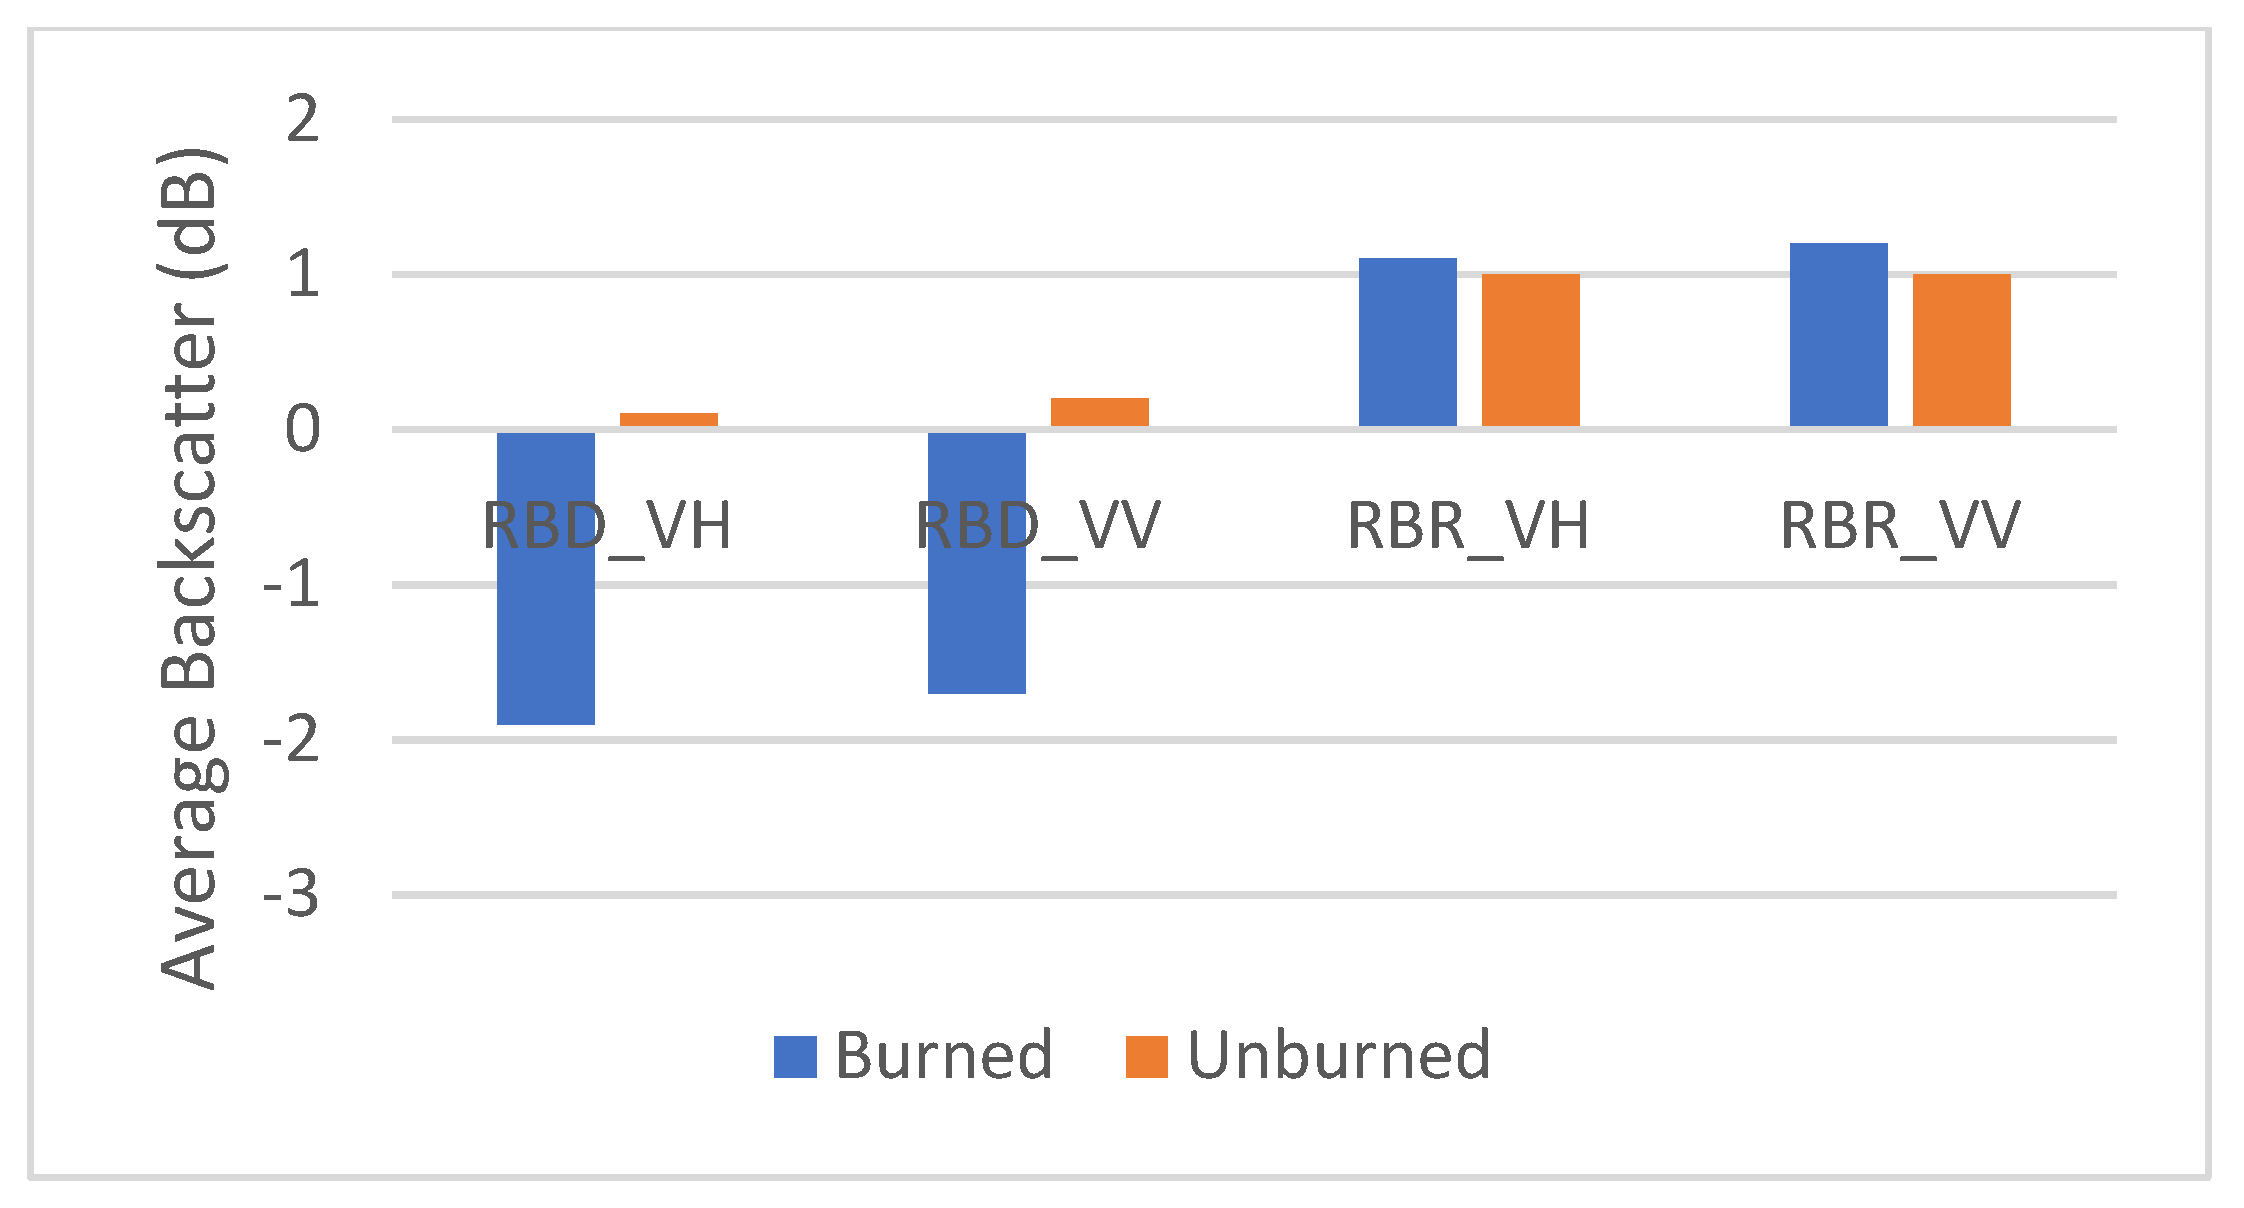
Forest and field fires have become a frequent phenomenon in recent years caused by human activities in Indonesia, affecting all forms of forest and field cover. Forest fire-degraded land is more prone to burn again, due to the nature of peatland in Kalimantan. Rapid mapping technology for burnt areas affected by forest fires is needed to obtain this information. The use of remote sensing technology, in the form of synthetic aperture radar (SAR) images, combined with cloud computing processing speeds up data processing and is not affected by the existing cloud cover. The Quick-Mapping employed in this research provides faster mapping time, compared to the currently employed method, based on field report data, to enable a better and more efficient firefighting effort. The data processing is carried out using cloud computing, enabling the processing of large amounts of data. The processing is carried out starting with importing the data, preprocessing to classification running, simultaneously, using the JavaScript programming language. The research classifies the burnt area from backscatter patterns before and after the event in two measurements, namely the radar burn ratio (RBR) and the radar burn difference (RBD). The RBR is defined as the average backscatter ratio at a certain polarization, while RBD is the difference between the average scattering conditions. The composite image for the classification utilizes images from the RBR and RBD with co-polarized (VV) and cross-polarized (VH) backscatter. The burnt area difference is −1.9 for VH and −1.7 for VV, which indicates a lower backscatter, due to forest fire. The classification of the burnt area yields the best overall accuracy of 88.26% with a support vector machine and processing time of 1 h, compared to the currently 12 h needed to provide burnt area maps from field observation data.

1. Introduction

Forest and land fires have become a frequent and human-caused phenomenon in Indonesia, affecting the biodiversity and economic loss [1,2]. For reference, during the great 2015 forest and land fires in Indonesia, around 2.6 million trees were burnt, costing the country around USD 16.1 billion or the equivalent of 1.9% of Indonesia’s gross domestic product (GDP), in 2015 [2]. Most of the fire ignition is coming from the peat land, compared to the mineral soils and the estimated the total emissions were 1.2 billion CO2 equivalent, during the Indonesian forest fire event in 2015 [3]. The haze from the fire ignition caused acute respiratory infections for more than half a million people and also impacted the surrounding countries, such as Malaysia and Singapore [2,4]. The unsustainable conversion of land use practices, such as the use of fire in converting forest and peat to agricultural areas and the widespread use of fire in cultivation, are considered to be the main driving factors [5,6]. In 2019, another episode of forest and land fires hit in Indonesia [7]. Although the 2019, the Indonesian forest and land fires were not as devastating as in 2015, but at least about 296.942 hectares were burnt in 2019. Some previous studies stated that forest and land fire episodes always hit Indonesia every year, although the magnitude of the forest and land fire ignition is closely related to the El Niño event for example in 1997–1998 and 2015 [8,9,10].
Various impacts arise after forest and land fires, the most concerning issue about post-forest and land fire events is land degradation, due to the burning of the existing vegetation cover and fire impacts on the soil environment [11]. The effect of fire is not only directly associated with the destruction of vegetation cover but also alters the hydrological condition of the soil, i.e., reducing the resistance of soil to erosion and increasing the overland flow during storm events [12,13,14]. As the consequences of the post-fire effect to the soil environment is really harmful, a rapid assessment is needed to map the distribution of the post-fire land degradation area, widely known as a burnt scar area [15].
Remote sensing in particular, due the variety of its sensors, is known as a powerful tool to assess the burnt scars rapidly [15,16,17]. A few studies have explored the application of remotely-sensed data for mapping the burnt scars in Indonesia, and found that the radar sensor is most suitable, rather than other optical sensors [17,18,19]. The combination of using radar sensors with the state-of-the-art computational techniques, using cloud computing, can improve the speed of image processing and avoid the bias of cloud cover [20,21,22].
The usability of the Google Earth Engine as one of the cloud computing platforms for satellite imagery processing, has grown over the last decade, since 2011 [23]. GEE is host to many satellite imageries for over 40 years, from such satellites as Landsat, MODIS, the National Oceanographic and Atmospheric Administration Advanced-Very-High Resolution Radiometer (NOAA-AVHRR), Sentinel 1,2,3, and 5-P, and the Advanced Land Observing Satellite (ALOS) [20]. The Google Earth Engine (GEE) not only offers the parallelized processing of remote sensing data on a global scale, using the Google Cloud, but also provides several machine learning algorithms for improving the classification techniques of the imageries [20,24]. Another advantage using GEE for image processing, GEE was first created and optimized for satellite imagery processing that can process petabytes of imagery data, both on large geographical scales and in long temporal coverages, hence it is a great tool for analyzing regional, national, continental, and global-scale applications [20,25].
A machine learning algorithm, as a classifier feature in GEE, offers a huge application for mapping any earth surface, including forest environments [20]. The most applicable machine learning algorithm for mapping the forest environment, i.e., random forest, classification and regression trees (CART), and the support vector machine have been widely used [26,27,28,29,30]. Random forest formulates to construct assemblage-based decision trees which are independently sampled during the training process and improve the classification results, rather than a single decision tree model [27,31].
Finding the best algorithm for GEE to detect burnt areas in Indonesia has never been achieved before so that in this study, we develop a rapid assessment of the burnt area detection method using GEE, and evaluate the performance of the available machine learning algorithm in GEE, for detecting the post-fire burnt area in Indonesia, using radar sensors. This research aims to quickly map the burnt areas caused by forest fires, using cloud computing of SAR image data with SVM, RF, and CART classification methods being considered, and the best result is selected to provide the forest fire impact map for the effective disaster mitigation efforts. The proposed method provides a faster mapping time, compared to the currently employed method, based on field report data, to enable a better and more efficient firefighting effort.

2. Materials and Methods

2.1. Location and Data

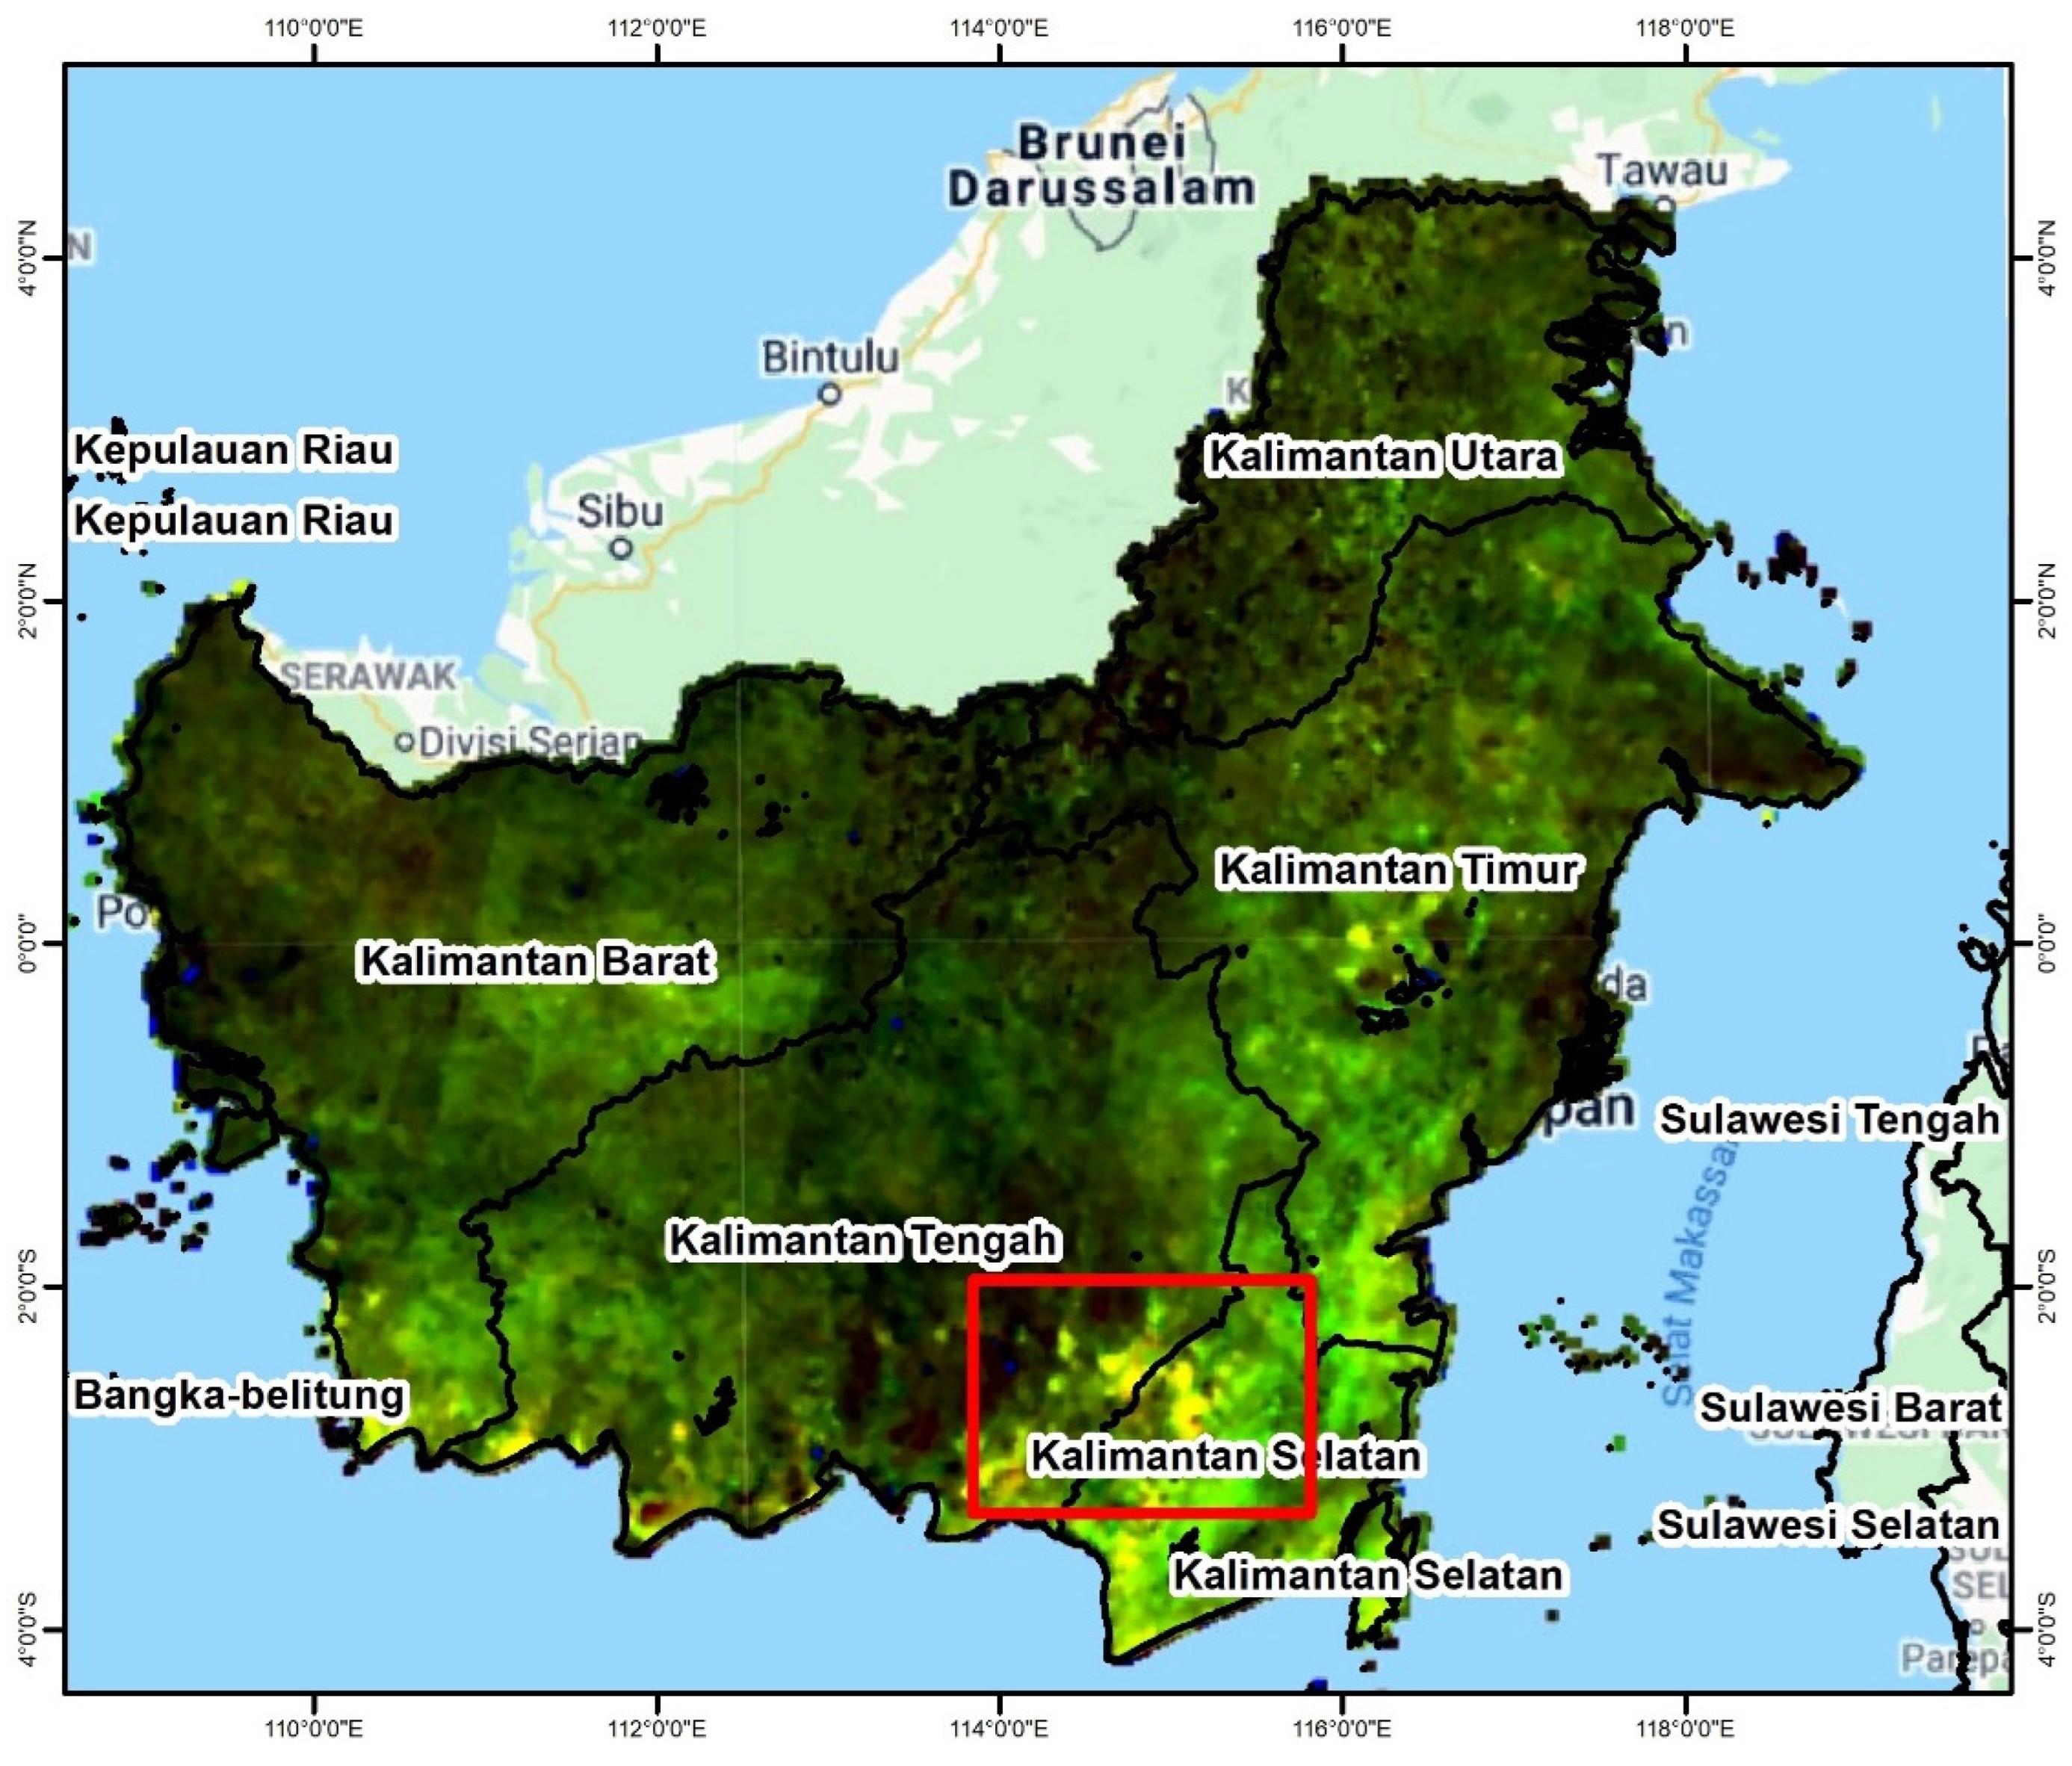
The location of this research is Kalimantan island, with the focused area of interest (AoI) marked with the red square on the regencies of Kapuas, Pulang Pisau, East Barito, South Barito, Barito Kuala, Hulu Sungai Utara, Hulu Sungai Tengah, Hulu Sungai Selatan, and Tapin, as shown in Figure 1.
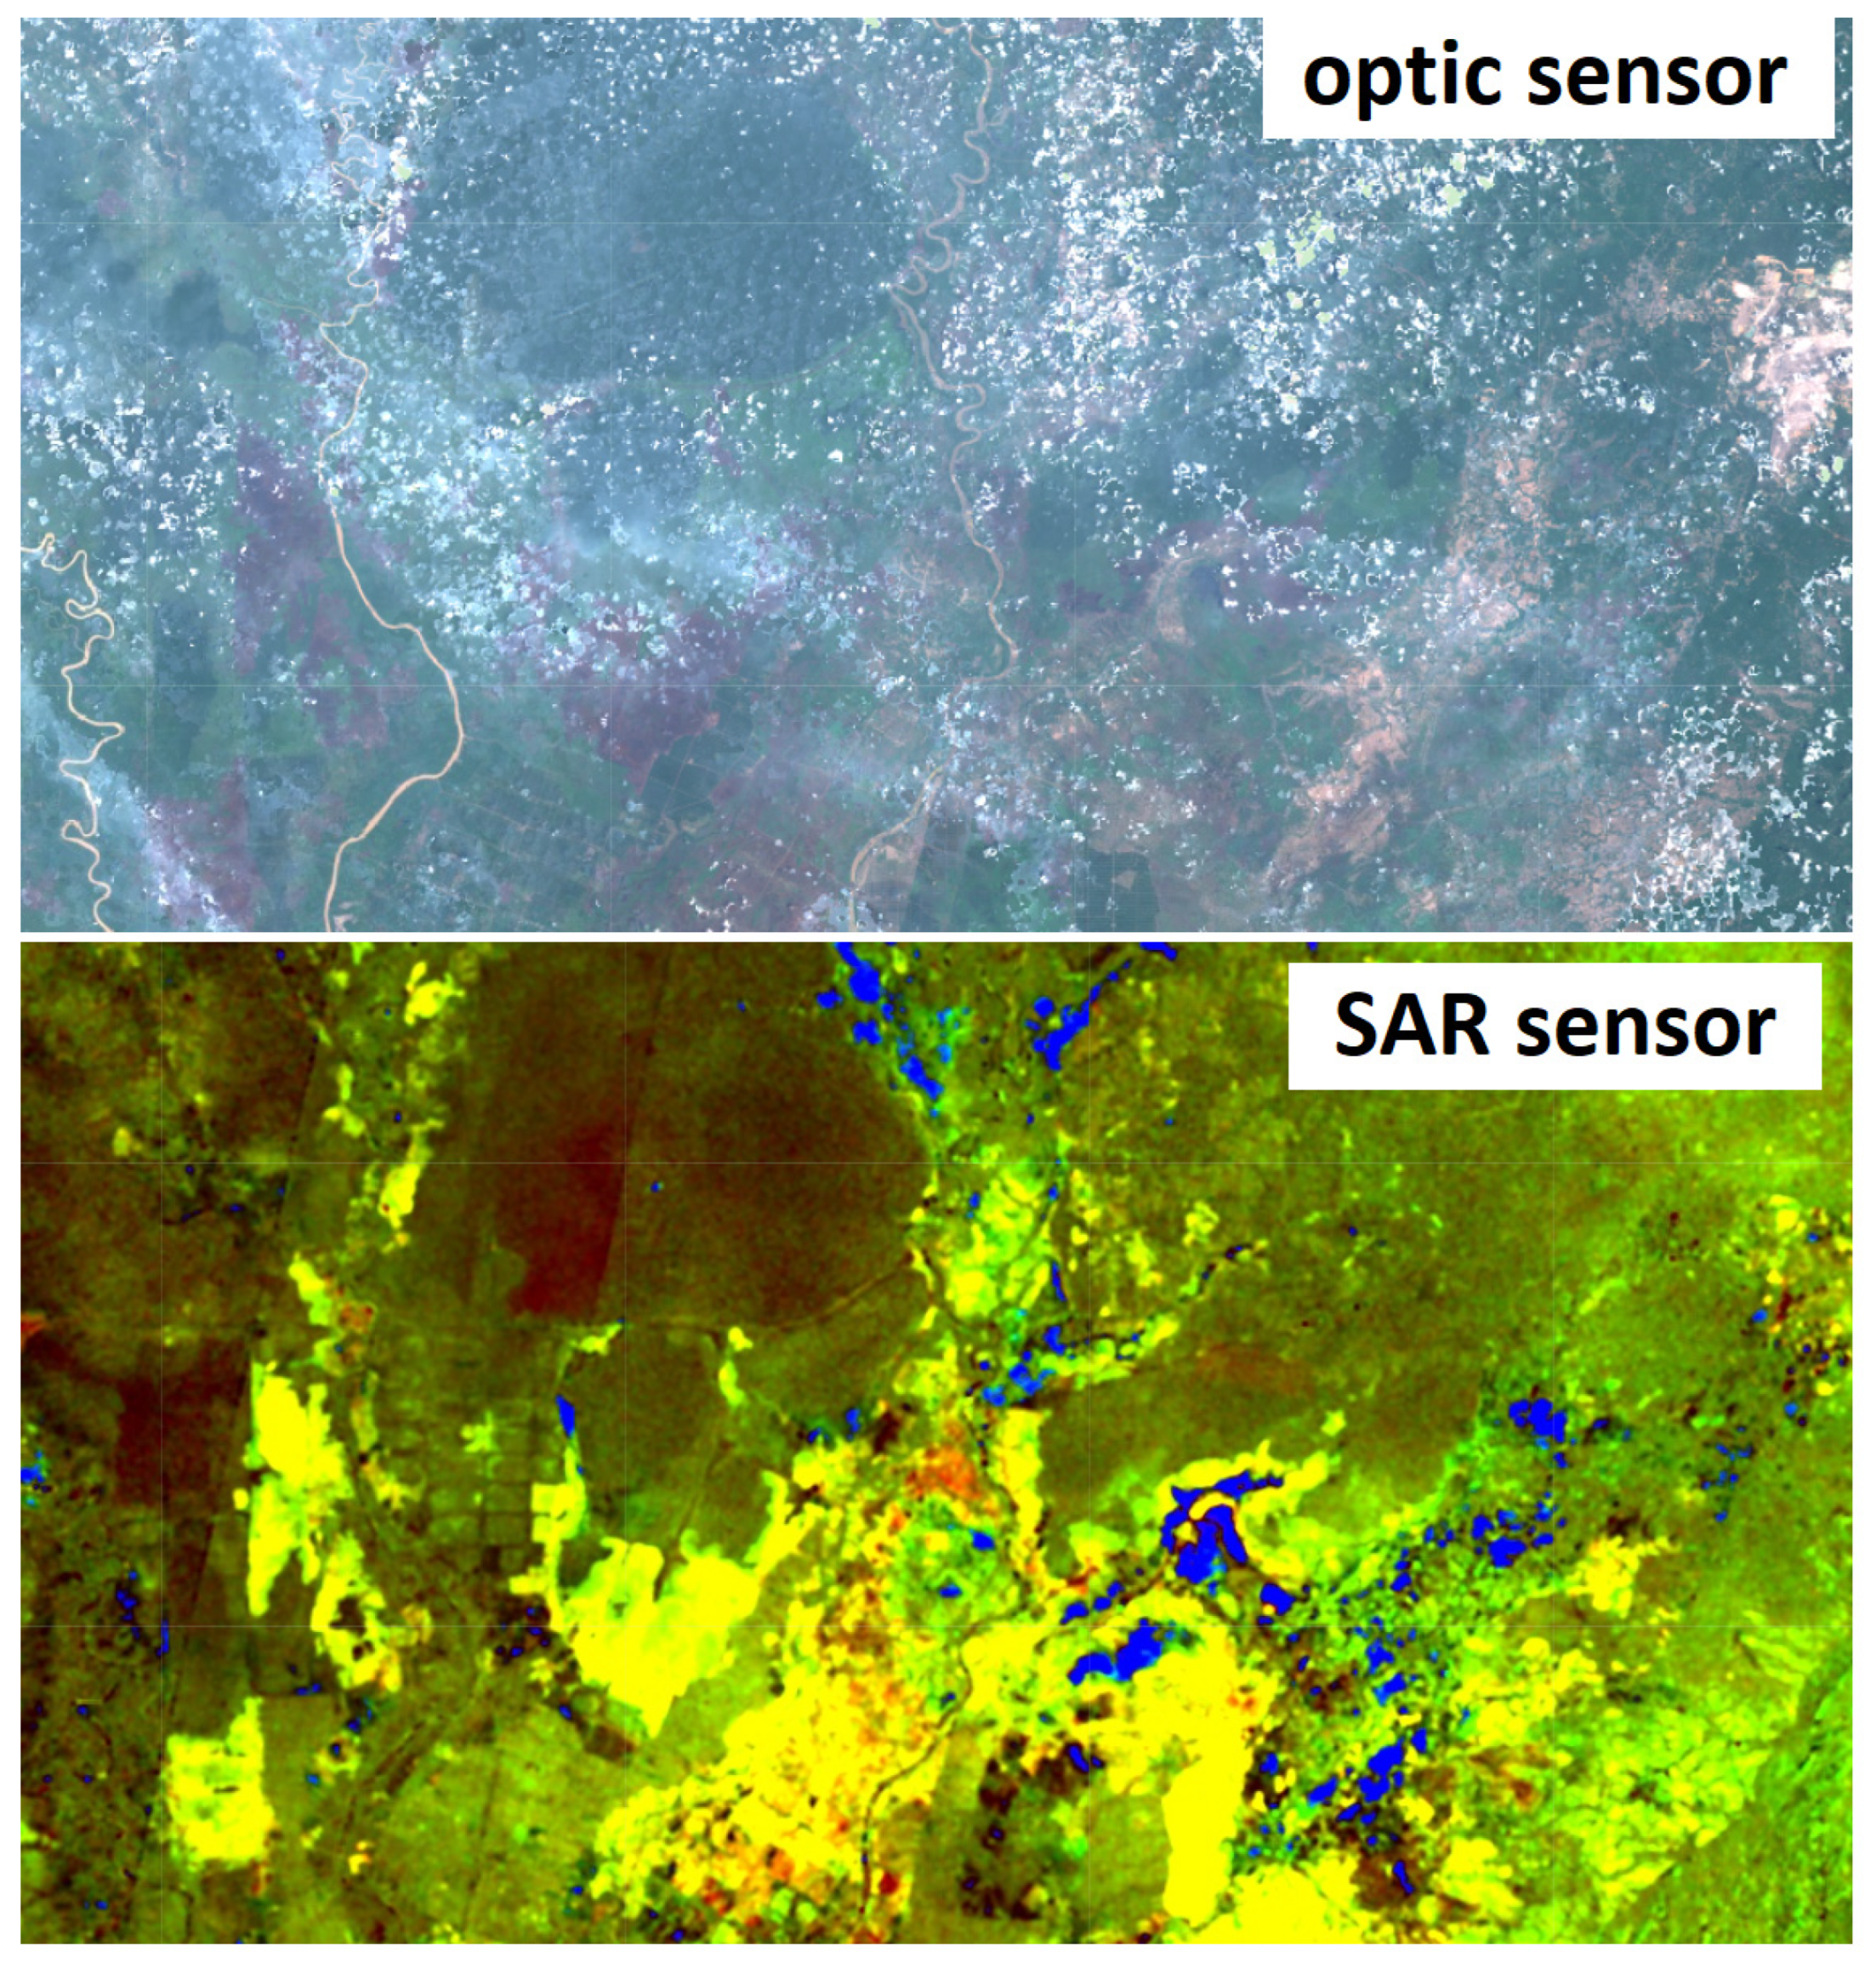
The radar image is obtained from reflected microwave emissions originating from the radar platform. As the radar sensor moves along a trajectory, the area highlighted by the radar also moves along with the platform, known as the footprint, to form an image. The digital radar image consists of pixel dots representing the backscatter of a surface. The radar system generally uses wavelengths that are undisturbed by the interference from particles and vapor in the air (i.e., clouds and rain), and since the system is independent of the illumination (irradiation) from the sun or other sources, it can function in all weather conditions. The synthetic aperture radar (SAR) works by detecting the phase-change of the reflected signals caused by the movement of the platform, to obtain the surface image with a good resolution (i.e., visually discernible) [22,32]. Example of the difference between optical and SAR sensor is shown in Figure 2.
The data used in this study is Sentinel-1a (SAR) data, which has the advantage of not depending on weather conditions. This data processing uses cloud computing data processing, making it possible to process large amounts of data. The processing process, which consists of importing data, and preprocessing to classification, is executed in cloud computing, simultaneously, with commands using the JavaScript programming language and Python. The advantage of using this cloud computing method, compared to processing using a desktop, besides being faster in processing, the processor does not need high software specifications. When using desktop applications, raw data and output files from the processing results often fill the hard disk capacity, while using cloud computing, all files are stored in the cloud and can be downloaded, if needed. The cloud computing application that will be used in this research is the Google Earth Engine [20]. The data used in this research are the Sentinel 2A radar and Hotspot data, which comes from the SIPONGI system, used by the Ministry of Environment and Forestry [33]. The Sentinel data is used to detect the area affected, while the hotspot data is used to verify the burnt land. The data processing in this research uses cloud computing technology, by utilizing the Earth Engine. The processing is carried out by inputting a script in JavaScript language, to give commands to the server. The initial stage of the process is to form a composite image, as the basis for the classification process.

2.2. Related Method

The support vector machine (SVM) algorithm allocates pixels into classes by means of maximizing the class separation from the training data, and labels the pixels, according to the nearest class [34]. The SVM principle is to search for the best classifier which gives the largest margin of accuracy [35]. For a training set x = { x 0 , x 1 , , x N } R B × N , which consists of two classes that are denoted as L = { 1 , + 1 } , the SVM aims to maximize the hyperplane margin while minimizing the error. The optimization is solved as follows:
m a x α i { i = 1 l α i 1 2 i = 1 , j = 1 l α i α j y i y j K ( x , x i ) }
where αi is Lagrange multipliers and K(x, xi) is the kernel function, the decision function is written as follows:
f ( x ) = i = 1 l α i y i K ( x , x i ) + b
The SVM maps the original data into a high dimensional feature space using kernel functions and finds the optimal hyperplane that separates the true and false classes [36]. The SVM’s most interesting property is its high capacity for generalization with relatively small numbers of training data points. Recent studies have suggested that the support vector machine (SVM) can provide good results for the hyperspectral remote sensing classification and superior results have been reported, compared to the traditional remote sensing classification algorithms, such as the maximum likelihood (ML), k-nearest neighbor, and neural networks (NNs) [37]. In addition to the SVM-based categorical classification, there is also growing interest in the SVM regression for estimating the subpixel land cover proportions. The SVM with the radial basis function (RBF) kernel can achieve an excellent performance in classification/prediction tasks, due to the following facts: First, the RBF kernel can map a sample to a higher dimensional space, and the linear kernel function is essentially a special case of the RBF. Meanwhile, the kernel of the RBF and the sigmoid have a similar performance with certain parameters. Second, compared with the polynomial kernel function, only a few parameters need to be modulated by the RBF and the number of kernel function parameters directly influences the complexity of this function. Finally, the RBF kernel has fewer numerical difficulties [36].
The random forest method generates an ensemble of regression trees through the aggregated sampling of the training data. At each decision tree’s node, a random selection parameter of the predictor variables is evaluated for their ability to split the training data into respective target classes, with the variable leading to the most homogeneous classification being selected [38]. Previous studies revealed that the random forest algorithm was acceptable to map the burnt scars area, by showing an overall accuracy >0.90 [39]. The decision tree-based algorithm and support vector machine was are also powerful to identify the burnt areas with an accuracy 0.85–0.91 and >0.99, respectively [40,41].
In line with the development of the field of artificial intelligence, image processing methods also develop by making use of artificial intelligence functions. Several artificial intelligence methods that are widely used in image processing are artificial neural networks or ANNs. The method that has recently begun to be applied in the studies of mapping flooding potential and vulnerability, is to use machine learning [22]. Neural network classification algorithms have long been used for remote sensing image classification. Many have suggested that these types of models are superior to traditional statistical classification approaches (i.e., maximum-likelihood classification), because they do not make assumptions about the nature of the data distribution, and the function is simply learned from training samples. Several neural network models are commonly applied.
Classification and regression trees (CART), are known as decision tree classifiers, which apply a multi-stage binary system to classify imageries [42]. The CART principle is based on the tree framework that has been widely used in remote sensing applications. The key principle is to determine the structure of a decision tree to select an input feature and threshold value at each splitting point. The pixels then are divided, according to the binary classification rule. Groups of pixels are divided, based on the tree growing and pruning parameters, until the optimal classification is found [43]. However, CART easily suffers from overfitting, if allowed to grow uncontrolled, to fit all of the training data. Therefore, the limiting process called pruning, can be employed to reduce the tree levels and increase the generalization ability of CART [37]. The large number of input features requires a significant amount of training pixels to generate a robust classification result.

2.3. Proposed Method

Forest fire mapping employed by Indonesian agencies mostly use optical imagery, such as Landsat-8 and Sentinel-2 [44,45,46], but extensive and persistent cloud cover in Indonesia requires other sensors which are unaffected by clouds [22]. The burnt area, during the 2019 Indonesia land and forest events, was generated from the Sentinel-1a synthetic aperture radar (SAR) satellite imageries and processed using random forest, classification and regression trees (CART), and the support vector machine.
One of the task of forest fire mapping is to map the fire perimeters and to predict the areas of potential fire hazards from the areas of vegetation regrowth after fires. The burn area index (BAI) highlights the burnt land between two bands of the spectrum, by emphasizing the difference of reflectance of the burnt vegetation in post-fire images. The index is computed from the spectral distance from each pixel to a reference spectral point where recently burnt areas converge, in which brighter pixels indicate burnt areas. The BAI is calculated as in Equation (3) [47].
B A I = 1 ( 0.1 B a n d 1 ) 2 ( 0.06 B a n d 2 ) 2
The normalized burn ratio index (NBR), one of the most widely used image enhancements for mapping wildfires, is used to determine the burnt area and was improved by the machine learning classifier algorithm [48] and the basic formula, is expressed in Equation (4).
N B R = B a n d 1 B a n d 2 B a n d 1 + B a n d 2
The method is used to detect burnt tracks is the burn ratio index technique and the difference ratio index technique. This index uses a temporal indication, which is the difference in the conditions before and after a fire for each polarization. The recording after a fire is selected through the October recording period, while the pre-fire condition data is the recording for the period from March to May. The backscatter value generated from each condition (before and after fire) is the average of several recordings, because it aims to minimize the backscatter anomaly or bias.
The radar burn ratio (RBR) in Equation (5) is modified from the NBR and is defined as the average backscatter ratio before and after a fire occurs at a certain polarization [49], meanwhile, the radar burn difference (RBD) in Equation (6) is the difference between the average scattering conditions before and after the fire [50].
RBR xy = Postfire   average   backscatter xy Prefire   average   backscatter x y
RBD xy = Postfire   average   backscatter xy Prefire   average   backscatter x y
The results of the two indexes with the two polarizations, produced four variables, namely the VV polarization RBR, VH polarization RBR, VV variation RBD, and the VH polarized RBD. The four layers are used as variables to determine the pixels of the burnt land object. The supervised classification is used to obtain the pixels on the burnt land objects by referring to a sample of the selected area. To obtain the best accuracy, three types of classification algorithms were selected, namely the support vector machine, random forest, and CART. The three classification results from these different algorithms are then compared with the field data on the burnt land, as a reference image.
The sample locations of this study are the peatlands in the Kalimantan Island region. The peatlands in the area often experience forest and land fires, related to the characteristics of the deep peat depth, which makes the organic content in the area very high, combined with unsustainable agricultural and plantation land conversion practices, and a dropping groundwater table, especially during the dry season [48].
The calculation of the accuracy test is carried out by taking a reference image on the burnt area, since it is in vector polygon format, the classification model was first converted into vectors to obtain a high calculation accuracy. The accuracy test uses desktop-based calculations for convenience in terms of a summarized database. The sample area was selected, based on random sampling, specifically for the areas with large burnt areas.

3. Results

3.1. Radar Burn Ratio and the Difference for the Burnt Area Detection

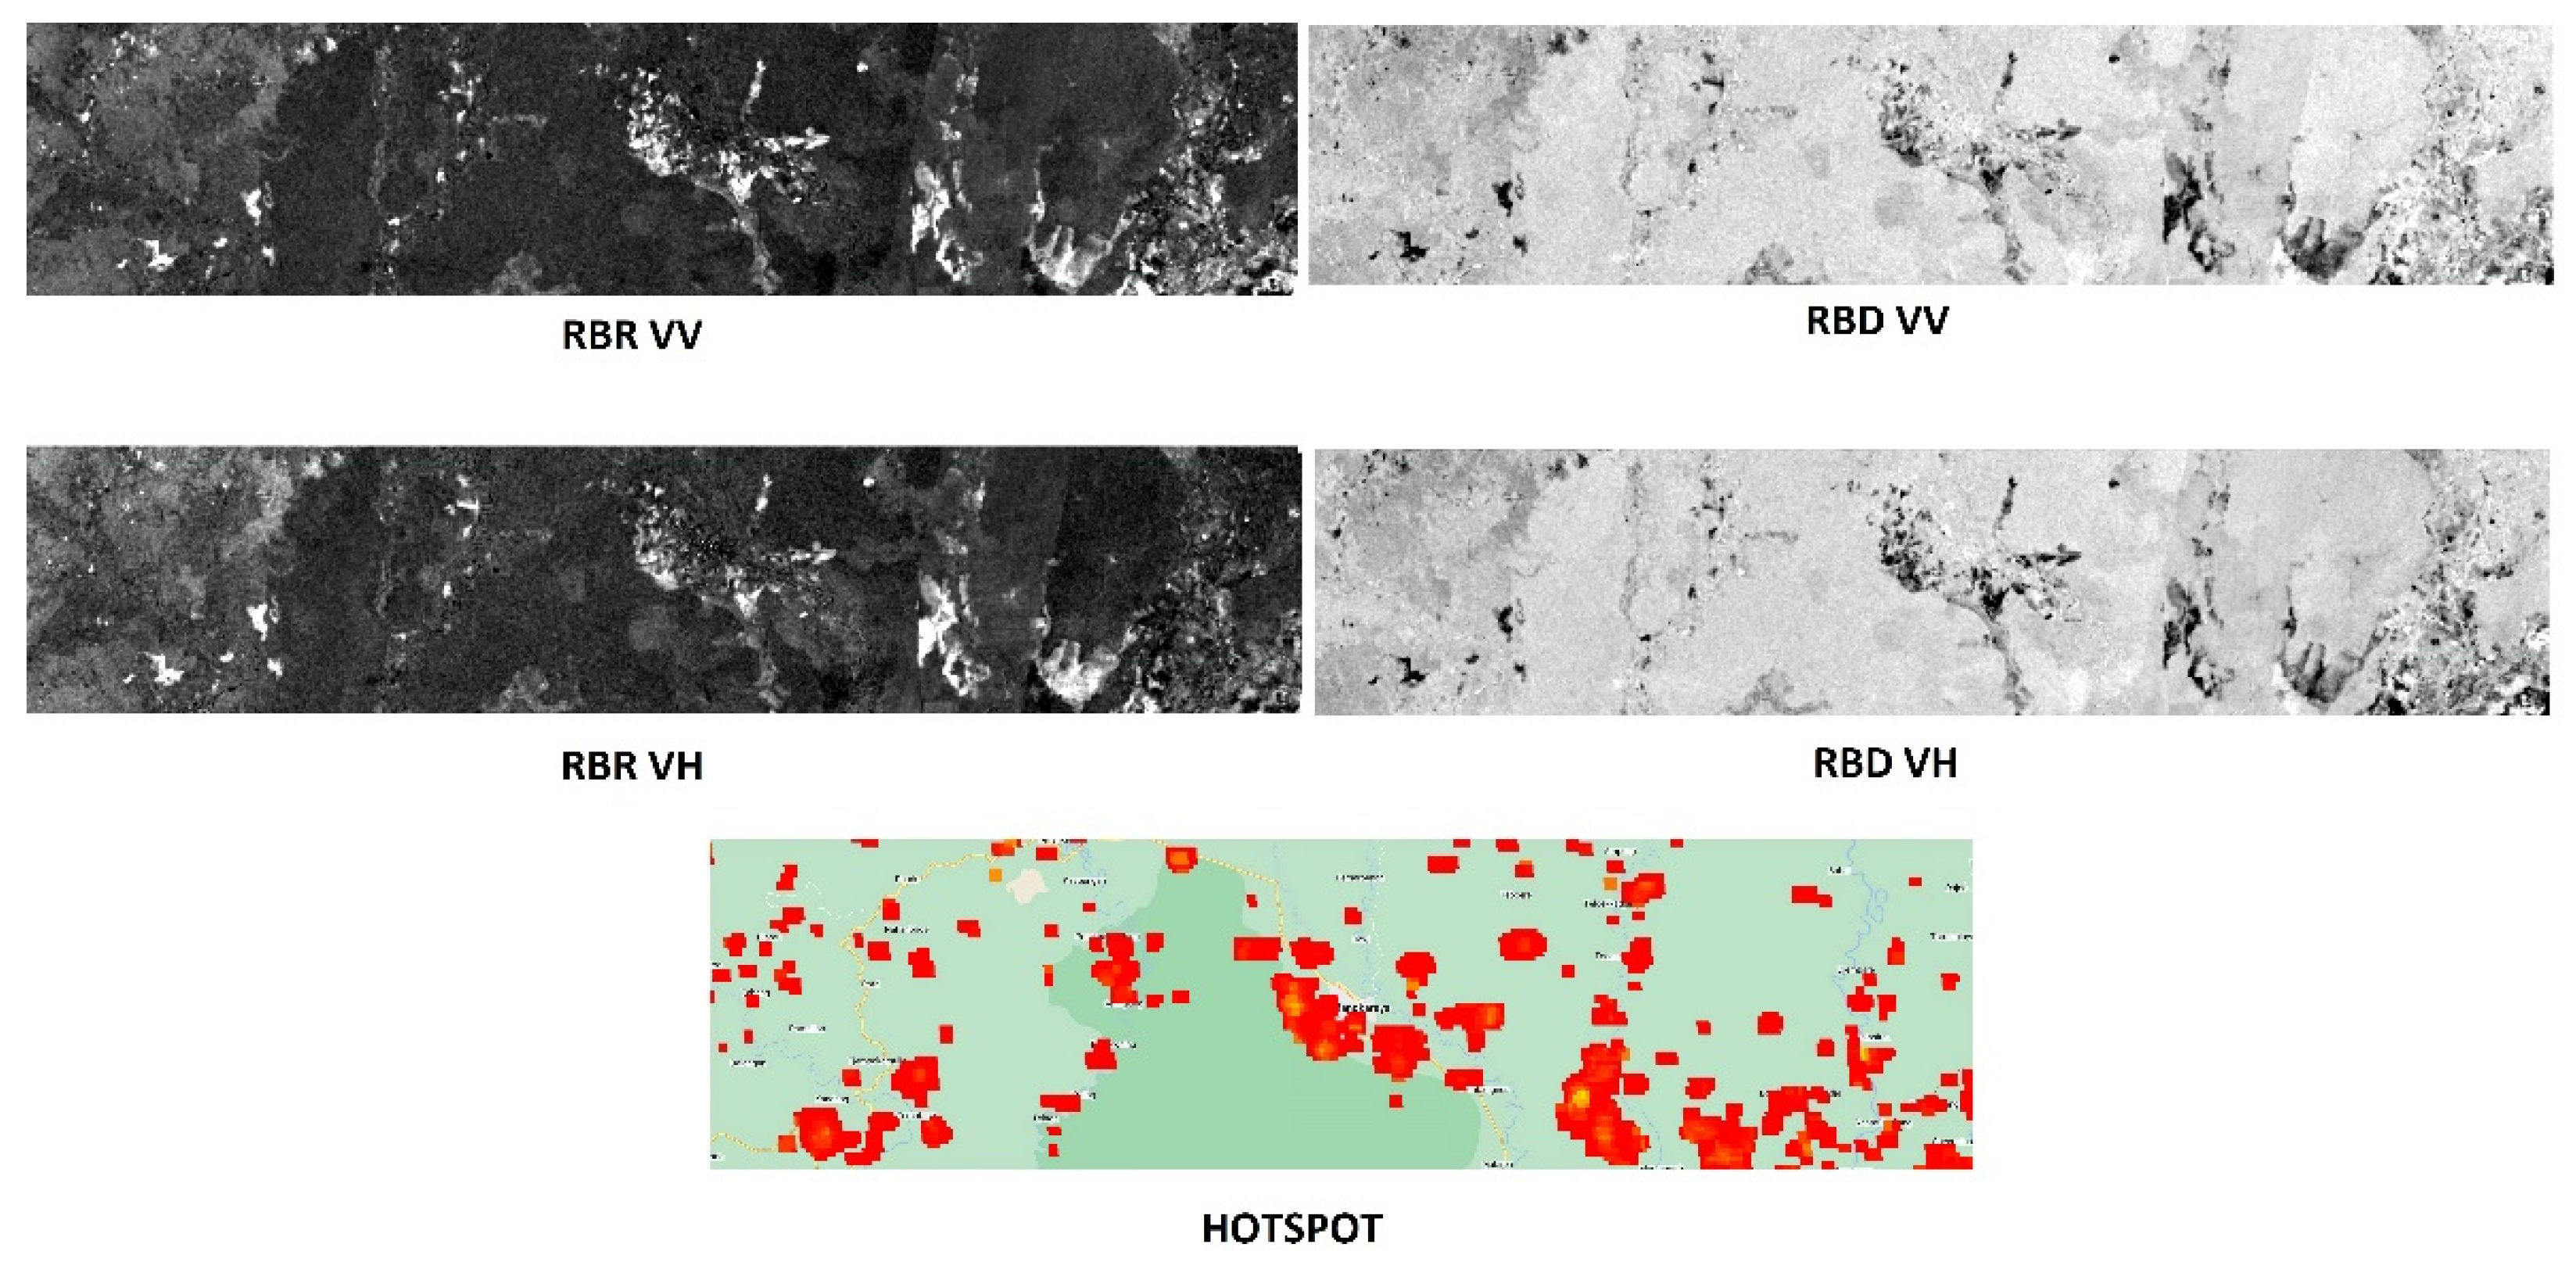
Figure 3 is a co-polarized (VV) and cross-polarized (VH) SAR image from Sentinel-1a, along with the difference values and the Hotspot distribution data. The range of the ratio values for the RBR variable, ranges from 1 to 1.5 dB, while the RBD variable has a pixel value range of −2.5 to 1 dB. The hotspot distribution pattern on the RBR variable has the same pattern, which is in bright pixels or high ratio values in both the RBR VV and RBR VH variables. Meanwhile, in the RBD variable, the hotspot distribution pattern can be identified, but in reverse where the hotspot points are in dark pixels or low difference values. From the visualization above, it can be seen that the distribution of the hotspots has the same distribution pattern for the four variables where changes in land cover, due to land fires, cause changes in the backscatter value during the time series observations (before–after).
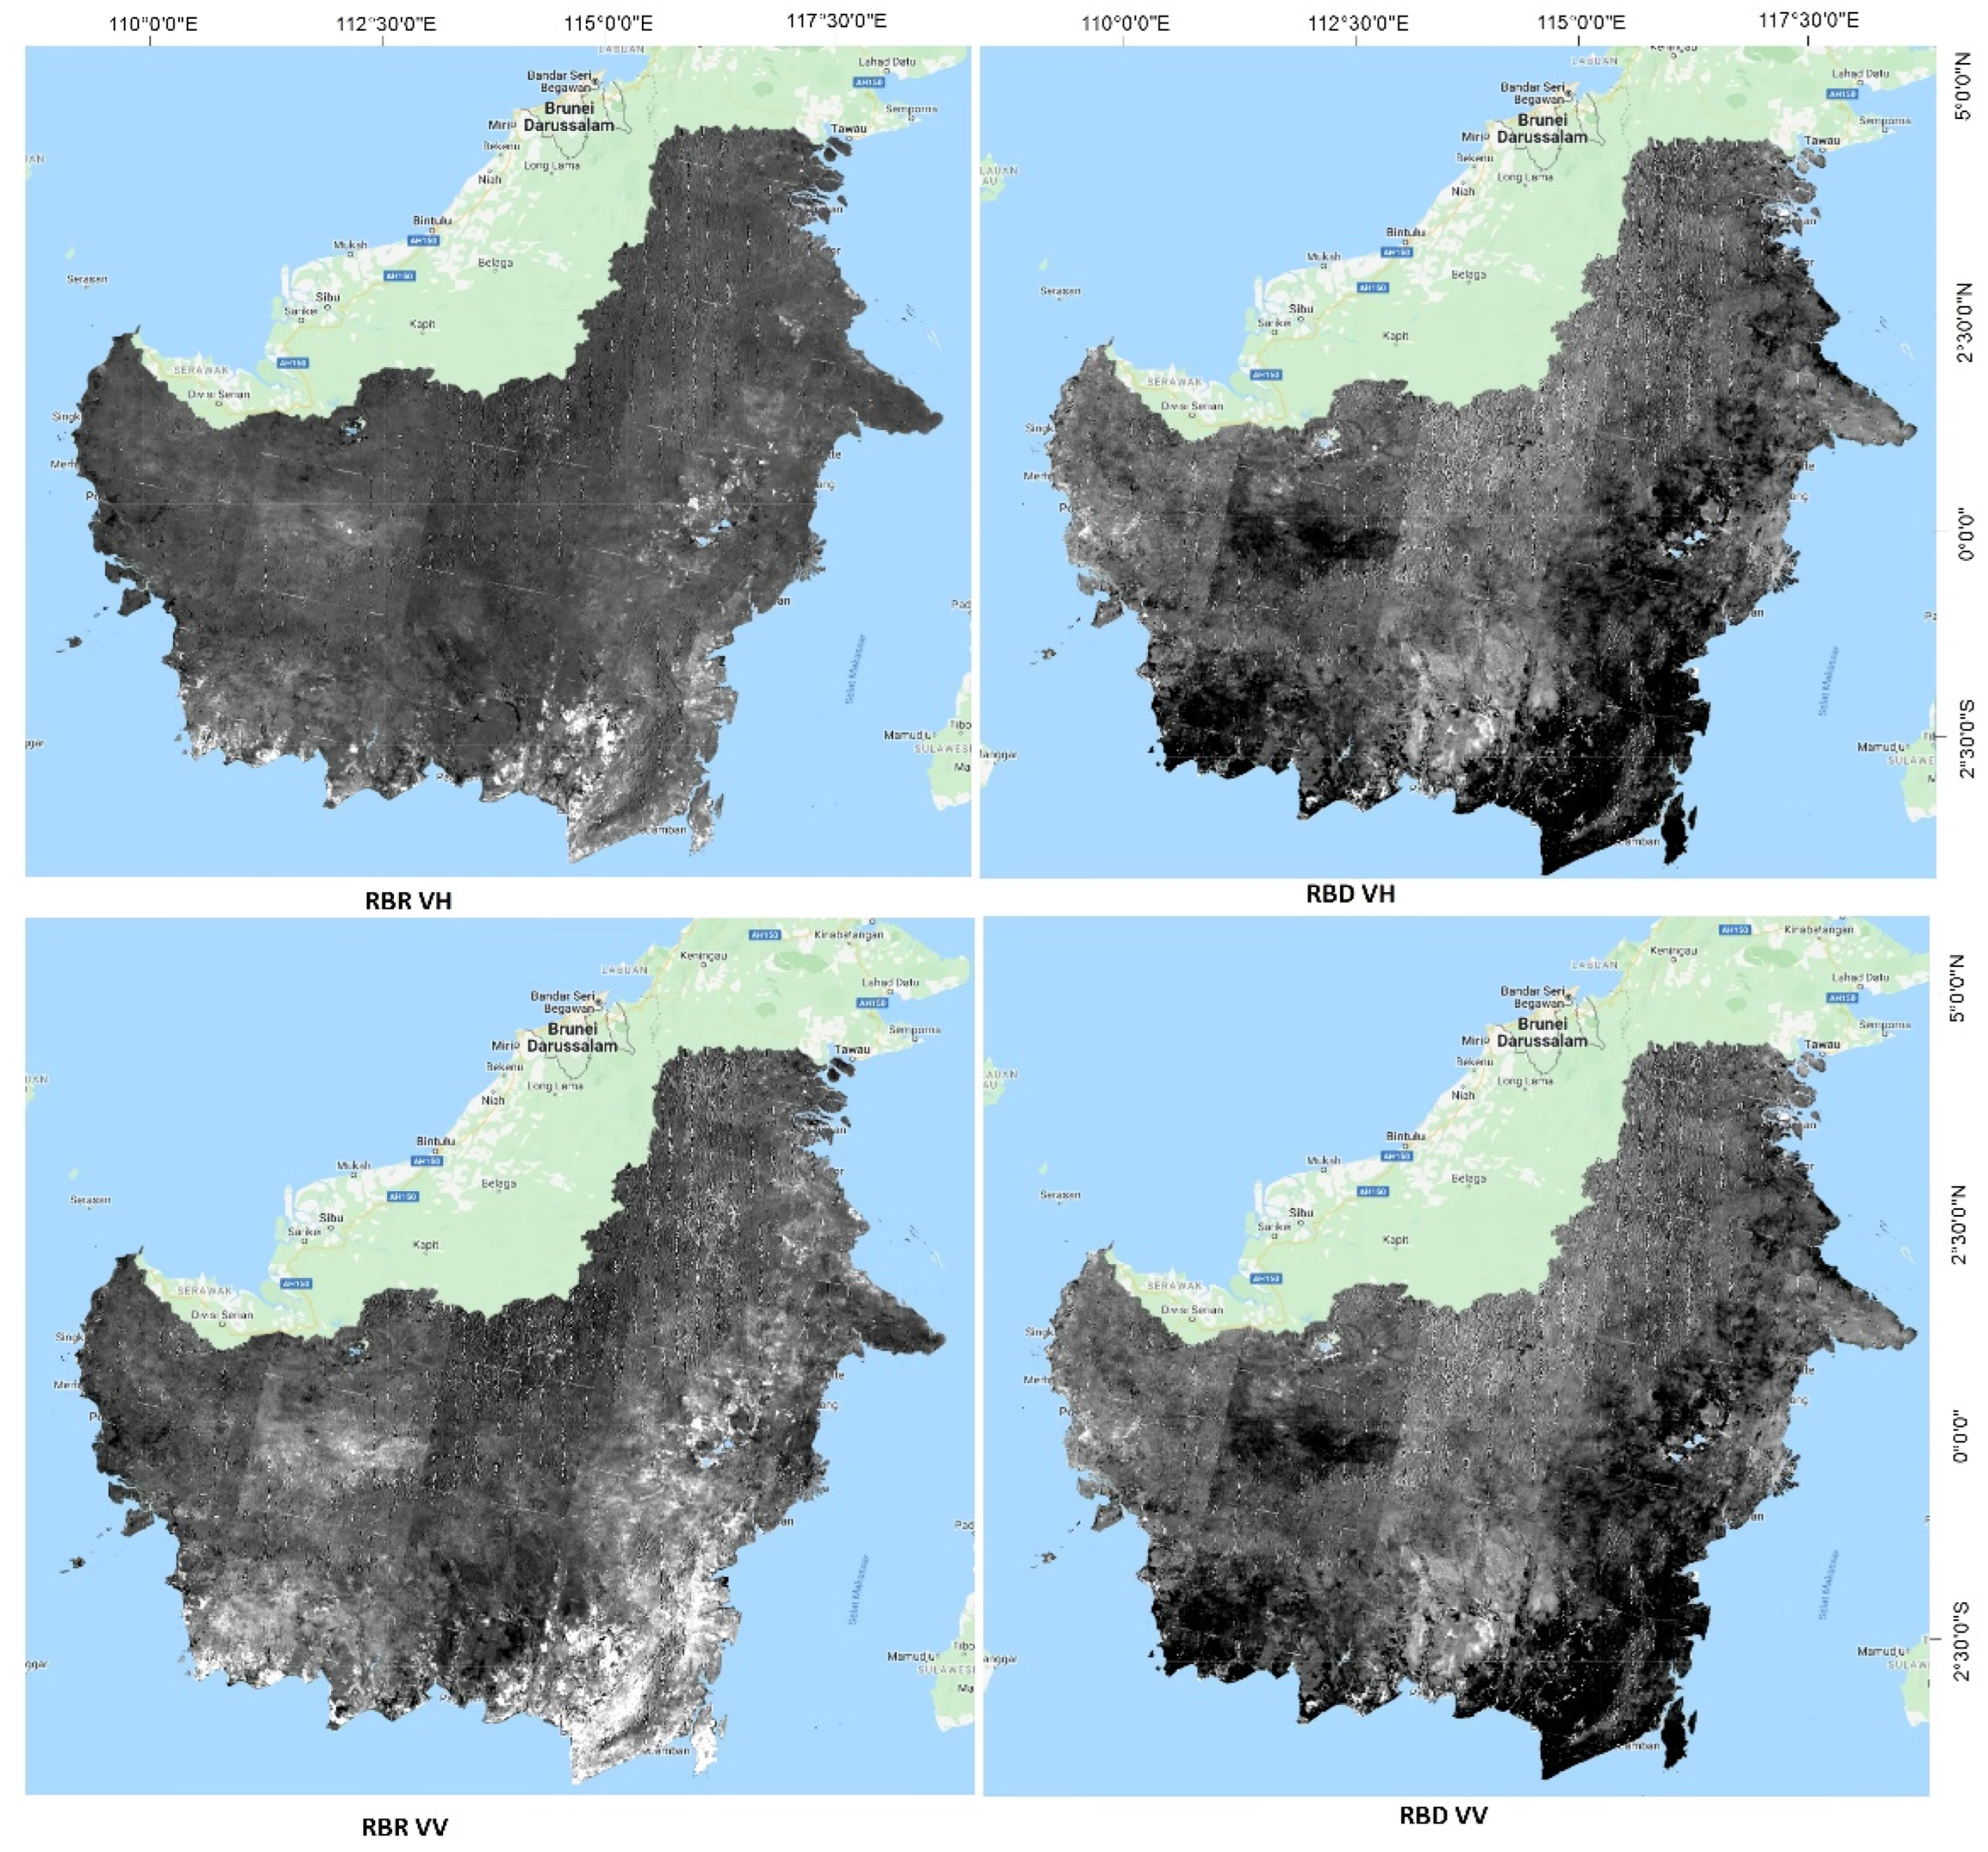
The results of the experiment, is shown in Figure 4, in which, the radar burn difference shows significant burnt areas in South East and South West Kalimantan Island, as a dark area. While the radar burn ratio shows a difference between co-polarized (VV) and cross-polarized (VH), where there are more significant bright areas of the RBR VV that correlate with burnt area of the RBD. The RBR bright spots and the dark spots of the RBD correlates to the red fire location from the hotspot data.
The resulting images for RBR and RBD for oth polarization can be seen on Figure 5 with corresponding RBR bright spots and RBD dark spots. The average RBD value for both the VH and VV polarization in the burnt area is very low, ranging from −1.5 to −2 dB, in contrast to the unburnt area, which has an average value of 0.1 to 0.3 dB. These values indicated that the burnt area can be detected while the RBR value of both the burnt and unburnt areas did not show significantly different values with 1.1 dB for the cross-polarized RBR and 1.3 dB for the co-polarized RBR, the unburnt area is at 1.0 dB as the baseline value for both components. From the values represented in Figure 6, we selected three components that have the largest margin between the burnt and unburnt areas to create a composite image, namely: RBD VH and VV and RBR VV. The composite image is then quantified with CART, random forest, and SVM, and compared with the Hotspot data.

3.2. Burn Scar Mapping Machine-Learning Algorithms

The process of determining the burnt area is carried out using a machine learning algorithm on the composite data from four variables. The burnt area classification process in this research uses three types of classifiers, namely: SVM, random forest, and CART with the parameters defined in Table 1. For the SVM classifier, the radial basis function (RBF) or the Gaussian kernel, is the most widely used kernel because of its high accuracy value. Usually used for datasets that are not linearly separated [51].
Figure 7 shows the differences in the classification results of the three classification algorithms and the distribution of the hotspots. The results of the classification using the CART classifier still show a lot of noise that appears as a burn area. While the SVM and random forest classifiers show the maximum noise reduction results and the burn area distribution pattern matches the hotspot distribution.
Based on the significant burn area detected, we selected three locations as the area of interest, as indicated in Figure 7, to measure the model accuracy. Comparative data used to measure the accuracy of the model was the field data on the burnt land in the same time period. This data was obtained from integration of the Hotspot data, the fire extinguishing points, and the manual delineation of the Landsat-8 and Sentinel-2 optical images.

4. Discussion

The composite formed in Figure 8 is a combination of RBR_VH, RBR_VV, RBD_VH and RBD_VV. The results of the experiment are shown in Figure 7, by taking samples in the burnt and unburnt areas the showed that the RBD variable was better at distinguishing between burnt and non-burnt objects, than the RBR variable.
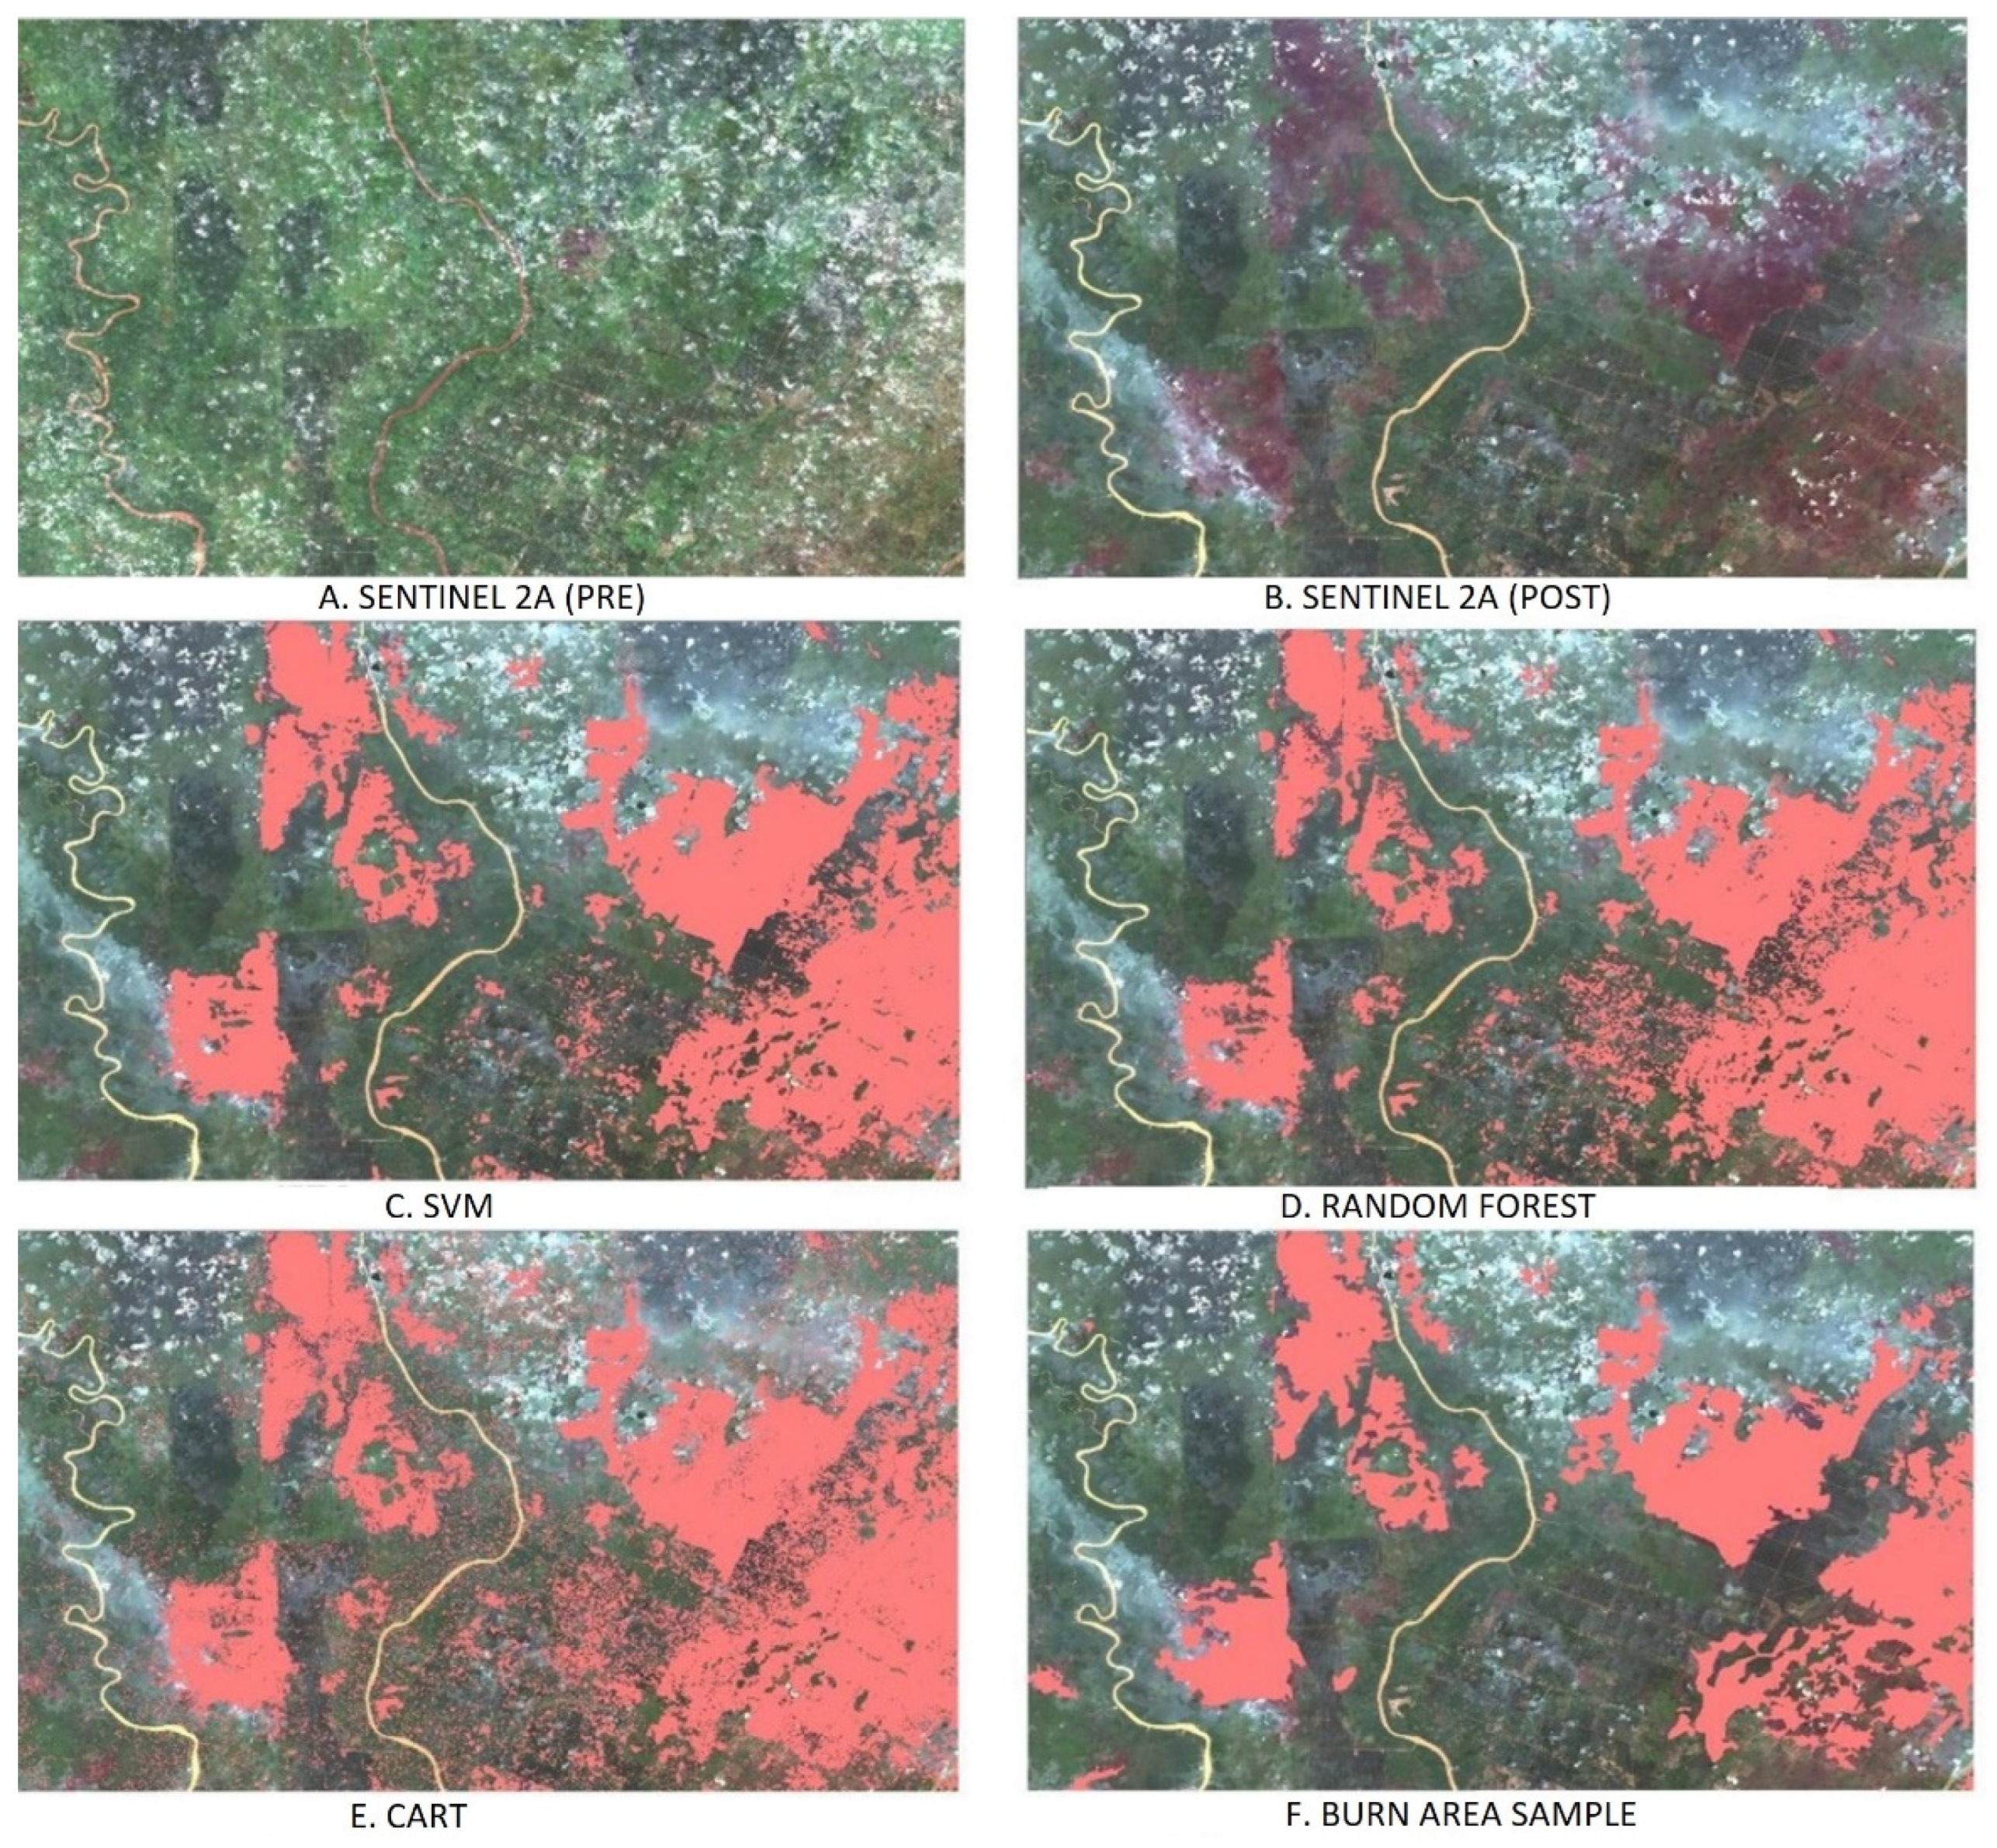
Figure 9 shows the comparison of the Sentinel-2A satellite imagery, three classification results, and reference image. It can be seen that the model results from the three classifiers show the same pattern as the appearance of the burnt land, depicted in the Sentinel-2A image, as well as the reference image. The model generated by the random forest and the SVM algorithms has a high degree of similarity, compared to the model generated by the CART algorithm, where a lot of noise was found. In the CART classification, there are many pixel points that should not be part of the burnt area, so this noise causes the total burnt area to be larger than the random forest and SVM models.
The results of the accuracy test of the three classifiers used in this research are shown in Table 2. Where the overall accuracy to detect the burnt and unburnt areas are above 75%. The model generated by the SVM classifier have the highest accuracy of 88.26%, compared to the field data, while CART classification has a much lower accuracy at 78.40%. The examination on the confusion matrix shows that CART classifies the unburnt area as burnt with a significantly wider area, this means that the classifier is more prone to mis-classification on the edges of the burnt areas. Based on these results, the SVM yields the best accuracy for classifying the forest area as burnt.
As our research aims for a quick mapping method, the second parameter to test is the processing time for each method. The burnt area mapping, using the SVM and RF classification methods each require the processing time of 1 h, while CART takes 2 h. This processing time represents the temporal resolution of the map produced or, in other words, the period of updating the map. When compared to the minimum updating period of the forest fire mapping process that is currently valid and which is 12 h [33], the quick mapping method can speed up the process so that this information can more quickly reach the fire mitigation team in the field.

5. Conclusions

The characteristics of SAR data that are able to identify objects, based on their physical form, are an advantage in identifying burn scar areas. The characteristics of burnt land in the form of open land will have a low backscatter value, compared to unburnt forest areas, which have a coarser texture, so that they have a higher backscatter. In addition, another advantage, when compared to the optical imagery is that it is able to provide visual objects without being constrained by clouds or weather and smoke that usually covers objects, especially when forest fires occur.
The identification of the burnt areas using SAR backscatter differences data, in the conditions before and after a fire, is able to produce s good accuracy. This can be seen from the results of the accuracy test of the three classifiers used in this research, showing an overall accuracy of over 88% with a processing time reduced from 12 h to 1 h. Based on the results, we select the support vector machine method as the best to be applied to support the forest fire mitigation system.

Author Contributions

R. is the principal researcher, R.A. provided with field data and machine learning. I.R. also contributed to the machine learning and paper writing. A., S.I., and L.M. contributed to the GIS mapping and analysis of the data. All authors have read and agreed to the published version of the manuscript.

Funding

This research is funded by Universitas Indonesia Research Group Grant under Grant Number NKB-651/UN2.RST/HKP.05.00/2021.

Institutional Review Board Statement

Not applicable.

Informed Consent Statement

Not applicable.

Data Availability Statement

Not applicable.

Acknowledgments

The current authors dedicate this article to the late Faris Zulkarnain who developed the research from the beginning and formulated this article up until the time this article being submitted.

Conflicts of Interest

The authors declare no conflict of interest.

References

  1. Hoscilo, A.; Page, S.; Tansey, K.J.; Rieley, J.O. Effect of repeated fires on land-cover change on peatland in southern Central Kalimantan, Indonesia, from 1973 to 2005. Int. J. Wildland Fire 2011, 20, 578–588. [Google Scholar] [CrossRef]
  2. Glauber, A.J.; Moyer, S.; Adriani, M.; Gunawan, I. The Cost of Fire: An Economic Analysis of Indonesia’s 2015 Fire Crisis. In Indonesia Sustainable Landscapes Knowledge Note No. 1; World Bank: Jakarta, Indonesia, 2016. [Google Scholar]
  3. Huijnen, V.; Wooster, M.; Kaiser, J.W.; Gaveau, D.L.A.; Flemming, J.; Parrington, M.; Inness, A.; Murdiyarso, N.D.; Main, B.; van Weele, M. Fire carbon emissions over maritime southeast Asia in 2015 largest since 1997. Sci. Rep. 2016, 6, 26886. [Google Scholar] [CrossRef] [PubMed]
  4. Islam, M.S.; Pei, Y.H.; Mangharam, S. Trans-Boundary Haze Pollution in Southeast Asia: Sustainability through Plural Environmental Governance. Sustainability 2016, 8, 499. [Google Scholar] [CrossRef] [Green Version]
  5. Dennis, R.A.; Colfer, C.P. Impacts of land use and fire on the loss and degradation of lowland forest in 1983–2000 in East Kutai District, East Kalimantan, Indonesia. Singap. J. Trop. Geogr. 2006, 27, 30–48. [Google Scholar] [CrossRef]
  6. Medrilzam, M.; Dargusch, P.; Herbohn, J.; Smith, C. The socio-ecological drivers of forest degradation in part of the tropical peatlands of Central Kalimantan, Indonesia. For. Int. J. For. Res. 2013, 87, 335–345. [Google Scholar] [CrossRef]
  7. Susetyo, K.E.; Kusin, K.; Nina, Y.; Jagau, Y.; Kawasaki, M.; Naito, D. 2019 Peatland and Forest Fires in Central Kalimantan, Indonesia. In Newsletter of Tropical Peatland Society Project; Research Institute for Humanity and Nature: Kyoto, Japan, 2020; p. 4. [Google Scholar]
  8. Fuller, D.O.; Murphy, K. The Enso-Fire Dynamic in Insular Southeast Asia. Clim. Chang. 2006, 74, 435–455. [Google Scholar] [CrossRef]
  9. Khoirunisa, R.; Laszlo, M. Burned region analysis using normalized burn ratio index (NBRI) in 2019 forest fires in Indonesia (Case study: Pinggir-Mandau District, Bengkalis, Riau, Indonesia). Geogr. Sci. Educ. J. 2019, 2, 9. [Google Scholar]
  10. Nurdiati, S.; Sopaheluwakan, A.; Septiawan, P. Spatial and Temporal Analysis of El Niño Impact on Land and Forest Fire in Kalimantan and Sumatra. Agromet 2021, 35, 10. [Google Scholar] [CrossRef]
  11. Bajocco, S.; Salvati, L.; Ricotta, C. Land degradation versus fire: A spiral process? Prog. Phys. Geogr. Earth Environ. 2011, 35, 3–18. [Google Scholar] [CrossRef]
  12. Mataix-Solera, J.; Cerdà, A.; Arcenegui, V.; Jordán, A.; Zavala, L.M. Fire effects on soil aggregation: A review. Earth Sci. Rev. 2011, 109, 44–60. [Google Scholar] [CrossRef]
  13. Esteves, T.C.J.; Kirkby, M.; Shakesby, R.; Ferreira, A.; Soares, J.; Irvine, B.; Ferreira, C.; Coelho, C.; Bento, C.; Carreiras, M. Mitigating land degradation caused by wildfire: Application of the PESERA model to fire-affected sites in central Portugal. Geoderma 2012, 191, 40–50. [Google Scholar] [CrossRef]
  14. Soulis, K.X. Estimation of SCS Curve Number variation following forest fires. Hydrol. Sci. J. 2018, 63, 1332–1346. [Google Scholar] [CrossRef]
  15. Mouillot, F.; Schultz, M.G.; Yue, C.; Cadule, P.; Tansey, K.; Ciais, P.; Chuvieco, E. Ten years of global burned area products from spaceborne remote sensing—A review: Analysis of user needs and recommendations for future developments. Int. J. Appl. Earth Obs. Geoinf. 2014, 26, 64–79. [Google Scholar] [CrossRef] [Green Version]
  16. Szpakowski, D.M.; Jensen, J.L.R. A Review of the Applications of Remote Sensing in Fire Ecology. Remote Sens. 2019, 11, 2638. [Google Scholar] [CrossRef] [Green Version]
  17. Chuvieco, E. Satellite Remote Sensing Contributions to Wildland Fire Science and Management. Curr. For. Rep. 2020, 6, 81–96. [Google Scholar] [CrossRef]
  18. Carreiras, J.M.B.; Quegan, S.; Tansey, K.; Page, S. Sentinel-1 observation frequency significantly increases burnt area detectability in tropical SE Asia. Environ. Res. Lett. 2020, 15, 054008. [Google Scholar] [CrossRef]
  19. Rahmi, K.I.N.; Ardha, M.; Rarasati, A.; Nugroho, G.; Mayestika, P.; Catur, N.U.; Yulianto, F. Burned area monitoring based on multiresolution and multisensor remote sensing image in Muaro Jambi, Jambi. IOP Conf. Ser. Earth Environ. Sci. 2020, 528, 012058. [Google Scholar] [CrossRef]
  20. Gorelick, N.; Hancher, M.; Dixon, M.; Ilyushchenko, S.; Thau, D.; Moore, R. Google Earth Engine: Planetary-scale geospatial analysis for everyone. Remote Sens. Environ. 2017, 202, 18–27. [Google Scholar] [CrossRef]
  21. Lasko, K. Incorporating Sentinel-1 SAR imagery with the MODIS MCD64A1 burned area product to improve burn date estimates and reduce burn date uncertainty in wildland fire mapping. Geocarto Int. 2021, 36, 340–360. [Google Scholar] [CrossRef] [Green Version]
  22. Riyanto, I.; Rizkinia, M.; Arief, R.; Sudiana, D. Three-Dimensional Convolutional Neural Network on Multi-Temporal Synthetic Aperture Radar Images for Urban Flood Potential Mapping in Jakarta. Appl. Sci. 2022, 12, 1679. [Google Scholar] [CrossRef]
  23. Kumar, L.; Mutanga, O. Google Earth Engine Applications Since Inception: Usage, Trends, and Potential. Remote Sens. 2018, 10, 1509. [Google Scholar] [CrossRef]
  24. Tamiminia, H.; Salehi, B.; Mahdianpari, M.; Quackenbush, L.; Adeli, S.; Brisco, B. Google Earth Engine for geo-big data applications: A meta-analysis and systematic review. ISPRS J. Photogramm. Remote Sens. 2020, 164, 152–170. [Google Scholar] [CrossRef]
  25. Amani, M.; Ghorbanian, A.; Ahmadi, S.A.; Kakooei, M.; Moghimi, A.; Mirmazloumi, S.M.; Moghaddam, S.H.A.; Mahdavi, S.; Ghahremanloo, M.; Parsian, S.; et al. Google Earth Engine Cloud Computing Platform for Remote Sensing Big Data Applications: A Comprehensive Review. IEEE J. Sel. Top. Appl. Earth Obs. Remote Sens. 2020, 13, 5326–5350. [Google Scholar] [CrossRef]
  26. Johansen, K.; Phinn, S.; Taylor, M. Mapping woody vegetation clearing in Queensland, Australia from Landsat imagery using the Google Earth Engine. Remote Sens. Appl. Soc. Environ. 2015, 1, 36–49. [Google Scholar] [CrossRef]
  27. Tsai, Y.H.; Stow, D.; Chen, H.L.; Lewison, R.; An, L.; Shi, L. Mapping Vegetation and Land Use Types in Fanjingshan National Nature Reserve Using Google Earth Engine. Remote Sens. 2018, 10, 927. [Google Scholar] [CrossRef] [Green Version]
  28. Duan, Q.; Tan, M.; Guo, Y.; Wang, X.; Xin, L. Understanding the Spatial Distribution of Urban Forests in China Using Sentinel-2 Images with Google Earth Engine. Forests 2019, 10, 729. [Google Scholar] [CrossRef] [Green Version]
  29. Koskinen, J.; Leinonen, U.; Vollrath, A.; Ortmann, A.; Lindquist, E.; D’Annunzio, R.; Pekkarinen, A.; Käyhkö, N. Participatory mapping of forest plantations with Open Foris and Google Earth Engine. ISPRS J. Photogramm. Remote Sens. 2019, 148, 63–74. [Google Scholar] [CrossRef]
  30. Brovelli, M.A.; Sun, Y.; Yordanov, V. Monitoring Forest Change in the Amazon Using Multi-Temporal Remote Sensing Data and Machine Learning Classification on Google Earth Engine. ISPRS Int. J. Geo-Inf. 2020, 9, 580. [Google Scholar] [CrossRef]
  31. Breiman, L. Random Forests. Mach. Learn. 2001, 45, 5–32. [Google Scholar] [CrossRef] [Green Version]
  32. Felegari, S.; Sharifi, A.; Moravej, K.; Amin, M.; Golchin, A.; Muzirafuti, A.; Tariq, A.; Zhao, N. Integration of Sentinel 1 and Sentinel 2 Satellite Images for Crop Mapping. Appl. Sci. 2021, 11, 10104. [Google Scholar] [CrossRef]
  33. Ministry of Environment and Forestry. SiPongi Karhutla Monitoring System. Available online: https://sipongi.menlhk.go.id/ (accessed on 5 March 2020).
  34. Mountrakis, G.; Im, J.; Ogole, C. Support vector machines in remote sensing: A review. ISPRS J. Photogramm. Remote Sens. 2011, 66, 247–259. [Google Scholar] [CrossRef]
  35. Lafarge, F.; Descombes, X.; Zerubia, J. Textural kernel for SVM classification in remote sensing: Application to forest fire detection and urban area extraction. In Proceedings of the IEEE International Conference on Image Processing 2005, Genova, Italy, 14 September 2005. [Google Scholar]
  36. Wang, Y.; Fang, Z.; Hong, H.; Peng, L. Flood susceptibility mapping using convolutional neural network frameworks. J. Hydrol. 2020, 582, 124482. [Google Scholar] [CrossRef]
  37. Shao, Y.; Lunetta, R.S. Comparison of support vector machine, neural network, and CART algorithms for the land-cover classification using limited training data points. ISPRS J. Photogramm. Remote Sens. 2012, 70, 78–87. [Google Scholar] [CrossRef]
  38. Gibson, R.; Danaher, T.; Hehir, W.; Collins, L. A remote sensing approach to mapping fire severity in south-eastern Australia using sentinel 2 and random forest. Remote Sens. Environ. 2020, 240, 111702. [Google Scholar] [CrossRef]
  39. Ramo, R.; Chuvieco, E. Developing a Random Forest Algorithm for MODIS Global Burned Area Classification. Remote Sens. 2017, 9, 1193. [Google Scholar] [CrossRef] [Green Version]
  40. Kontoes, C.C.; Poilvé, H.; Florsch, G.; Keramitsoglou, I.; Paralikidis, S. A comparative analysis of a fixed thresholding vs. a classification tree approach for operational burn scar detection and mapping. Int. J. Appl. Earth Obs. Geoinf. 2009, 11, 299–316. [Google Scholar] [CrossRef]
  41. Pereira, A.A.; Pereira, J.M.C.; Libonati, R.; Oom, D.; Setzer, A.W.; Morelli, F.; Machado-Silva, F.; De Carvalho, L.M.T. Burned Area Mapping in the Brazilian Savanna Using a One-Class Support Vector Machine Trained by Active Fires. Remote Sens. 2017, 9, 1161. [Google Scholar] [CrossRef] [Green Version]
  42. Chew, Y.J.; Ooi, S.Y.; Pang, Y.H. Experimental Exploratory of Temporal Sampling Forest in Forest Fire Regression and Classification. In Proceedings of the 2020 8th International Conference on Information and Communication Technology (ICoICT), Yogyakarta, Indonesia, 24–26 June 2020. [Google Scholar]
  43. Breiman, L.; Friedman, J.H.; Olshen, R.A.; Stone, C.J. Classification and Regression Trees; CRC Press: Boca Raton, FL, USA, 1984. [Google Scholar]
  44. Ananth, S.; Manjula, T.R.; Niranjan, G.; Kumar, S.; Raghuveer, A.; Raju, G. Mapping of Burnt area and Burnt Severity using Landsat 8 Images: A Case Study of Bandipur forest Fire Region of Karnataka state India. In Proceedings of the 2019 IEEE Recent Advances in Geoscience and Remote Sensing: Technologies, Standards and Applications (TENGARSS), Kochi, India, 17–20 October 2019. [Google Scholar]
  45. Bar, S.; Parida, B.R.; Pandey, A.C. Landsat-8 and Sentinel-2 based Forest fire burn area mapping using machine learning algorithms on GEE cloud platform over Uttarakhand, Western Himalaya. Remote Sens. Appl. Soc. Environ. 2020, 18, 100324. [Google Scholar] [CrossRef]
  46. Collins, L.; McCarthy, G.; Mellor, A.; Newell, G.; Smith, L. Training data requirements for fire severity mapping using Landsat imagery and random forest. Remote Sens. Environ. 2020, 245, 111839. [Google Scholar] [CrossRef]
  47. Belenguer-Plomer, M.A.; Tanase, M.A.; Fernandez-Carrillo, A.; Chuvieco, E. Burned area detection and mapping using Sentinel-1 backscatter coefficient and thermal anomalies. Remote Sens. Environ. 2019, 233, 111345. [Google Scholar] [CrossRef]
  48. Key, C.H.; Benson, N.C. Measuring and remote sensing of burn severity: The CBI and NBR. In Joint Fire Science Conference and Workshop; University of Idaho and International Association of Wildland Fire: Boise, ID, USA, 1999. [Google Scholar]
  49. Tanase, M.A.; Kennedy, R.; Aponte, C. Radar Burn Ratio for fire severity estimation at canopy level: An example for temperate forests. Remote Sens. Environ. 2015, 170, 14–31. [Google Scholar] [CrossRef]
  50. Addison, P.; Oommen, T. Utilizing satellite radar remote sensing for burn severity estimation. Int. J. Appl. Earth Obs. Geoinf. 2018, 73, 292–299. [Google Scholar] [CrossRef]
  51. Indraswari, R.; Arifin, A.Z. RBF kernel optimization method with particle swarm optimization on SVM using the analysis of input data’s movement. J. Ilmu Komput. Dan Inf. 2017, 10, 36. [Google Scholar] [CrossRef]
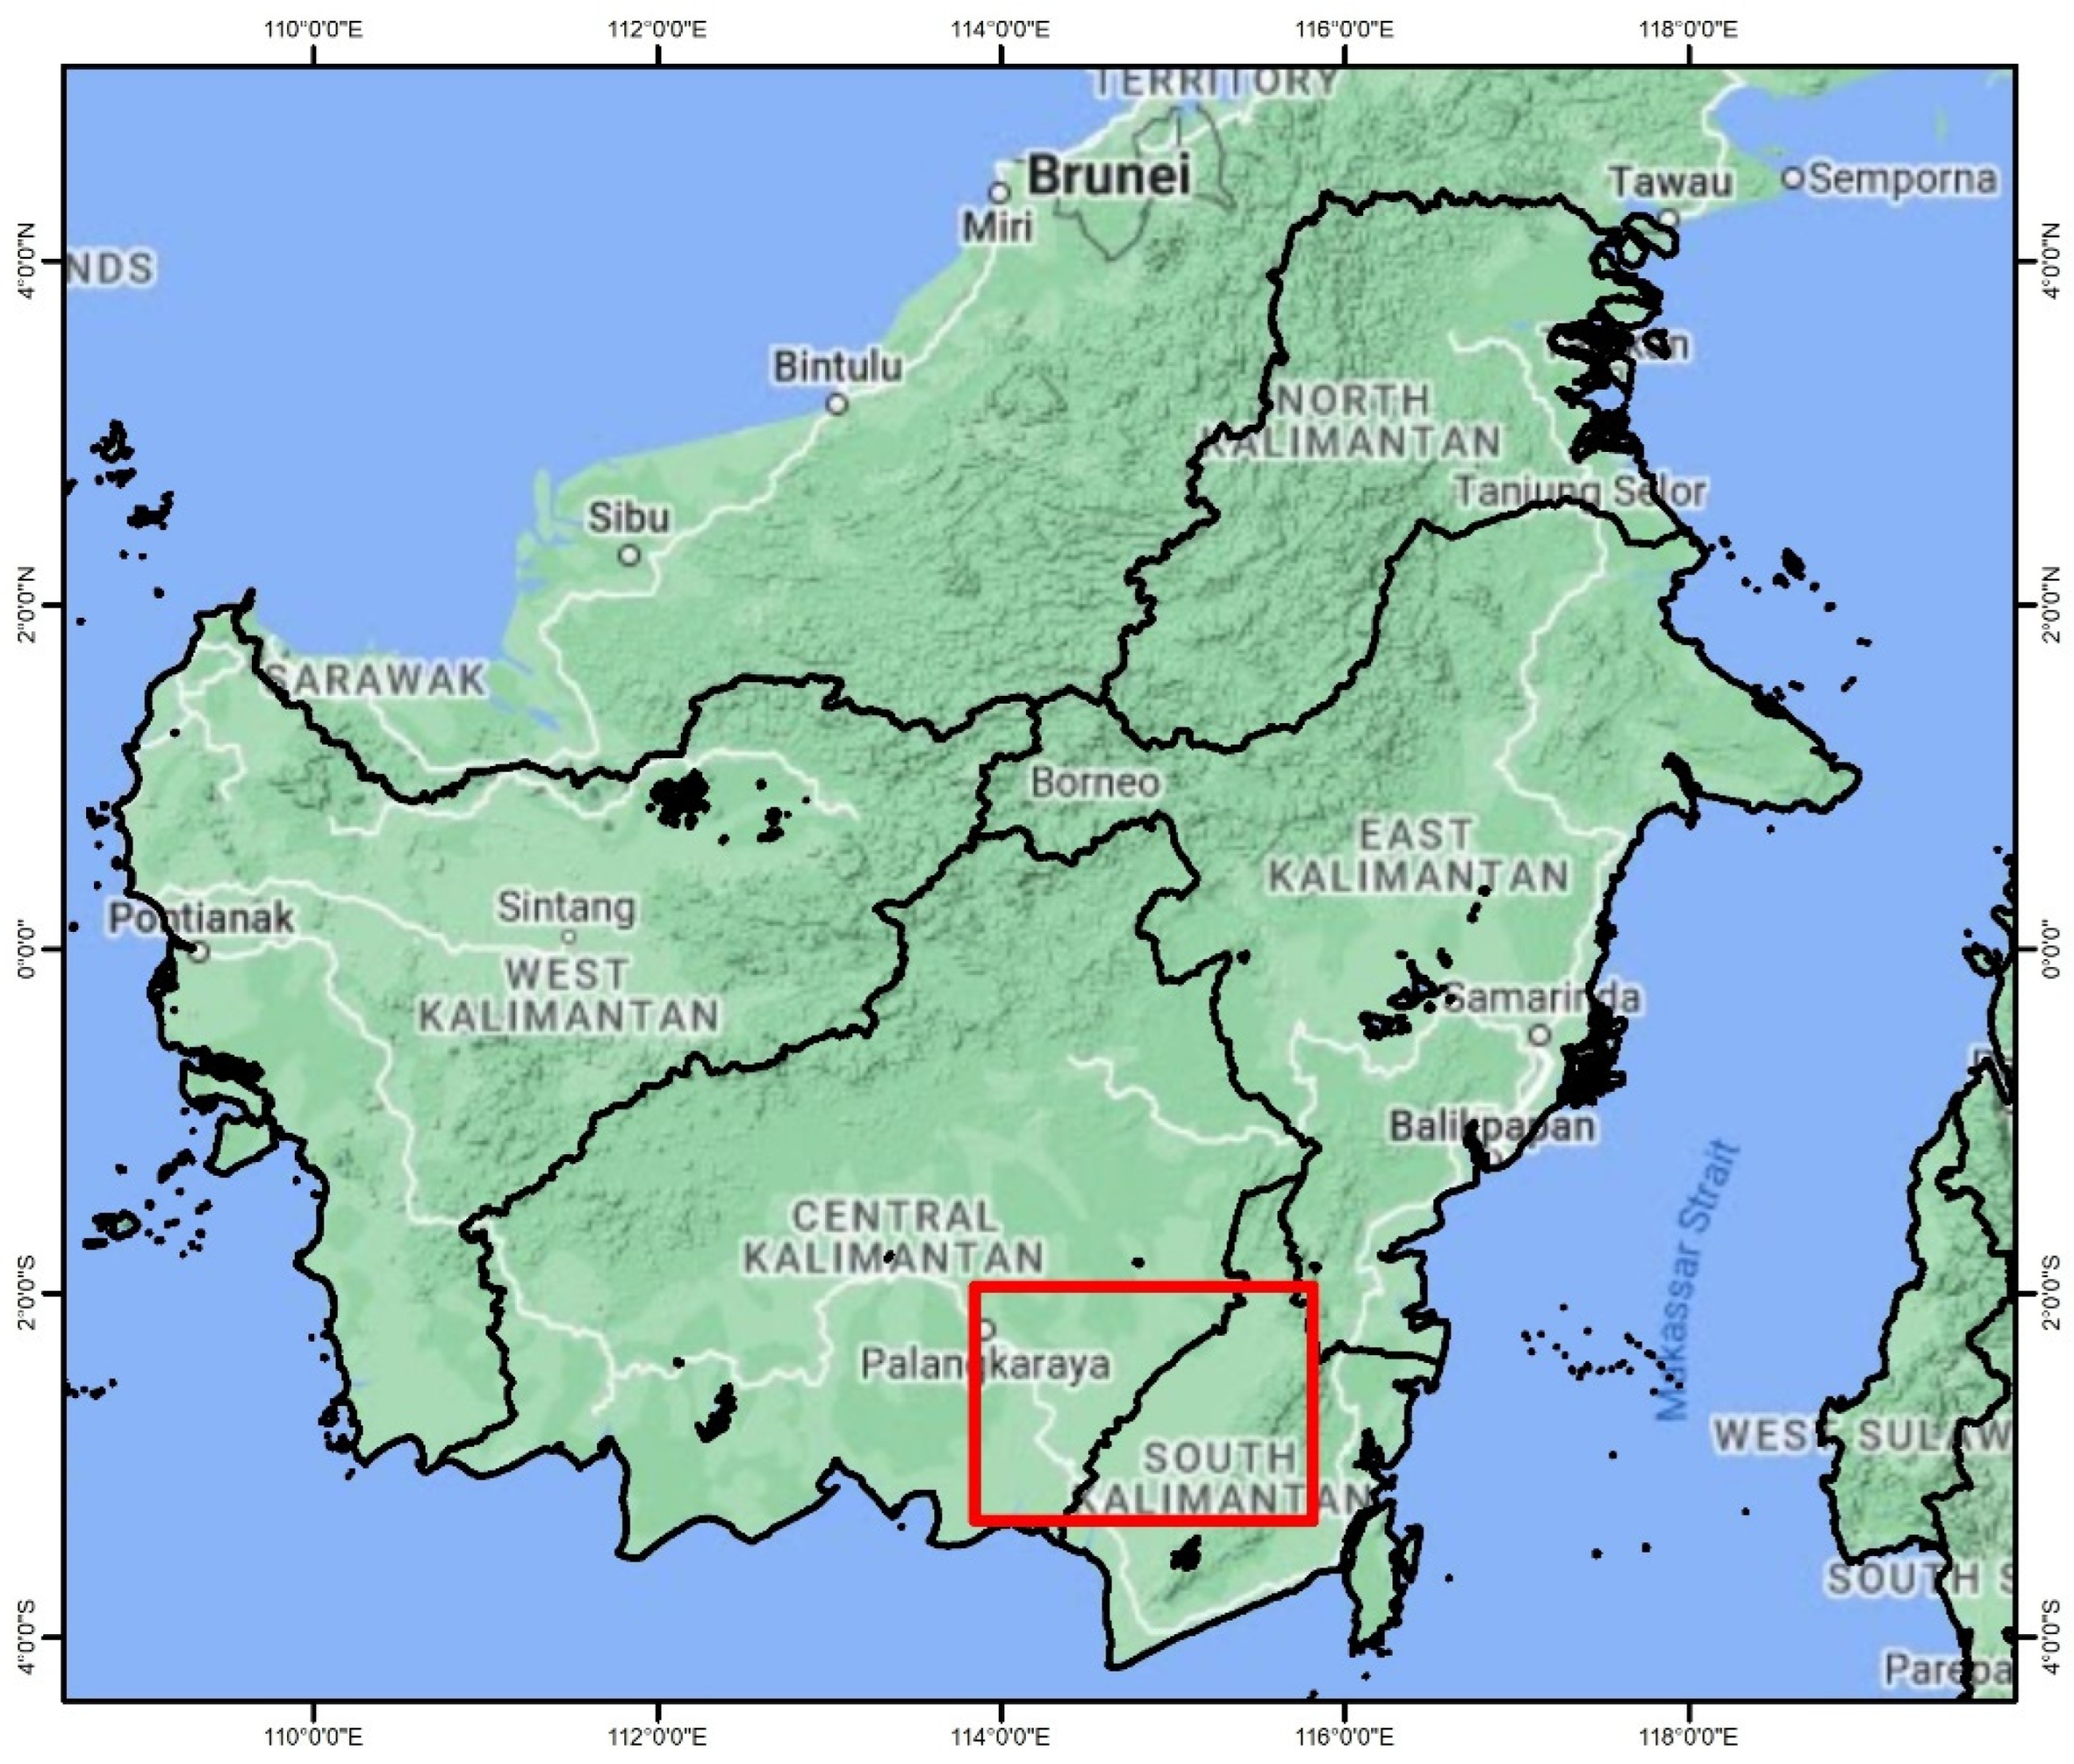
Figure 1. Areas of interest/sampling areas on Kalimantan island.
Applsci 12 11922 g001
Figure 2. The advantages of the SAR data, compared to the optical sensors for the detection of the burn scar areas where visually, it is not covered by clouds and smoke.
Applsci 12 11922 g002
Figure 3. Flow chart of the burnt area identification process using cloud computing.
Applsci 12 11922 g003
Figure 4. Sample of the cross-polarized and co-polarized image and its difference from the Sentinel-1a SAR images with the actual Hotspot data.
Applsci 12 11922 g004
Figure 5. Cross-polarized and co-polarized radar burn ratio and radar burn difference from the Sentinel-1a SAR images.
Applsci 12 11922 g005
Figure 6. The average backscatter of the burnt and unburnt areas in each variable (RBD_VH, RBD_VV, RBR_VH, and RBR_VV).
Applsci 12 11922 g006
Figure 7. The difference in the burn area of the three types of classifiers, compared to the Hotspot data.
Applsci 12 11922 g007
Figure 8. Composite RGB (RBR_VH, RBR_VV, and RBD_VV) with the AoI marked in the red rectangle, where a bright color indicates the burnt areas.
Applsci 12 11922 g008
Figure 9. Sentinel-2 image (A) before and (B) after the fire and the results of the classification (C) SVM, (D) random forest, (E) CART; and (F) the distribution of the burnt area from the reference image.
Applsci 12 11922 g009
Table 1. Parameters of the classifiers.
MethodParameterValue
CARTLeaf Node10
Random ForestTree Number10
Support Vector MachineGamma0.5
Cost10
Table 2. Overall accuracy (OA) and processing time of the classifiers, compared to the field data.
Classification MethodsSVMRFCARTField Data
UnburntBurntUnburntBurntUnburntBurnt
Unburnt435,18952,199431,69055,698384,044103,344487,388
Burnt764314,498736014,781669515,44622,141
Overall Accuracy88.26%87.62%78.40%
Process Time (Hours)11212
Publisher’s Note: MDPI stays neutral with regard to jurisdictional claims in published maps and institutional affiliations.