Abstract
Global energy shortages continue in the post-epidemic era. As clean primary energy, LNG plays an important role in the energy structure adjustment. However, with the widespread use of LNG, storage tank leaks occur frequently. In order to highlight the risk status of critical risk areas of LNG tank leakage, the “Five-high” risk system for the LNG industry, with high-risk locations, high-risk equipment, high-risk processes, high-risk personnel, and high-risk substances as first-level elements, was built. Combined with the Analytic Network Process (ANP) and normal cloud model for quantitative analysis, a safety risk analysis and assessment model for LNG storage tanks based on the ANP-normal cloud model was developed. Safety analysis was conducted with the example of an LNG storage tank area of a factory. The results show that the risk level for LNG tank leakage is level IV, with high-risk equipment being the first-level element with the highest weight and risk. The reliability of the comprehensive model was verified by AHP and fuzzy integrated analysis, and the results were basically consistent with the factory safety evaluation report. The study realizes the quantitative and visual analysis considering the correlation of risk elements and provides a new quantitative method for the safety analysis of LNG energy.
1. Introduction
As the global economy grows rapidly, the energy supply situation is becoming increasingly tense [1]. Liquefied Natural Gas (LNG) is starting to become the main source of energy in many countries and regions, replacing oil as the preferred fuel [2]. Currently, LNG energy is used in a large number of applications in industry, manufacturing, and other sectors.
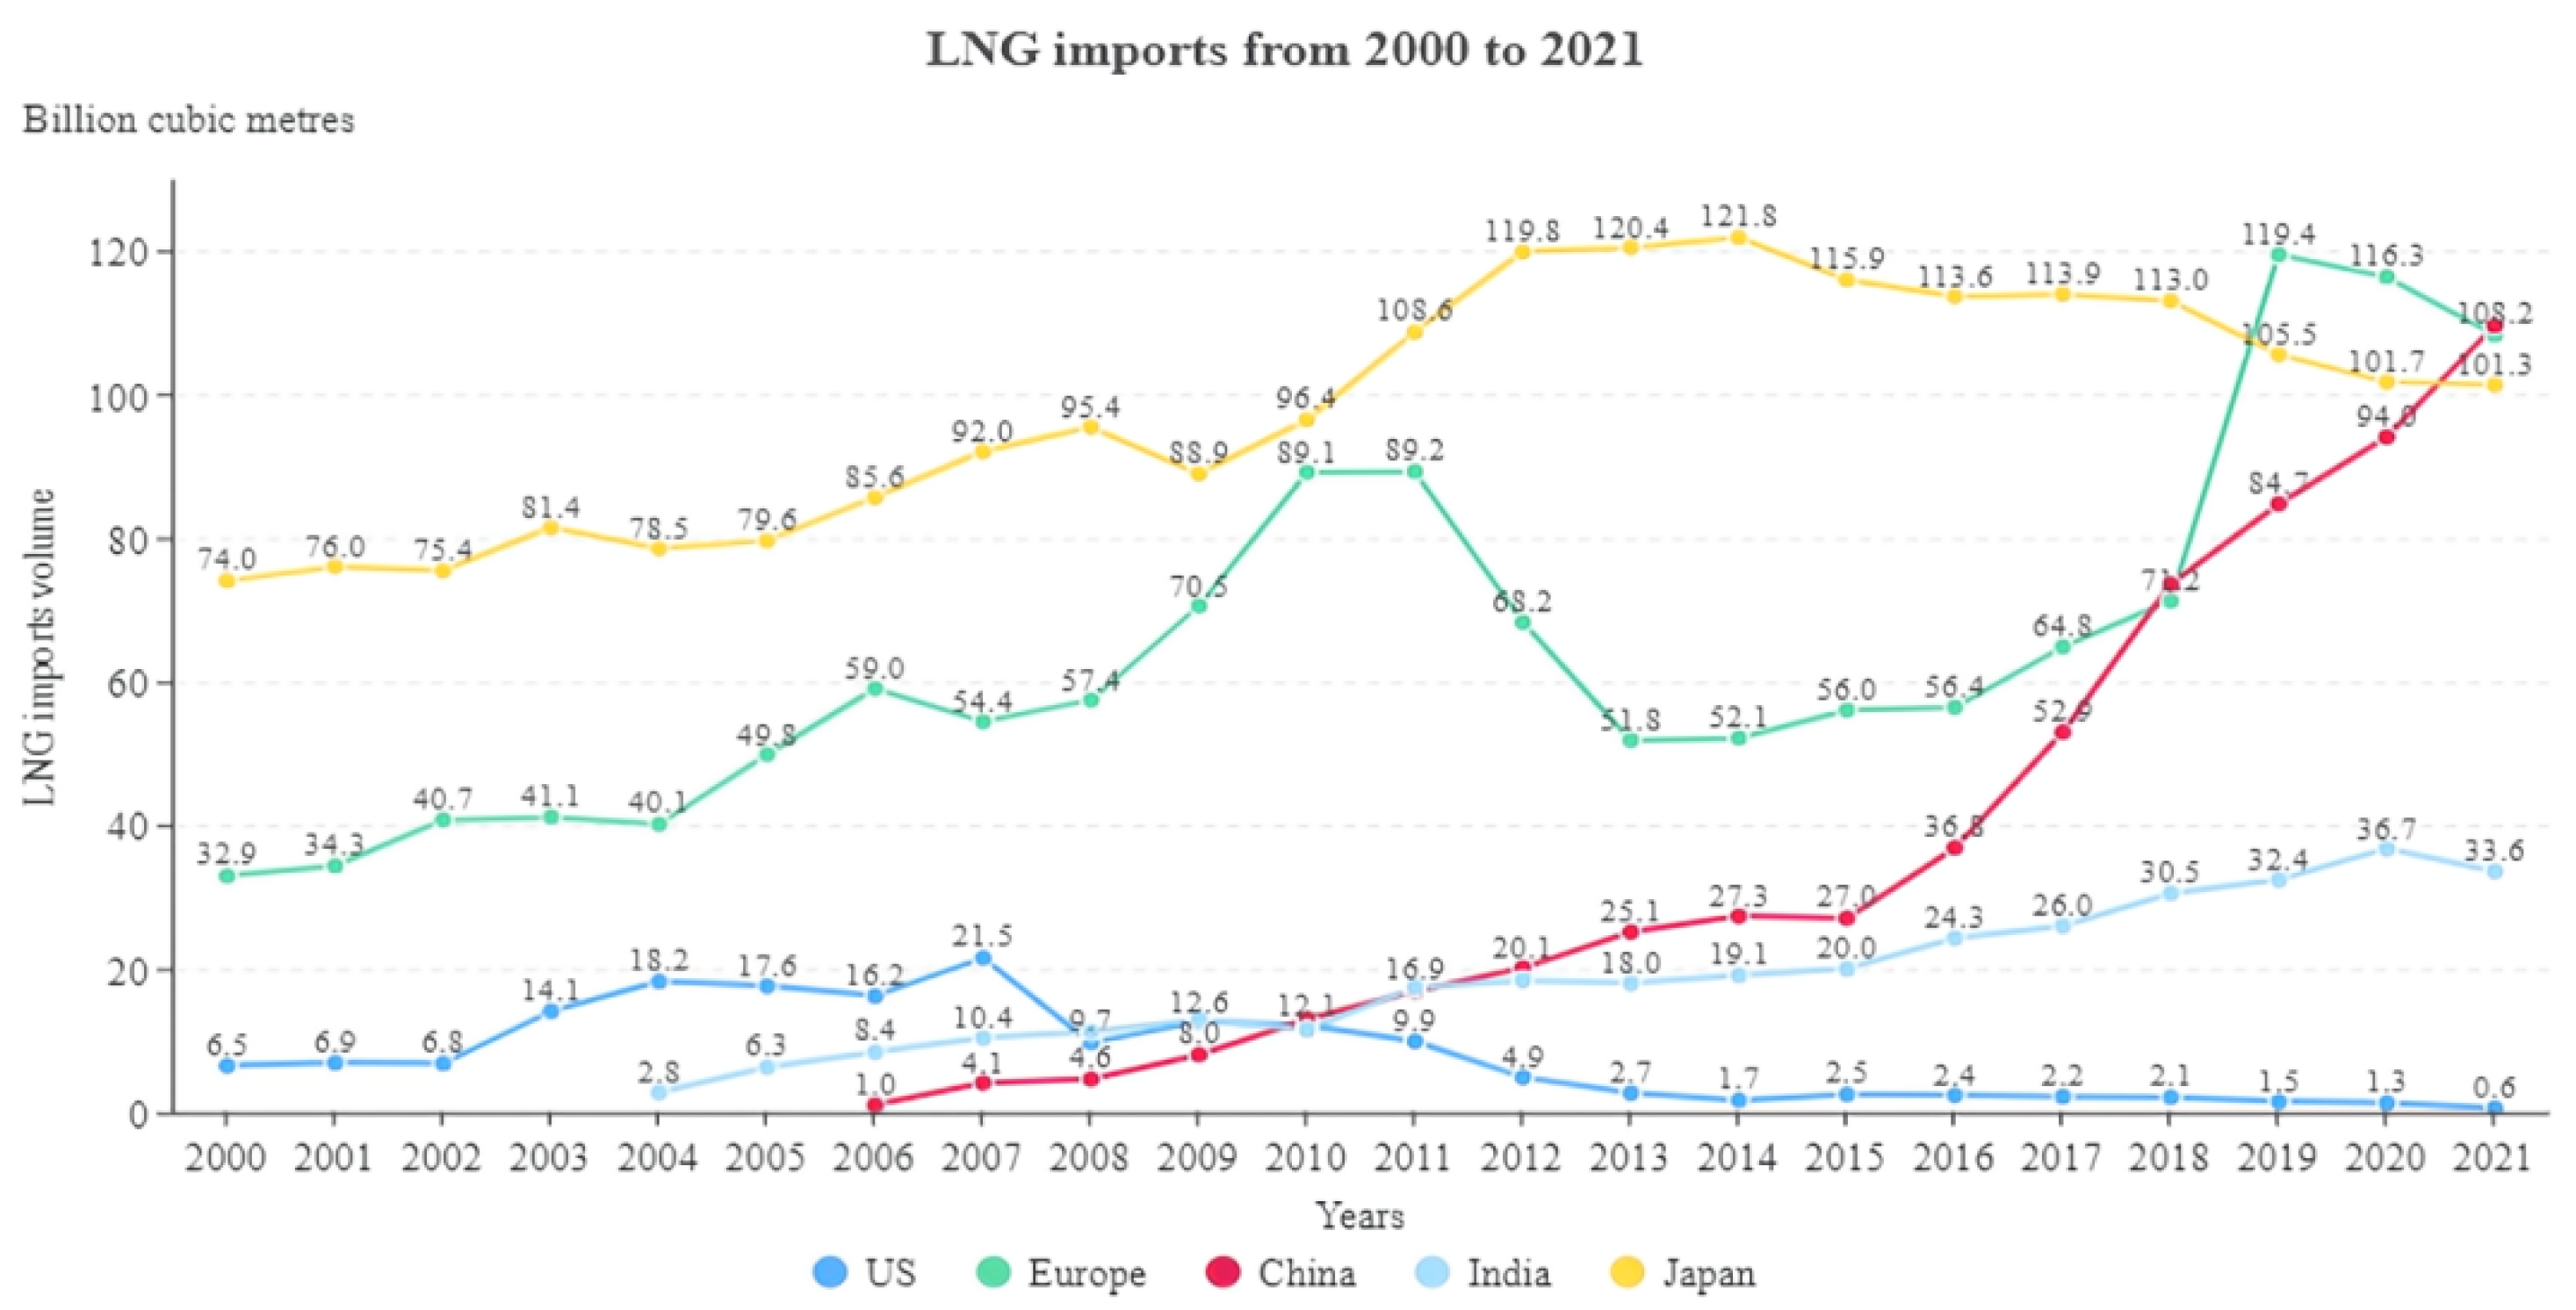
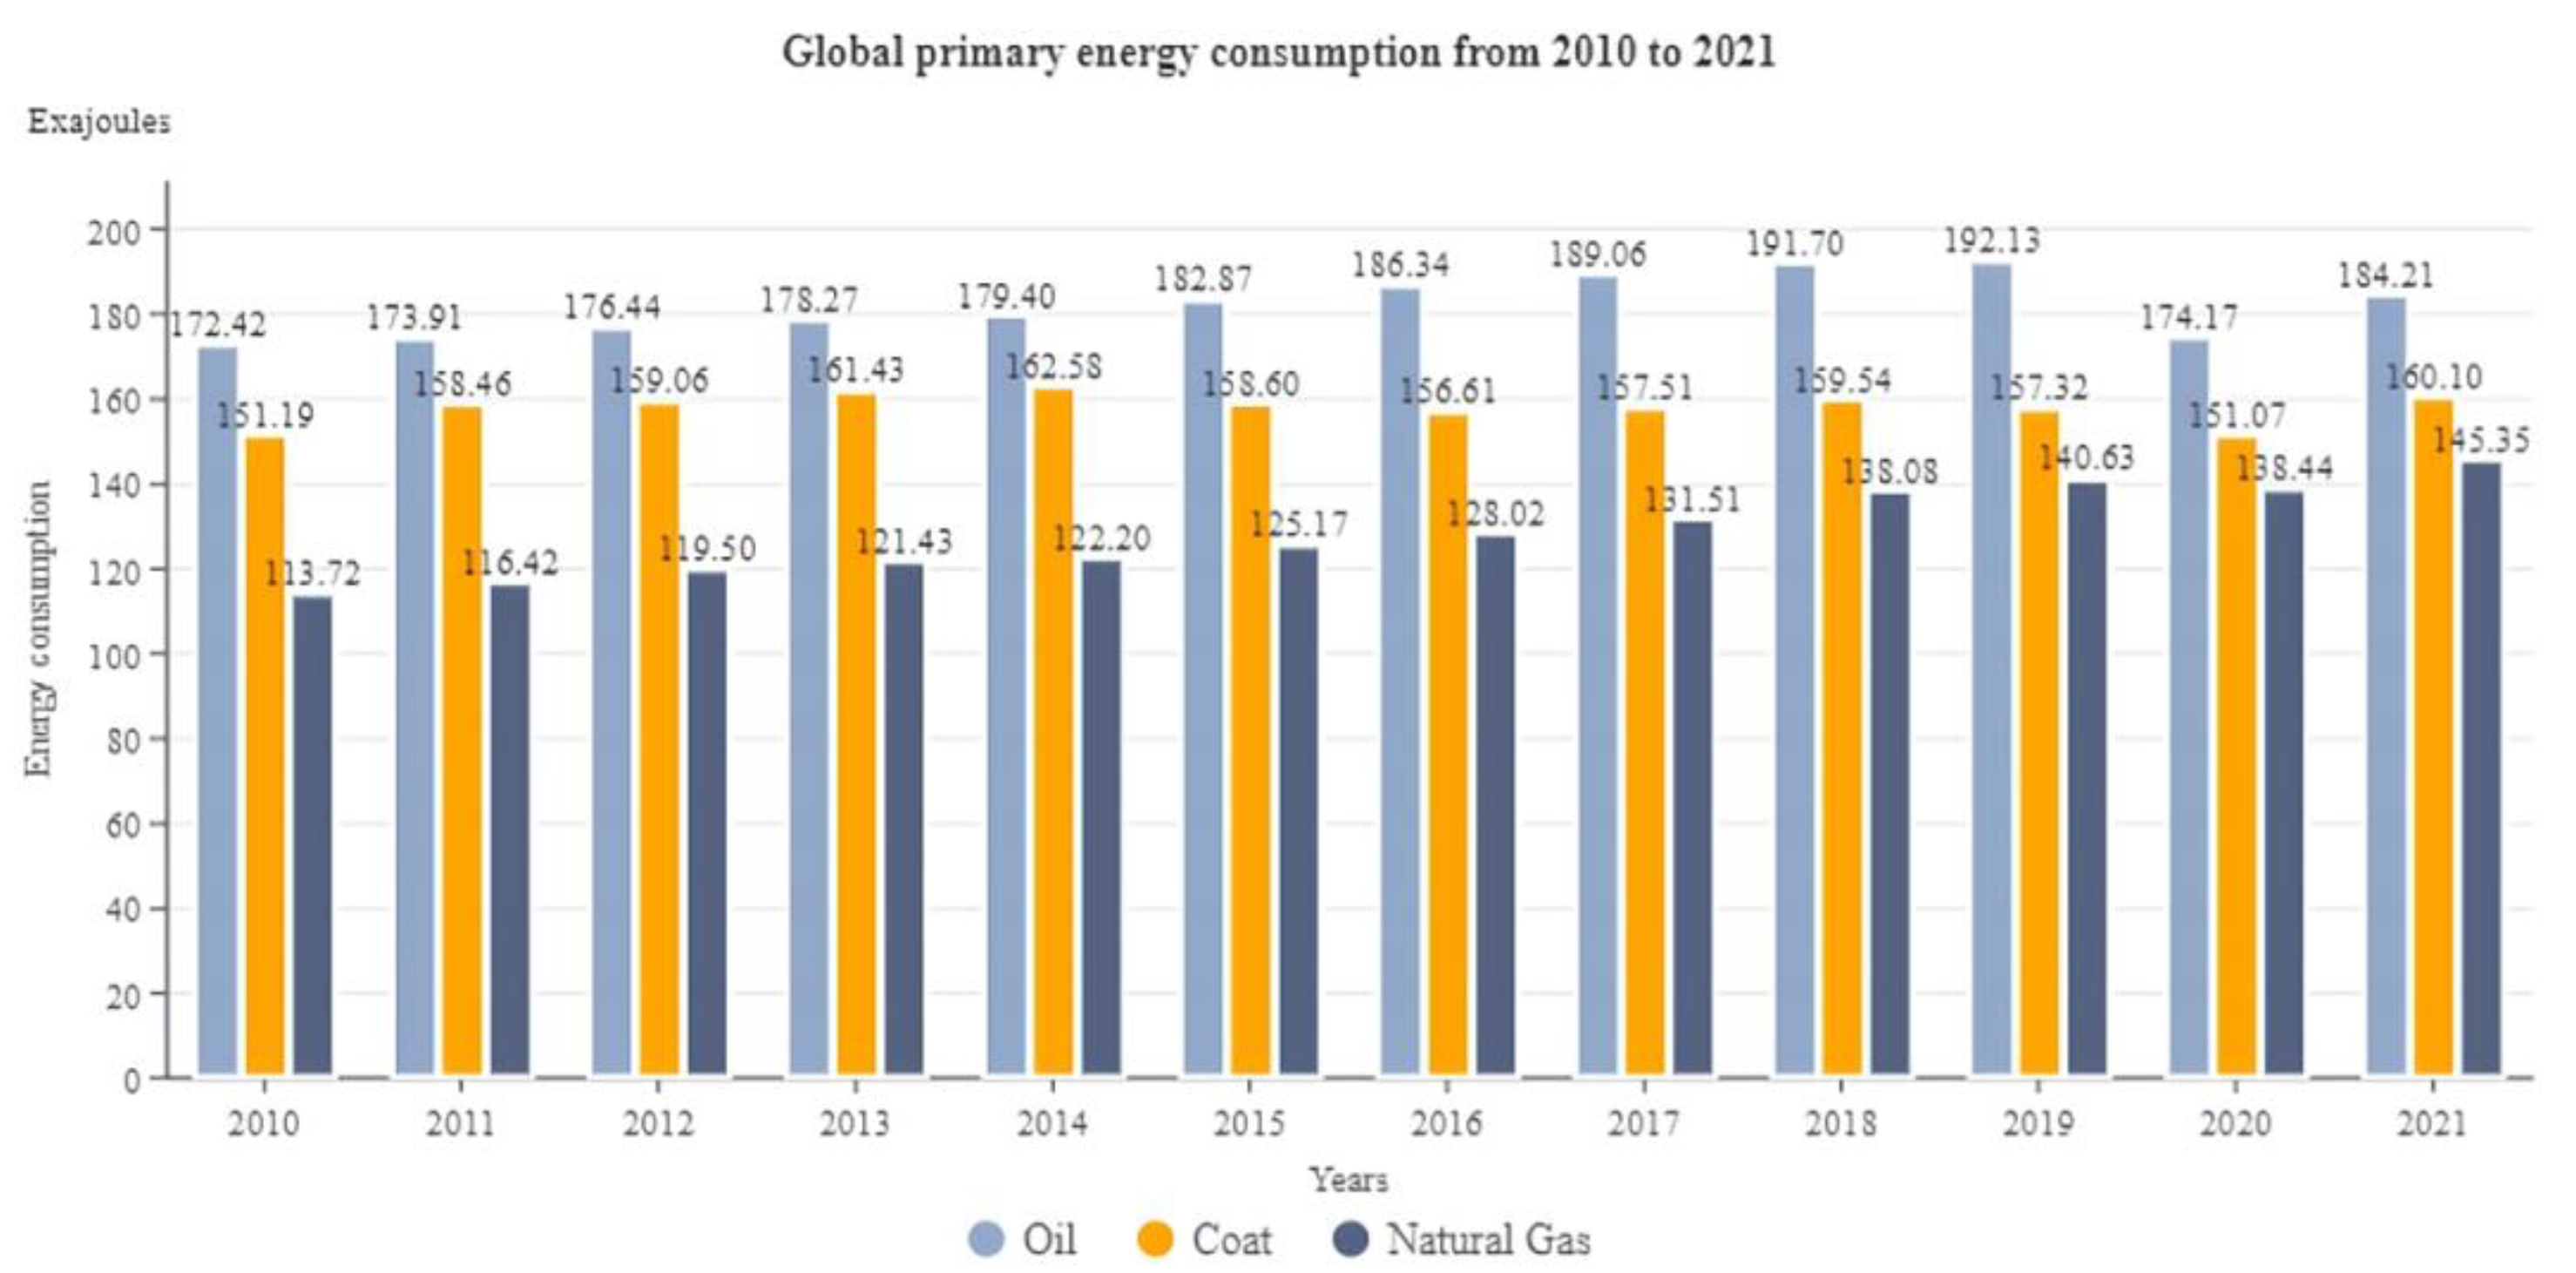
According to statistics, LNG trade increased more than two-fold between 2000 and 2020 (Figure 1), accounting for more than 20% of primary energy consumption [3,4]. Despite the SARS-CoV-2 virus being an irreversible obstacle to the world economy since 2020, with the advent of the post-epidemic era, governments have successively introduced economic recovery policies, and LNG consumption is once again on the rise (Figure 2) [4]. Ruszel et al. estimated that the LNG trade would still further increase from 485 billion cubic meters in 2019 to 585 billion cubic meters in 2025 [5]. Under the international energy changes, China’s energy structure is adjusting towards the general direction of “coal down and gas up”. LNG is widely used and gradually becoming the main energy source in China [1,2]. According to the statistics in bp Statistical Review of World Energy (2022) published by BP, the global natural gas demand grew by 5.3% in 2021. China’s natural gas demand increased by 12.8%, and its LNG imports rose by 16.8%. China has become the world’s largest importer.
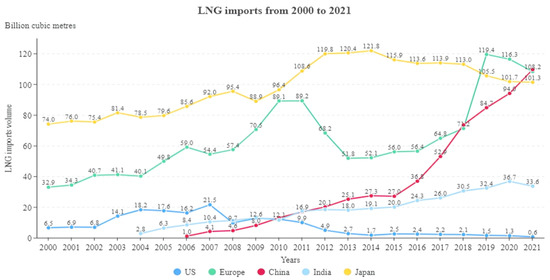
Figure 1.
LNG imports from 2000 to 2021.
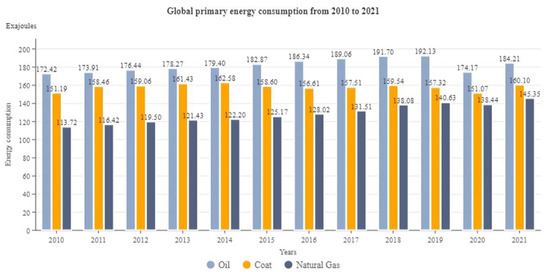
Figure 2.
Global primary energy consumption from 2010 to 2021.
LNG is low-temperature, flammable, and explosive. As LNG is always stored in large quantities, the leakage of LNG would be extremely hazardous to the surrounding personnel, equipment, buildings, and environment. Therefore, scholars at home and abroad are increasingly concerned about the safety of LNG storage, processing, and transportation processes. A large number of numerical analyses and simulations have been applied to the risk analysis of accidents and the consequences of their spread. Fault tree analysis was first applied by Kim et al. [6] to quantitatively assess the risk and failure frequency associated with LNG storage tank; Oka and Ota [7] have used methods such as the Federal Energy Regulatory Commission’s (FERC) model to assess the hazards and consequences of LNG releases leading to pool spreading and pool fires; Computational Fluid Dynamics(CFD) is used by Kazuo Koyama [8] to simulate the filling of LNG tanks of different densities to improve tank safety; Ma et al. [9] identified weaknesses in the LNG storage tank leakage failure system through the fault tree analysis, and corrected the dimorphism of the LNG storage tank fault tree with Bayesian networks to improve the accuracy of risk analysis; the bow-tie model and Bayesian model were combined by Yang et al. [10] to predict the probability of continuous type leakage accidents in LNG storage tanks, and high-frequency high-risk accidents were simulated.
In the past literature, the analytic hierarchy process (AHP) and entropy method have been mostly applied to assign weights to LNG tank leakage risk factors, and the Analytic Network Process (ANP) has rarely been applied to safety risk assessment. In contrast, ANP models are widely used in areas such as construction project management and resource allocation; the model was often used to assist with multi-criteria decision making for construction projects [11].
The ANP model has been applied successively to the transformation assessment of lean companies [12], the risk assessment of large transport infrastructures [9], and the evaluation of the mine rescue teams’ rescue capability [13]. Combining ANP, FTOPSIS, and Fuzzy Max-Min Set Method, a comprehensive Multiple Attribute Decision Making (MADM) method for evaluating water transfer projects was proposed by Razavi Toosi and Samani [14]. Gu et al. [15] combined ANP and the normal cloud model in the evaluation of regional water environment carrying capacity. The interaction and feedback relationship of different evaluation indicators are comprehensively determined in the model. Additionally, the model compensated for the defects of randomness and fuzziness in the previous evaluation of regional water environment carrying capacity. In addition to the above, the ANP model was also applied to the design of the LNG supply chain by Purwosaputra et al. [16], aiding the selection of the least costly transport model.
ANP is a decision-making method adapted to non-independent recursive hierarchies proposed by Saaty [17] based on AHP. AHP is a system consisting of one-way comparisons, which are usually better suited to ranking options according to criteria and their selection [11]. The ANP model not only has a recursive hierarchy [18,19,20] but also has the network hierarchy of internal loop control at the same level. Considering the correlation between elements, a linear structure is replaced with a nonlinear hierarchy structure. Additionally, considering the dominant role of low-level elements for high-level elements, feedback mechanisms are added to the ANP model [12,18].
To solve the above problems, the study identified different types of risk elements present in LNG storage tank leakage incidents. According to the “Five-high” risk system proposed by Xu [21,22], accident risks were classified into high-risk locations, high-risk processes, high-risk substances, high-risk equipment, and high-risk personnel. All risks leading to accidents were systematically graded and analyzed to identify accident risk factors in a comprehensive and systematic way. Next, the ANP model was built to calculate the weights by combining the cross-influences between different elements, and the results of the ANP model and the AHP model were compared and analyzed. Then, the two-dimensional normal cloud model was constructed from the two dimensions of riskiness and the impact degree of the risk elements. The model quantitatively analyzed the impact degree and riskiness of each risk factor on the occurrence of accidents. The cloud chart in the model that visually reflects the level of risk was drawn up based on the results of the analysis, which enabled visual analysis of the data. Finally, according to the conclusion of the ANP-normal cloud model, and combined with the actual situation on the site, corrective measures and solutions were proposed in a targeted manner.
Compared with previous studies, the study comprehensively considers the self-correlation and intercorrelation of different risk elements of LNG leakage accidents, and the weights are closer to reality. On the premise of ensuring the accuracy of the evaluation results, the normal cloud model is used to realize the quantification and visualization of the risk elements, which greatly reduces the probability of a leakage accident in the LNG storage tank.
2. The Analytic Network Process
In the evolution that leads to accidents, the internal relationships within the same hierarchy are similar to a complex network. Different risk elements at the same level may be independent, interrelated, and self-relating or even have subordinate and dominant relationships [15]. Briefly, elements of the system influence or are influenced by other elements. LNG storage tank leakage accidents have typical characteristics described above.
Currently commonly used MCDM methods include AHP, the Technique of Order of Preference by Similarity to the Ideal Solution (TOPSIS), and other decision-making methods [23]. However, none of the above methods can consider the interdependence between risk factors leading to accidents. AHP is the most common MCDM method in risk assessment, and most previous studies used AHP to evaluate risk factors. AHP only considers the linear association between different hierarchies but ignores the interdependence between indicators, which exists with certain limitations and deviations [24,25].
Analytic Network Process is a decision-making method based on the Analytic Hierarchy Process (AHP) that adapts to a non-independent recursive hierarchy. Compared with the AHP model, the ANP model exists not only a hierarchical structure [18,19,20] but also a network hierarchy of internal recycling dominance at the same level. ANP is able to consider the internal connections of the clusters, replace the linear hierarchy with a nonlinear structure, and add the feedback mechanism to consider the dominant role of low-level elements on high-level elements [23]. The model solves the limitation of independent internal elements within the same level of AHP and comprehensively considers the complex interrelationships between different criterion layers [24]. The calculations of ANP are more realistic. Moreover, ANP is an MCDA method capable of providing consistency verification, so it is also able to observe the interdependencies between all elements involved in the process [16]. The application of the ANP model is more accurate and comprehensive in the weighting process of the LNG storage tank leakage assessment model.
2.1. Establishing Indicators System
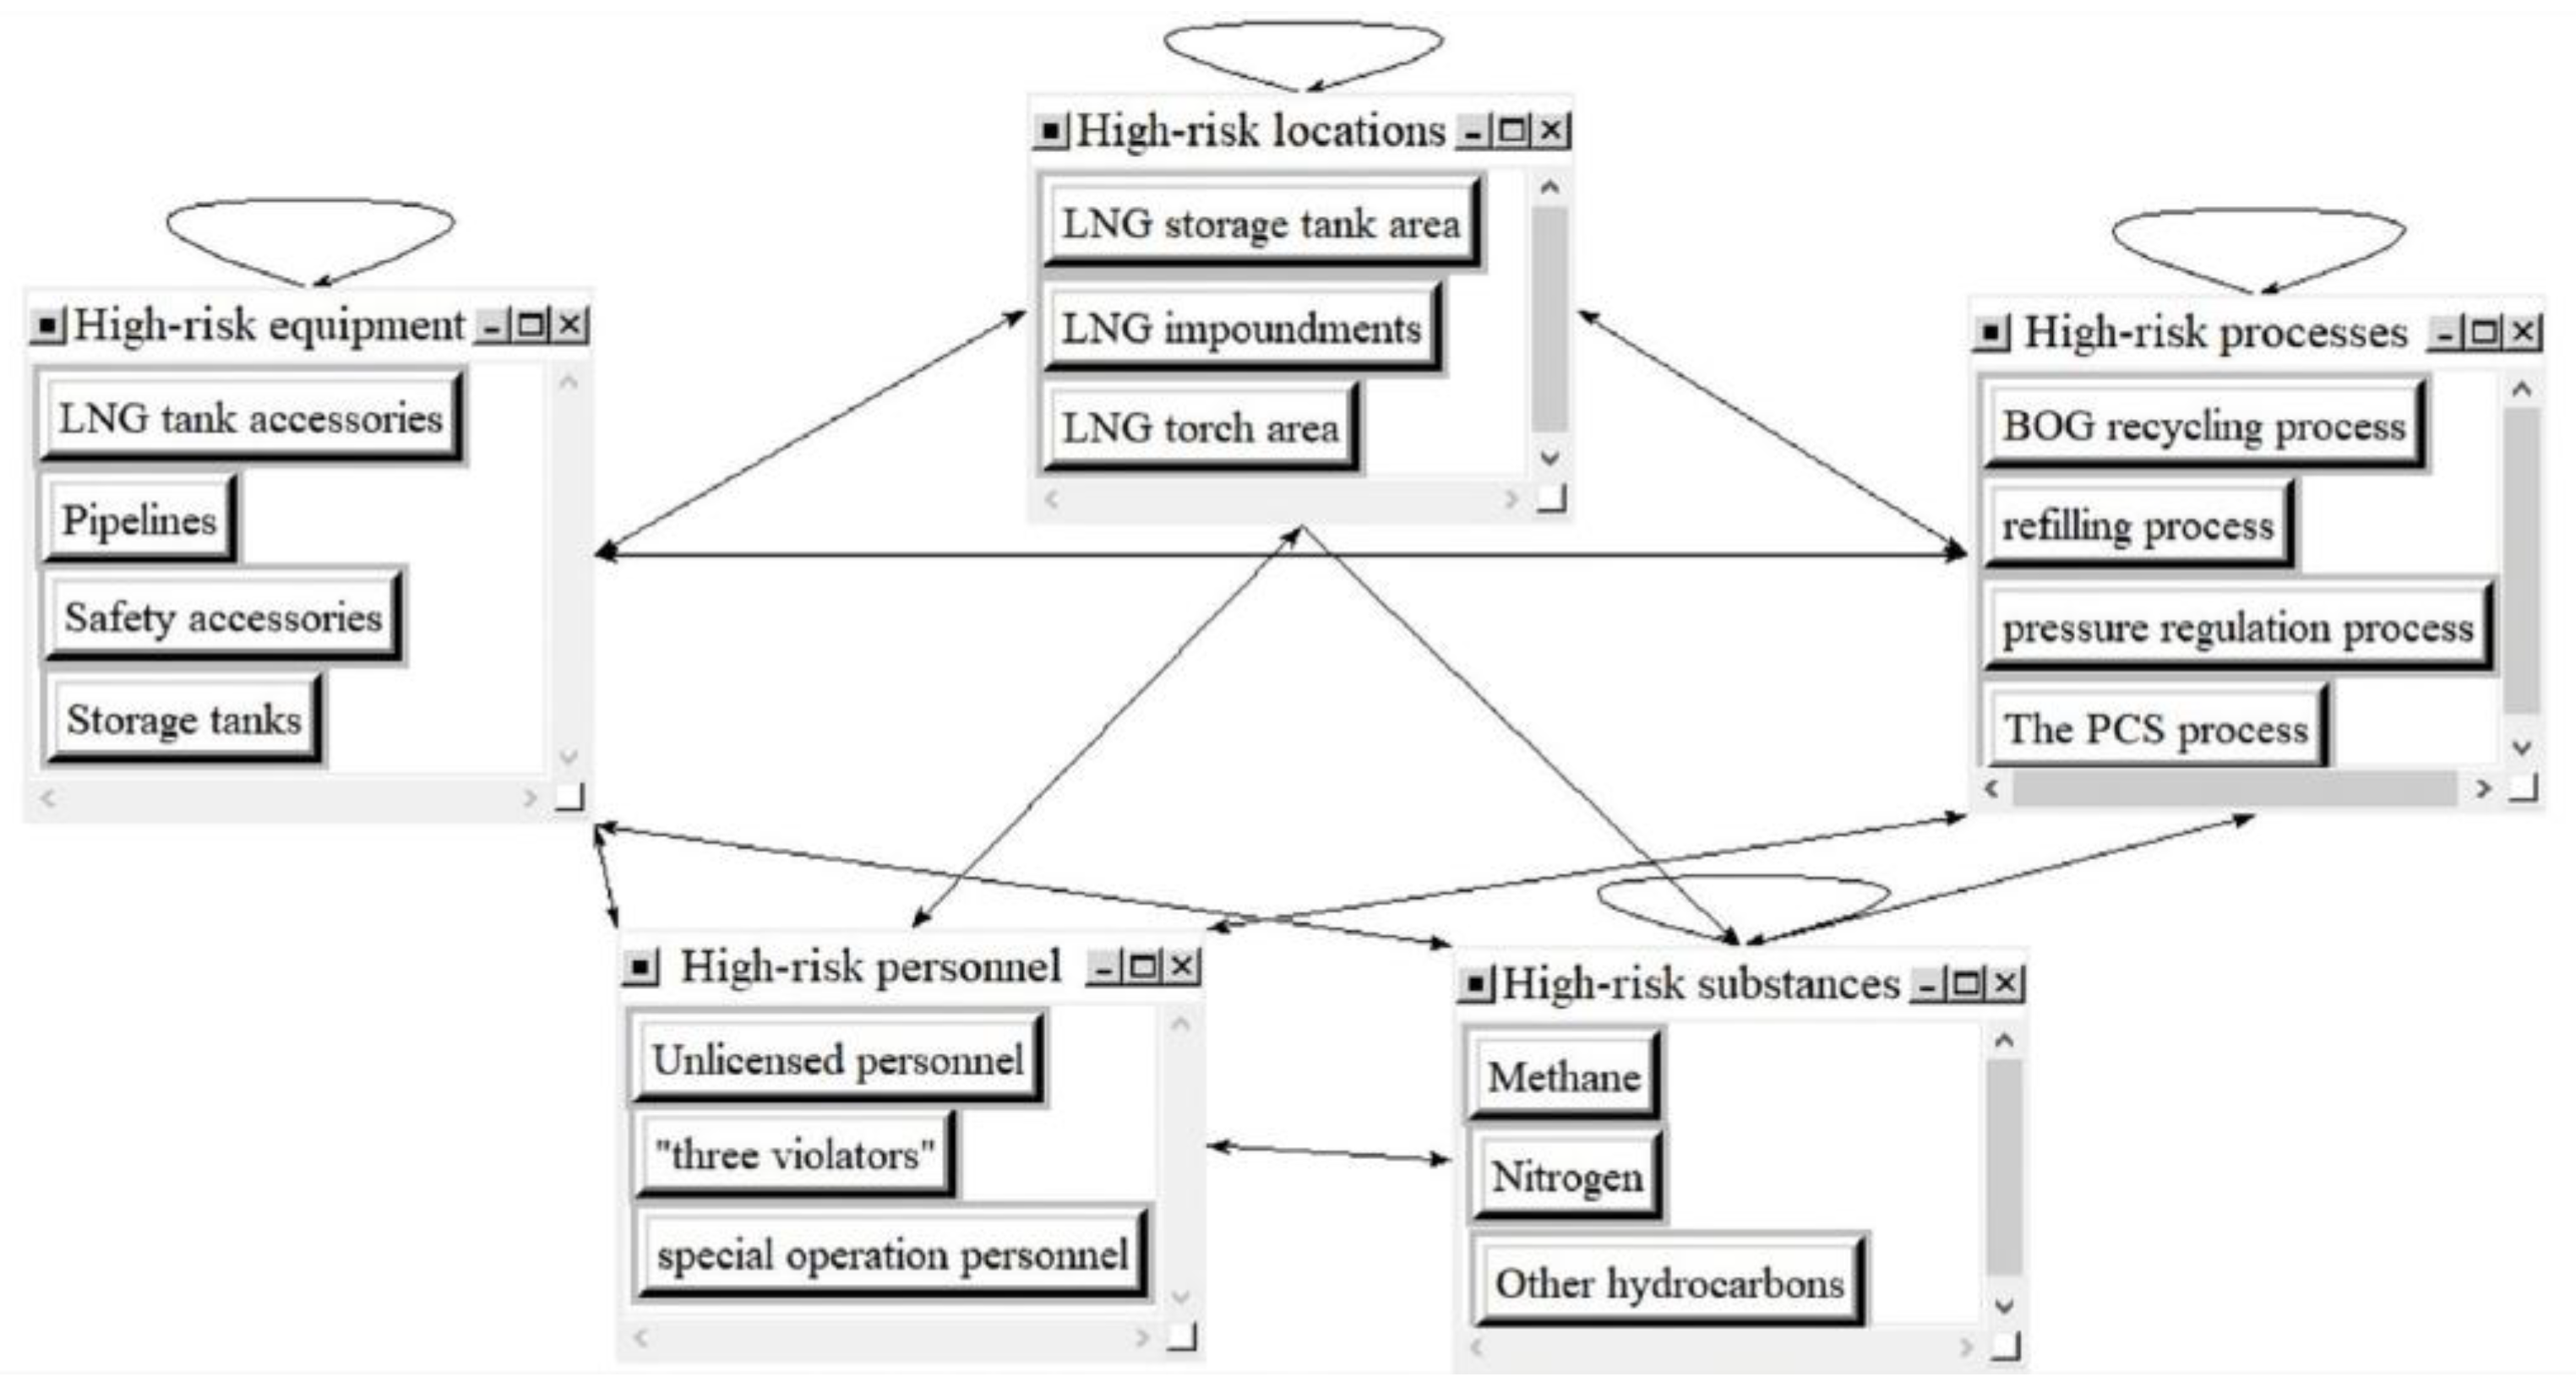
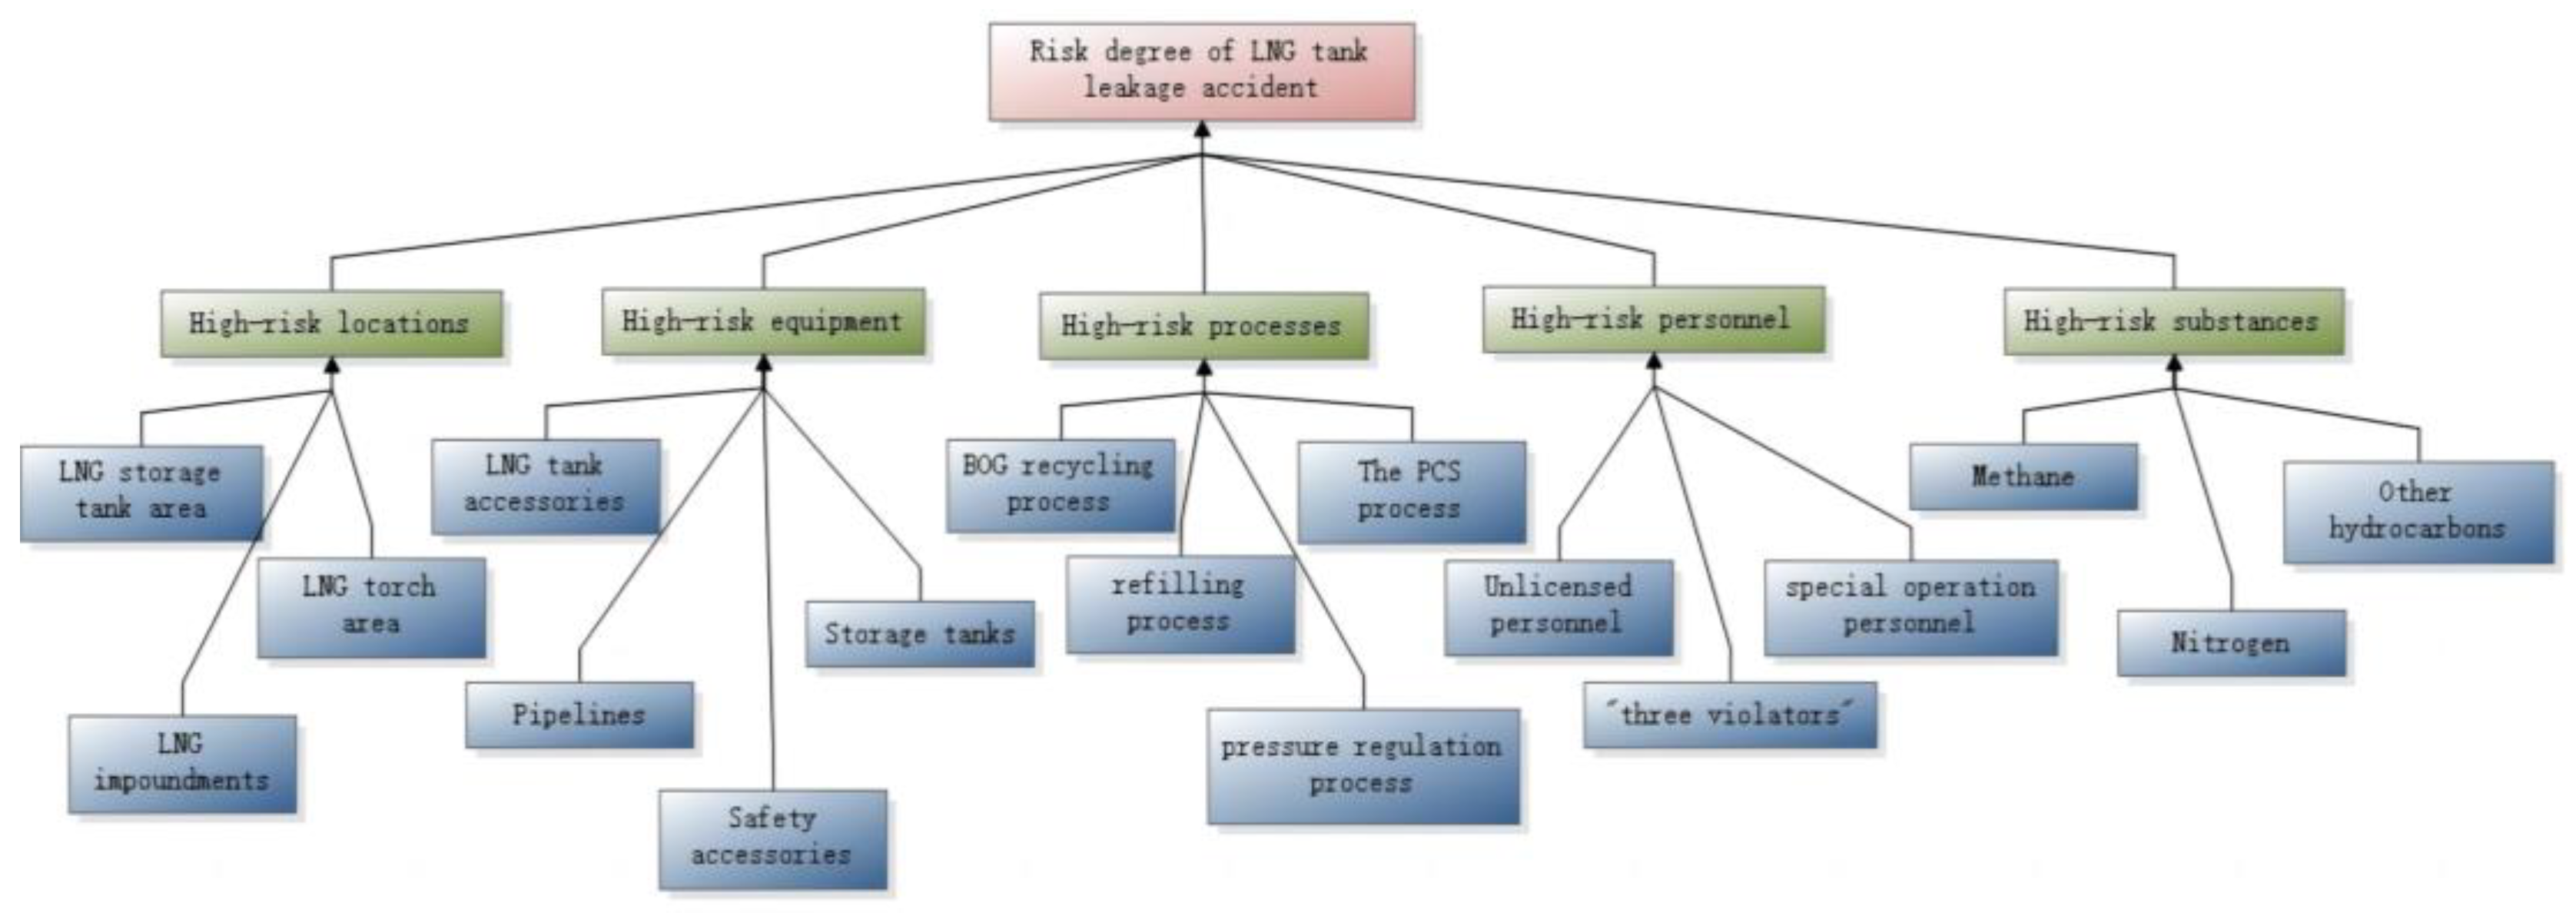
Through the investigation of the relevant data in some LNG factories in China, five first-level indicators and seventeen second-level indicators were constructed from five categories of high-risk factors “locations”, “equipment”, “processes”, “personnel”, and “substances” (Table 1). Considering the cross influence of elements or groups of elements at the network level, integrating analysis of the chain reaction of the different risk elements present and the self-influence of the risk factors, the index system (Figure 3), and the ANP model considering the network structure were established.

Table 1.
Risk element indicators and descriptions.
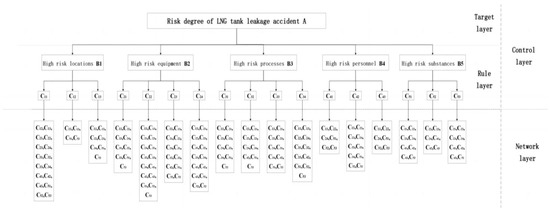
Figure 3.
The diagram of LNG storage tank leak assessment indicator system.
According to the established index system, the risk of the accident was decomposed into different component factors. All clusters and nodes in the cluster were created in Super Decision Software. Then, using the Delphi method, experts with relevant qualifications were invited to assess the correlation between the elements.
In order to ensure the accuracy and credibility of the data obtained, the invited experts are all the experts from Hubei Province Safe Production Expert Database. Considering that experts of different ages have different field experiences and that they are differently adapted to new technologies in the industry, five experts with different ages, working years in hazardous chemicals, titles, and relevant qualification holdings were randomly invited, as shown in Table 2.
Table 2.
Relevant information of expert group.
All the experts were ensured not to communicate with each other and complete scoring independently. The scoring results of the experts were collected and summarized respectively. Comparative relationships were established for the indicators with identified correlation in the Super Decision software. For indicators with unclear correlation or a large difference in assessment, five experts were invited again to repeat the evaluation of these indicators separately until the correlations between all indicators were evaluated. Finally, the ANP structure model was generated in the Super Decision software with all the comparisons.
Figure 4 shows a structural model of the ANP constructed in Super Decision software. The model includes all the risk indicators of an LNG storage tank leakage incident and the interconnections between the indicators.
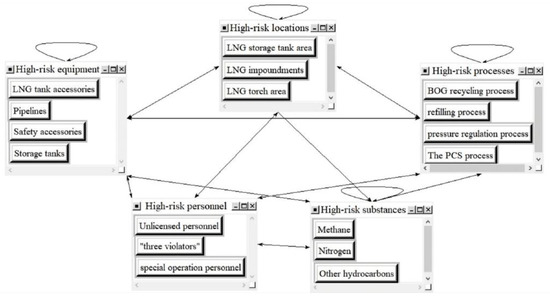
Figure 4.
ANP structure model.
2.2. Calculation of Weights in ANP Model
Assuming an LNG storage tank leakage accident risk level as target element A, high-risk location, high-risk equipment, high-risk processes, high-risk personnel, and high-risk substances are respectively classified as B1, B2, B3, B4, and B5, and the secondary element is set to Cij (i = 1, 2, …, 5; j = 1, 2, … n). The judgment matrix is constructed using B1 to B5 as the criterion and Cij as the secondary criterion. R sets of expert scoring data S1,…, Sr obtained by expert scoring, and the overall standard deviation σij [19,20] of the expert evaluations is calculated with Equation (1), see Equation (1).
All the in the study are calculated to satisfy < 1, expert opinions are considered to be relatively uniform. The arithmetic mean of the expert ratings is used as the evaluation result of the group at this point.
According to the correlation between different risk indicators, different risk factors are compared pairwise basis on a scale from 1 to 9. The comparison matrix between the two indexes is constructed to obtain 5 first-level index judgment matrices and 52 second-level index judgment matrices, and consistency ratios CR of the calculated judgment matrices are used to conduct the consistency analysis to ensure that the CR of all judgment matrices are less than the acceptable level (0.1) [25].
Cluster for high-risk locations as an example, the results are shown in Table 3.
Table 3.
Priority comparison of cluster of high-risk locations.
The degree of association of first-level indicators is shown in Table 4.
Table 4.
Cluster matrix view.
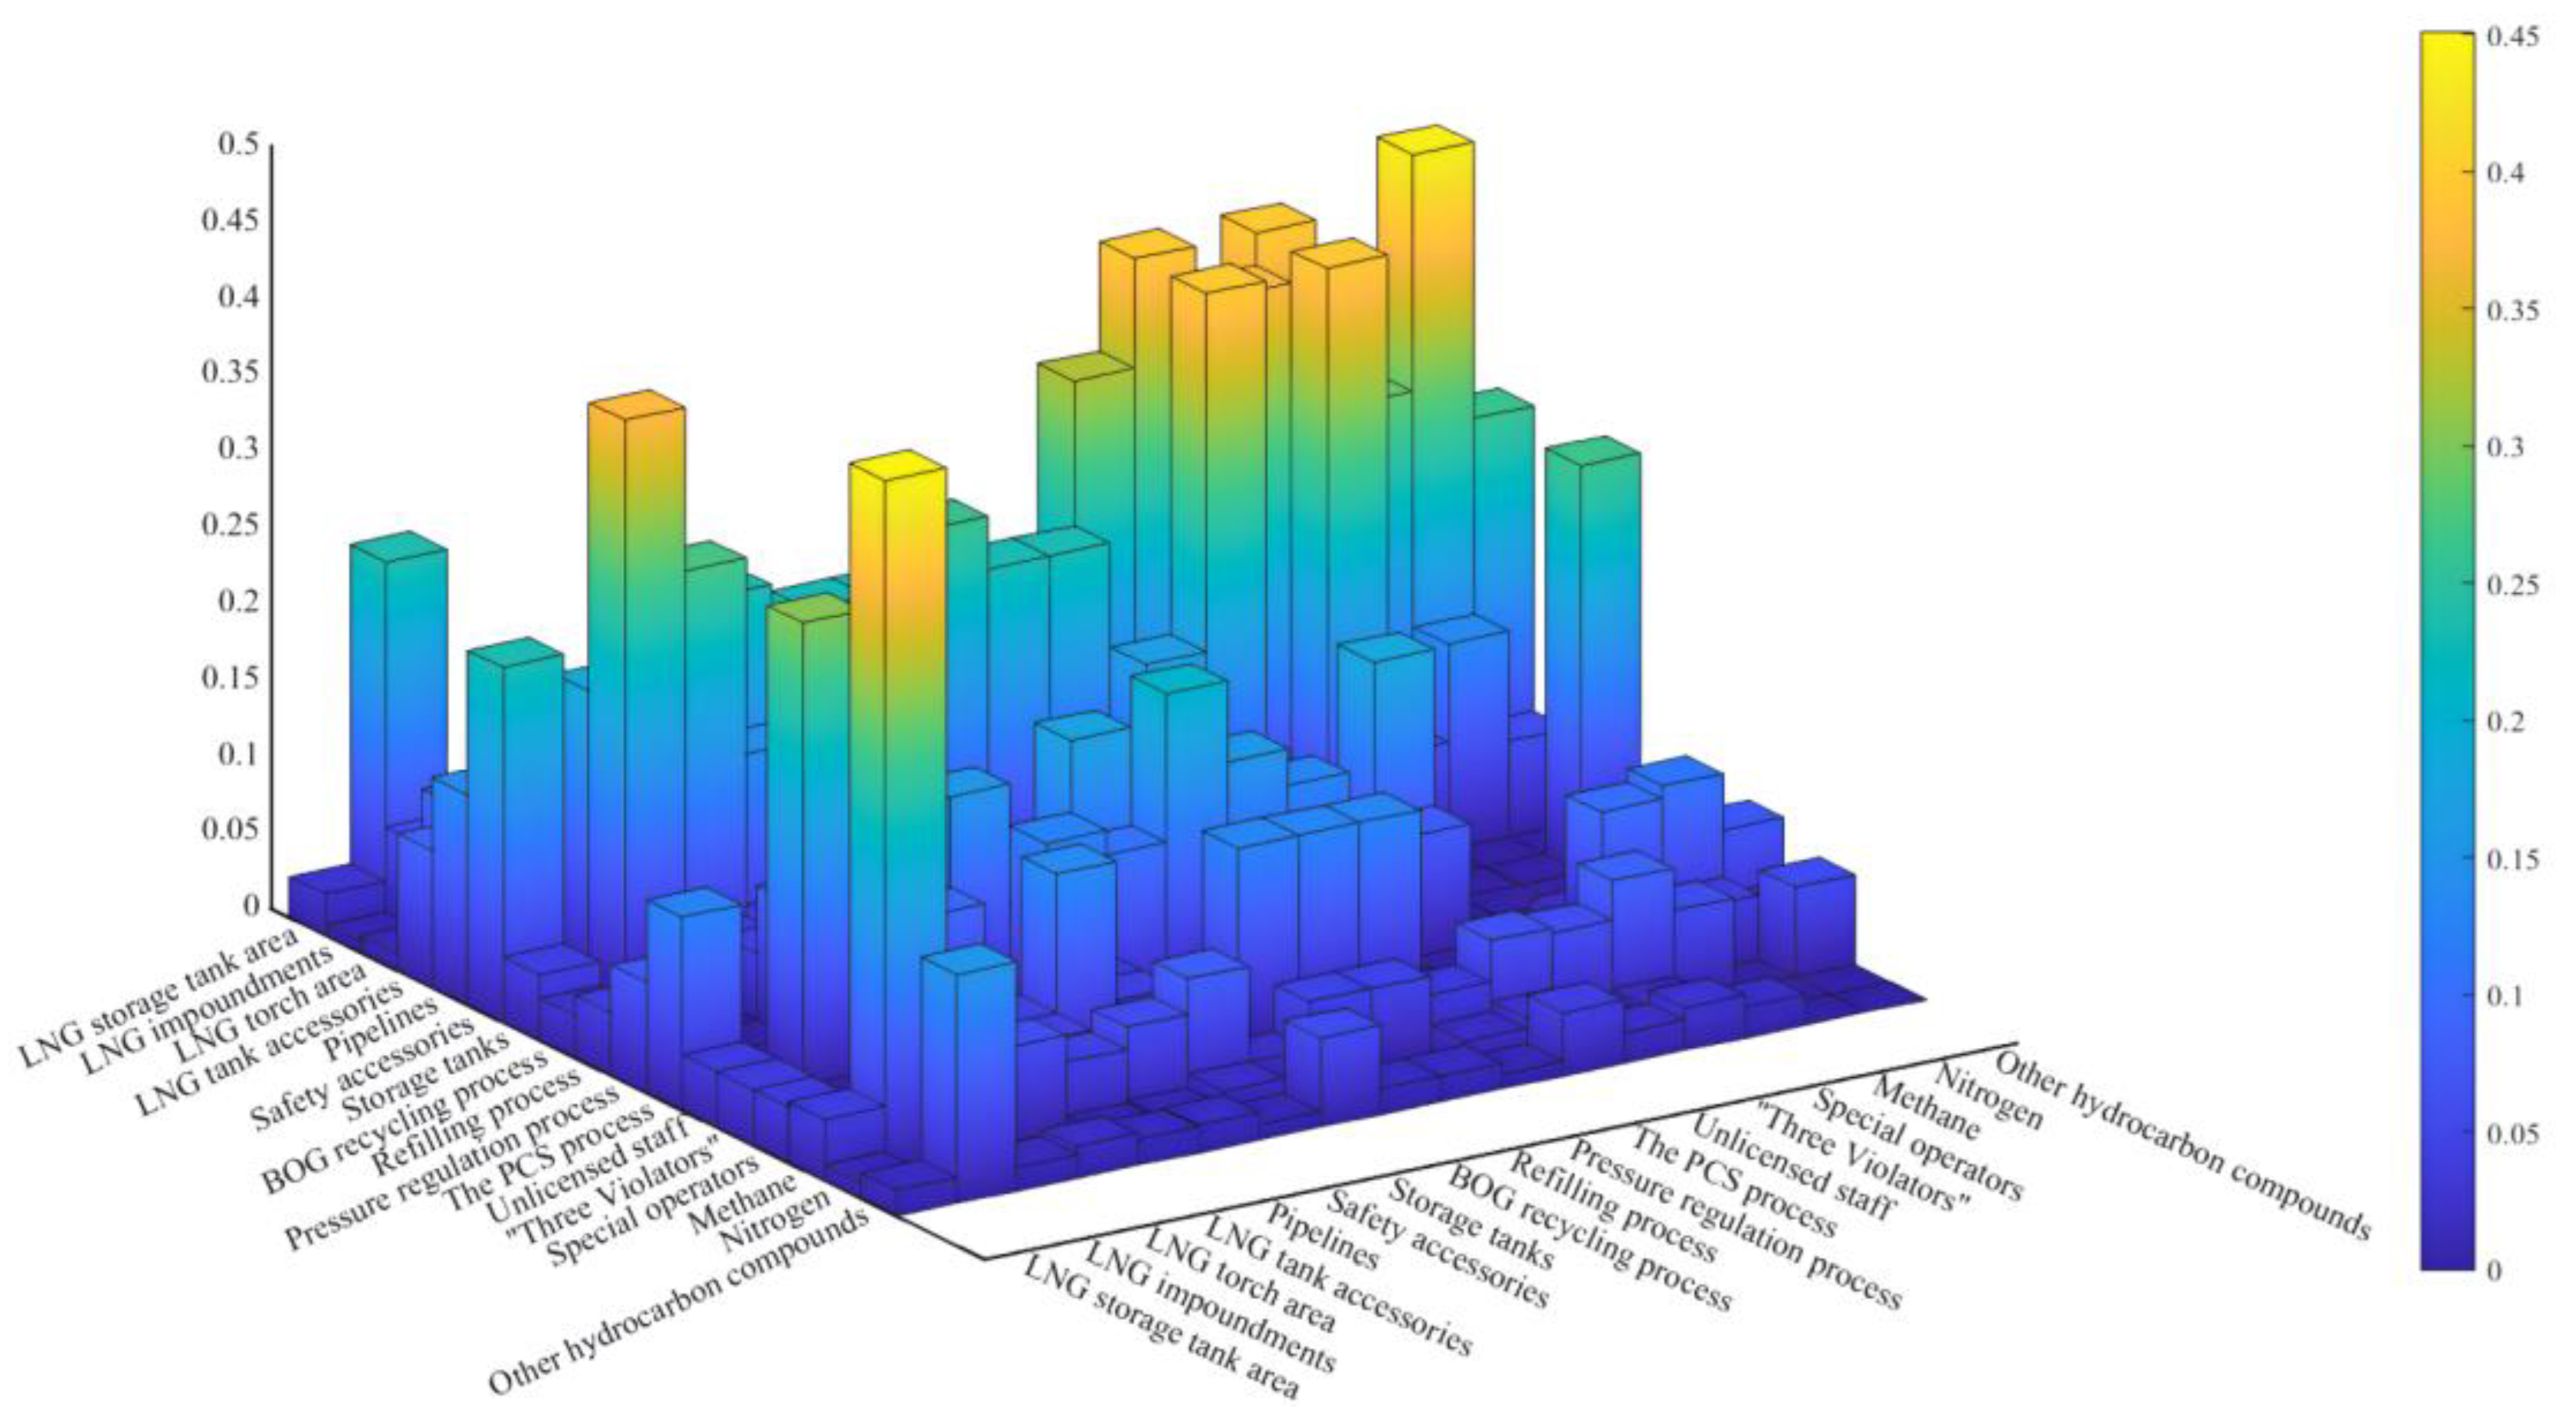
According to the judgment matrix of second-level indicators constructed above, the Super Decision software automatically generates the correlation degree of secondary indicators. Due to a large number of secondary indicators, in order to show the correlation between indicators more intuitively, the degree of association of second-level indicators is shown in Figure 5. The blocks in the figure gradually change from blue to yellow according to the increasing degree of association between the secondary indicators.
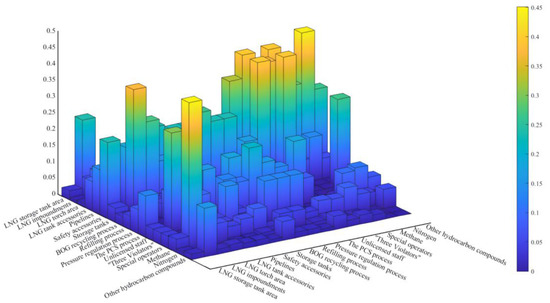
Figure 5.
Three-dimensional correlation heat map of secondary indicators.
The unweighted super matrix Aij is constructed from the ranking vector obtained by the characteristic root method,
The super matrix Aij was derived by a pairwise comparison of the elements, so the column vector is the sort vector degree to which the elements Ci1~Cin in the elements of the element set Bi are affected by the elements Cj1~Cjn in the element set Bj. Specifically, if the elements in Bj are not affected by Bi, then aij = 0 [26].
The five calculated non-negative super matrices are normalized to obtain the weighted super matrix Wij.
In order to reflect the interrelationships between the different risk factors more accurately, thus ensuring that the super matrix reaches a steady state, limits are derived for the weighted matrix. The limiting super matrix is constructed, as shown in Table 5. The stable values corresponding to the secondary elements in the limiting super matrix represent the final weight of the index.
Table 5.
Limiting super matrix.
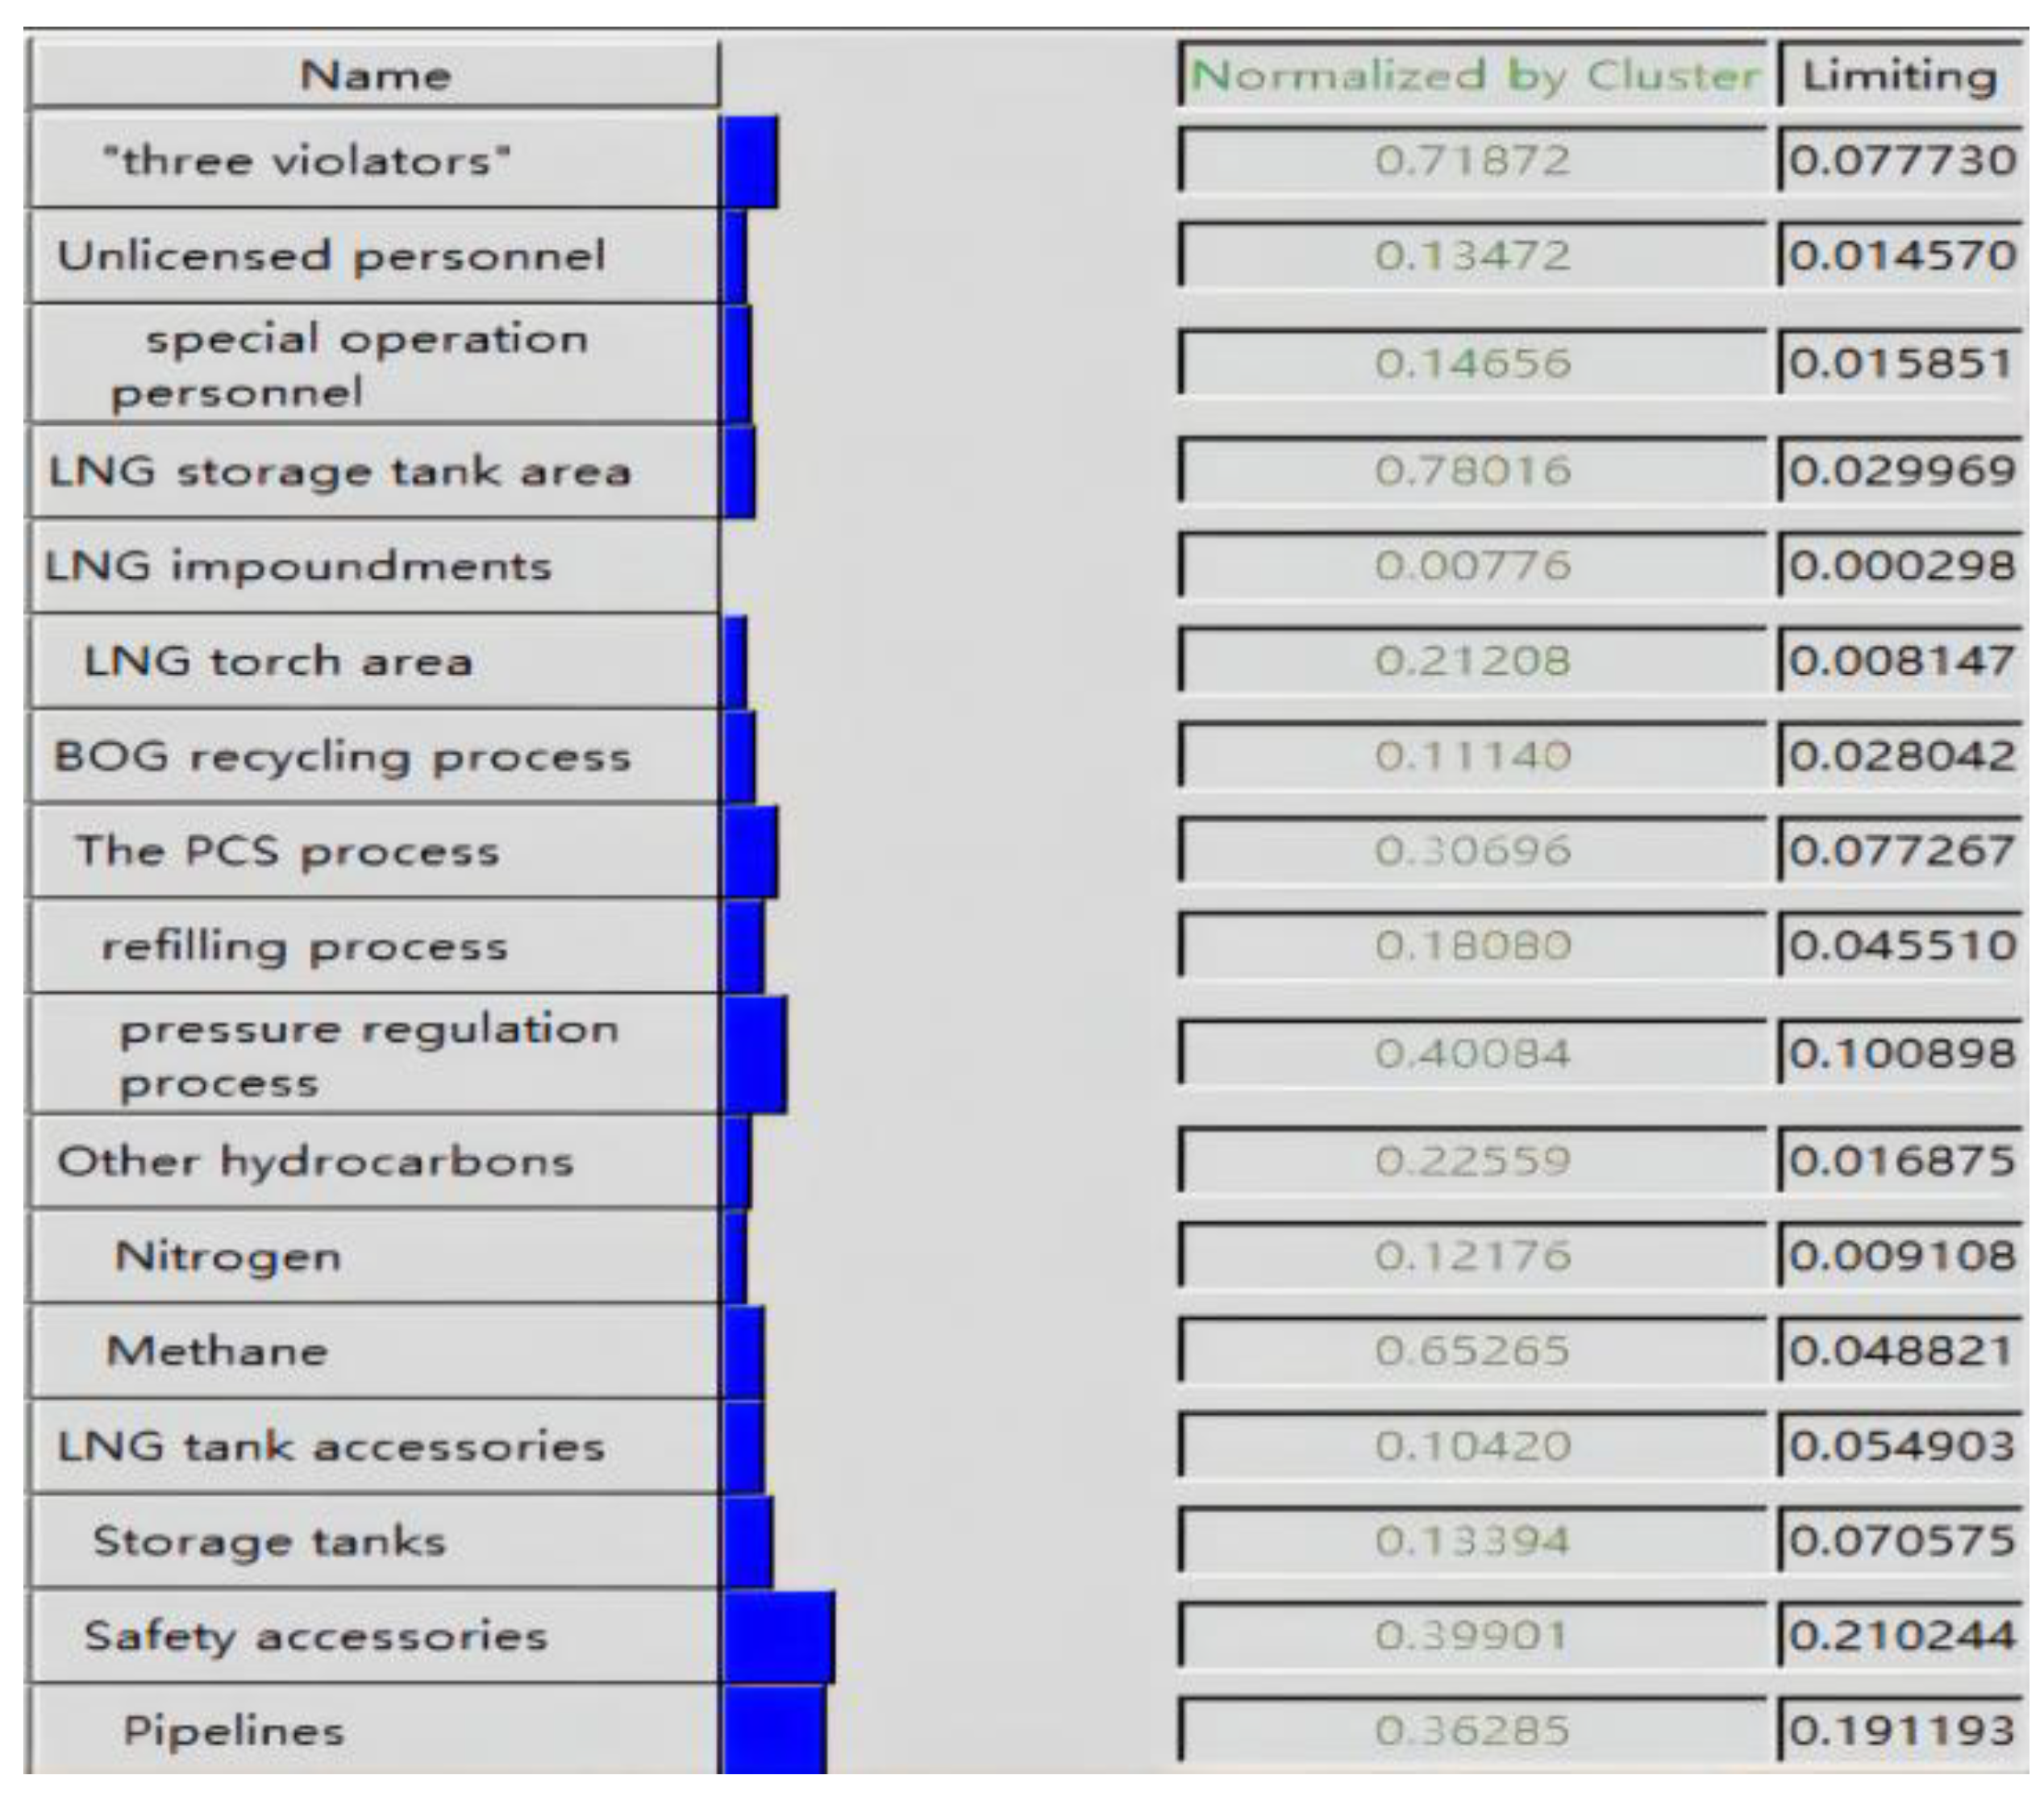
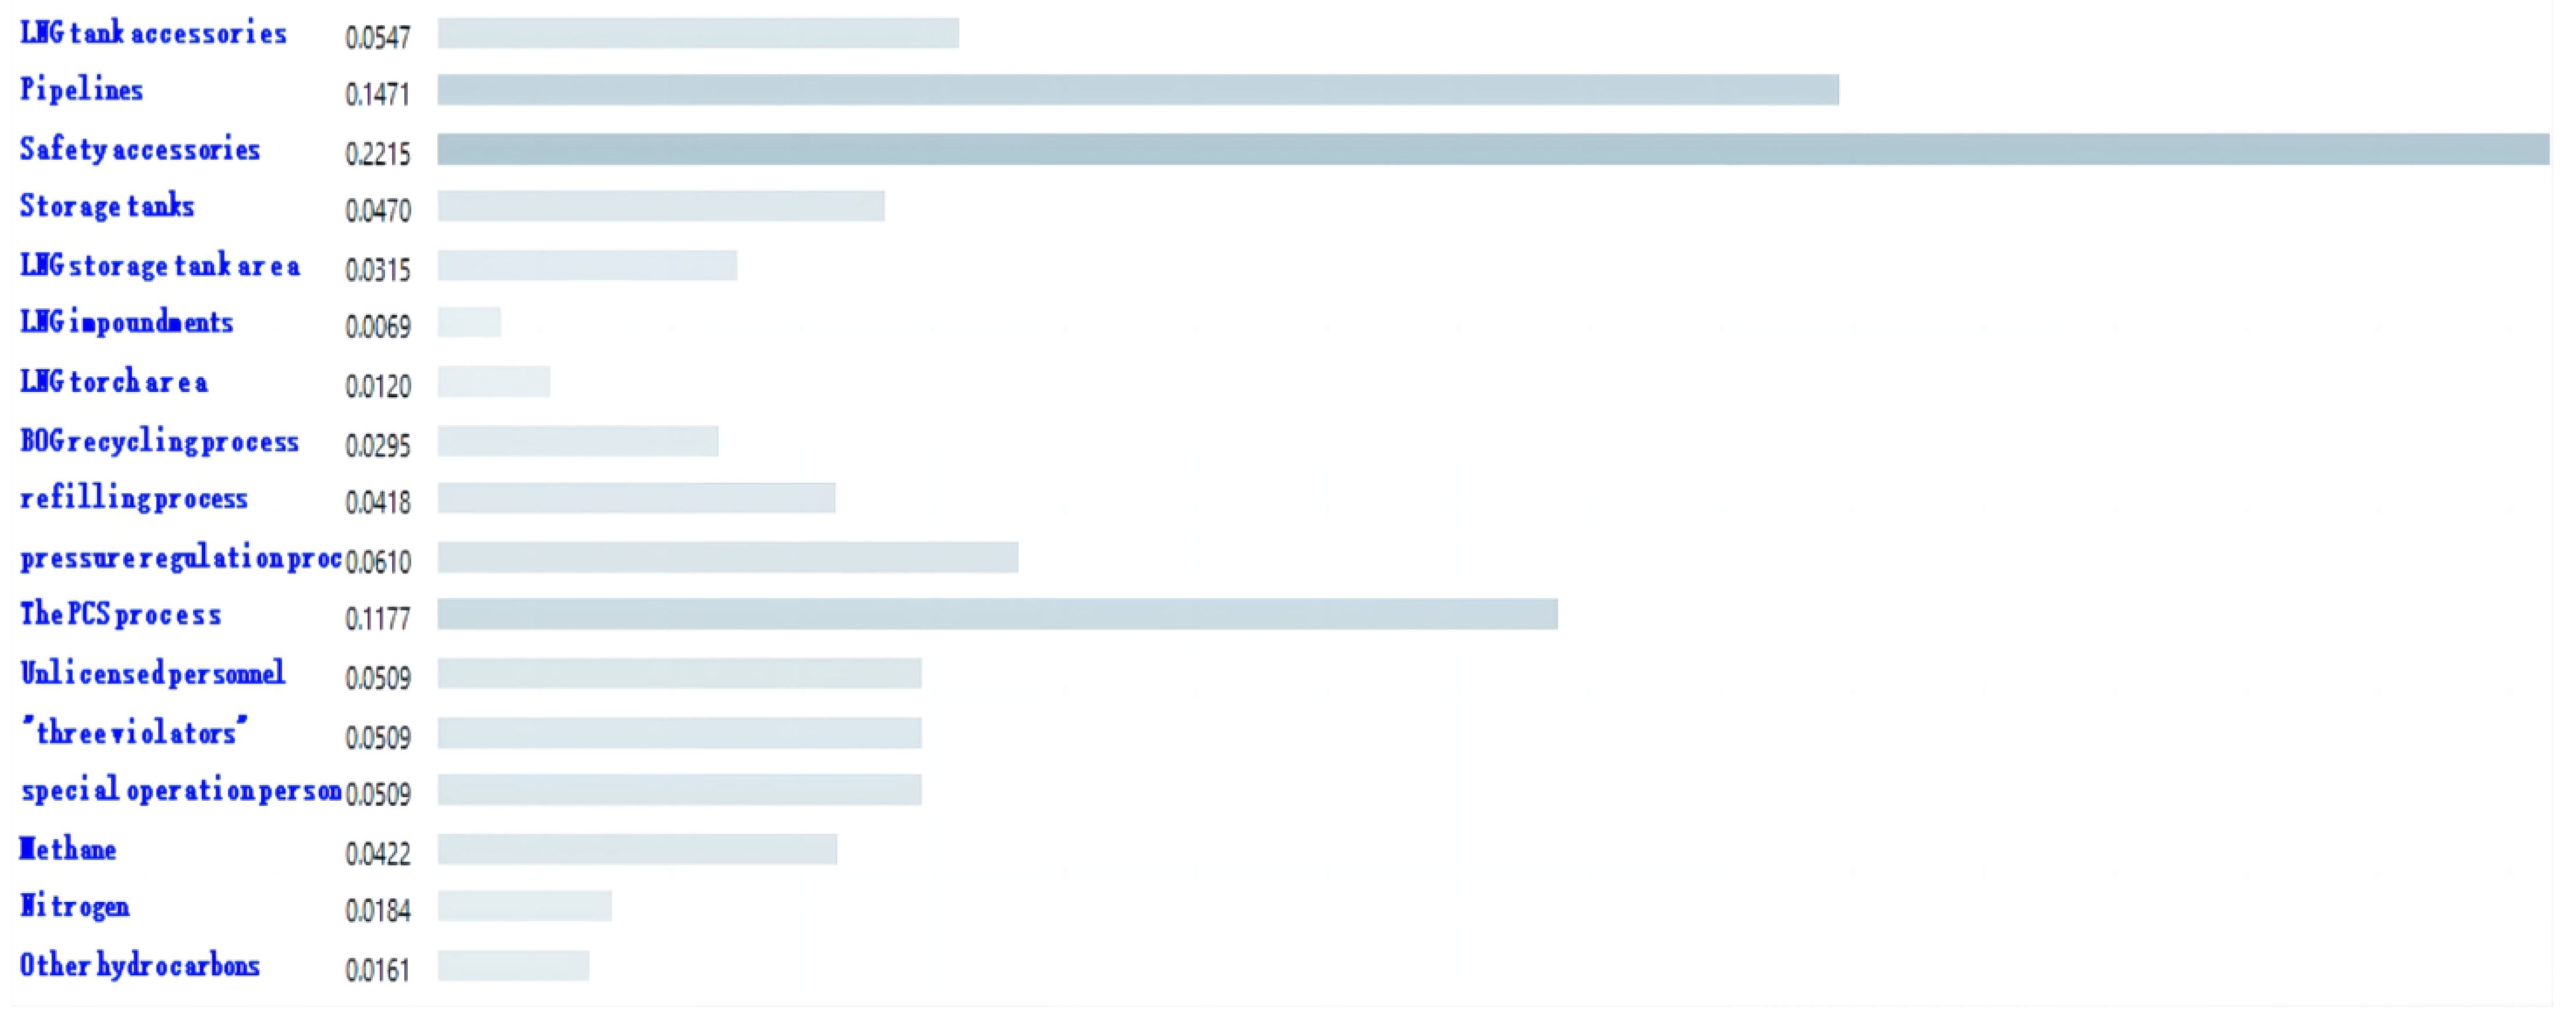
According to the limit supermatrix shown in Table 3, priorities and weights ω of respective risk factors relative to the first-level index are calculated as illustrated in Figure 6.
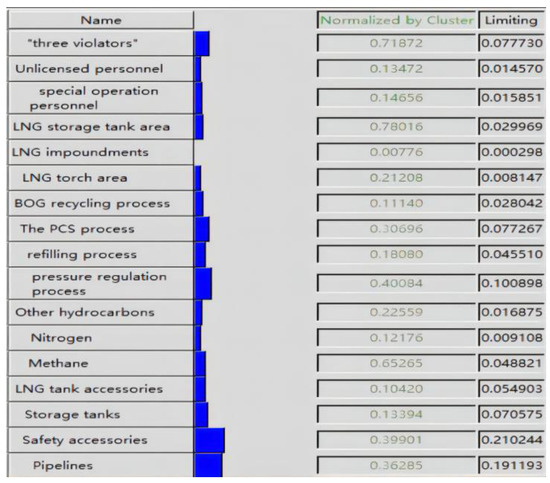
Figure 6.
Priority of secondary indicators.
2.3. Analysis of ANP Results
ANP is an improved model proposed to adapt to the non-independent hierarchical structure. Therefore, the calculation ideas of the two models are roughly the same. In addition, the reliability of AHP has been fully verified in previous studies, and AHP is considered reliable in the study. In order to eliminate the impact of data differences on the weight results, ANP can be fully proven to be highly reliable while considering the relevance of different risk factors. In the study, the same set of statistics was selected to be calculated with ANP and AHP, respectively, and the calculation results were compared and analyzed to comprehensively evaluate the differences between the two methods.
Figure 4 above shows the ANP model built with Super Decision software, and Figure 7 shows the AHP model with only linear hierarchies. The weights of the AHP model were calculated (Figure 8) in the study, and the data of ANP and AHP were processed with SPSS software. The results are shown in Figure 9.

Figure 7.
Structure of AHP models.
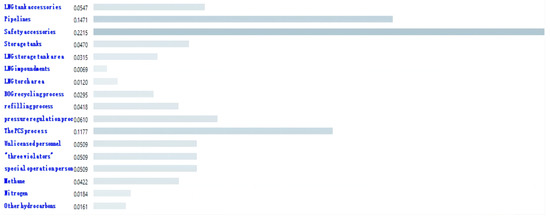
Figure 8.
Secondary index weights in AHP.

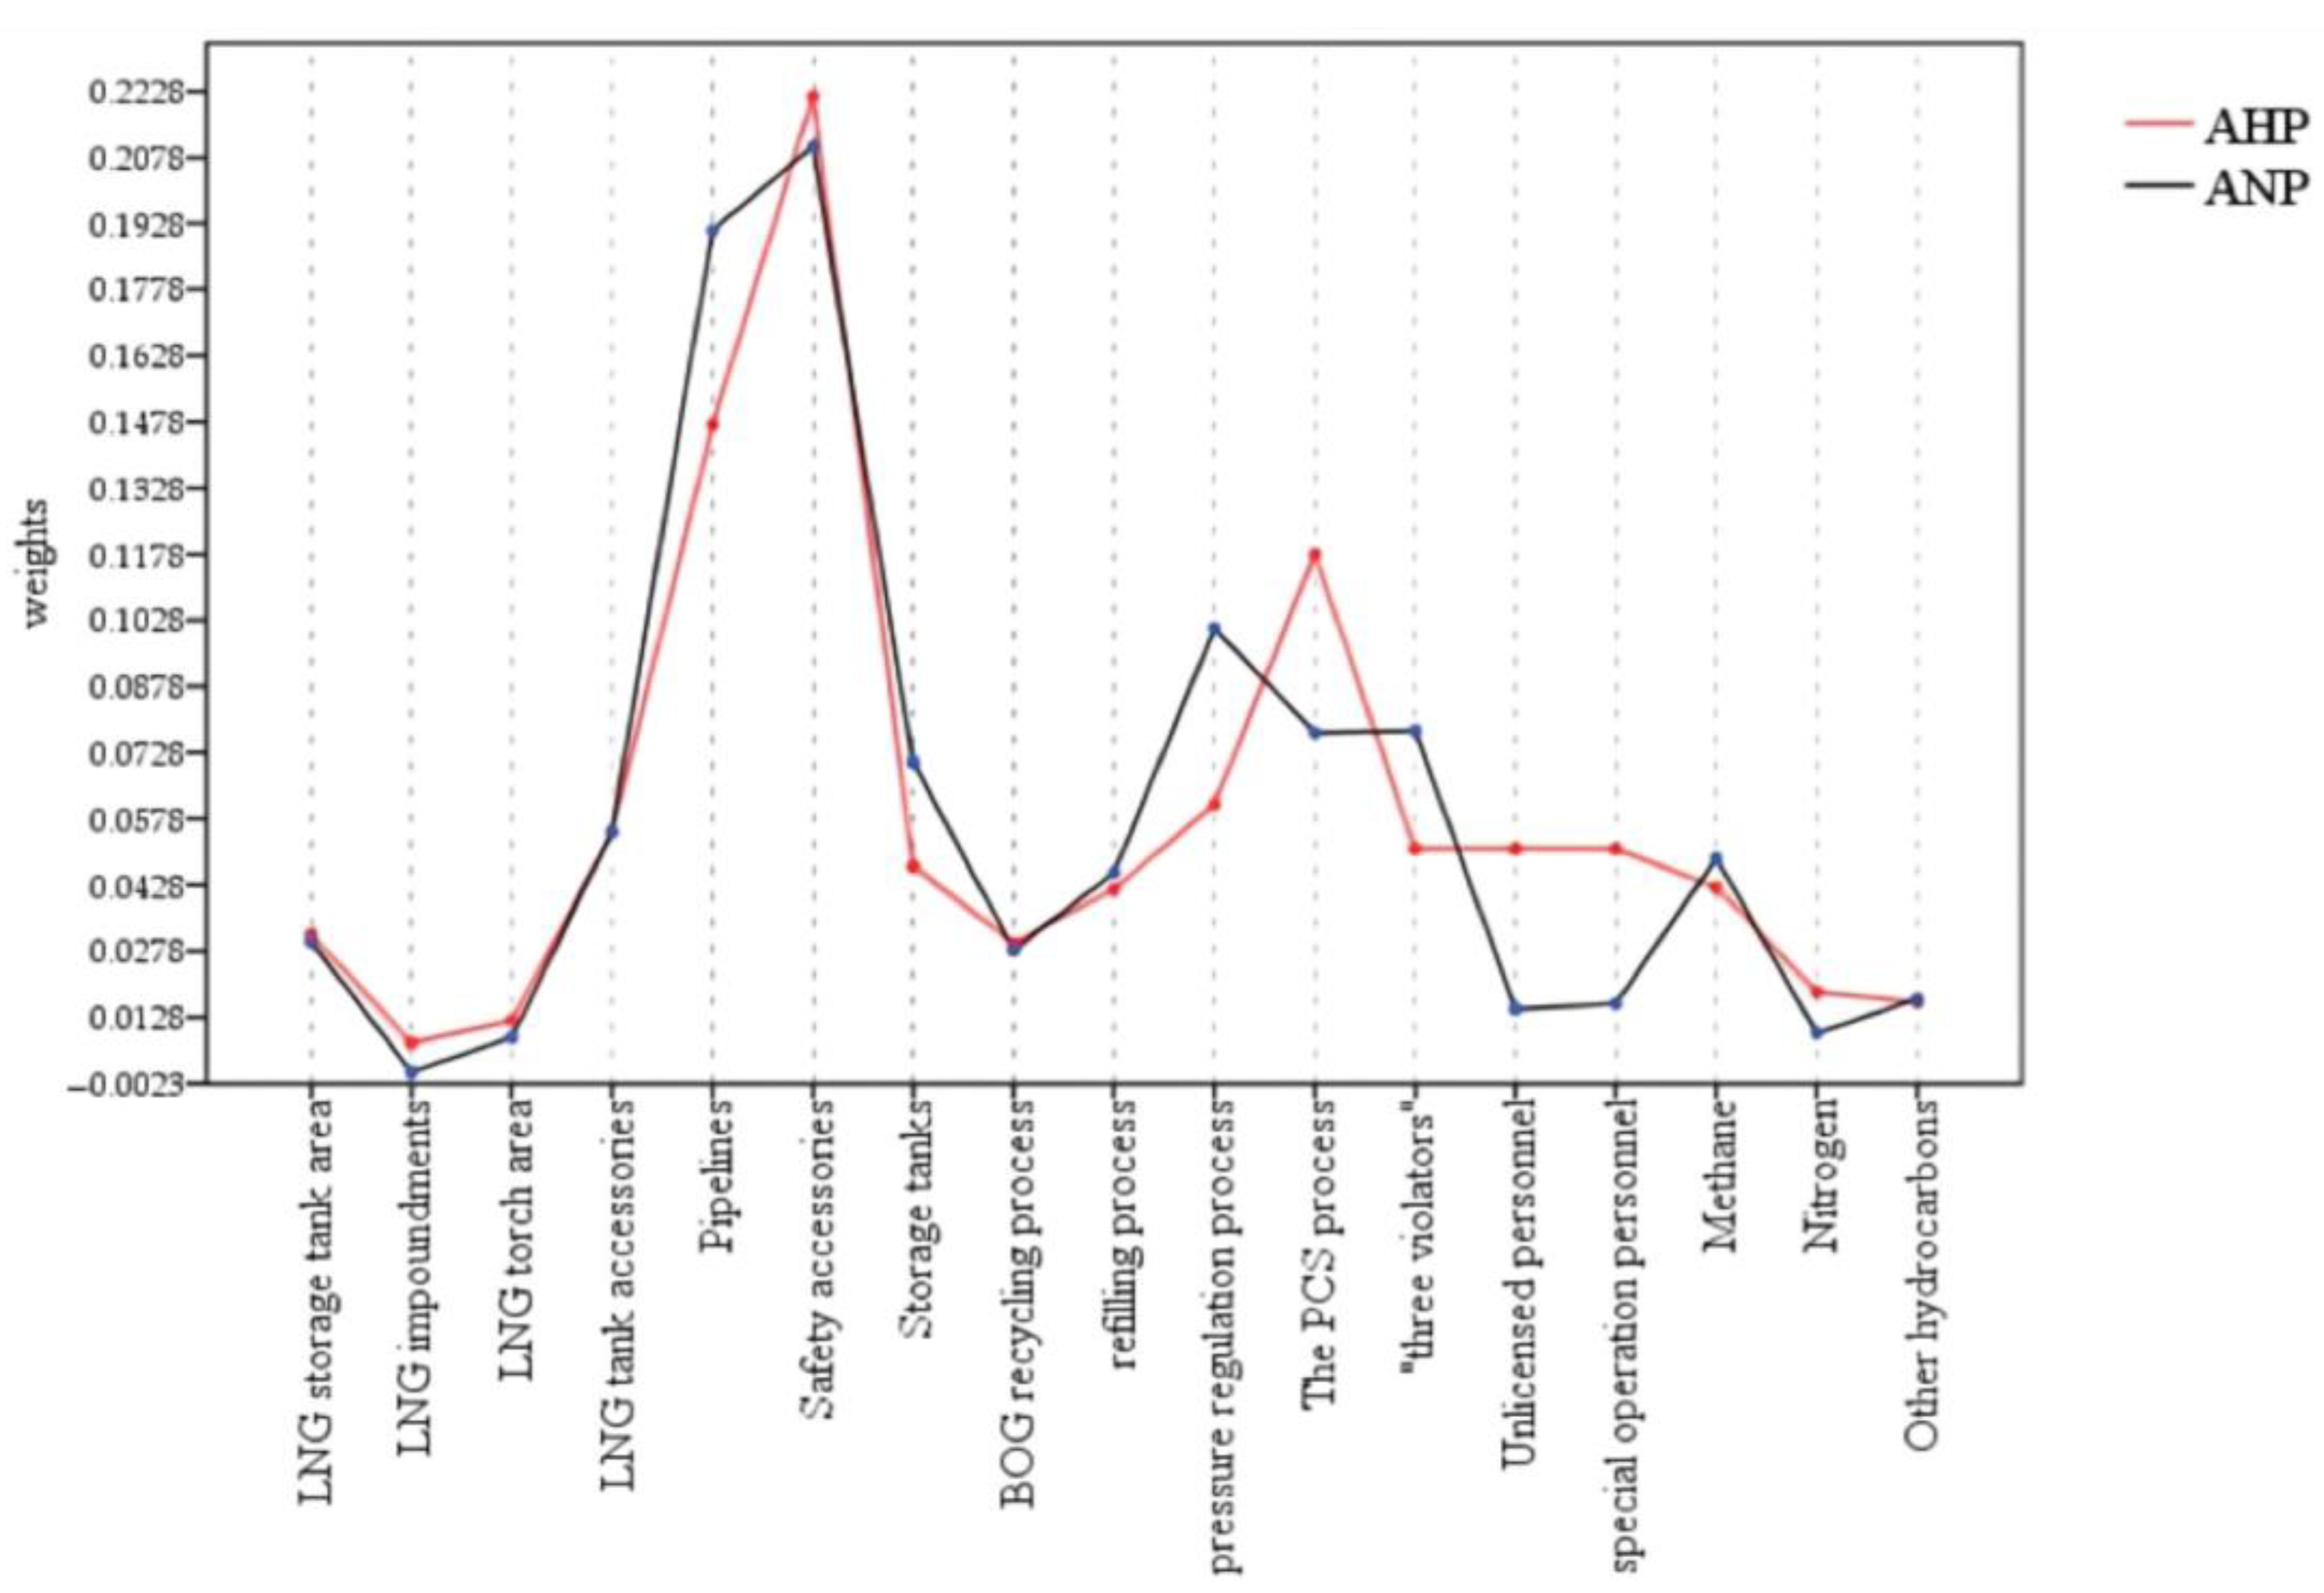
Figure 9.
Comparison of weights in AHP and ANP.
The analysis of the weights of ANP and AHP by SPSS shows that the range of the weights of ANP is 0.2099, and the range of AHP is 0.2146, R(AHP) > R(ANP). Figure 6 also clearly shows that the ANP exists in a relatively more balanced distribution of weights. Because of the network hierarchy of circular domination within the same level and the correlation between the elements, the ANP model incorporated a feedback mechanism. Therefore, to a certain extent, the priority of risk factors that can affect other elements is improved, making the weight of indicators closer to the actual situation.
In Figure 9, the weights of some risk elements in ANP differ greatly from those in AHP. Due to the space limitation, “Pipelines” is used as an example in the paper. In actual production, many valves, flanges, and other safety accessories are installed on pipelines. Such type of security accessories is numerous and easily overlooked. This also explains why “safety accessories” is the highest weighted risk element. Furthermore, the failure of such fittings can easily lead to a pipe rupture, which in turn can cause a series of interlocking reactions; Similarly, pipe rupture may cause the failure of some pipe fittings, thus increasing the probability of accidents. Considering the interaction between “Pipelines” and “safety accessories”, the results of ANP reduce the difference between the two weights. The above also proves that the weight of the ANP model is closer to reality.
3. Normal Cloud Model
3.1. Overview of Normal Cloud Model
The process of accident formation approximately follows a normal distribution. However, most of the factors leading to accidents do not exist independently, and the impact of different risk factors on accidents is not evenly distributed. This dictates that accident causation analysis cannot simply be modeled with a single probability distribution.
In order to solve the accuracy problem of fuzzy mathematics, Li [27] proposed the normal cloud model. The model pioneered the introduction of algorithms for generalized normal distributions, weakening the conditions for normal distributions. Three independent numerical characteristics, expectation Ex, entropy En, and hyperentropy He, are used to form a cloud droplet with a pan-normal distribution in the theoretical domain space. Then, the degree to which elements belong to the fuzzy set and the degree of certainty of the cloud drops on the concept are calculated by the Gaussian membership function, which in turn constructs a normal cloud model for the uncertainty transition between the qualitative concept and the quantitative representation.
Mathematical expectation Ex: The expectation of cloud droplets in the spatial distribution of a theoretical domain is the point in the domain space that best represents the qualitative concept. The point represents the central value of the risk level of a risk factor in the LNG storage tank farm, which is represented in the cloud graph as the mathematical expectation of the cloud drop.
Entropy En: The degree of uncertainty and dispersion of the cloud droplet distribution can be expressed as the degree of cloud droplet ambiguity. Entropy is jointly determined by both randomness and ambiguity, and reflects the range that a risk factor can be tolerated by the risk level. In cloud diagrams, entropy is visualized as the horizontal distribution of cloud droplets in a theoretical domain, representing the measurable granularity of qualitative concepts.
Hyperentropy He: Entropy of entropy, reflecting the entropy uncertainty. Hyperentropy is used to measure the extent to which cloud drops deviate from a normal distribution, indicating the association of randomness with ambiguity. In the cloud map, hyperentropy is expressed as the aggregation degree of the cloud droplets. As the super entropy increases, the uncertainty of the cloud model increases, and the cloud thickness also increases.
The formulas for Ex, En, and He are shown in Equation (4).
If bilateral constraints making x ∈ [Lmax, Lmin] exist, Equation (5) can be used to calculate the numerical characteristics.
In the equation: k ∈ [, ], k is a constant and is taken as 0.01 in the paper.
If the domain space U is one-dimensional, the normal cloud model is calculated as follows:
(1) Normal random numbers En’ satisfying En’~N(En,) are generated.
(2) Normal random numbers x satisfying x~N(Ex,) are generated. X is a cloud drop in the domain space U.
(3) Calculate the degree of certainty y of the qualitative concept:
If the xi belongs to the N-dimension domain space, (xi, yi) corresponds to a cloud drop in the N + 1-dimensional domain space.
(4) Steps 1–3 are cycled sequentially until a sufficient number of cloud drops are formed, and all cloud drops form a set, which is the standard cloud (X, Y).
The weighted cloud model is obtained by weighting the standard cloud model with Equation (7).
In the formula, (Exi, Eni, Hei) (i = 1, 2, …, n) are n clouds, μi (i = 1, 2, …, n) are the corresponding weights for each cloud respectively, and (Exn, Enn, Hen) are the weighted composite clouds.
In order to determine the actual risk level, Equation (8) is used to calculate the similarity between the actual cloud and the evaluation cloud [28].
3.2. Risk Evaluation of LNG Leakage Accident Based on Normal Cloud Model
As risk is determined by both the likelihood of an accident occurring and the severity of its consequences, the study classified LNG storage tank risk elements into five levels, from low to high, according to the industry risk classification standard. Then according to the comprehensive analysis of the likelihood and consequence severity, the LNG storage tank risk elements were divided into five levels from low to high with the quintile method [29] (Table 6). Respectively are I low risk, II general risk, III medium risk, IV high risk, and V significant risk [30]. The numerical characteristics of the different levels calculated from Equations (4) and (5) were iterated into Equation (6) to calculate the degree of certainty. Next, the cloud drops were plotted, and standard cloud models were constructed (Figure 10) [10,31,32,33]. Experts with relevant qualifications were invited to score each risk factor according to the grading criteria and also determine the degree of mutual influence and risk degree of different risk factors.
Table 6.
LNG storage tank leakage accident risk level.

Figure 10.
LNG storage tank leakage accident risk level standard cloud.
Based on the experts’ scoring of the risk of LNG tank leakage, the risk levels of different elements were established, and a comprehensive cloud model was drawn up based on element weights. Finally, control measures were proposed for the different risk elements.
4. Analysis and Results
4.1. Risk Assessment Calculation
In the paper, a storage area of a 500 × 104 m3/day LNG plant in Huanggang, Hubei Province, was used as an example for safety risk analysis. The feed gas is regulated to 6.94 MPa at the station and transported to the LNG plant via a 3.2 km long DN300 feed gas pipeline. The LNG storage area uses two 30,000 m3 bimetallic single-volume tanks with an operating pressure of 10 kPa g and a storage cycle is 7.5 days. The tanks are equipped with a safety control system and a fire protection system, with overpressure protection and negative pressure protection.
Based on the expert scoring, the impact degree and risk degree of risk factors on LNG leakage accidents were summarized. Using “high-risk equipment” as an example, the numerical parameters shown in Table 7 were obtained. The remaining second-level indicators were assessed with the same methodology, and the results are shown in Table 8. The numerical characteristics shown in Table 8 were weighted using Equation (7) to obtain the numerical characteristic values for the first-level indicators.
Table 7.
Evaluation and numerical characteristics of “High-risk equipment”.
Table 8.
Risk level of secondary risk elements.
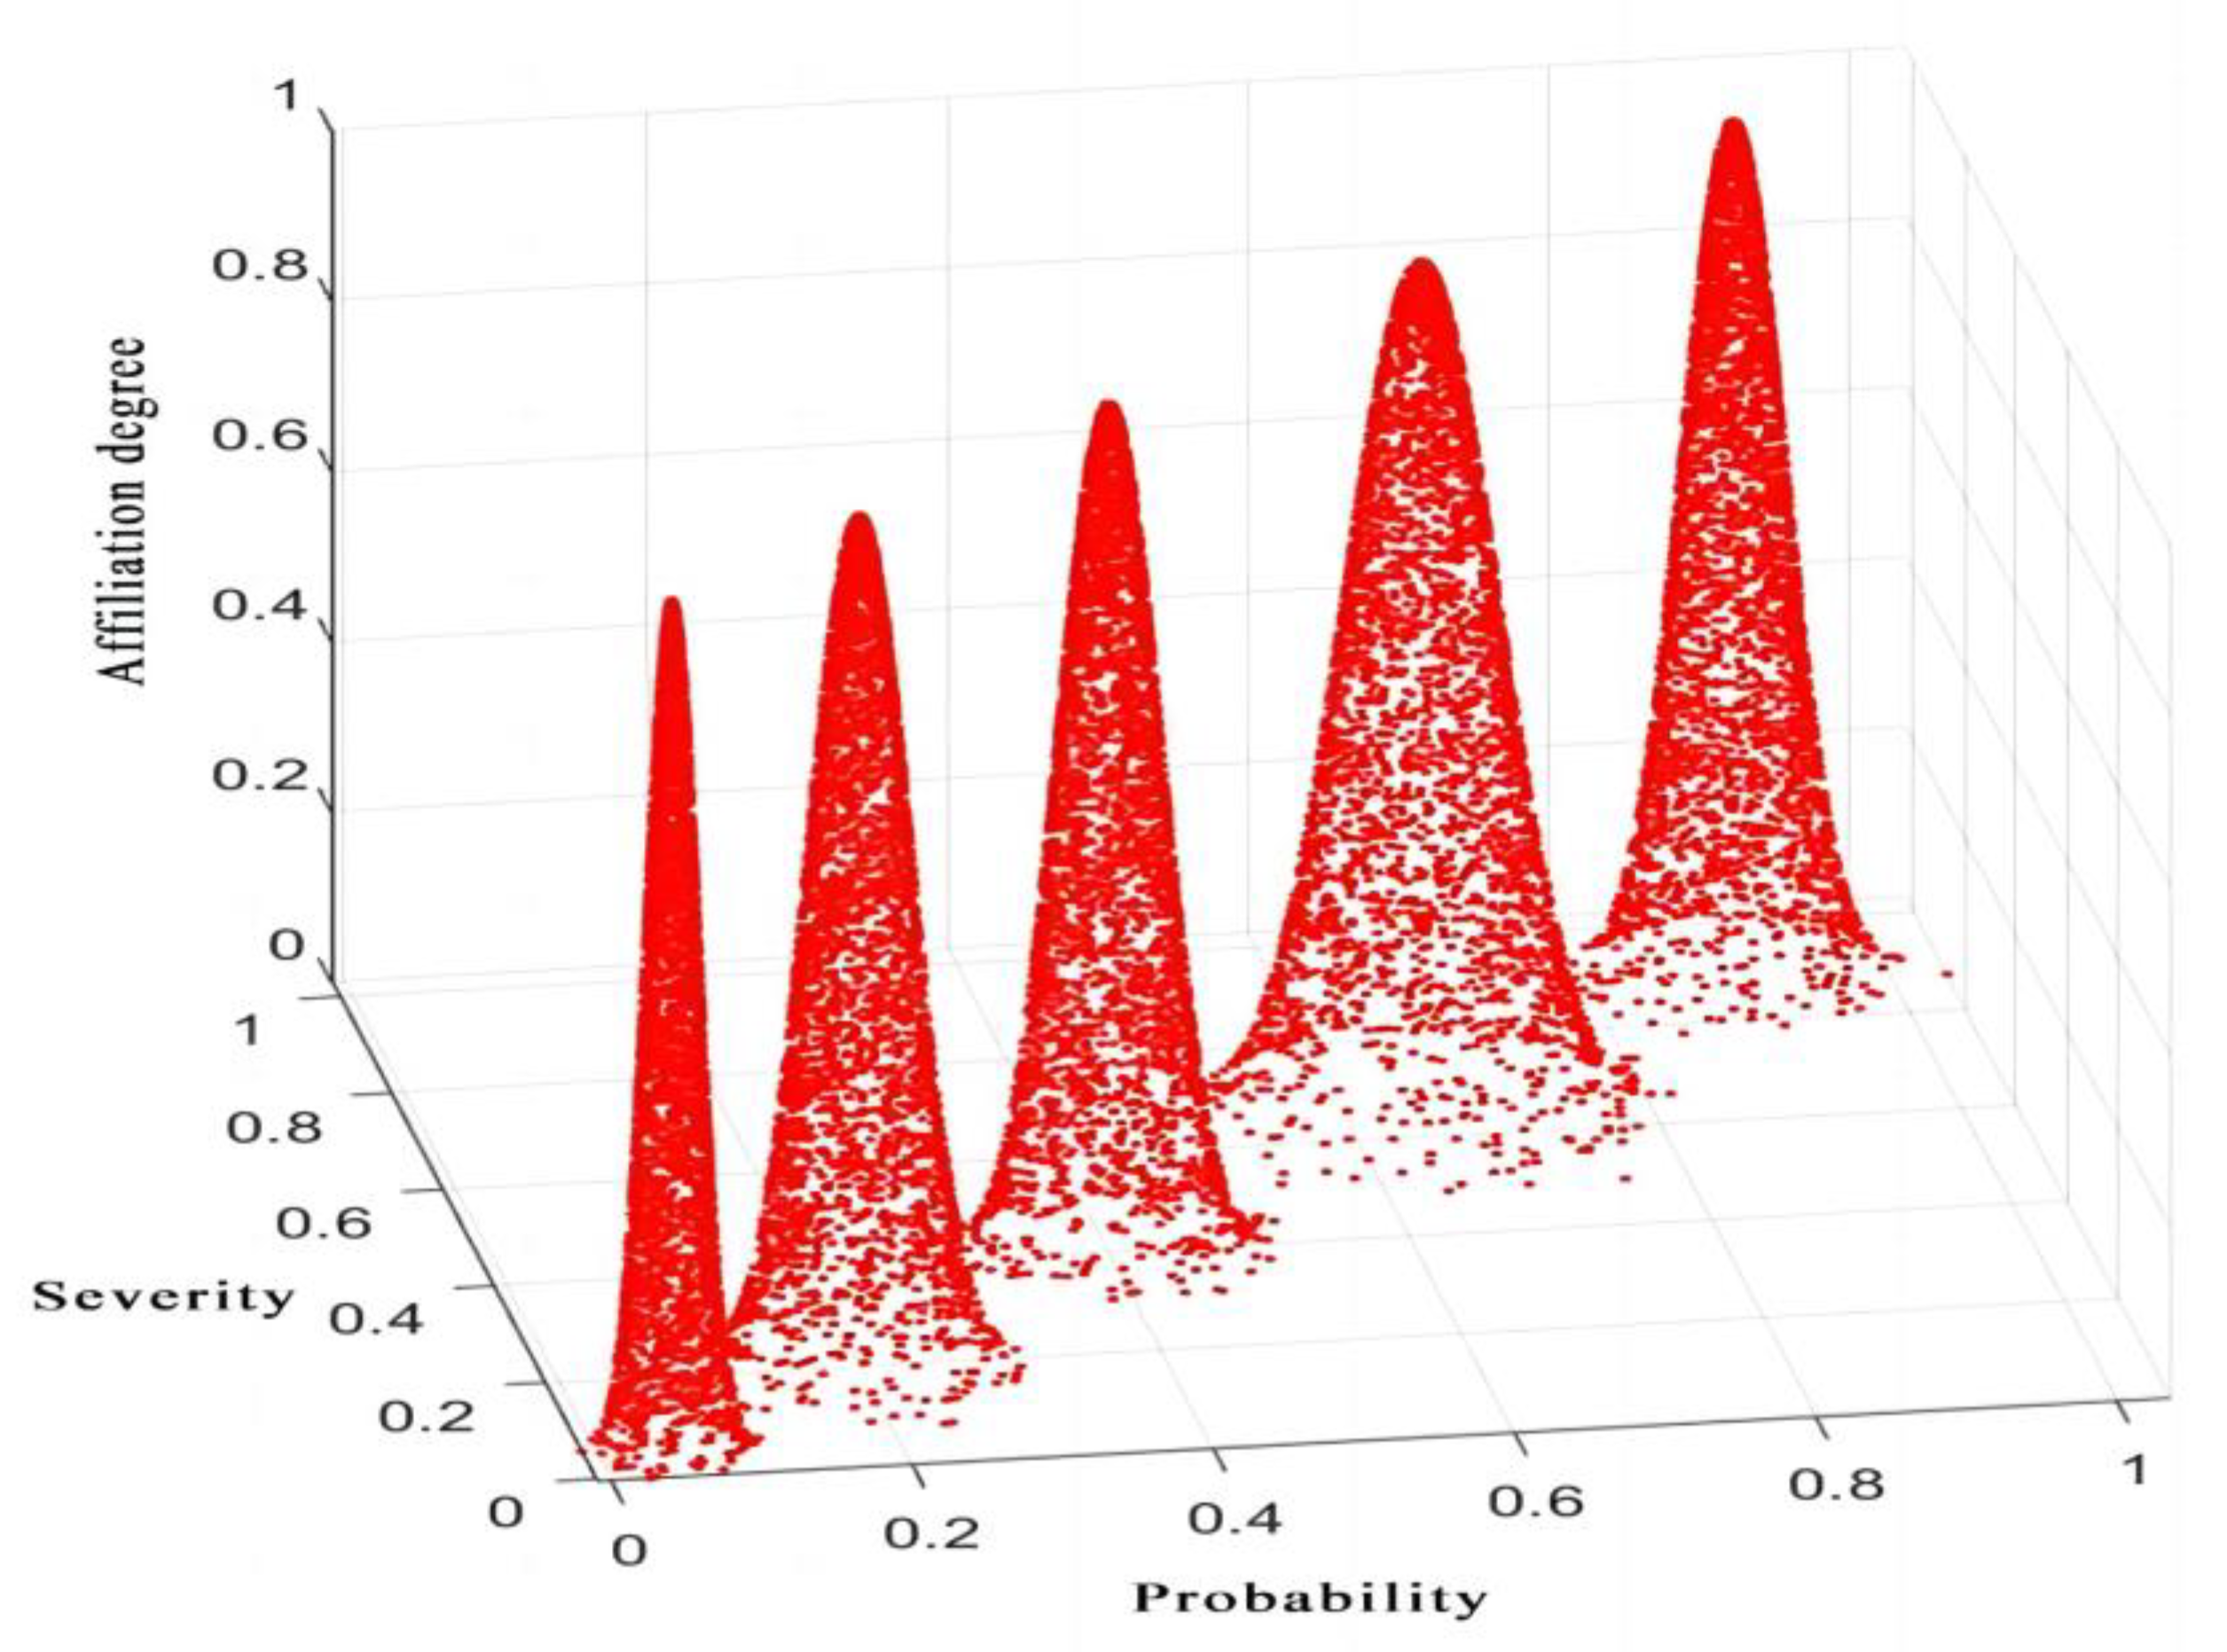
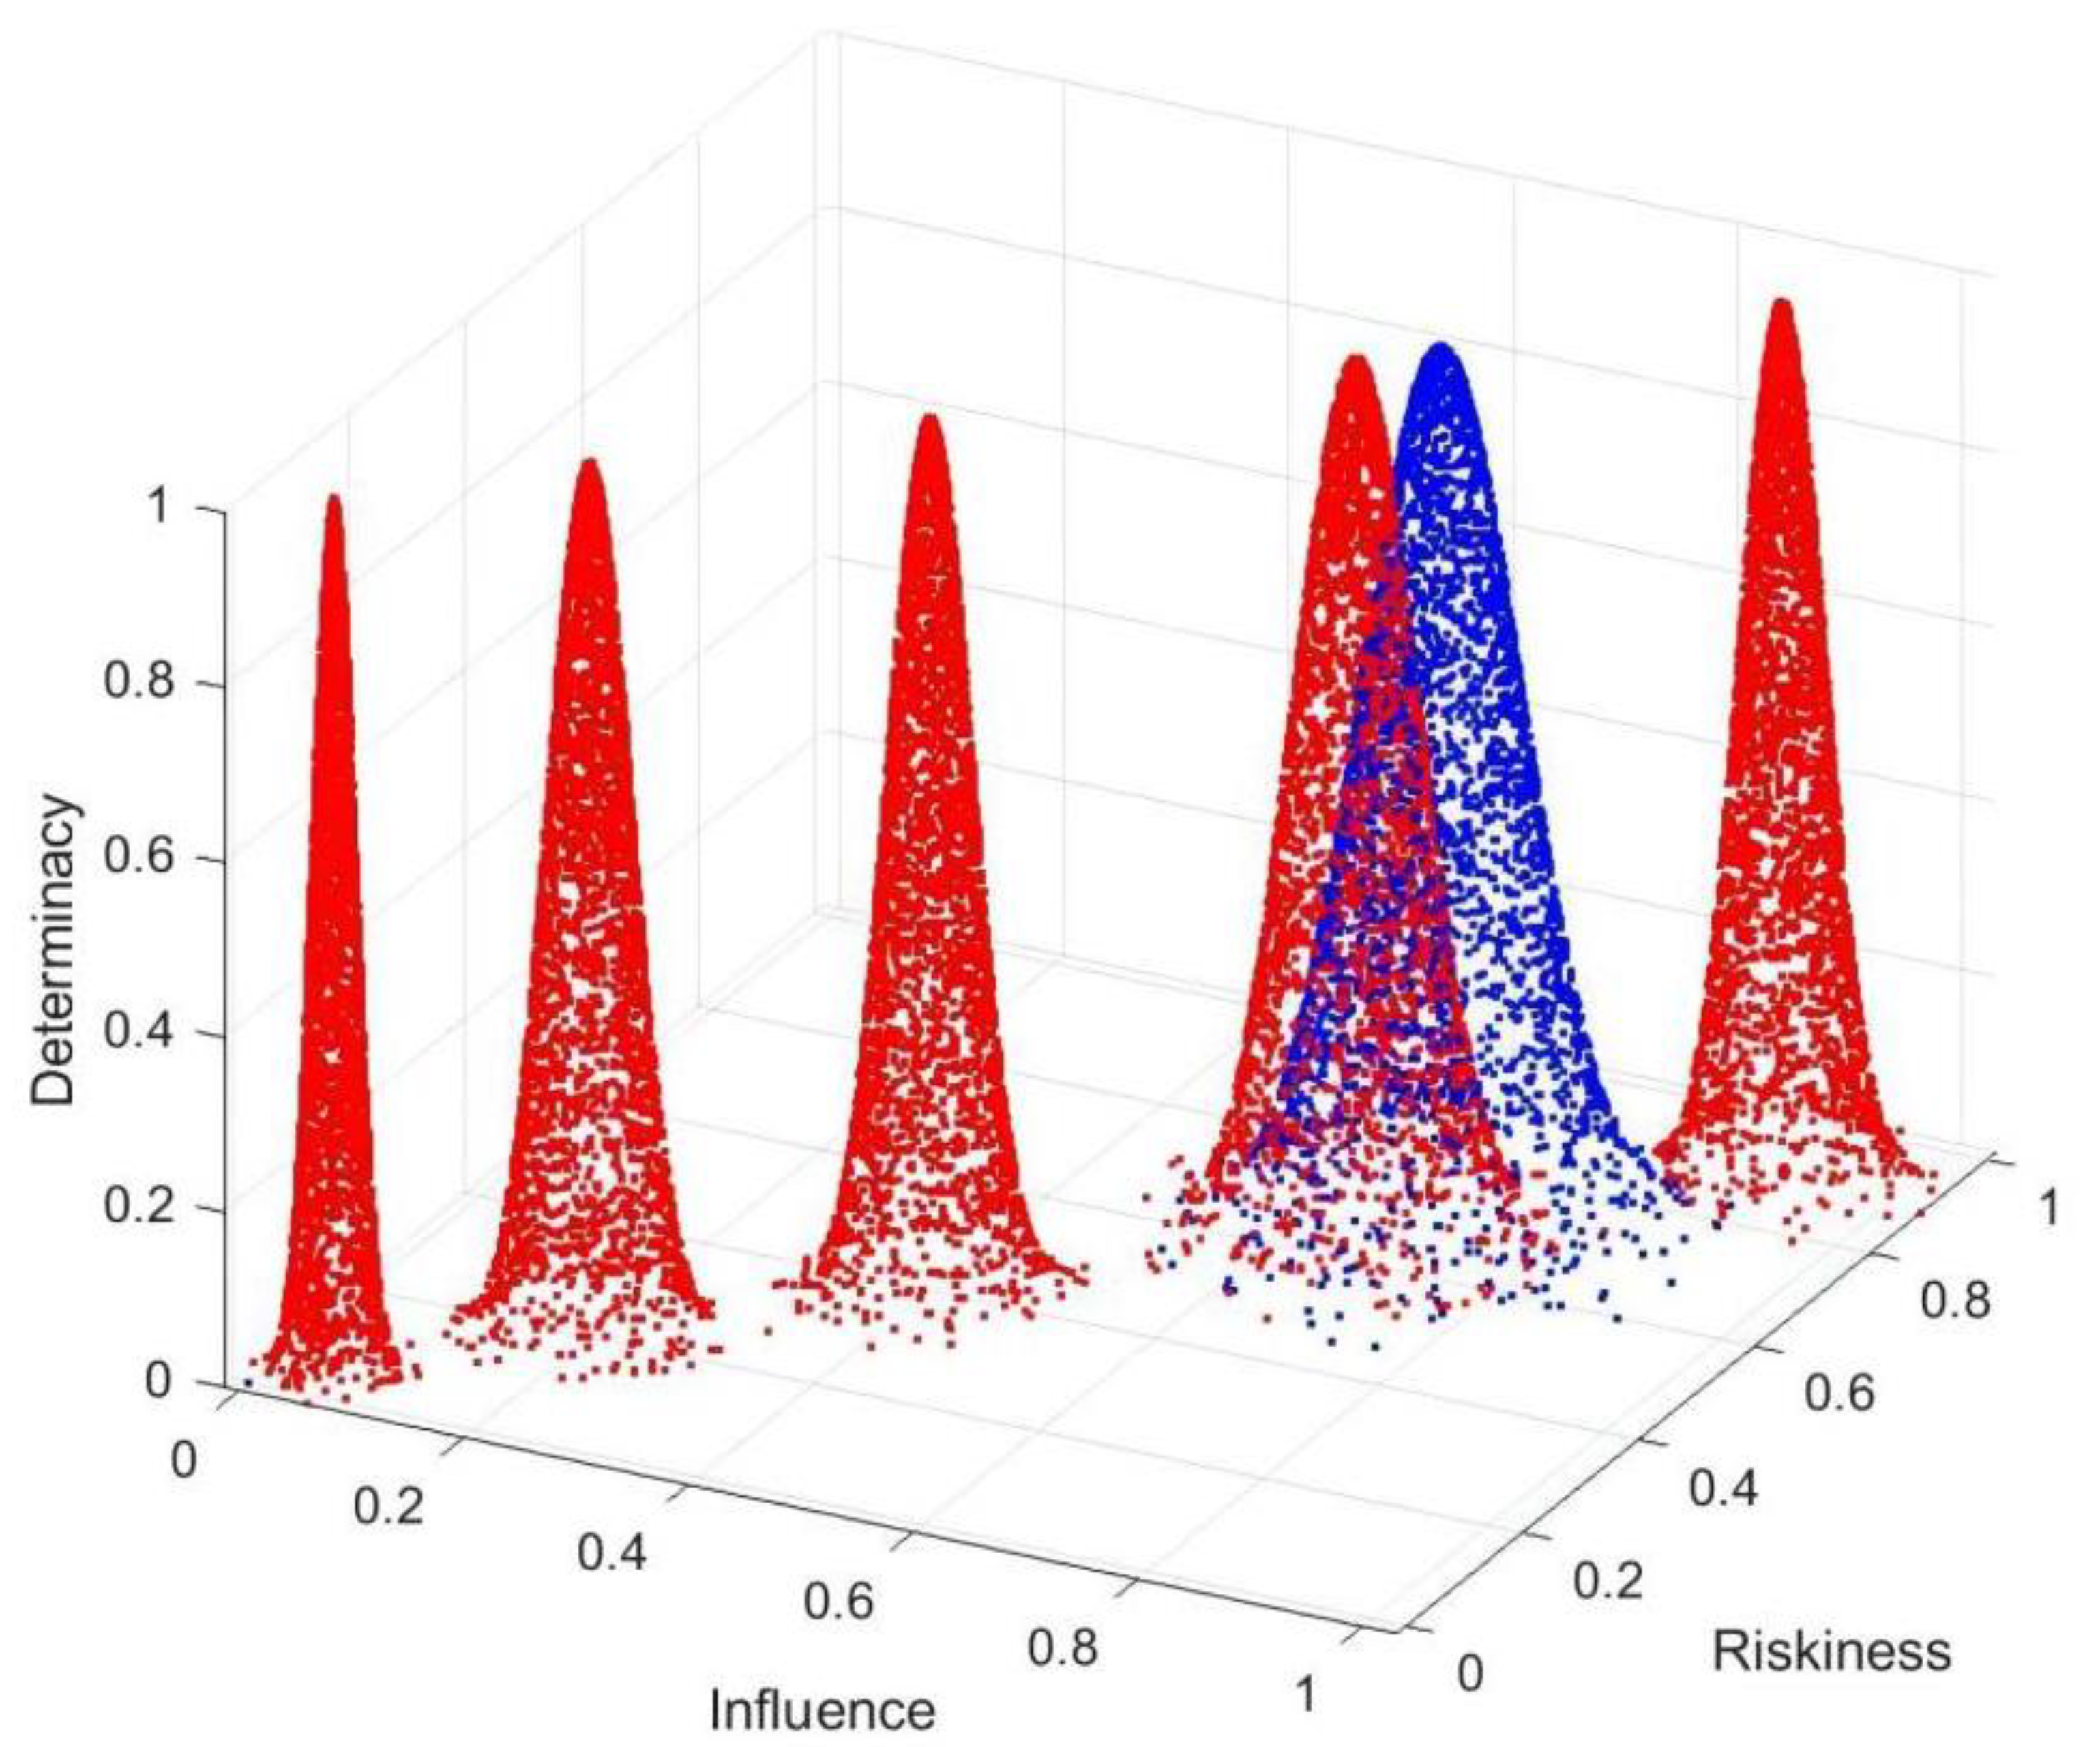
The integrated weights ωB of the first-level indicators calculated by ANP were again iterated into Equation (7) to calculate the numerical parameters of the integrated risk, as shown in Table 9. Then, the weighted integrated cloud model was simulated using MATLAB software (see Figure 11).
Table 9.
Numerical characteristics of LNG tank leakage accident.

Figure 11.
Integrated cloud model for LNG leakage accident.
Two methods for determining the risk level of cloud drops are the cloud map method and the cloud drop similarity ζ comparison [34]. Cloud map is to compare the shape position of cloud droplets in the integrated and evaluated cloud in the same vector space. The risk level corresponding to the cloud droplet with the highest closeness to the integrated cloud is the risk assessment level. The experiment was based on cloud map analysis, aided by similarity comparison using Equation (8). Considering the more visual representation of images and the timelier presentation and implementation of control countermeasures, the paper only shows the results of the LNG leakage risk analysis of the cloud map.
As can be seen in Figure 11, the comprehensive cloud model is between level IV and level V. Clearly visible, the comprehensive cloud is in close proximity to the cloud model at level IV, with the highest density and concentration of cloud droplets in such region. Using similarity calculations to verify this, the similarity between the comprehensive cloud and level IV is 0.7602, and the similarity to level V is 0.2039. The results of the similarity comparison are consistent with the cloud map, so the risk level of the LNG tank leakage can be assessed as level IV, and the company needs to take the necessary control measures, including regular testing and evaluation.
According to the results in Table 7, the risk levels of B1 and B5 can be assessed as level III with the above method, and the level of B2, B3, and B4 are level IV. The risk level of the secondary index “safety accessories” is level V, which requires the enterprise to stop work immediately for maintenance and fully review safety accessories to reduce the risk to an acceptable range.
4.2. Method Contrast
To ensure the accuracy of the model, the same five sets of expert scoring data were selected for fuzzy comprehensive evaluation analysis in the study [35]. The results were compared with the findings of the normal cloud model for validation. The sets of indicator weights A, Bi(i = 1, 2, …, 5), constructed based on ANP, shown as follows:
A = [0.038 0.529 0.251 0.122 0.075]
B1 = [0.7802 0.0078 0.2121]
B2 = [0.1042 0.3629 0.3990 0.1339]
B3 = [0.1114 0.1808 0.4008 0.3070]
B4 = [0.1347 0.7188 0.1466]
B5 = [0.6527 0.1218 0.2256]
B1 = [0.7802 0.0078 0.2121]
B2 = [0.1042 0.3629 0.3990 0.1339]
B3 = [0.1114 0.1808 0.4008 0.3070]
B4 = [0.1347 0.7188 0.1466]
B5 = [0.6527 0.1218 0.2256]
The evaluation matrix Ci (i = 1, 2, …, 5) was constructed based on the expert scoring results to second-level elements of the LNG tank leakage accident:
The evaluation matrix of the first-level index was calculated based on Equation (9):
P = Bi × Ci
The results of the calculations are as follows:
P = [P1 P2 P3 P4 P5]T = , P is the evaluation matrix of the first-level index.
Multiply the primary indicator weight matrix A with the evaluation matrix P to obtain the composite rating affiliation matrix R.
According to the fuzzy affiliation matrix S calculated in Equation (10), the affiliation of LNG leakage accident in level IV is the largest at 0.5095. Based on the principle of maximum affiliation, the preliminary judgment of the accident risk level is “High risk”.
In order to calculate the fuzzy comprehensive evaluation score of the accident, based on the risk levels classified above, the risk level matrix was assumed as L = [Ex1, Ex2, Ex3, Ex4, Ex5]T. The safety risk of the LNG storage tank leakage accident was calculated with Equation (11) in the paper.
R = S × L
The calculation yields that R = [S1 S2 S3 S4 S5] × [Ex1 Ex2 Ex3 Ex4 Ex5]T = 0.7586 ∈ [0.5, 0.8).
The same method was used for all the first-level indicators, and the evaluation results of the two methods are shown in Table 10.
Table 10.
Comparison of risk levels of LNG tank leakage accidents between two methods.
The result of the fuzzy comprehensive evaluation of “High-risk substances” was 0.5043 > 0.5. However, according to the “maximum membership principle”, the affiliation of the B5 indicator to level III is known to be 0.5390, and the affiliation to level IV is 0.4367, and 0.5390 > 0.4367. The risk level of the index belongs to the level III.
In conclusion, the evaluation results of the fuzzy comprehensive evaluation are the same as those of the normal cloud model. The results of both models were judged to be realistic and in general agreement with the results of the safety assessment report for the tank. It can be proved that the ANP-normal cloud assessment model has high accuracy.
From the perspective of the “Five-high” risks, “High-risk equipment” has the highest level of risk and impact and has the highest weighting. As the largest part of the LNG storage area, the safety of the equipment is particularly important. The risk level of secondary element C23 reaches level V, which requires the enterprise to immediately stop work for rectification and inspection to reduce the risk.
From an intrinsic safety perspective, the enterprise should focus on the regular review and maintenance of the safety performance of the equipment itself. In addition, the enterprise should focus on the management and assessment of operators and strictly eliminate the “three violations”, optimizing the allocation of resources and improving the safety and security of the entire “man-machine-environment” system to achieve intrinsic safety.
5. Discussion and Conclusions
The research applies the “Five-high” risk system of major hazards to the LNG industry and constructs a microscopic “Five-high” risk system. On this basis, a new comprehensive model approach with ANP and a normal cloud model is proposed. The model integrates the two elements that determine the risk level of a storage tank—probability and severity—from the perspective of risk matrix analysis and constructs a two-dimensional normal cloud model to quantitatively analyze the qualitative risk elements level.
In the study, “High-risk equipment” is the first-level element with the highest risk and most heavily weighted. This is consistent with past studies, which concluded that stress corrosion of the subsidiary piping and poor valve contact are the most significant risks leading to leaks in LNG storage tanks [10]. Similarly, the conclusion confirms reality. With the advancement of technology, and the development of the energy industry towards mechanization and intelligence, LNG storage areas are gradually reducing the input of manual labor and working towards achieving intrinsic safety. In this trend, the equipment, as the largest part of the LNG storage area, the possibility of accidents and the severity of consequences of the equipment are greatly increased. In recent years, LNG storage tank leaks and explosions have been more often caused by equipment failures. Therefore, “High-risk equipment” is considered the first-level element with the highest risk and most heavily weighted. The safety of the equipment in the storage area is particularly important, and enterprises should focus on the regular review and maintenance of the safety performance of the equipment, and on-site safety managers should strengthen the monitoring of the working condition of the equipment.
The above discussion illustrates the rationality and reliability of the risk analysis model, with the example of “High-risk equipment”. Compared with previous studies, the paper presents new approaches and contributions in the following areas:
First, the microscopic “Five-high” risk system constructed in the paper is applicable to the safety analysis in other industries. Compared with traditional risk identification methods, the system incorporates elements of on-site management and can comprehensively identify all dangerous points with potential accidents from multiple perspectives.
Second, the study also contributes an improved assignment method—ANP—to the risk analysis of hazardous chemical storage tanks. Most previous studies have used the AHP to determine indicator weights which is impossible to consider associations among risks. The study considers the influence of different risk elements, invites qualified experts to score, and applies the ANP model to calculate the weights. Therefore, the results are closer to the actual situation, and the accuracy and predictability of risk assessment may be improved. In fact, a complex correlation similar to the domino effect exists between risk factors of LNG tanks. Only using the Delphi method is subjective and not very comprehensive, which will be a focus of subsequent research.
Third, although normal cloud models are now widely used in many fields, most studies have used one-dimensional normal cloud models. Such considerations are incomplete in many cases. In the paper, two elements of probability and severity are considered to construct a two-dimensional normal cloud model. The probability and severity levels of the accident are visualized in the cloud map, which realizes the quantitative and visual analysis of risk level. The model provides more visual data for safety management on site, reduces the difficulty of managing the relevant personnel, and facilitates the timely introduction of appropriate control measures.
Although the integrated safety risk analysis model proposed in the paper has some contributions and can provide some ideas for subsequent research, some limitations still exist in the study:
- (1)
- As stated above, while ANP as a subjective weighting method can consider the correlation between risk elements, it increases the subjectivity of the results because different experts have different judgments on the relative importance of risk factors. The evaluation results obtained by different experts may be different [18]. An integrated weight calculation method should be considered in subsequent studies, which can combine ANP and other objective weighting methods.
- (2)
- Compared to the AHP, the computational process of ANP is more complex. The method is difficult to rely on manual work and more demanding on the experts invited. In some ways, the method is not as universal as AHP.
- (3)
- The normal cloud model conducts quantitative analysis based on the scores of professional institutions or experts on the safety degree of enterprises, and the model needs to be updated based on regular risk assessments, which cannot achieve real-time dynamic monitoring of tank safety.
In conclusion, the study provides a new comprehensive model and quantitative method for the safety analysis of LNG storage tanks, but the method still has some limitations. Further research is needed to improve the limitations of the model, as well as its promotion and universal application in the industry.
Author Contributions
Conceptualization and methodology, S.P. and D.Z.; software, S.P. and B.X.; validation, S.P., D.Z. and B.X.; formal analysis, S.P.; investigation, S.P.; data curation, S.P. and D.Z.; writing—original draft preparation, S.P.; writing—review and editing, S.P. and D.Z.; visualization, S.P.; supervision and project administration, B.X. All authors have read and agreed to the published version of the manuscript.
Funding
This research was funded by Hubei Emergency Management Department 2021 Special Funds for Production Safety Project (Hubei Emergency development [2021] 18); Ministry of Education Curriculum Ideological and Political Demonstration Project (JGH [2021] No. 7); The First Batch of University-Industry Cooperation Collaborative Education Project in 2018 (201801081002); 2021 Hubei Provincial Teaching Research Project of Colleges and Universities (2021324).
Institutional Review Board Statement
Not applicable.
Informed Consent Statement
Not applicable.
Data Availability Statement
Not applicable.
Acknowledgments
The authors would like to thank the editors and the anonymous reviewers for their valuable suggestions.
Conflicts of Interest
The authors declare no conflict of interest.
References
- Zhou, S.W.; Zhu, J.L.; Shan, T.W.; Fu, Q.; Zhang, D.; Wang, J.P. Development Status and Outlook of Nature Gas and LNG Industry in China. China Offshore Oil Gas. 2022, 34, 1–8. [Google Scholar]
- Ren, Z.; Wang, D.Q.; Tong, Y.Z.; Liu, P. A Discussion on the Development of the LNG Industry Under the Dual Carbon Target. Shandong Chem. Ind. 2022, 51, 101–103. [Google Scholar]
- Li, H.Y.; Zhang, J.Q.; Chen, J.B.; Chen, W.H.; Zhao, Y.; Lin, M.Z.; Li, L.; Zhang, X.; Dai, X.D. Global energy transition faces challenges in 2021—Based on the bp Statistical Yearbook of World Energy (2022). Nat. Gas. Oil, 2022; in press. [Google Scholar]
- BP p.l.c. BP Statistical Review of World Energy. 2022. Available online: https://www.bp.com/en/global/corporate/energy-economics/statistical-review-of-world-energy.html (accessed on 20 November 2022).
- Ruszel, M. The Development of Global LNG Exports. In The Future of Energy Consumption, Security and Natural Gas; Liuhto, K., Ed.; Palgrave Macmillan: Cham, Switzerland, 2021; pp. 1–20. [Google Scholar]
- Kim, H.; Koh, J.-S.; Kim, Y.; Theofanous, T.G. Risk assessment of membrane type LNG storage tanks in Korea-based on fault tree analysis. Korean J. Chem. Eng. 2005, 22, 1–8. [Google Scholar] [CrossRef]
- Oka, H.; Ota, S. Evaluation of consequence assessment methods for pool fires on water involving large spills from liquefied natural gas carriers. J. Mar. Sci. Technol. 2008, 13, 178–188. [Google Scholar] [CrossRef]
- Koyama, K. CFD Simulation on LNG Storage Tank to Improve Safety and Reduce Cost. In Systems Modeling and Simulation; Koyamada, K., Tamura, S., Ono, O., Eds.; Springer: Tokyo, Japan, 2007; pp. 39–43. [Google Scholar]
- Ma, X.; Shi, T.H.; Xue, T.; Xu, Y.Y. Improvement of accident tree analysis of LNG tank leakage with Bayesian Networks. Mod. Chem. Ind. 2017, 37, 179–182. [Google Scholar]
- Yang, L.P.; Du, S.N.; Wang, W.Q.; Wang, B.; Geng, X.H. Dynamic risk analysis of continuous leakage of LNG storage tank. Chem. Eng. Oil Gas. 2020, 49, 109–116+122. [Google Scholar]
- Yucelgazi, F.; Yitmen, İ. An ANP Model for Risk Assessment in Large-Scale Transport Infrastructure Projects. Arab. J. Sci. Eng. 2019, 44, 4257–4275. [Google Scholar] [CrossRef]
- Cil, I.; Turkan, Y.S. An ANP-based assessment model for lean enterprise transformation. Int. J. Adv. Manuf. Technol. 2013, 64, 1113–1130. [Google Scholar] [CrossRef]
- Zhao, P.Y.; Guo, X.Q.; Xu, D.C.; Yao, X. Evaluation of rescue capability of mine rescue team based on network analytic hierarchy method. China Coal 2019, 45, 66–70. [Google Scholar]
- Razavi Toosi, S.L.; Samani, J.M.V. A New Integrated MADM Technique Combined with ANP, FTOPSIS and Fuzzy Max-Min Set Method for Evaluating Water Transfer Projects. Water Resour. Manag. 2014, 28, 4257–4272. [Google Scholar] [CrossRef]
- Gu, Q.W.; Zhang, L.; Zhao, X.H.; Wang, H.S.; Dong, Y. Evaluation of regional water environment carrying capacity based on ANP-Normal cloud model. J. China Inst. Water Resour. Hydropower Res. 2021, 19, 506–515. [Google Scholar]
- Purwosaputra, A.A.; Artana, K.B.; Dinariyana, A.A.B. Selection over small-scale LNG transportation model in designing an efficient and reliable LNG supply chain using analytical network process. Mar. Syst Ocean. Technol. 2022, 17, 95–112. [Google Scholar] [CrossRef]
- Saaty, T.L.; Vargas, L.G. Decision Making with the Analytic Network Process; International Series in Operations Research & Management Science; Springer: Boston, MA, USA, 2013; Volume 195, pp. 1–40. [Google Scholar]
- Gan, L.; Hu, Y.; Zheng, L.Z.; Hu, S.H. Comprehensive evaluation on capability of electric power emergency rescue team based on improved ANP-TOPSIS. J. Saf. Sci. Technol. 2022; in press. [Google Scholar]
- Sun, H.C.; Tian, P. The Analytic Network Process and Science Decision. In Proceedings of the 12th Annual Conference of the Chinese Society of Systems Engineering, China, October 2002. [Google Scholar]
- Fan, Z.P.; Zhang, J.J.; Wen, W.; Li, C.P.; Jing, Y.P. Design and Implementation of ANP Analysis Tool Based on Analytic Network Process. Comput. Digit. Eng. 2020, 48, 46–50. [Google Scholar]
- Xu, K.; Chen, X.F. ”High Five” Risk Management System Based on Major Accidents Prevention. J. Wuhan Univ. Technol. (Inf. Manag. Eng.) 2017, 39, 649–653. [Google Scholar]
- Li, W.; Ye, Y.C.; Wang, Q.H.; Wang, X.H.; Hu, N.Y. Risk identification and assessment model for high risk factors of accidents of cage crashing in mine. J. Catastrophol. 2020, 35, 64–70. [Google Scholar]
- Wudhikarn, R. Improving the intellectual capital management approach using the hybrid decision method. J. Intellect. Cap. 2018, 19, 670–691. [Google Scholar] [CrossRef]
- Zha, S.S.; Guo, Y.; Huang, S.H.; Tang, P.Z. A hybrid MCDM approach based on ANP and TOPSIS for facility layout selection. Trans. Nanjing Univ. Aero. Astro 2018, 35, 1027–1037. [Google Scholar]
- Wudhikarn, R.; Chakpitak, N.; Neubert, G. Improving the Strategic Benchmarking of Intellectual Capital Management in Logistics Service Providers. Sustainability 2020, 12, 10174. [Google Scholar] [CrossRef]
- Wang, L.F. The Theory and Algorithm of Analytic Network Process. Syst. Eng.-Theory Pract. 2001, 3, 44–50. [Google Scholar]
- Li, Y.D.; Liu, C.Y. Study on the Universality of the Normal Cloud Model. Strateg. Study CAE 2004, 8, 28–34. [Google Scholar]
- Zhang, S.B.; Xu, C.X. Study on the Trust Evaluation Approach Based on Cloud Model. Chin. J. Comput. 2013, 36, 422–431. [Google Scholar] [CrossRef]
- Chen, L.; Jin, L.; Huang, B.; Cao, W.D.; Wang, X.D. On the quantitative Bow-tie analysis of the tank leakage risk based on the 2-D cloud model. J. Saf. Environ. 2020, 20, 809–815. [Google Scholar]
- Jing, M.B.; Li, X.H. Study on the construction of a safety production risk grading and control system for LNG receiving stations. China Pet. Chem. Stand. Qual. 2021, 41, 5–6. [Google Scholar]
- Huang, W.Y. Risk Assessment and Countermeasure Research of LNG Ship Navigate in Dapeng Bay Based on Entropy-Cloud Model. Master’s Thesis, Dalian Maritime University, Dalian, China, 2019. [Google Scholar]
- Li, W.D.; Zhou, D.H.; Xiao, Z.H.; Zhang, M. Risk Analysis of LNG Storage Tank Based on Bow-tie—Normal Cloud Model. Fire Sci. Technol. 2021, 40, 1322–1327. [Google Scholar]
- Qiang, X.H.; Ma, J.J. Evaluation of Urban Transit Service Level Based on ANP and Cloud Model. Traffic Transp. 2022, 38, 27–32. [Google Scholar]
- Zhu, G.H.; Sun, X.W. Security Risk Evaluation of Warship Training Activities Using ANP-Cloud Model. Command Control Simul. 2022; in press. [Google Scholar]
- Xiao, Z.H.; Zhou, D.H.; Li, W.D.; Chang, L.; Wang, N.; Liu, Y.; Dai, T.W. Safety Risk Assessment of Chemical Industry Park Based on Cloud Model. J. Wuhan Inst. Technol. 2022, 44, 112–118. [Google Scholar]

Publisher’s Note: MDPI stays neutral with regard to jurisdictional claims in published maps and institutional affiliations. |
© 2022 by the authors. Licensee MDPI, Basel, Switzerland. This article is an open access article distributed under the terms and conditions of the Creative Commons Attribution (CC BY) license (https://creativecommons.org/licenses/by/4.0/).