Abstract
The aim of this work is to analyse the physicochemical features of milk fat products (60%, 74% and 82% fat) and to learn about consumer preferences regarding these products, based on the results of consumer research. In addition, this study was conducted to answer the question of which features of milk fat products are most valued by consumers and which fat attribute has the strongest influence on consumer choice. Tests on the physicochemical characteristics of milk fat products, including analysis of composition, water activity, tocopherol and β-carotene content, colour, texture, melting profile and solid fat index, as well as consumer tests are carried out. The tested products met the requirements of Appendix II for Regulation (EU) No. 1308/2013. Based on consumer preferences, it was found that taste, followed by colour, was the most important attribute of milk fat products. The most desired fat was butter (82% fat), although it was difficult to spread at 4 °C. The best cuttability and spreadability was found in butter containing three-quarters fat (74%), but it was the least desired product by consumers. Most of the respondents (68%) preferred the yellow shade of milk fats to the white one. This indicates the need to add colours (e.g., carrot juice concentrate or other natural healthy food ingredients).
1. Introduction
Milk and dairy products are important sources of nutrients and energy in human diets. In the wide range of milk products on the market, butter is among those recommended and invariably chosen as an important element of a diet [1]. It is highly valued for its characteristic flavour and aroma. Butter is a water–in–oil (W/O) emulsion. It is probably one of the oldest milk products, produced by the concentration of milk fat following the destabilisation of oil-in-water (O/W) milk or cream emulsion [2]. The butter is obtained by processing milk. The main steps in the production of butter are cream separation (by centrifugation of milk), cream pasteurisation, cooling, maturation (physical or biological), churning, washing the butter granules, working of butter and packaging [3].
In accordance with Appendix II in Regulation (EU) No. 1308/2013, in the European Union, there exist four trade names for products containing only milk fat: butter (80–90% milk fat content), three-quarter fat butter (i.e., 3/4 from 80%, which has between 60 and 62% milk fat content), half-fat butter (39–41% milk fat content) and dairy spread X% (milk fat content less than 39% or more than 41% but less than 60% or milk fat content more than 62% but less than 80%) [4].
The sensory and rheological properties of milk fat products are determined by the interaction of many factors. The breed of cow, feeding, season and climate conditions all influence the fatty acid composition. Different methods for the production of butter and technological parameters of processes influence the number and size of fat crystals. Milk fat contains a wide variety of triacylglycerols, and each has its own melting point, which is determined by the melting point of its fatty acids [5,6].
In many parts of the world, apart from traditional butter (80% milk fat), reduced fat butters (spreads) with declared fat contents are produced [7]. As regular butter must have a temperature not less than 15 °C before it can be easily spread [8], food manufacturers have responded by producing softer forms of butter (e.g., with a higher water content) [9].
Another trend is adding healthy food products to milk fats. Kaur et al. [10] mixed lycopene with butter for aesthetic and neutraceutical purposes. Vidanagamage et al. [11] showed that cinnamon extract can be used to formulate an antioxidant-rich butter, and it can be placed as a natural preservative for butter preparation.
The aim of this research was to investigate the physicochemical characteristics and sensory preferences related to the fat content in milk fat products. This study aimed to find out which dairy fats customers like the most and why. The obtained answer would be valuable information for dairy groups that want to produce the bestselling fats (e.g., with increased health value by adding natural health-promoting ingredients).
2. Materials and Methods
2.1. Samples
Three-quarter fat butter with a declared 60% fat content, 74% dairy spread and butter with a fat content of 82% were selected for the purpose of this study. The samples (commercially available), consisting of 200 g blocks, were provided by a local dairy company (Mleczarnia Naramowice, Poznań, Wielkopolska, Poland). The samples were collected at the same time (in January). The milk was delivered to the dairy company from a university farm where the cows did not have access to pastures. The fats were produced with no colourants used.
2.2. Composition, Water Activity, Tocopherols and β-Carotene
Determination of the moisture, fat, protein and lactose contents was performed according to the ISO [12,13,14,15]. The determination of the salt content was carried out according to the ISO [16]. The tocopherols and β-carotene were analysed as described in detail by Prates et al. [17].
The water activity of the samples was measured using AquaLab Pre (Decagon Devices, Inc., Pullman, WA, USA). A sample was placed in a measuring vessel and then a measuring chamber and tested at 20 °C [18].
2.3. Colour
In order to provide a physical determination of the colour for the three fats, five colour compounds were read from the device: L*, a*, b*, c and h. The L* component denotes lightness and assumes values from L* = 0 (black colour) to L* = 100 (white), hue (h) was determined with an angle formed by a straight line crossing the centre of the system and measured point with coordinates a*, b* on axis a* (in a* b* coordinate system), and the chroma (c, or depth of colour) was the distance of a point (a*, b*) from the centre of the system. The analyses were conducted using an SP60 X-Rite spectrophotometer (Grandville, MI, USA). The measurements were recorded using illuminant D65 and geometric d/8, with a measurement area of 8 mm and 10° standard observer on the SPIN setting. The spherical geometry in the device had two variants, with the first being SPIN (Specular Component Included (SCI)). In the SPIN mode, the colour is measured independently of the sample’s gloss and texture. The thickness of the sample was 30 mm, and its temperature was 10 °C. Colour differences (ΔE) between the samples were calculated according to Equation (1). The values for L*, a* and b* obtained for the two compared fats were inserted into the following formula:
ΔE = [(ΔL*)2 + (Δa*)2 + (Δb*)2]½
Value ΔE is interpreted as follows: 0 < ΔE < 1 indicates a normally invisible difference; 1 < ΔE < 2 indicates a very small difference only obvious to a trained eye; 2 < ΔE < 3.5 indicates a medium difference, which is also obvious to an untrained eye; 3.5 < ΔE < 5 indicates an obvious difference; and 5 < ΔE indicates a very obvious difference [19].
2.4. Texture Tests
The textures of spreads at temperatures of 4–20 °C were tested using a TA.XT plus Texture Analyzer (Stable Micro Systems Ltd., Godalming, Surrey, UK). Two texture tests were selected: cutting force and spreadability.
2.4.1. Cutting Force
The purpose of this test was to determine the “firmness” of the samples by their resistance to cutting by wire. The cutting force of the products was tested. The measurements were taken with the following accessories: a heavy duty platform (HDP/90), a wire cutter (Ø 0.3 mm) and a 5 kg load cell. The conditions of the measurements were as follows: a test speed of 0.5 mm s–1, distance of 25 mm and trigger type of 50 g. (The texture analyser would move the probe down until it detected a force greater than the trigger force setting.) The dimensions of tested samples were 100 mm long × 75 mm wide × 30 mm high. The samples consisted of bars of butter (cuboids). The wire cut the 100 mm × 75 mm surface (the top of the butter bar, positioned flat on the largest side) to a depth of 25 mm (so that 5 mm remained uncut).
2.4.2. Spreadability
Spreadability is the force required to obtain a given deformation and the amount of deformation under a given force. As a result of testing, a mean maximum force called the “firmness” (N) and a mean area called the “work of shear” (N s) were obtained. The equipment was operated under the following conditions: a test speed of 3.0 mm s−1, distance of 23 mm and trigger type button. (The measurement started as soon as the run command was given and the probe started moving) Male and female perspex cones were used. A sample was placed in a female cone and pressed down to eliminate air pockets. The excess was scraped off the sample with a knife to leave the test area flat. A precisely matching male cone was lowered into the sample, forcing the fat to flow upwards and outwards. The ease with which the sample flowed was the indication of its spreadability [20].
2.5. Differential Scanning Calorimetry (DSC)
A differential scanning calorimeter 7 (Perkin Elmer, Norwalk) equipped with an Intracooler II and Pyris software was used to examine the melting properties of the butter and reduced fat butters. Nitrogen (99.99% purity) was the purge gas. The calibration was performed using indium (m.p. 156.6 °C, ∆Hf = 28.45 J∙g−1) and n-dodecane (m.p. −9.65 °C, ∆Hf = 216.73 J∙g−1). Samples of the fats (9–10 mg) were weighed in aluminum pans of 20 μL (Perkin Elmer, No. 0219-0062) and sealed hermetically. The reference was an empty, hermetically sealed aluminum pan. The following temperature programme was set: (1) cooling at 5 °C∙min−1 to −40 °C and (2) heating at 5 °C∙min−1 to 50 °C. Three replicates were analysed for each sample. Melting enthalpy was calculated from the heating curve as the area under the curve, limited by the baseline. From the results of the melting enthalpy percentage area, a curve was plotted vs. temperature, and the solid fat indexes (SFI) for 4 and 20 °C were calculated:
where AT is the area percentage determined at a certain temperature (4 or 20 °C).
SFIT = 100 − AT (%)
2.6. Consumer Opinion
The products were tested by consumers (n = 100) over 18 years of age. The test was performed inside a building for 4 days from 10:00 a.m. to 4:00 p.m. Consumers were recruited among the visitors of a local mass event.
Consumers who declared butter consumption at least once a day were selected for the study. The preliminary tests determined the temperatures of the test samples. The consumers declared eating butter straight from the fridge or stored at room temperature.
The consumers were asked to evaluate the samples at a temperature of 4 °C (taken out directly from the refrigerator) and 20 °C (stored under refrigeration conditions and placed at a room temperature for 3 h before consumer testing to imitate home consumption). The panelists individually evaluated 7 g samples presented in plastic cups. They were given room temperature water and unsalted crackers to cleanse their palates between samples [21].
The preferences regarding colour, appearance, aroma, spreadability and taste of these spreads were examined. The differentiation criterion was the preference for a sensory attribute (e.g., colour) of a sample in relation to the remaining ones.
The respondents (n = 100) answered six questions: “Which colour/appearance/aroma/spreadability and taste of a sample do you like best?” and “Which sample of the three do you like best?” In these types of questions, the respondents could not say that the products were equal. They were forced to prioritise. A scale of 0–2 was used to specify the degree of meeting expectations either by only one feature or by the product in general. Each respondent had to evaluate 3 products (three-quarter fat butter, 74% dairy spread and butter) using the following scale: 0, 1 and 2, where 0 was the least accepted product, 1 was an accepted product and 2 was the most accepted product. The samples were given in random order. Only products with two points were selected for further analysis. The advantages of this method are simple tasks and quick assessment.
The surveys were once again analysed and the overlapping replies checked for the first and last question), and then for the second and last question, and so on.
Additionally, a new group of respondents (n = 600 over 18 years of age) answered the question of whether they preferred milk fat products of a more white or yellow colouring.
2.7. Statistical Analysis
The values describing colour and texture are the arithmetic means of 9 measurements. Three samples of each product were evaluated in triplicate.
The results obtained for the samples were subjected to one-way ANOVA and Tukey’s honestly significant difference (HSD) test using Statistica data analysis software version 10 (StatSoft, Tulsa, OK, USA). Verification of the statistical hypotheses was accomplished by adopting an α = 0.05 level of significance.
3. Results and Discussion
3.1. Composition, Water Activity, Tocopherols and β-Carotene
The examined products were characterised by an average fat content of 60.4% (three-quarter fat butter), 74.1% (dairy spread) and 82.3% (butter). The obtained results were correct in accordance with the law, where the fat content should not be one percentage point different from the value declared on the packaging. The butter met the standard requirement for butter. United States standards [22] define butter as a product containing no less than 80% weight of milk fat.
The composition, tocopherols, β-carotene and water activity are presented in Table 1. The average β-carotene content in the butter was within the range of values obtained by Fauteux et al. [23] and Marino et al. [24]. The tocopherol content was similar to that obtained by Silva et al. [25] (14.0–22.0 mg 100 g−1 butter).

Table 1.
Composition of the analysed products.
3.2. Colour
The product composition influenced all the attributes of colour (Table 2). As Klepacka [26] reported, the samples with increased water contents had lower lightness than the dry samples. This statement was confirmed in our research. The lightest product (highest L* value) was the one with the highest water content and thus the lowest fat content. The greatest changes were recorded in the attribute of colour a* with an increasing fat content. Such a change may be explained by an increasing content of β-carotene, a natural fat-soluble pigment. The butter with 82% fat content was also characterised by the greatest depth of the yellow colour. Kneifel et al. [27] investigated the effect of the carotene content on the values of attribute b*, and they reported that the milk fat products with a colour attribute value of b* = 20 (as in our study) contained β-carotene at about 2 mg kg–1 fat. The content of β-carotene in milk fat is dependent on the method of animal feeding and the lactation stage, with the carotene amount changing between 1.6 and 7.6 mg kg–1 fat [28,29,30].
Table 2.
Colour attributes of the analysed products.
The difference in colour (ΔE) between the three-quarter fat butter and the 74% dairy spread was 2.9. Additionally, for the 74% dairy spread and butter, the values were very similar at 3.0. The greatest difference in colour, observed already as the occurrence of two different colours, was found between the three-quarter fat butter and butter (i.e., 5.6). The most saturated colour was characteristic of butter. The three-quarter fat butter was described as the palest. The colour of all samples was yellow, considering the closeness of axis b*. The colour depicted as a point of a*, b* coordinates in the Cartesian coordinate system (with a*, b* axes) occurred—for all samples—in the first quarter, as shown by the h values (an angle between 0 and 90°). As was shown by Rohm and Strobl [31], darker butters (with a lower L* value and higher values of a* and b*) are perceived by consumers as more spreadable.
3.3. Texture
The data from the texture analysis of the products were recorded as presented in Table 3 and Table 4. These results clearly show that, irrespective of the product temperature, the greatest cutting force was found for the sample with the highest fat content. The study of Rønholt et al. [32] demonstrated that increasing the water content in a milk fat product from 20% to 33% decreases the elastic modulus G’ and thus the hardness of products. The cutting force of tested samples at a temperature of 4 °C was 14, 12 and almost 9 times greater (for 60, 74 and 82% milk fat samples, respectively) than the value measured at a temperature of 20 °C. Figueiroa et al. [33] and Ozcan et al. [34] explained this by the changes in the state of matter (transition from a solid to a liquid state) of oleic acid C18:1 (melting point: 13–16 °C) and additionally caprylic acid C:8 (melting point: 16–17 °C).
Table 3.
Texture and solid fat index of the analysed products at 4 °C.
Table 4.
Texture and solid fat index of the analysed products at 20 °C.
Lis et al. [35] tested the cutting force for 18 butter samples with 82% fat content (at 10 °C) and obtained an average value of 3.40 N. This value is within the range of results obtained in this study (1.84–16.26 N for 4 and 20 °C, respectively). In addition, Chudy et al. [36] obtained a cutting force for goat’s butter (81.2% fat content) of 1.54 N (at 10 °C). Couvreur et al. [37] tested butter for resistance to penetration using a cone. They obtained results between 182 and 245 N (depending on the feed supplied to the cows), whereas our result was 194.45 N for the butter. A wide range of texture results and visible discrepancies in the research results may be due to the different sample temperature, sample size and texture analyser configurations used. In addition, the origin of the milk fat (lipid profile and fat globule size) had a significant influence on the cutting force.
The best spreadability (the smallest value of firmness and work of shear) was observed for the three-quarter fat butter due to its lowest content of fat. Similar results were reported by Glibowski et al. [38]. The spreadability of the butter (82% fat) and dairy spread (74%) at 5 °C was similar in their study, being approximately 450 and 380 N s, respectively. At a temperature of 20 °C, the spreadability was 40 N s for these two products.
Chudy et al. [36] obtained the following values of spreadability for goat’s milk butter at 10 °C: 122.14 N for firmness and 152.69 N s for work of shear.
Lee and Martini [39] evaluated the combined effect of the temperature (5, 10 and 15 °C) and agitation rate (0, 40 and 240 rpm) during aging of cream on the physical properties of cream and butter in a model system. They obtained the hardest butter when the cream was aged at 5 °C and 240 rpm and at 10 °C and 40 rpm. Softer butter was obtained when the cream was aged at 10 °C and 240 rpm (this butter also had the highest water content). This shows that the butter hardness can be tailored by changing the aging conditions of the cream. Lee and Martini [39] proved that cream can be aged at higher temperatures with low agitation without altering the hardness of the butter.
3.4. Differential Scanning Calorimetry
DSC is a useful technique for the characterisation of melting properties of fats and oils, and it can be used to determine the SFI values by using partial areas of the melting curve. SFI values express the percentage of solid phase in a fat sample at a certain temperature. It can be seen in Figure 1 that for the three-quarter fat butter, the highest peak of approximately 4 °C was detected, which was connected with ice melting. Figure 2 shows the percentage area of the melting curves vs. temperature. From those curves, the SFI was calculated, and the results are presented in Table 3 and Table 4. The highest SFI value was observed for butter at 4 °C and 20 °C, and the lowest value was recorded for the 60% fat sample for both temperatures (4 °C and 20 °C). The obtained SFI values correlated well with the cutting force and spreadability results. Islam et al. [40] showed that the crystallisation and melting profiles of fats are regulated by heat-related phenomena and associated mainly with their triacylglycerol (TGA) and fatty acid (FA) compositions.
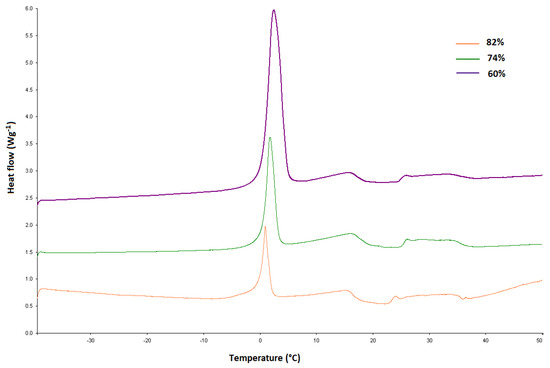
Figure 1.
DSC melting curves of three types of milk fat products with fat contents of 60%, 74% and 82%.
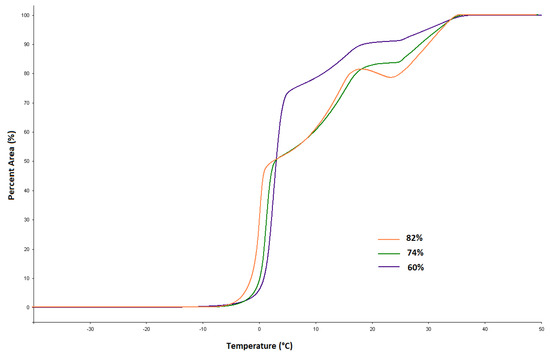
Figure 2.
Curves of the percentage area calculated from DSC melting curves of the milk fat products with fat contents of 60%, 74% and 82%.
3.5. Consumer Opinion
The greatest number of respondents preferred butter both at 4 °C and 20 °C (Table 5). Additionally, all the attributes (colour, appearance, aroma, spreadability and taste) of that product were deemed the most attractive. An exception was found for the aroma of butter at 20 °C. At the temperature of 20 °C, the greatest percentage of consumers preferred the aroma of the 74% dairy spread.
Table 5.
The preferences (%) regarding colour, appearance, aroma, spreadability, taste and an overall preference for milk fat products (n = 100).
Mallia et al. [41] showed that more than 230 volatile compounds have been identified in butter. However, only a small number of them can be considered key odorants of the butter aroma. As Budlo and Wiking [42] reported, the characteristic flavour of cultured butter is associated with diacetyl and δ-decalactone compounds. Some aromatic compounds of butter are located in water droplets, and this could explain why the respondents preferred the smell of the 74% dairy spread (at 20 °C) (i.e., of the product with the highest water content).
In addition, it was checked whether a given respondent gave the same assessment of the examined feature at 4 and 20 °C. The responses concerning preferences for the 5 attributes of spreads at temperatures of 4 and 20 °C overlapped at 67% (for colour), 47% (for appearance), 42% (for aroma), 60% (for spreadability) and 62% (for taste). Most respondents (73%) had identical preferences concerning their favourite types of products in both temperature variants.
In order to verify which attribute was most significant in the evaluation of milk fat products, it was examined to what extent the selection of a product with a preferred attribute overlapped with the preference for a given product (Table 6). It was checked which fat attributes were most important to the respondents. The most important attributes and criteria in the selection of products were taste and colour. The attribute shown to be least significant in the selection of butter and reduced fat butters was spreadability at 4 °C and aroma at 20 °C.
Table 6.
Indication of the most desirable milk fat product and indication of the same product having the most desirable given feature (colour, appearance, etc.) (%).
In the last part of the study, the respondents expressed their opinions on the shade of milk fats. Most of them (68%, n = 600 respondents) stated that they preferred milk fat products with a more yellow rather than white colour. For this reason, some dairy companies add colourants to butter and reduced fat butter. One of the more interesting methods of altering the butter’s colour is adding powdered carrot [43] and sea buckthorn to it [36].
4. Conclusions
In terms of fat content, the products met the requirements of Regulation (EU) No. 1308/2013. The fat content determined all the examined attributes of the products. Although the three-quarter fat butter was the easiest to cut and the most spreadable, the texture of the 82% fat butter suited consumers best. The consumers tended to select milk fats with the highest fat content, even at the temperature of 4 °C when they are difficult to spread on bread. The consumers also preferred a more yellowish milk fat colour (such as in butter) than a pale colour (such as in the three-quarter fat butter). The most important attribute and criterion in the selection of milk fat products was taste, followed by colour.
The obtained results may be helpful for dairies which, following new trends, add healthy food ingredients to dairy products.
Author Contributions
Conceptualisation, S.M.C.; methodology, S.M.C. and J.T.-G.; formal analysis, S.M.C., D.C.-S. and J.T.-G.; investigation, S.M.C.; resources, S.M.C.; data curation, S.M.C. and J.T.-G.; writing—original draft preparation, S.M.C.; writing—review and editing, D.C.-S. and J.T.-G.; visualisation, S.M.C. and J.T.-G.; supervision, D.C.-S. All authors have read and agreed to the published version of the manuscript.
Funding
This research received no external funding.
Institutional Review Board Statement
The study was conducted in accordance with the Declaration of Helsinki. Consumer testing was conducted in accordance with Polish law. Hygiene rules were in place during the test, participation of the consumers was voluntary, and the tasted fats were commercially available products.
Informed Consent Statement
Informed consent was obtained from all subjects involved in the study.
Data Availability Statement
Not applicable.
Conflicts of Interest
The authors declare no conflict of interest.
References
- Mollica, M.P.; Trinchese, G.; Cimmino, F.; Penna, E.; Cavaliere, G.; Tudisco, R.; Musco, N.; Manca, C.; Catapano, A.; Monda, M.; et al. Milk Fatty Acid Profiles in Different Animal Species: Focus on the Potential Effect of Selected PUFAs on Metabolism and Brain Functions. Nutrients 2021, 13, 1111. [Google Scholar] [CrossRef]
- Guiné, R.P.F.; Florença, S.G.; Carpes, S.; Anjos, O. Study of the Influence of Sociodemographic and Lifestyle Factors on Consumption of Dairy Products: Preliminary Study in Portugal and Brazil. Foods 2020, 9, 1775. [Google Scholar] [CrossRef]
- Pavlova, T.A.; Dunaev, A.V.; Danilova, E.S. Technology of producing butter with long-term storage from goat milk. IOP Conf. Ser. Earth Environ. Sci. 2022, 1, 12047. [Google Scholar] [CrossRef]
- Regulation EU No. 1308 of the European Parliament and of the Council of 17 December 2013 establishing a common organisation of the markets in agricultural products and repealing Council Regulations (EEC) No. 922/72, (EEC) No. 234/79, (EC) No. 1037/2001 and (EC) No. 1234/2007, 2013. 17 December.
- Smykov, I.T.; Topnikova, E.V.; Danilova, E.S. Studies on fatty acid profile and microstructure of butter, dairy fat spreads and blended spreads produced in Russia. Int. J. Dairy Technol. 2021, 4, 629–640. [Google Scholar] [CrossRef]
- Pduręt, S. The Effect of Fat Content and Fatty Acids Composition on Color and Textural Properties of Butter. Molecules 2021, 26, 4565. [Google Scholar] [CrossRef]
- Lee, C.; Liao, H.; Lee, W.; Hsu, C.; Hsueh, F.; Pan, J.; Chu, C.; Wei, C.; Chen, M. Standars and labeling of milk fat and spread products in different countries. J. Food Drug Anal. 2018, 26, 469–480. [Google Scholar] [CrossRef] [PubMed]
- Marangoni, A.G.; Rousseau, D. Chemical and enzymatic modification of butterfat and butterfat–canola oil blends. Food Res. Int. 1998, 31, 595–599. [Google Scholar] [CrossRef]
- Vithange, C.R.; Grimson, M.J.; Smith, B.G. The Effect of Temperature on the Rheology of Butter, A Spreadable Blend and Spreads. J. Texture Stud. 2009, 40, 346–369. [Google Scholar] [CrossRef]
- Kaur, D.; Wani, A.A.; Singh, D.P.; Sogi, D.S. Shelf life enhancement of butter, ice-cream, and mayonnaise by addition of lycopene. Int. J. Food Prop. 2011, 14, 1217–1231. [Google Scholar] [CrossRef]
- Vidanagamage, S.A.; Pathiraje, P.M.H.D.; Perera, O.D.A.N. Effects of cinnamon (Cinnamomum verum) extract on functional properties of butter. Procedia Food Sci. 2016, 6, 136–142. [Google Scholar] [CrossRef]
- ISO 3727; Butter—Determination of moisture, non-fat solids and fat contents—Part 1: Determination of moisture content (Reference method). International Standards Organisation: Geneva, Switzerland, 2001.
- ISO 3727-3; Butter—Determination of moisture, non-fat solids and fat contents—Part 3: Calculation of fat content. International Standards Organisation: Geneva, Switzerland, 2003.
- ISO 8968-1; Milk and milk products—Determination of nitrogen content—Part 1: Kjeldahl principle and crude protein calculation. International Standards Organisation: Geneva, Switzerland, 2014.
- ISO 22662; Milk and milk products—Determination of lactose content by high-performance liquid chromatography (Reference method). International Standards Organisation: Geneva, Switzerland, 2007.
- ISO 1738; Butter—Determination of salt content. International Standards Organisation: Geneva, Switzerland, 2004.
- Prates, J.A.M.; Quaresma, M.A.Q.; Bessa, R.J.B.; Fontes, C.M.G.A.; Alfaia, C.M.P.M. Simultaneous HPLC quantification of total cholesterol, tocopherols and β-carotene in Barrosa-PDO veal. Food Chem. 2006, 94, 469–477. [Google Scholar] [CrossRef]
- Cais-Sokolińska, D.; Bierzuńska, P.; Kaczyński, Ł.K.; Baranowska, H.M.; Tomaszewska-Gras, J. Stability of texture, meltability and water mobility model of pizza-style cheeses from goat’s milk. J. Food Eng. 2018, 222, 226–236. [Google Scholar] [CrossRef]
- Habekost, M. Which color differencing equation should be used? Int. Circ. Graph. Edu. Res. 2013, 6, 20–33. [Google Scholar]
- Karastojanov, S.; Kocevski, D. Determination of the rheological properties of mayonnaise. Int. J. Eng. 2013, 4, 36–40. [Google Scholar]
- Krause, A.J.; Lopetcharat, K.; Drake, M.A. Identification of the characteristics that drive consumer liking of butter. J. Dairy Sci. 2007, 90, 2091–2102. [Google Scholar] [CrossRef] [PubMed]
- USDA. United States Standards for Grades of Butter; Section 58.2621-2635; USDA: Washington, DC, USA, 1989; pp. 1–12. Available online: https://www.ams.usda.gov/sites/default/files/media/Butter_Standard%5B1%5D.pdf (accessed on 30 July 2022).
- Fauteux, M.C.; Gervais, R.; Rico, D.E.; Lebeuf, Y.; Chouinard, P.Y. Production, composition, and oxidative stability of milk highly enriched in polyunsaturated fatty acids from dairy cows fed alfalfa protein concentrate or supplemental vitamin E. J. Dairy Sci. 2016, 6, 4411–4426. [Google Scholar] [CrossRef] [PubMed]
- Marino, V.M.; Schadt, I.; Carpino, S.; Caccamo, M.; La Terra, S.; Guardiano, C.; Licitra, G. Effect of Sicilian pasture feeding management on content of α-tocopherol and β-carotene in cow milk. J. Dairy Sci. 2014, 1, 543–551. [Google Scholar] [CrossRef] [PubMed]
- Silva, C.C.; Silva, S.P.; Prates, J.A.; Bessa, R.J.; Rosa, H.J.; Rego, O.A. Physicochemical traits and sensory quality of commercial butter produced in the Azores. Int. Dairy J. 2019, 88, 10–17. [Google Scholar] [CrossRef]
- Klepacka, M. Kolorymetria Trójchromatyczna (Trichromatic Colorimetry). In Analiza Żywności (Food Analysis); Klepacka, M., Ed.; Fundacja Rozwój SGGW: Warsaw, Poland, 2003; p. 153. [Google Scholar]
- Kneifel, W.; Ulberth, F.; Schaffer, E. Tristimulus colour reflectance measurement of milk and dairy products. Le Lait 1992, 72, 383–391. [Google Scholar] [CrossRef]
- Jensen, S.K.; Johannsen, A.K.B.; Hermansen, J.E. Quantitative secretion and maximal secretion capacity of retinol, β-carotene and α-tocopherol into cows’ milk. J. Dairy Res. 1999, 66, 511–522. [Google Scholar] [CrossRef] [PubMed]
- Strusińska, D.; Antoszkiewicz, Z.; Kaliniewicz, J. The concentrations of β-carotene, vitamin A and vitamin E in bovine milk in regard to the feeding season and the share of concentrate in the feed ration. Rocz. Nauk. Pol. Tow. Zootech. 2010, 6, 213–220. [Google Scholar]
- Toledo, P.; Andren, A. Content of β-carotene in organic milk. J. Food Agric. Environ. 2003, 1, 122–125. [Google Scholar]
- Rohm, H.; Strobl, M. Butter colour affects sensory perception of spreadability. Z. Lebensm.Unters. Und Forsch. 1997, 205, 108–110. [Google Scholar] [CrossRef]
- Rønholt, S.; Kirkensgaard, J.J.K.; Mortensen, K.; Knudsen, J.C. Effect of cream cooling rate and water content on butter microstructure during four weeks of storage. Food Hydrocoll. 2014, 34, 169–176. [Google Scholar] [CrossRef]
- Figueiroa, F.J.F.; De Marchi, F.E.; dos Santos, G.T.; dos Santos, W.B.R.; da Silva Kazama, D.C.; Leite, L.C.; Branco, A.F.; Damasceno, J.C.R. Production, composition and fatty acid profile of milk and butter texture of dairy cows fed ground or pelleted concentrate with sunflower and/or lignosulfonate. Rev. Bras. De Zootec. 2013, 42, 743–750. [Google Scholar] [CrossRef][Green Version]
- Ozcan, T.; Yaslioglu, E.; Kilic, I.; Simsek, E. The influence of the season and milking time on the properties and the fatty acid composition of the milk in different dairy cattle farms. Mljekarstvo 2015, 65, 9–17. [Google Scholar] [CrossRef]
- Lis, A.; Staniewski, B.; Ziajka, J. A comparison of butter texture measurements with the AP 4/2 penetrometer and TA. XT. Plus texture analyzer. Int. J. Food Prop. 2021, 1, 1744–1757. [Google Scholar] [CrossRef]
- Chudy, S.; Cais-Sokolińska, D.; Teichert, J.; Bielska, P.; Kaczyński, Ł.K.; Biegalski, J. Colour and textural typologies of goat cream butter with sea buckthorn (Hippophae rhamnoides L.) puree: Instrumental, sensory, and consumer input for product development. Mljekarstvo 2021, 4, 237–247. [Google Scholar] [CrossRef]
- Couvreur, S.; Hurtaud, C.; Lopez, C.; Delaby, L.; Peyraud, J.L. The Linear Relationship between the Proportion of Fresh Grass in the Cow Diet, Milk Fatty Acid Composition, and Butter Properties. J. Dairy Sci. 2006, 89, 1956–1969. [Google Scholar] [CrossRef]
- Glibowski, P.; Zarzycki, P.; Krzepkowska, M. The Rheological and Instrumental Textural Properties of Selected Table Fats. Int. J. Food Prop. 2008, 11, 678–686. [Google Scholar] [CrossRef]
- Lee, J.; Martini, S. Effect of cream aging temperature and agitation on butter properties. J. Dairy Sci. 2018, 101, 7724–7735. [Google Scholar] [CrossRef] [PubMed]
- Islam, M.; Bełkowska, L.; Konieczny, P.; Fornal, E.; Tomaszewska-Gras, J. Differential scanning calorimetry for authentication of edible fats and oils--What can we learn from the past to face the current challenges? J. Food Drug Anal. 2022, 2, 185–201. [Google Scholar] [CrossRef]
- Mallia, S.; Escher, F.; Schlichtherle-Cerny, H. Aroma-active compounds of butter: A review. Eur. Food Res. Tech. 2008, 226, 315–325. [Google Scholar] [CrossRef]
- Budlo, P.; Wiking, L. Butter: Properties and Analysis. In Encyclopedia of Food and Health, 1st ed.; Caballero, B., Finglas, P.M., Toldrá, F., Eds.; Elsevier Academic Press: Cambridge, MA, USA, 2016; pp. 535–541. [Google Scholar]
- Rashevska, T.O.; Vasheka, O.M. The technology of butters’ enriching with carrots’ powder. Procedia Food Sci. 2011, 1, 1404–1409. [Google Scholar] [CrossRef][Green Version]


Publisher’s Note: MDPI stays neutral with regard to jurisdictional claims in published maps and institutional affiliations. |
© 2022 by the authors. Licensee MDPI, Basel, Switzerland. This article is an open access article distributed under the terms and conditions of the Creative Commons Attribution (CC BY) license (https://creativecommons.org/licenses/by/4.0/).