Article

Robust Classification Model for Diabetic Retinopathy Based on the Contrastive Learning Method with a Convolutional Neural Network

1
Endocrinology Centre, Fuwai Hospital, Chinese Academy of Medical Sciences and Peking Union Medical College, Beijing 100037, China
2
Department of Endocrinology, Fuwai Hospital, Chinese Academy of Medical Sciences, Shenzhen 518057, China
3
National Space Science Center, Chinese Academy of Sciences, Beijing 100190, China
*
Authors to whom correspondence should be addressed.
These authors contributed equally to this work.
Appl. Sci. 2022, 12(23), 12071; https://doi.org/10.3390/app122312071
Submission received: 27 April 2022 / Revised: 31 October 2022 / Accepted: 22 November 2022 / Published: 25 November 2022
(This article belongs to the Special Issue Advances and Application of Intelligent Video Surveillance System)

Abstract

:
Diabetic retinopathy is one of the most common microvascular complications of diabetes. Early detection and treatment can effectively reduce the risk. Hence, a robust computer-aided diagnosis model is important. Based on the labeled fundus images, we build a binary classification model based on ResNet-18 and transfer learning and, more importantly, improve the robustness of the model through supervised contrastive learning. The model is tested with different learning rates and data augmentation methods. The standard deviations of the multiple test results decrease from 4.11 to 0.15 for different learning rates and from 1.53 to 0.18 for different data augmentation methods. In addition, the supervised contrastive learning method also improves the average accuracy of the model, which increases from 80.7% to 86.5%.

1. Introduction

Diabetic retinopathy can cause non-reversible damage to retina blood vessels and even blindness. The risk can be reduced by early diagnosis. However, scanning is an intensive task. Hence computer-aided scanning models of diabetic retinopathy are necessary.
Many machine learning algorithms have been proposed to build an automatic classifier of diabetic retinopathy, which is the core of a computer-aided scanning system. In machine learning methods, the data are the basis for learning the classifiers for diabetic retinopathy. A diabetic retinopathy dataset was provided on the Kaggle website in 2015 [1]. The Kaggle diabetic retinopathy detection competition consists of 35,126 and 53,576 fundus images for training and testing, respectively. Porwal et al. [2] collected a fundus image dataset for the Indian population. The Indian Diabetic Retinopathy Image Dataset (IDRiD) consists of 516 fundus images. Li et al. [3] collected a fundus image dataset for the Chinese population. The dataset is named DDR (Dataset of Diabetic Retinopathy), and it consists of 13,673 color fundus images. Zhou et al. [4] constructed a diabetic retinopathy dataset named FGADR. FGADR contains 2842 fine-grained annotated diabetic retinopathy images. Decencière et al. [5] published a diabetic retinopathy dataset named Messidor in 2008. The Messidor dataset contains 540 normal images (fundus images without diabetic retinopathy) and 660 abnormal images (fundus images with diabetic retinopathy).
Supported by the labeled fundus images, many automatic classification models of diabetic retinopathy have been built by deep learning methods and have achieved state-of-the-art performance. Oltu et al. [6] showed that deep neural networks achieved good performance for the detection of diabetic retinopathy. The performances of different deep learning networks, such as VGG19, InceptionV3, ResNet50, NASNet, and MobileNet, were tested for the classification of diabetic retinopathy in [7]. Alyoubi et al. [8] built two deep learning models for diabetic retinopathy; one was applied to distinguish fundus images, and the other was used to detect the lesions of diabetic retinopathy. Transfer learning can be used to improve the classification model for diabetic retinopathy [9], and it is considered as a useful method for learning from a dataset with a limited size [10]. In essence, a deep learning method requires a sufficiently large number of data to obtain a reliable model. It is risky to obtain a robust classifier for a deep learning model trained on a dataset with a limited size. Tian et al. [11] suggested that the ordinal information of classes is helpful. Hence, an ordinal regression method was applied to train a more discriminative classification model for diabetic retinopathy. The new deep learning network called BiRA-Net was proposed in [12]. An attention mechanism was applied to build a fine-grained classification model.
Common deep learning networks lack explanation and are sensitive to the training parameters. The explanation and robustness should be improved to build a more practical classification model for diabetic retinopathy. Quellec et al. [13] proposed an eXplainable Artificial Intelligence (XAI) for the classification task of diabetic retinopathy. Independent component analysis with a score visualization technique was used to generate an explainable deep learning model for diabetic retinopathy [14]. The visualization strategy of networks was applied to discover the inherent features of fundus images in [15]. For a practical medical model, the robustness of the model is a key factor. Adversarial training methods were applied to improve the robustness of the classification model in [16]. The built classification model should not fail due to minor changes in the fundus images. Spatial attention and channel attention mechanisms were considered in [17] to capture the important features from fundus images and finally build a robust classification model.
Contrastive learning is another way to improve the robustness of the classification model. However, it has not been used to build a classification model for diabetic retinopathy. In order to improve the robustness of the model, we apply supervised contrastive learning to classify the fundus images. The accuracy and robustness of the proposed model are estimated and discussed.
This article is organized as follows: The data are described in Section 2. The classification model and its modeling method are proposed in Section 3. The performance of the proposed model is estimated and discussed in Section 4, and the conclusions are provided in Section 5.

2. Related Work

Deep learning has been widely used to build classification models for diabetic retinopathy. As shown in Table 1, the model includes binary classification or multiple classification. The binary classification model distinguishes the diabetic retinopathy images from the normal images. The multiple classification model classifies the images into five stages—normal, mild, moderate, severe, and proliferative diabetic retinopathy. Many popular deep neural networks, for example, AlexNet, VggNet, GoogleNet, and ResNet, have been applied to build classification models for diabetic retinopathy. In addition, some specifically designed networks, for example, Zoom-in-Net, BiRA-Net, CANet, and CABNet, have also achieved good performance for the classification of diabetic retinopathy. A weighted path convolutional neural network (WP-CNN) [18] was proposed to concatenate the convolutional outputs in different paths with weights. The WP-CNN enhanced the representation capacity of the deep neural network and improved the classification performance for diabetic retinopathy. Bodapati et al. [19] obtained a new state-of-the-art result for diabetic retinopathy severity level prediction on the Kaggle APTOS 2019 dataset. Tariq et al. [20] utilized deep transfer learning, including AlexNet, GoogleNet, Inception V4, Inception ResNet V2, and ResNeXt-50, for a five-degree classification of diabetic retinopathy. Chen et al. [21] proposed a novel preprocessing algorithm, including scaling, resizing, cropping, and augmenting, to enhance the quality of the fundus images and to achieve better performance of the diabetic retinopathy classification model. Nneji et al. [22] proposed a new deep learning network called WFDLN (weighted fusion deep learning network) to automatically extract features and build a classification model for diabetic retinopathy. Zoom-in-Net [23] was constructed to diagnose diabetic retinopathy. An attention mechanism was applied to focus on the key area and improve the model performance in the Zoom-in-Net. BiRA-Net [12], which combined the attention mechanism and a bilinear model, was applied to consider the influence of small objects in the fundus images on the classification model for diabetic retinopathy. A cross-disease attention network (CANet) [24] was proposed to jointly build a model for diabetic retinopathy and diabetic macular edema. The relationship between diabetic retinopathy and diabetic macular edema was explored and applied in the proposed model. A category attention block network (CABNet) [25] was used to treat the class imbalance problem in diabetic retinopathy. The discriminative features were extracted from each category of diabetic retinopathy. The attention mechanism has been widely used to extract the fine-grained features and improve the classification performance of diabetic retinopathy. However, contrastive learning, which can be used to improve the robustness of model, has not been applied to build a diabetic retinopathy classification model yet. In order to improve the robustness of the classification model, supervised contrastive learning method was applied to build a classification model for diabetic retinopathy.

3. Materials and Methods

3.1. Dataset

Li et al. [3] released a fundus image dataset called DDR (dataset of diabetic retinopathy) for diabetic retinopathy screening. We used the DDR as our dataset. The DDR is an image dataset, consisting of 13,673 samples divided into six classes, including no diabetic retinopathy, mild diabetic retinopathy, moderate diabetic retinopathy, severe diabetic retinopathy, proliferative diabetic retinopathy, and ungradable data. In our research, we discarded the ungradable samples and merged all the diabetic retinopathy samples into one class to obtain a balanced dataset. Finally, the dataset consisted of 6263 samples without diabetic retinopathy and 6256 samples with diabetic retinopathy. The dataset was categorized into a training set, validation set, and testing set at a ratio of 5:2:3.

Data Preprocessing

The image sizes of the raw data ranged from 5184p × 3456p to 702p × 717p. To fit the model, all images were resized to 224p × 224p. Several commonly used data augmentation methods were applied to the original data, including random horizontal flip, random vertical flip, random rotation, and color jitter. To obtain the robustness of the supervised contrastive learning, different combinations of the above data augmentation methods were tested.

3.2. Modeling Method

We used supervised contrastive learning based on ResNet-18 to classify the data. A supervised contrastive (SupCon) loss was applied to the pretraining stage. The parameters of the convolutional layers were finetuned in the pretraining stage and frozen in the classification stage.

3.2.1. Networks

ResNet was selected as the backbone network. ResNet is one of the most popular deep neural networks. The key improvement of ResNet is residual learning. Residual learning is a kind of shortcut connection. It copies the previous layer’s feature to the next layer. This solves the degradation problem in very deep neural networks. This makes it possible to build a neural network with hundreds of layers. In this paper, ResNet-18 was selected to build a supervised contrastive learning model. There were 18 layers with weights, including convolutional layers and fully connected layers.
The structure of ResNet-18 is shown in Figure 1. Batch normalization was applied to each basic block of the residual block. The activation function between two convolutional layers in the basic block was ReLU. The structure of ResNet-18 is simple but efficient.

3.2.2. Supervised Contrastive Learning

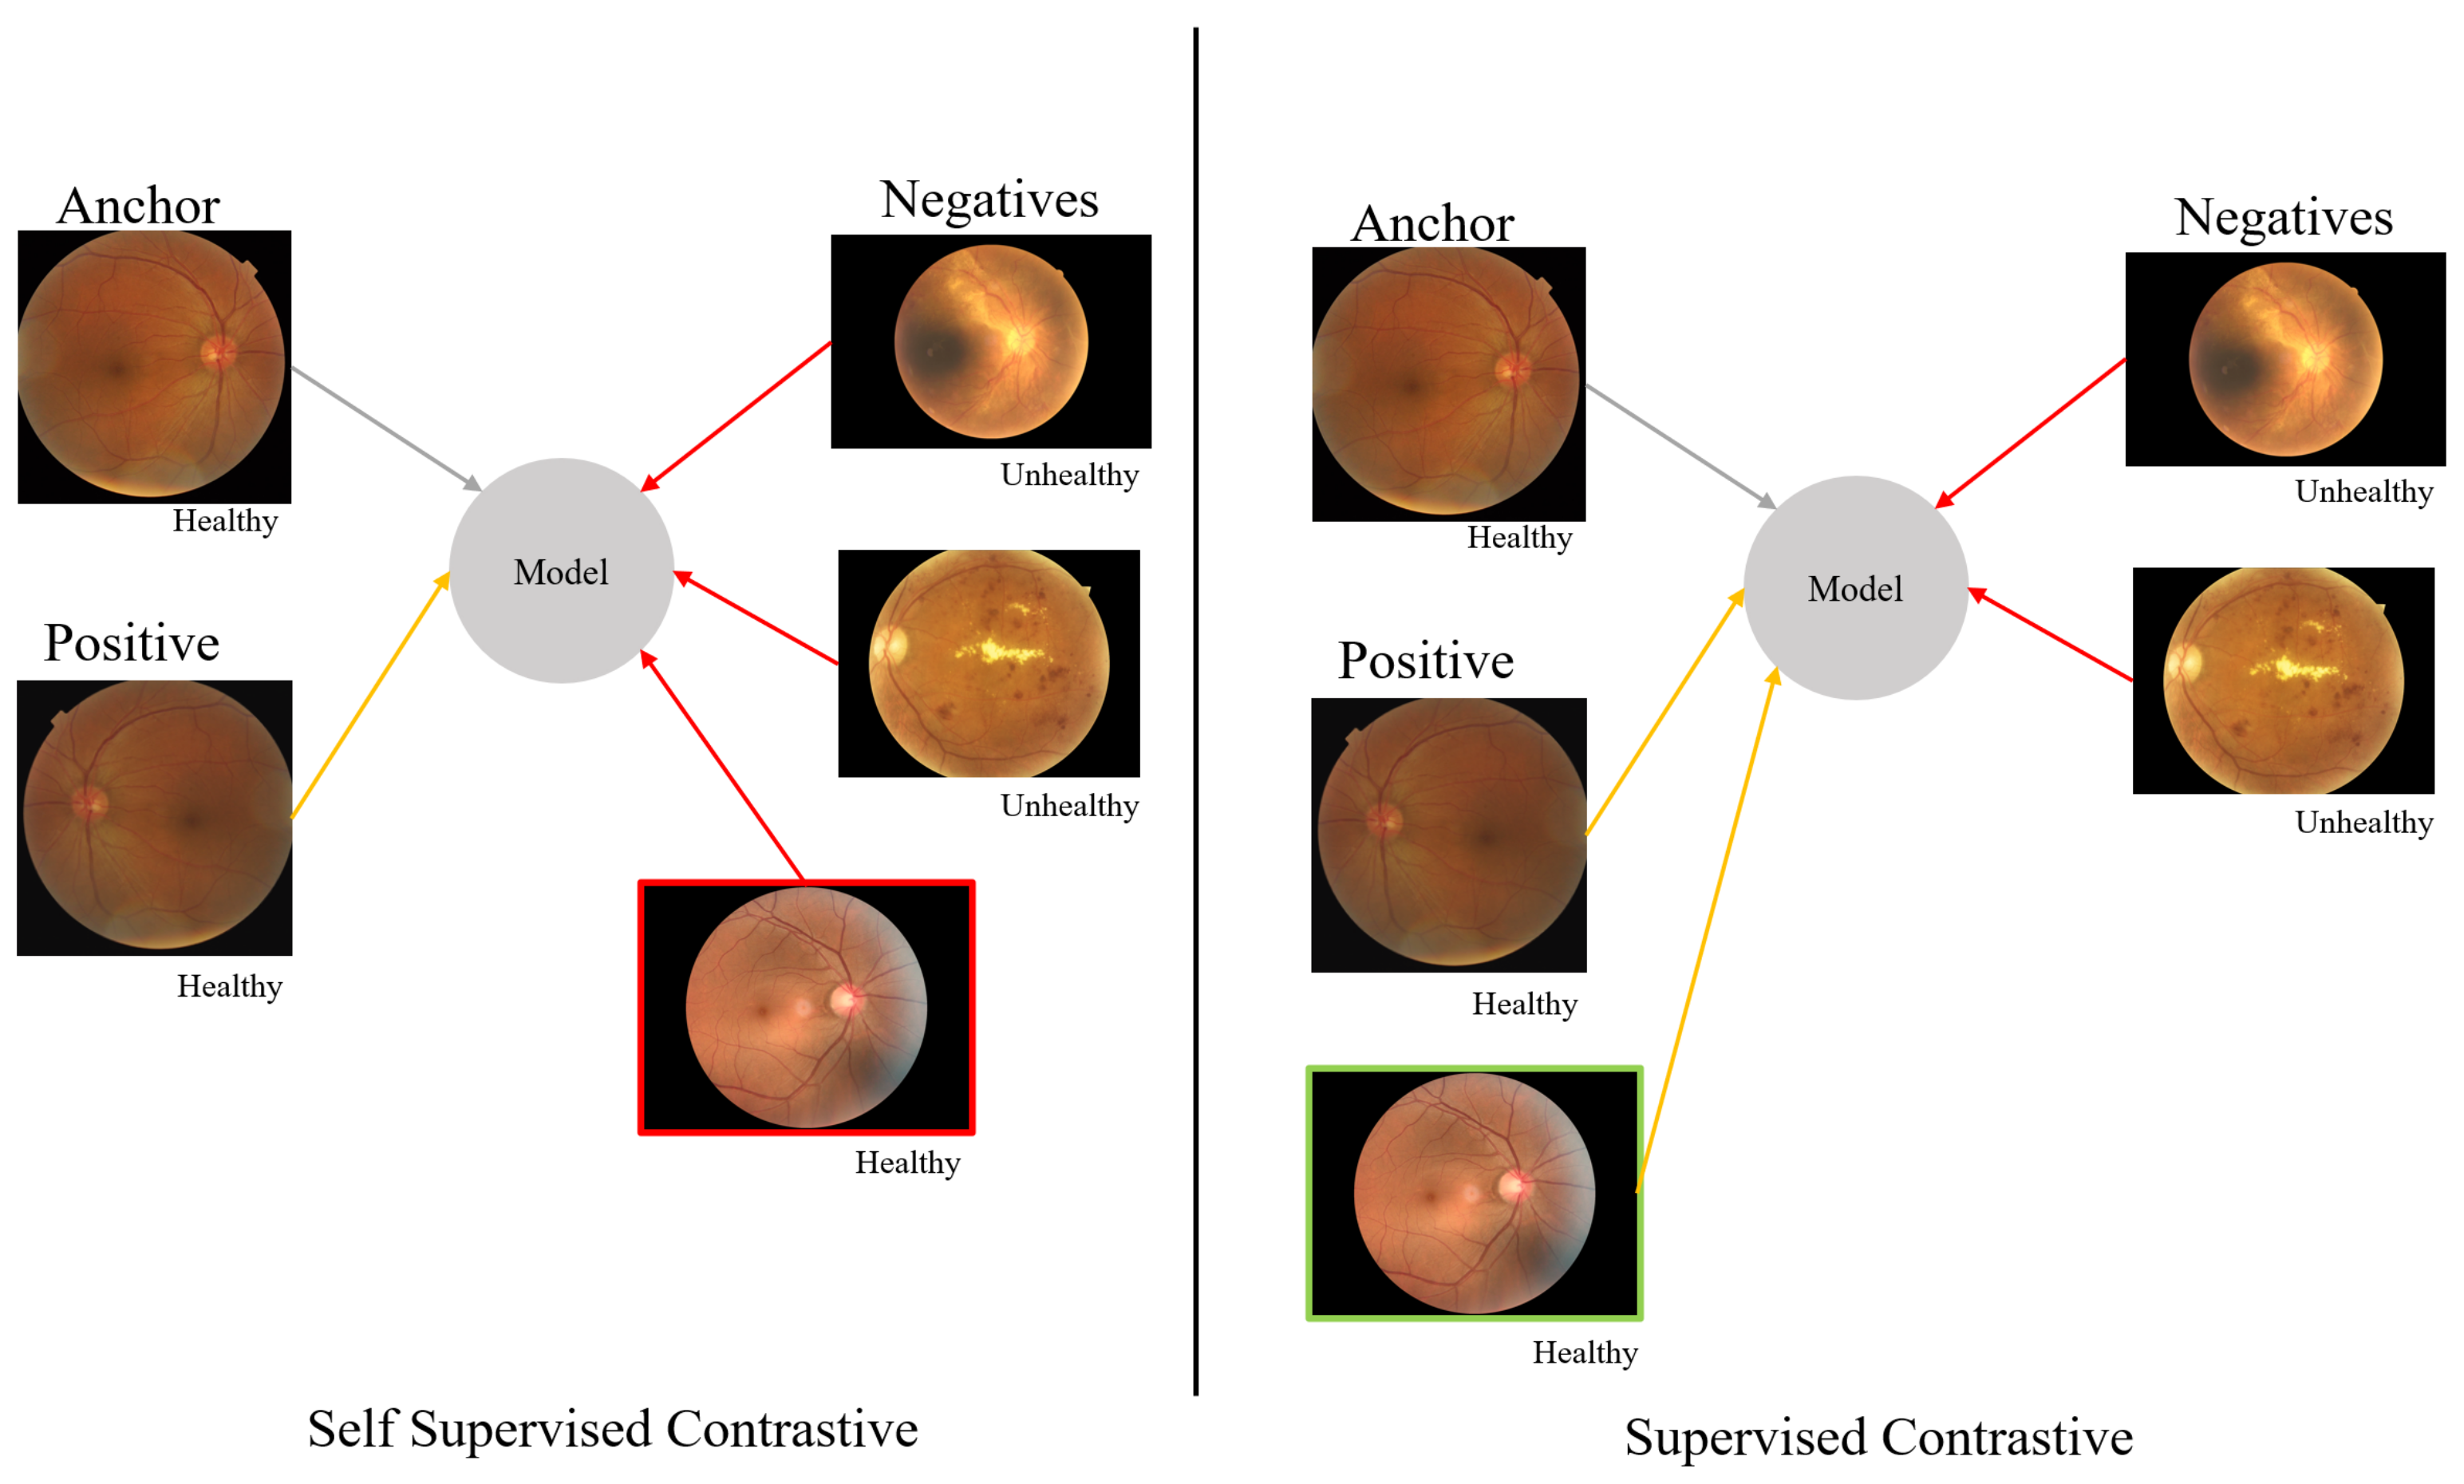
Contrastive learning aims to find similar and dissimilar patterns for a machine learning model. Using this approach, a machine learning model can be trained to distinguish between similar and dissimilar images and classify them. If there are not any labels or only weak labels for the images in the dataset, contrastive self-supervised learning [29], which can be effectively used to learn the data, is applied to build the model. If there are labels for all the images in the dataset, supervised contrastive learning is the proper method to build the model. The difference between contrastive self-supervised learning and supervised contrastive learning is shown in Figure 2. Contrastive self-supervised learning considers a single positive sample, such as an augmented version of the instance, and regards the remainder instances as negative samples. The model represents each instance in a unique and representative way. However, it may not be helpful enough for classification. Supervised contrastive learning considers not only the augmented version but also the instances from same class as positive samples, and the remainder constructs the negative set. This means the model represents the data into a feature space where instances from same class are closer than in contrastive self-supervised learning. Therefore, the model performs better in the classification problem.

3.2.3. Supervised Contrastive Loss

In supervised contrastive learning, supervised contrastive loss is used in the pretraining stage. The convolutional layers, which extract the features from instances, are trained. Then, the fully connected layers are finetuned in the classification stage. In this paper, the model of the pretraining stage started from the transfer model, which was trained on the ImageNet dataset. Transfer learning accelerates the convergence of the model and has the potential to improve the performance. In supervised learning, the model started from the same transfer model as the supervised contrastive learning used in the pretraining stage. This is the loss function:
L o u t s u p = i I L o u t , i s u p = i I 1 P ( i ) p P ( i ) l o g e x p ( z i T z i / τ ) a A ( i ) e x p ( z i T z a / τ ) ,
where z i is the projection vector of instance i from the network, τ is a scalar temperature parameter, and P ( i ) is the set of indices of all positive instances. A ( i ) is all instances except i.

3.3. Work Flow

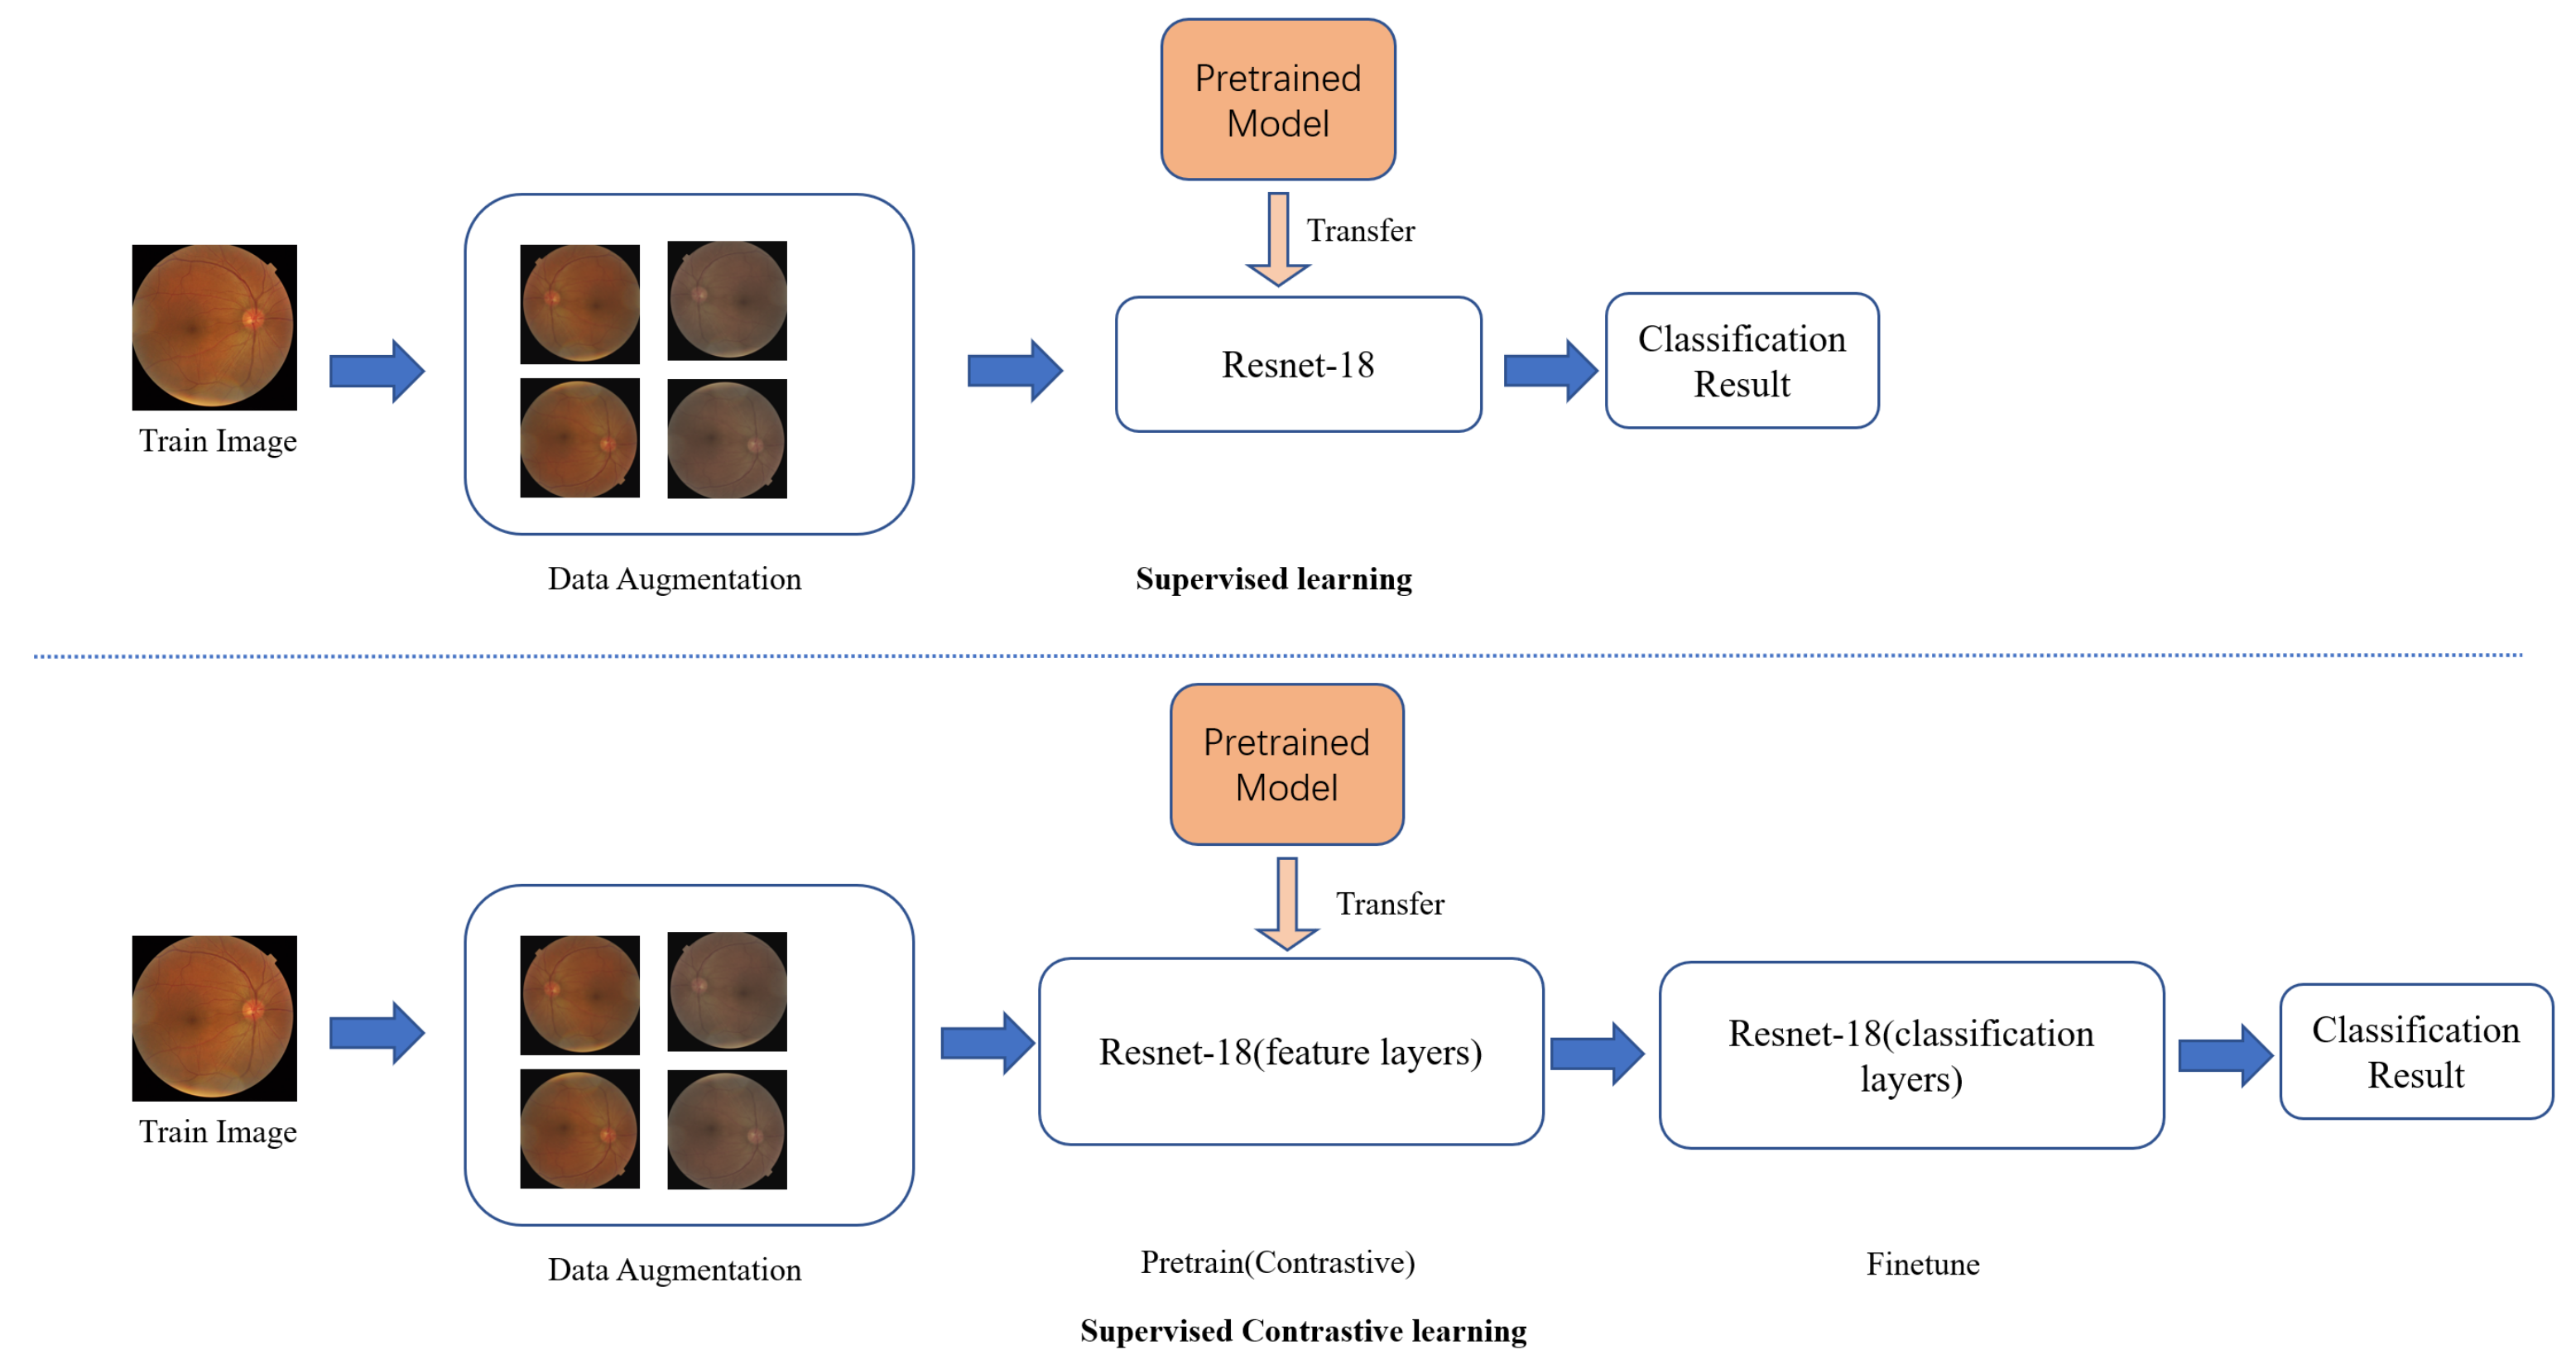
Figure 3 shows the work flow of our research. In supervised learning, the training images were resized and augmented. Then the model, pretrained on the Image-Net dataset, was transferred and finetuned by the training images. In supervised contrastive learning, the training images were resized and augmented in same way. Then the feature layers of the transfer model were used to pretrain in the contrastive learning method. Finally, the feature layers were frozen, and the classification layers were finetuned.

4. Results

The robustness of the different models was measured by the standard deviations of the performances for the classification model in the various situations. Because the instance number of each class was balanced in our dataset, the accuracy was sufficient to measure the performance of the model.

4.1. Training Processes

We programmed the algorithm in Python 3.7. All the experiments were conducted on a Linux system with 8 * Tesla V100 32G GPU. Additionally, pytorch-1.10.0 was used to build the deep learning model.

4.2. Testing Processes

4.2.1. Robustness and Accuracy with Different Learning Rates

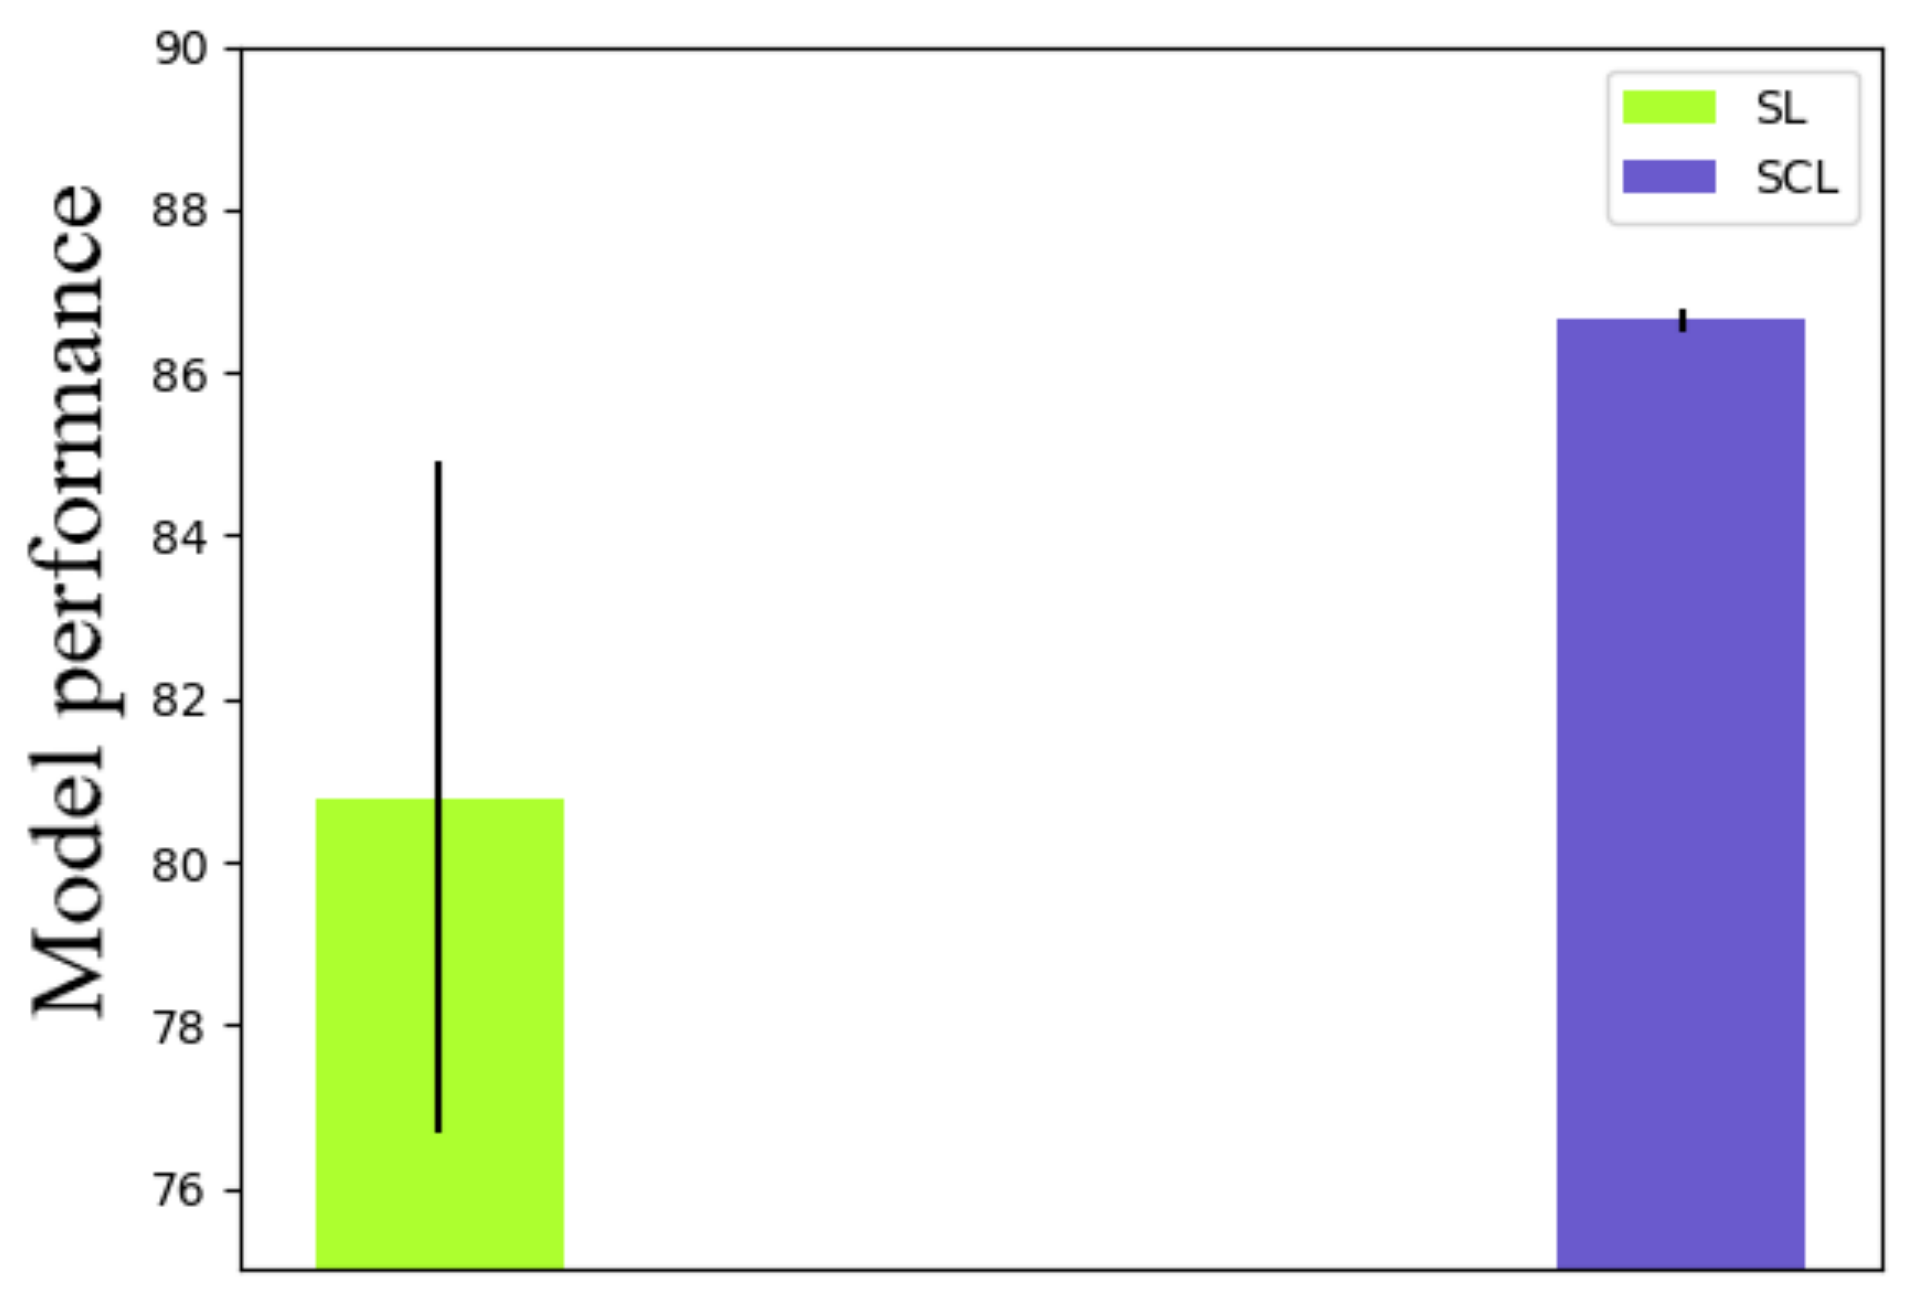
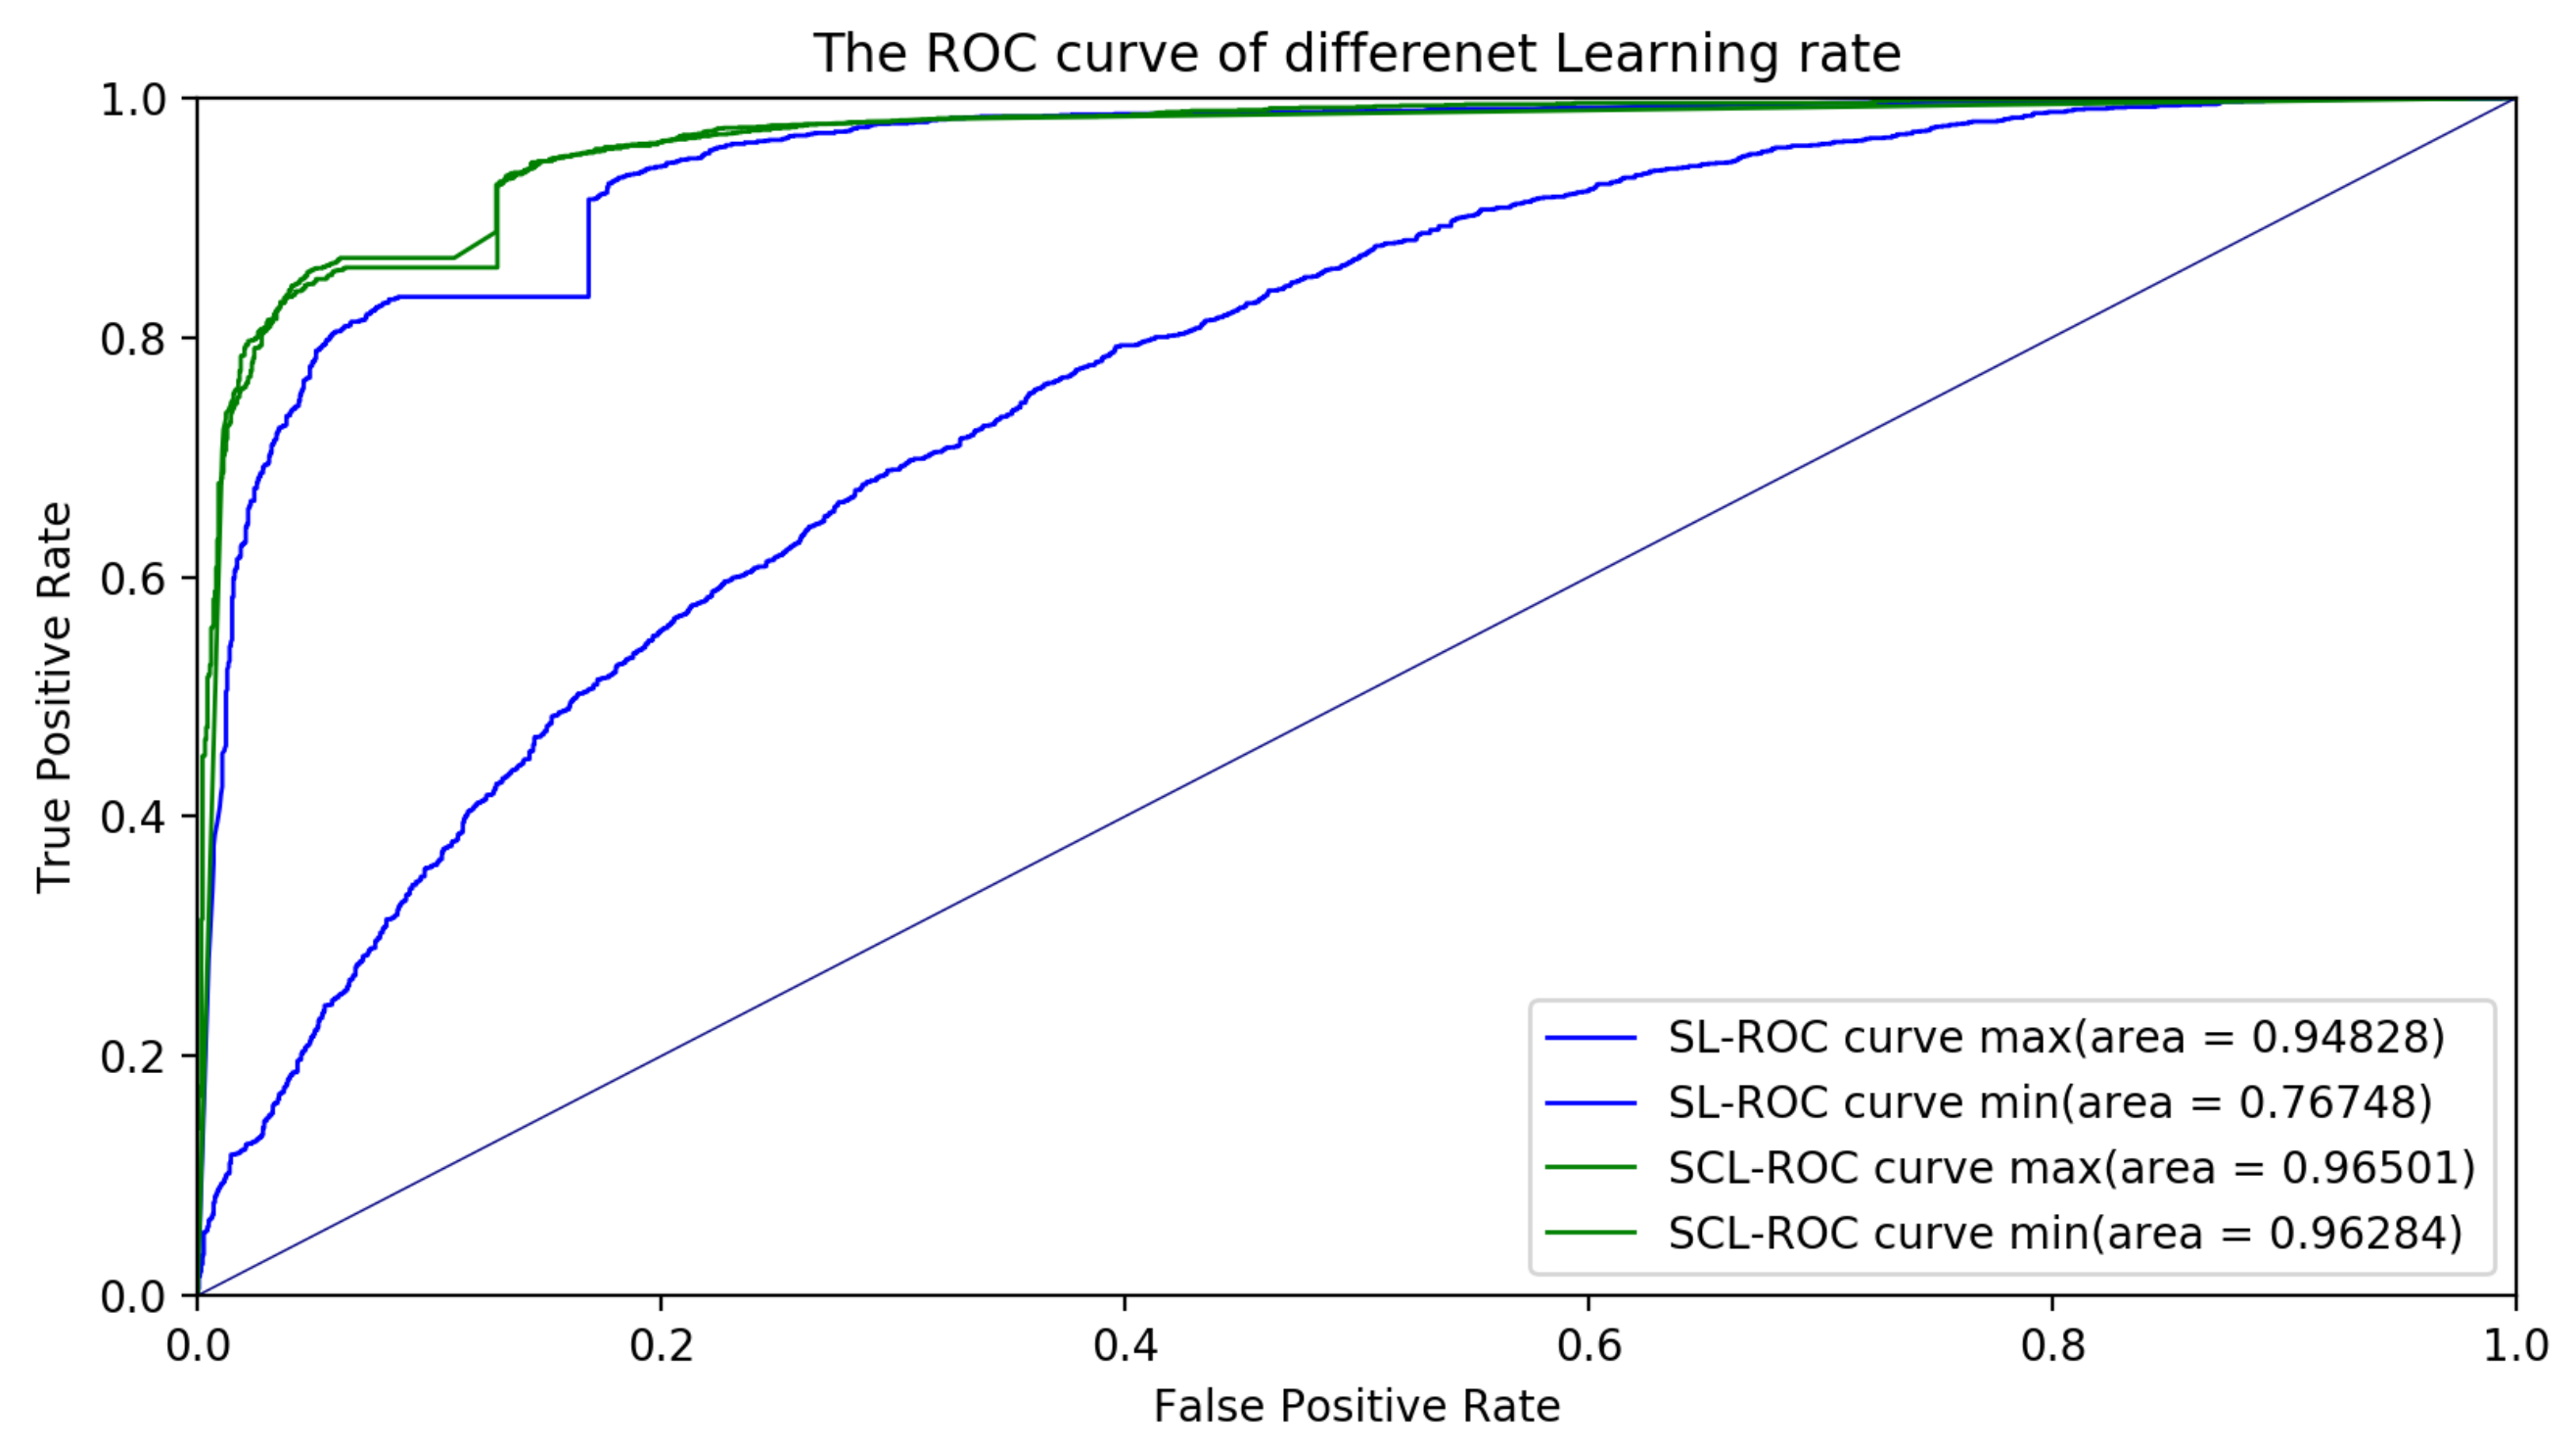
Firstly, we tested the robustness of the method with different learning rates. Nine different learning rates were applied to both the supervised learning (SL) and supervised contrastive learning (SCL). Details of the validation results are shown in Table 2 and Figure 4. As shown in Table 2 and Figure 4, the standard deviation of the SL was 4.11, while that of the SCL was 0.15. Therefore, the robustness of the SCL with different learning rates was better than the SL. Moreover, the mean accuracy of the SL was 80.79, while that of the SCL was 86.64. The SCL was more stable and had better performance than the SL with different learning rates. Additionally, other learning rates such as 0.3, 0.5, or 0.00001 were also tested. However, the models had either overfitting or underfitting. Therefore, the results of these learning rates were not considered in robustness measurement. The receiver operator characteristic (ROC) curve was plotted to comprehensively evaluate the performance of these classification models. The ROC curve showed the tradeoff between the sensitivity (true positive rate) and the specificity (1-false positive rate). The classification model that had a curve closer to the top-left corner indicated a better performance. In order to compare the different classification models, the area under the ROC curve (AUC), which summarizes the performance of curve into a single value, was proposed. The results of the ROC curves and AUC values in Figure 5 indicate that the classification model with the SCL was more robust and powerful than the classification model with the SL for different learning rates. For a given threshold, the sensitivity and specificity of the model can be calculated. The sensitivity of the SL for different learning rates was 76.25 % ± 10.09 % , while that for the SCL, for different learning rates, was 86.24 % ± 0.56 % . The specificity of the SL for different learning rates was 76.42 % ± 9.48 % , while that for the SCL, for different learning rates, was 88.00 % ± 1.32 % .

4.2.2. Robustness with Different Data Augmentation Methods

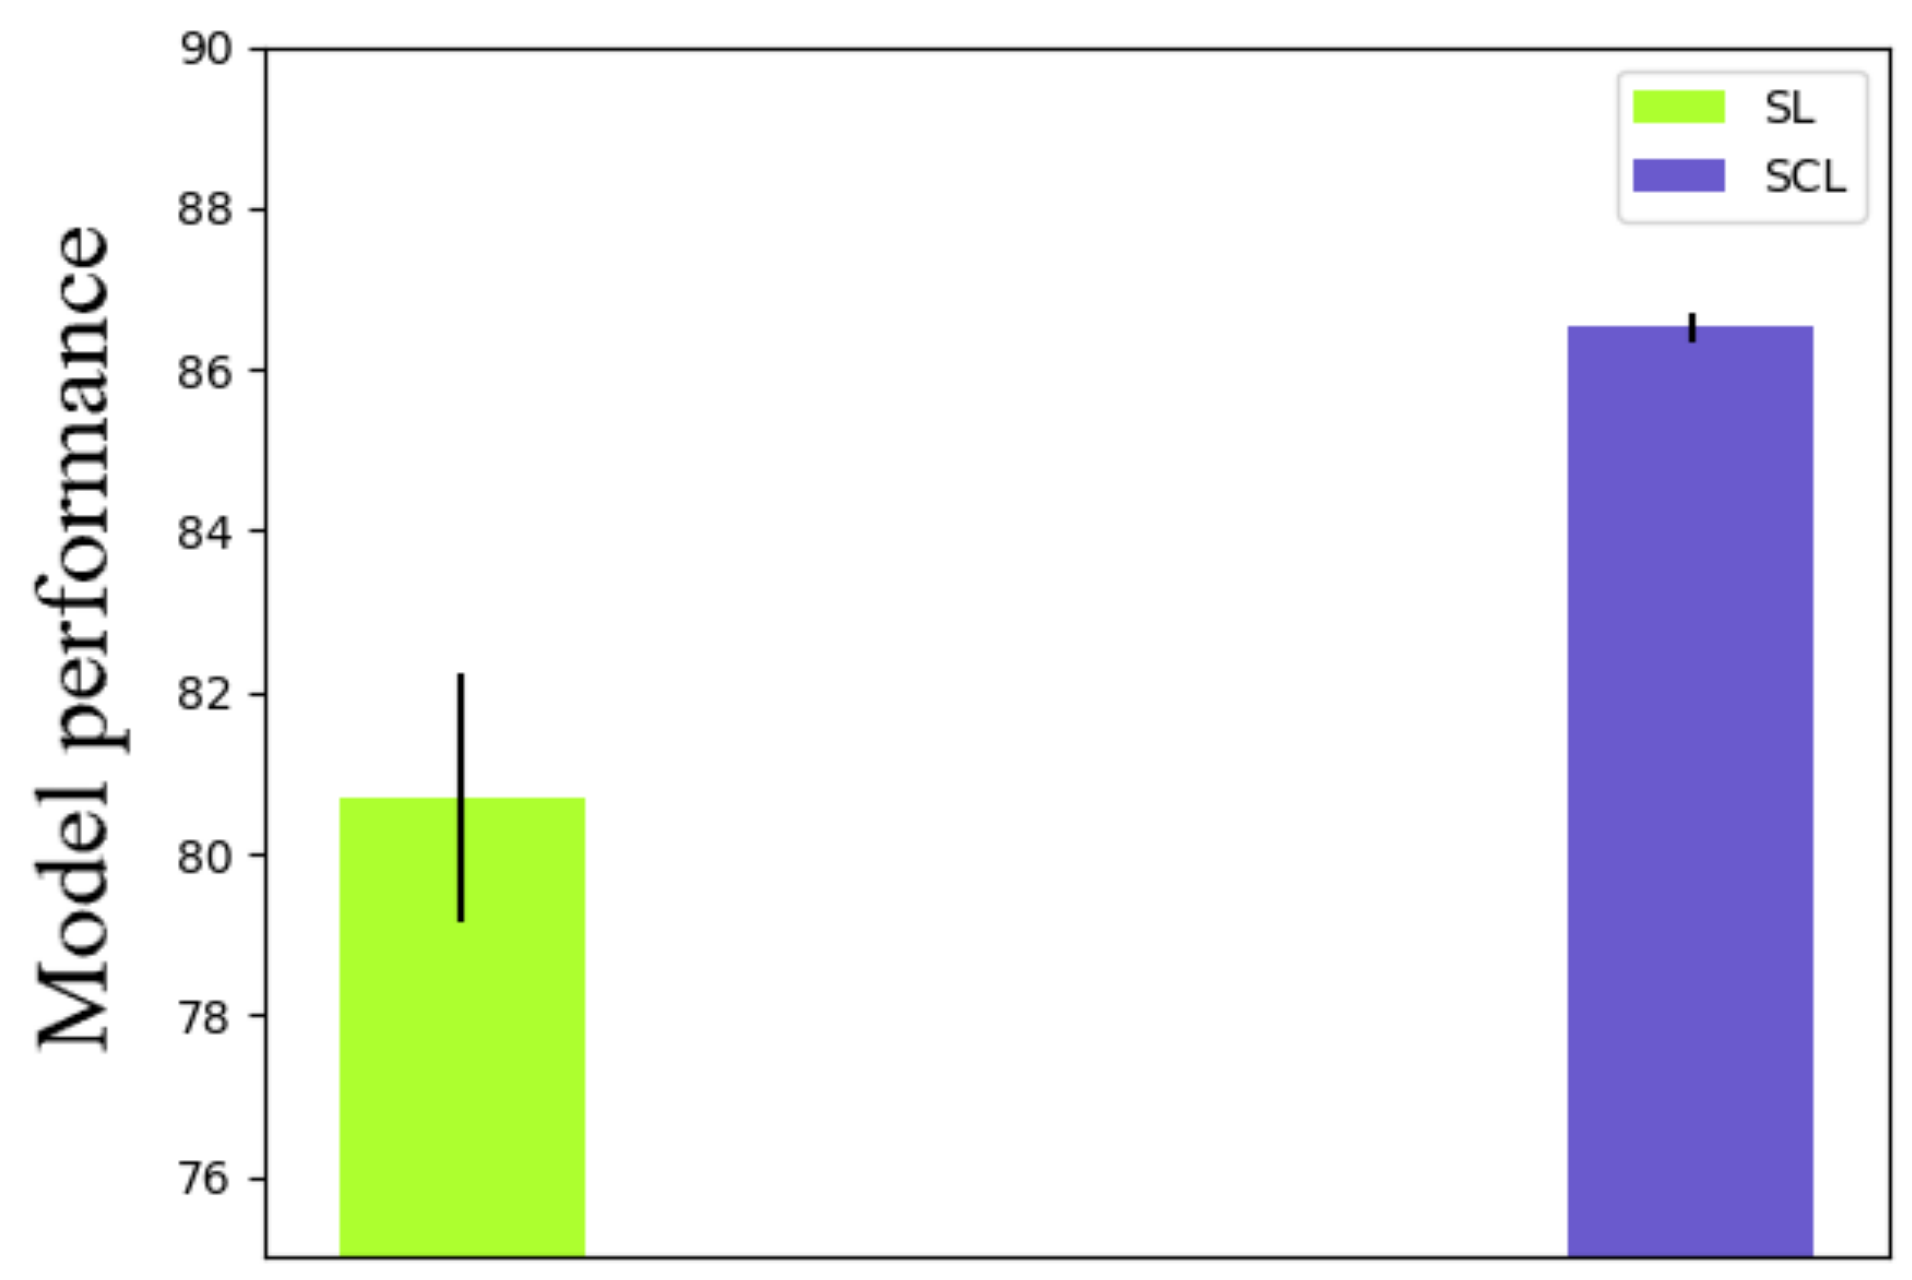
Further, we investigated the robustness of the method with different combinations of data augmentation methods. Random horizontal flip, random vertical flip, random rotation, and color jitter were elected. Nine kinds of combinations were applied to both the supervised learning (SL) and supervised contrastive learning (SCL). Details of the validation results are shown in Table 3 and Figure 6. As shown in Table 3 and Figure 6, besides the combination of methods, different rotation rates were also considered. The standard deviation of the SL was 1.53, while that of the SCL was 0.18. Therefore, the robustness of the SCL with different learning rates was better than the SL. Moreover, the mean accuracy of the SL was 80.68, while that of the SCL was 86.53. The SCL outperformed the SL again with different data augmentation methods.
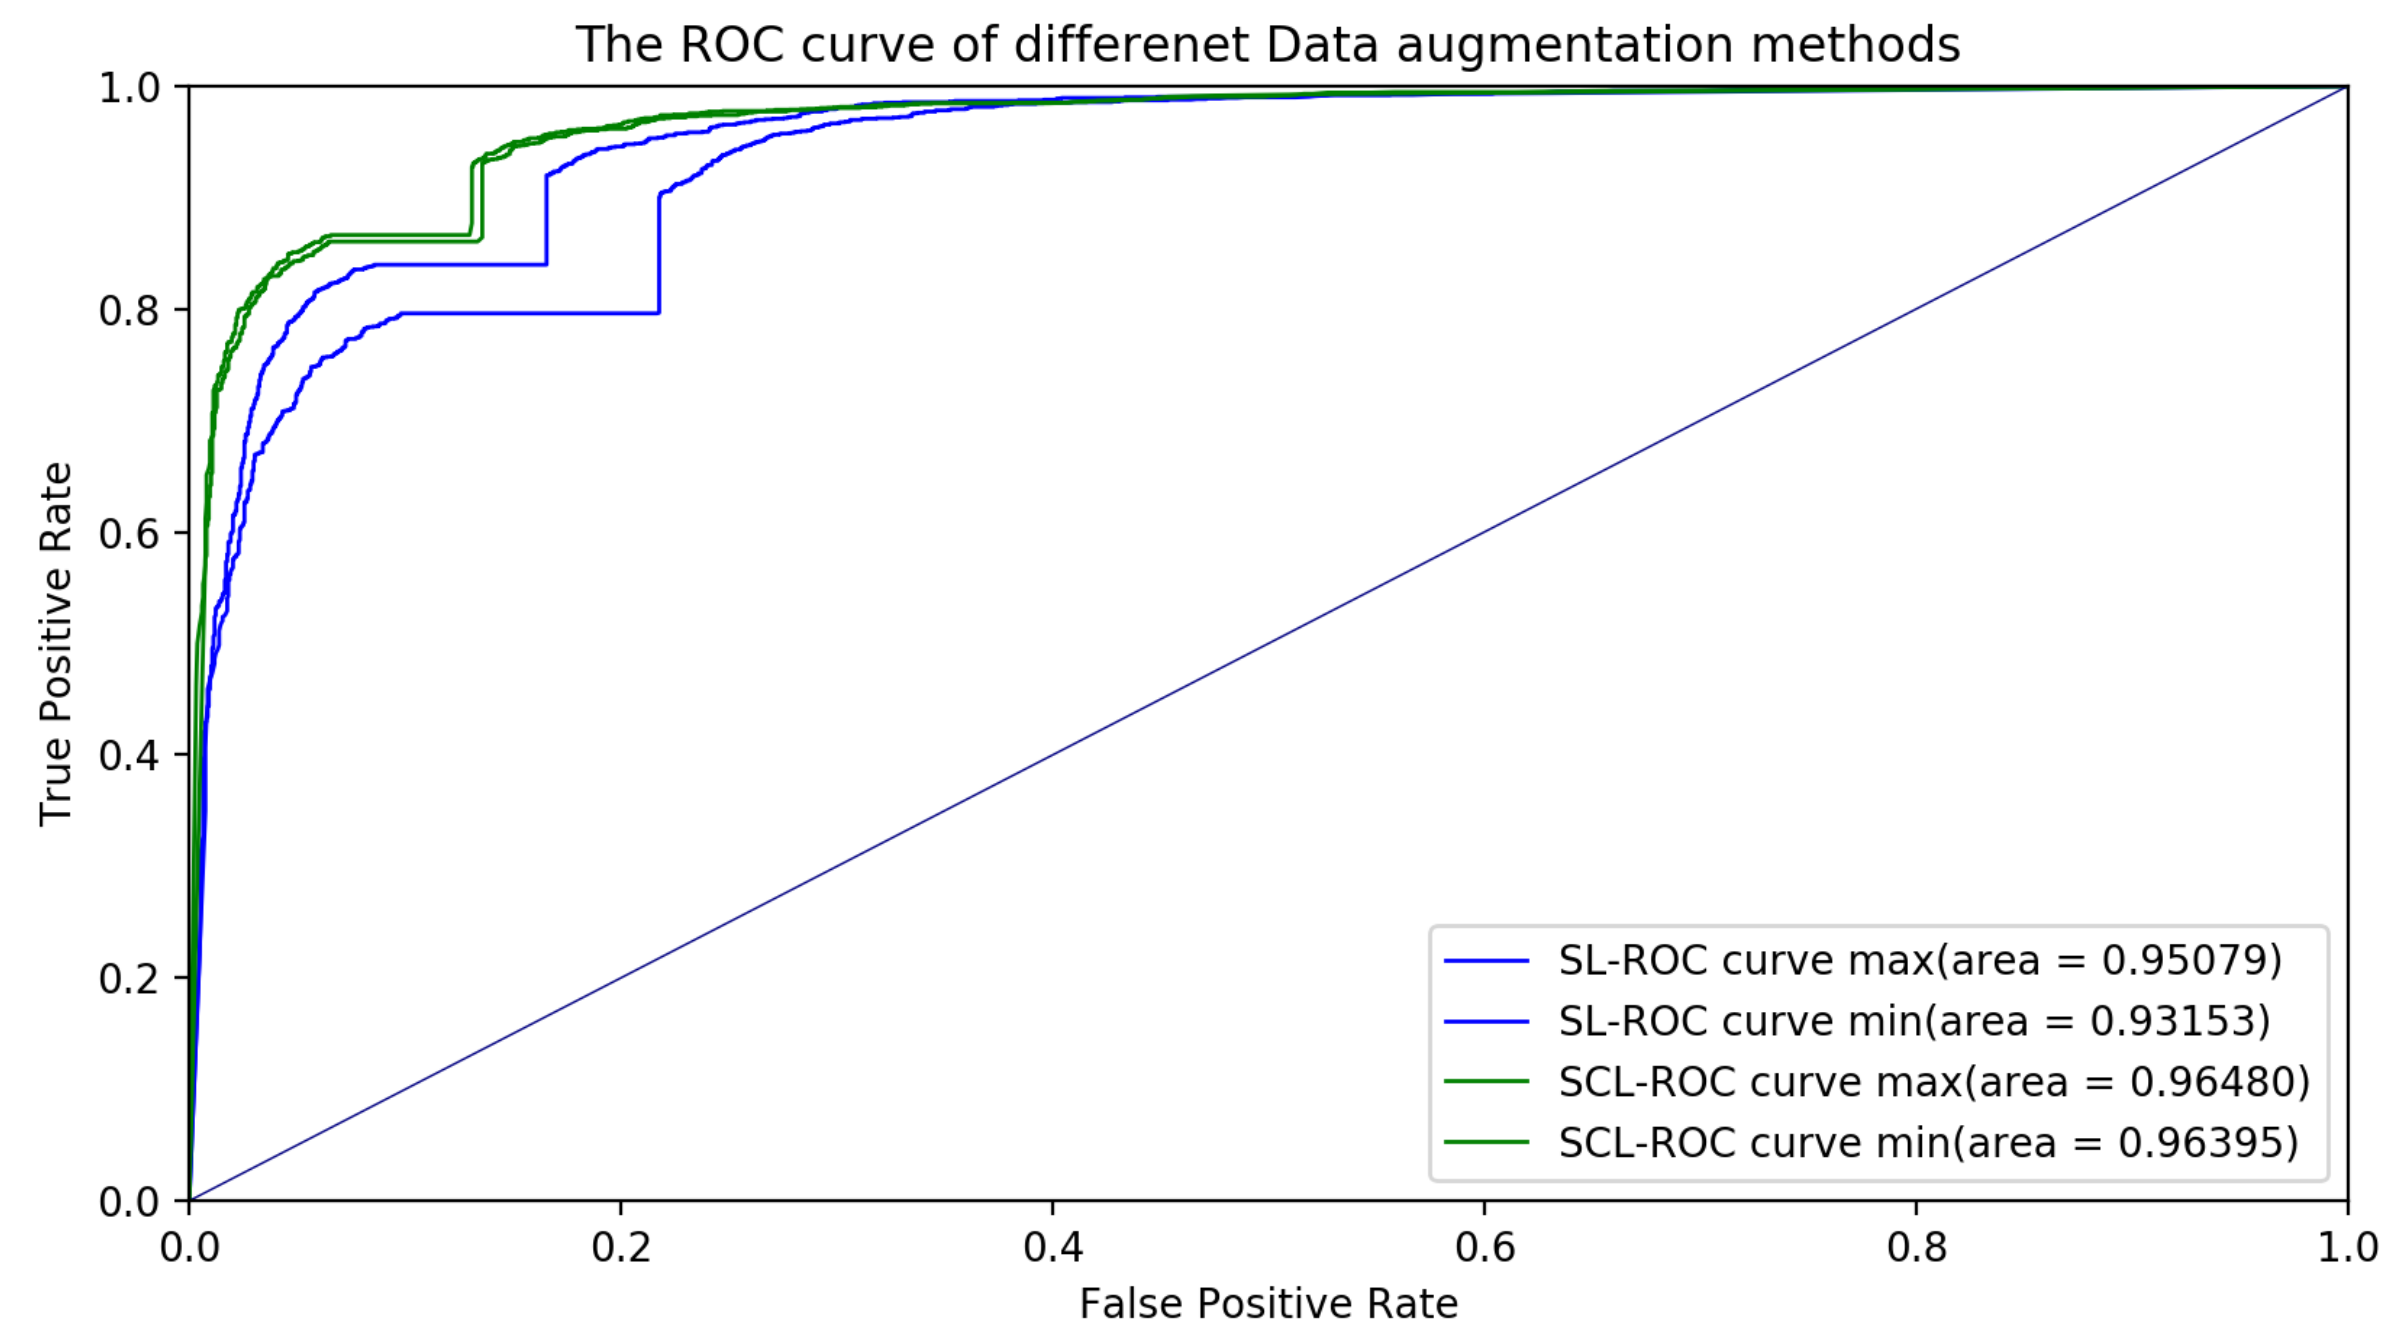
We also plotted the ROC curves and AUC values for the classification models with the SCL and SL for different data augmentation methods in Figure 7. The testing results indicated that the classification model with the SCL was better than the classification model with the SL. For a given threshold, the sensitivity and specificity of the model can be calculated. The sensitivity of the SL for the different data augmentation methods was 81.82 % ± 3.05 % , while that of the SCL for the different data augmentation methods was 86.53 % ± 0.15 % . The specificity of the SL for the different data augmentation methods is 80.84 % ± 3.69 % , while that of the SCL for the different data augmentation methods was 86.72 % ± 0.41 % .

4.2.3. Discussion

The binary classification model, which distinguishes the diabetic retinopathy images from normal images, was suitable for building the rapid screening system. The robustness of model is a key performance index for a medical screening system. Our test results shown in Section 4.2.1 and Section 4.2.2 indicated that the contrastive classification model for diabetic retinopathy was more robust than the traditional model.
In the rapid screening system for diabetic retinopathy, the diabetic retinopathy images and the normal images were considered as the similar within the classes and dissimilar between the classes, respectively. The proposed contrastive classification model learned the representations of the fundus images with the rules that simultaneously maximized the agreement between similar images and maximized the disagreement between dissimilar images. In contrastive learning, the representations for the same type of samples were more compact, and the representations for the different type of samples were more discriminative. Hence, the model built by the contrastive learning method was more robust. The representations of the fundus images were learned from the unlabeled images and then fine-tuned with the labeled images. Our test results showed that the contrastive learning method was suitable for establishing a robust classification model for diabetic retinopathy.
In image classification, contrastive learning is primarily used for unsupervised or semi-supervised representation learning. Recently, the contrastive learning has been applied to build a supervised classification model and obtain high accuracy results. The supervised contrastive learning was used to classify product images [30], and it was also applied to build a classification model for underwater acoustic communication modulation [31]. The robustness of the supervised contrastive classification model was analyzed in [32]. The results in this work showed that the features learned by supervised contract learning were aggregated into different clusters separately. The supervised contrastive learning method can obtain more distinguishing features, in which the distance of samples with the same label is less, while the distance of samples with a different label is more. Thus, the boundary of the classification model can be more easily determined in the the supervised contrastive learning method, and the supervised contrastive learning obtains better robustness. Similar to [32], our results showed that we can build a robust classification model for diabetic retinopathy by using the supervised contrastive learning method.

5. Conclusions

In this paper, we compared the results of supervised contrastive learning (SCL) and supervised learning (SL) with different learning rates and data augmentation methods in diabetic retinopathy image classification. Large span learning rates, from 0.0001 to 0.1, were fully tested. Four kinds of data augmentation methods, including random horizontal flip, random vertical flip, random rotation, and color jitter, were selected. We validated the influences of different combinations and values of the above methods. The experimental results showed that the SCL had a higher mean accuracy than the SL with different hyperparameters. More importantly, the SCL was more robust than the SL. In medical classification, a robust system is more practical and valuable. Our work shows that the SCL is suitable for diabetic retinopathy binary classification. The proposed automatic classification model for diabetic retinopathy has the potential to be applied within the clinical decision support systems. In fact, some systems [33,34] have been successfully applied to aid in diagnosing diabetic retinopathy.
We validated the availability of the SCL for diabetic retinopathy binary classification on ResNet-18. More research on multiple classification and other kinds of deep models is expected. In the future, more experiments should be focused on multi-classification, which is closer to the real diagnosis. Furthermore, supervised contrastive learning also has the potential to increase the robustness of models in the medical image segmentation task.

Author Contributions

Conceptualization, X.F. and X.H.; methodology, S.Z. and X.H.; writing—original draft preparation, S.Z.; writing—review and editing, X.H. and L.X.; supervision, Y.C.; funding acquisition, Y.C. All authors have read and agreed to the published version of the manuscript.

Funding

This research was funded by the Chinese Academy of Medical Sciences Innovation Fund for Medical Sciences (2020-I2M-2-006).

Acknowledgments

We thank Nankai University for the fundus image dataset named DDR. This paper has benefited from the comments of the anonymous reviewers. X. Feng thanks J. Wang at the Department of Cardiology, Da Qing First Hospital, for the help with the project administration.

Conflicts of Interest

The authors declare no conflict of interest.

Abbreviations

The following abbreviations are used in this manuscript:
SLSupervised Learning
SCLSupervised Contrastive Learning

References

  1. A Diabetic Retinopathy Dataset. Available online: https://www.kaggle.com/c/diabetic-retinopathy-detection (accessed on 10 February 2022).
  2. Porwal, P.; Pachade, S.; Kamble, R.; Kokare, M.; Deshmukh, G.; Sahasrabuddhe, V.; Meriaudeau, F. Indian diabetic retinopathy image dataset (IDRiD): A database for diabetic retinopathy screening research. Data 2018, 3, 25. [Google Scholar] [CrossRef] [Green Version]
  3. Li, T.; Gao, Y.; Wang, K.; Guo, S.; Liu, H.; Kang, H. Diagnostic assessment of deep learning algorithms for diabetic retinopathy screening. Inf. Sci. 2019, 501, 511–522. [Google Scholar] [CrossRef]
  4. Zhou, Y.; Wang, B.; Huang, L.; Cui, S.; Shao, L. A benchmark for studying diabetic retinopathy: Segmentation, grading, and transferability. IEEE Trans. Med. Imaging 2020, 40, 818–828. [Google Scholar] [CrossRef] [PubMed]
  5. Decencière, E.; Zhang, X.; Cazuguel, G.; Lay, B.; Cochener, B.; Trone, C.; Gain, P.; Ordóñez-Varela, J.-R.; Massin, P.; Erginay, A.; et al. Feedback on a publicly distributed image database: The Messidor database. Image Anal. Stereol. 2014, 33, 231–234. [Google Scholar] [CrossRef] [Green Version]
  6. Oltu, B.; Karaca, B.K.; Erdem, H.; Özgür, A. A systematic review of transfer learning based approaches for diabetic retinopathy detection. arXiv 2021, arXiv:2105.13793. [Google Scholar] [CrossRef]
  7. Aswathi, T.; Swapna, T.R.; Padmavathi, S. Transfer Learning approach for grading of Diabetic Retinopathy. J. Phys. Conf. Ser. 2021, 1767, 012033. [Google Scholar] [CrossRef]
  8. Alyoubi, W.L.; Abulkhair, M.F.; Shalash, W.M. Diabetic retinopathy fundus image classification and lesions localization system using deep learning. Sensors 2021, 21, 3704. [Google Scholar] [CrossRef]
  9. Priyadharsini, C.; Jeyapriya, J.; Kannan, R.J.; Kumar, G.B.; Sakriki, T.P. Classification of Diabetic Retinopathy using Residual Neural Network. IOP Conf. Ser. Mater. Sci. Eng. 2020, 925, 012033. [Google Scholar] [CrossRef]
  10. AbdelMaksoud, E.; Barakat, S.; Elmogy, M. Diabetic retinopathy grading system based on transfer learning. arXiv 2020, arXiv:2012.12515. [Google Scholar] [CrossRef]
  11. Tian, L.; Ma, L.; Wen, Z.; Xie, S.; Xu, Y. Learning discriminative representations for fine-grained diabetic retinopathy grading. In Proceedings of the 2021 International Joint Conference on Neural Networks (IJCNN), Shenzhen, China, 18–22 July 2021; pp. 1–8. [Google Scholar]
  12. Zhao, Z.; Zhang, K.; Hao, X.; Tian, J.; Chua, M.C.H.; Chen, L.; Xu, X. Bira-net: Bilinear attention net for diabetic retinopathy grading. In Proceedings of the 2019 IEEE International Conference on Image Processing (ICIP), Taipei, Taiwan, 22–25 September 2019; pp. 1385–1389. [Google Scholar]
  13. Quellec, G.; Al Hajj, H.; Lamard, M.; Conze, P.H.; Massin, P.; Cochener, B. ExplAIn: Explanatory artificial intelligence for diabetic retinopathy diagnosis. Med. Image Anal. 2021, 72, 102118. [Google Scholar] [CrossRef]
  14. De La Torre, J.; Valls, A.; Puig, D.; Romero-Aroca, P. Identification and visualization of the underlying independent causes of the diagnostic of diabetic retinopathy made by a deep learning classifier. arXiv 2018, arXiv:1809.08567. [Google Scholar]
  15. Reguant, R.; Brunak, S.; Saha, S. Understanding inherent image features in CNN-based assessment of diabetic retinopathy. Sci. Rep. 2021, 11, 9704. [Google Scholar] [CrossRef] [PubMed]
  16. Wu, D.; Liu, S.; Ban, J. Classification of Diabetic Retinopathy Using Adversarial Training. IOP Conf. Ser. Mater. Sci. Eng. 2020, 806, 012050. [Google Scholar] [CrossRef]
  17. Zhao, Z.; Chopra, K.; Zeng, Z.; Li, X. Sea-Net: Squeeze-and-excitation attention net for diabetic retinopathy grading. In Proceedings of the 2020 IEEE International Conference on Image Processing (ICIP), Abu Dhabi, United Arab Emirates, 25–28 October 2020; pp. 2496–2500. [Google Scholar]
  18. Liu, Y.P.; Li, Z.; Xu, C.; Li, J.; Liang, R. Referable diabetic retinopathy identification from eye fundus images with weighted path for convolutional neural network. Artif. Intell. Med. 2019, 99, 101694. [Google Scholar] [CrossRef] [PubMed]
  19. Bodapati, J.D.; Shaik, N.S.; Naralasetti, V. Deep convolution feature aggregation: An application to diabetic retinopathy severity level prediction. Signal Image Video Process. 2021, 15, 923–930. [Google Scholar] [CrossRef]
  20. Tariq, H.; Rashid, M.; Javed, A.; Zafar, E.; Alotaibi, S.S.; Zia, M.Y.I. Performance analysis of deep-neural-network-based automatic diagnosis of diabetic retinopathy. Sensors 2021, 22, 205. [Google Scholar] [CrossRef]
  21. Chen, H.; Zeng, X.; Luo, Y.; Ye, W. Detection of diabetic retinopathy using deep neural network. In Proceedings of the 2018 IEEE 23rd International Conference on Digital Signal Processing (DSP), Shanghai, China, 19–21 November 2018. [Google Scholar]
  22. Nneji, G.U.; Cai, J.; Deng, J.; Monday, H.N.; Hossin, M.A.; Nahar, S. Identification of diabetic retinopathy using weighted fusion deep learning based on dual-channel fundus scans. Diagnostics 2022, 12, 540. [Google Scholar] [CrossRef]
  23. Wang, Z.; Yin, Y.; Shi, J.; Fang, W.; Li, H.; Wang, X. Zoom-in-net: Deep mining lesions for diabetic retinopathy detection. In Proceedings of the International Conference on Medical Image Computing and Computer-Assisted Intervention, Quebec City, QC, Canada, 11–13 September 2017; pp. 267–275. [Google Scholar]
  24. Li, X.; Hu, X.; Yu, L.; Zhu, L.; Fu, C.W.; Heng, P.A. CANet: Cross-disease attention network for joint diabetic retinopathy and diabetic macular edema grading. IEEE Trans. Med. Imaging 2019, 39, 1483–1493. [Google Scholar] [CrossRef] [Green Version]
  25. He, A.; Li, T.; Li, N.; Wang, K.; Fu, H. CABNet: Category attention block for imbalanced diabetic retinopathy grading. IEEE Trans. Med. Imaging 2020, 40, 143–153. [Google Scholar] [CrossRef]
  26. Pires, R.; Avila, S.; Wainer, J.; Valle, E.; Abramoff, M.D.; Rocha, A. A data-driven approach to referable diabetic retinopathy detection. Artif. Intell. Med. 2019, 96, 93–106. [Google Scholar] [CrossRef]
  27. Jiang, H.; Yang, K.; Gao, M.; Zhang, D.; Ma, H.; Qian, W. An interpretable ensemble deep learning model for diabetic retinopathy disease classification. In Proceedings of the 2019 41st Annual International Conference of the IEEE Engineering in Medicine and Biology Society (EMBC), Berlin, Germany, 23–27 July 2019; pp. 2045–2048. [Google Scholar]
  28. Wan, S.; Liang, Y.; Zhang, Y. Deep convolutional neural networks for diabetic retinopathy detection by image classification. Comput. Electr. Eng. 2018, 72, 274–282. [Google Scholar] [CrossRef]
  29. Jaiswal, A.; Babu, A.R.; Zadeh, M.Z.; Banerjee, D.; Makedon, F. A Survey on Contrastive Self-Supervised Learning. Technologies 2020, 9, 2. [Google Scholar] [CrossRef]
  30. Azizi, S.; Fang, U.; Adibi, S.; Li, J. Supervised Contrastive Learning for Product Classification. In ADMA 2022: Advanced Data Mining and Applications; Lecture Notes in Computer Science; Springer: Cham, Switzerland, 2022; Volume 13088, pp. 341–355. [Google Scholar]
  31. Gao, D.; Hua, W.; Su, W.; Xu, Z.; Chen, K. Supervised Contrastive Learning-Based Modulation Classification of Underwater Acoustic Communication. Wirel. Commun. Mob. Comput. 2022, 2022, 3995331. [Google Scholar] [CrossRef]
  32. Hu, C.; Wu, J.; Sun, C.; Yan, R.; Chen, X. Robust Supervised Contrastive Learning for Fault Diagnosis under Different Noises and Conditions. In Proceedings of the 2021 International Conference on Sensing, Measurement & Data Analytics in the Era of Artificial Intelligence (ICSMD), Nanjing, China, 21–23 October 2021; pp. 1–6. [Google Scholar]
  33. Romero-Aroca, P.; Valls, A.; Moreno, A.; Sagarra-Alamo, R.; Basora-Gallisa, J.; Saleh, E.; Baget-Bernaldiz, M.; Puig, D. A Clinical Decision Support System for Diabetic Retinopathy Screening: Creating a Clinical Support Application. Telemed. e-Health 2019, 25, 31–40. [Google Scholar] [CrossRef] [Green Version]
  34. Rossi, J.G.; Rojas-Perilla, N.; Krois, J.; Schwendicke, F. Cost-effectiveness of Artificial Intelligence as a Decision-Support System Applied to the Detection and Grading of Melanoma, Dental Caries, and Diabetic Retinopathy. JAMA Netw. Open 2022, 5, e220269. [Google Scholar] [CrossRef]
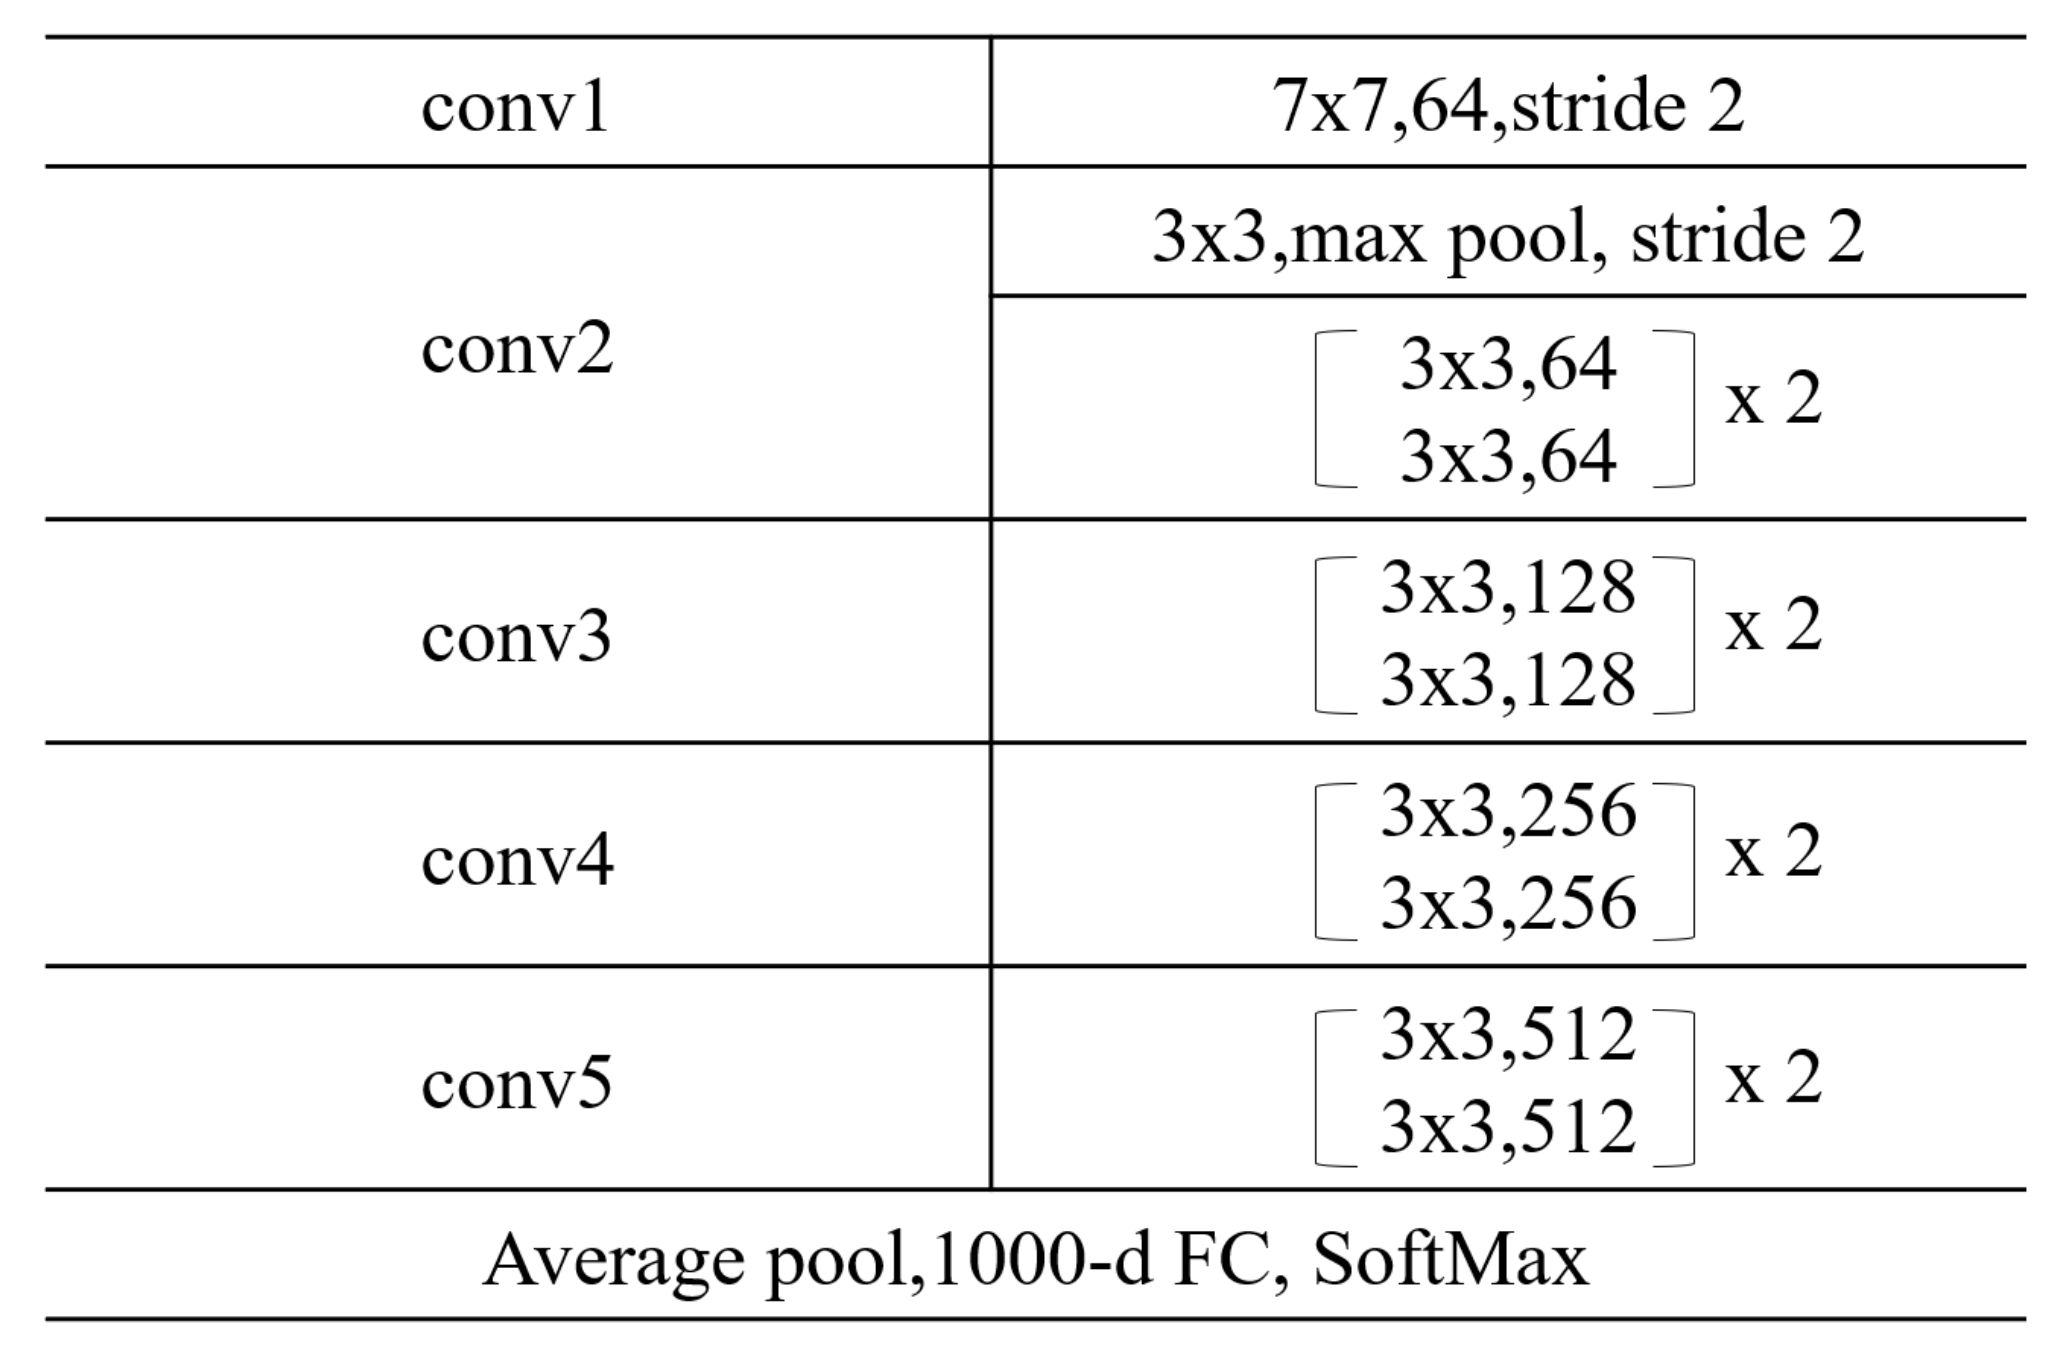
Figure 1. Structure of Res-Net18.
Applsci 12 12071 g001
Figure 2. Contrastive learning.
Applsci 12 12071 g002
Figure 3. Flow chart of the diabetic retinopathy classification model based on the contrastive learning method.
Applsci 12 12071 g003
Figure 4. Error bar of accuracies with different learning rates.
Applsci 12 12071 g004
Figure 5. ROC curves with different learning rates for the supervised learning (SL) and supervised contrastive learning (SCL). The ROC curve max and ROC curve min stand for the ROC curves with the maximum AUC value and minimum AUC value, respectively.
Applsci 12 12071 g005
Figure 6. Error bar of accuracies with different data augmentation methods.
Applsci 12 12071 g006
Figure 7. ROC curves with different data augmentation methods for the supervised learning (SL) and supervised contrastive learning (SCL). The ROC curve max and ROC curve min stand for the ROC curves with the maximum AUC value and minimum AUC value, respectively.
Applsci 12 12071 g007
Table 1. Related work. Binary classification includes a normal class (fundus images without diabetic retinopathy) and an abnormal class (fundus images with diabetic retinopathy). Multiple classification includes five classes (normal, mild, moderate, severe, and proliferative diabetic retinopathy).
BibliographyTaskDatasetModel
 [26]Binary ClassificationKaggleCNN
 [27]Binary ClassificationPrivate dataInception, ResNet
 [18]Binary ClassificationPrivate dataWP-CNN (weighted path
convolutional neural network)
 [23]Binary ClassificationKaggleZoom-in-Net
 [12]Multiple ClassificationKaggleBiRA-Net (bilinear attention net)
 [28]Multiple ClassificationKaggleAlexNet, VggNet, GoogleNet, ResNet
 [24]Multiple ClassificationIDRiDCANet (cross-disease attention network)
 [25]Multiple ClassificationDDRCABNet (category attention block net)
 [3]Multiple ClassificationDDRVGG-16, ResNet-18, GoogLeNet, DenseNet-121, SE-BN-Inception
 [19]Multiple ClassificationKaggleDenseNets
 [20]Multiple ClassificationPrivate dataAlexNet, GoogLeNet, Inception, ResNet
 [21]Multiple ClassificationEyePACSInception V3
 [22]Multiple ClassificationKaggleVGG-16
Table 2. Accuracy of the different learning rates. Supervised contrastive learning (SCL) and supervised learning (SL).
Learning RateSLSCL
0.000169.4286.45
0.000580.3386.48
0.00181.7786.51
0.00382.5986.51
0.00582.9186.66
0.0182.6386.74
0.0381.4786.8
0.0583.2686.74
0.183.0286.88
Table 3. Accuracy of different data augmentation methods.
Data Augmentation MethodsSLSCL
Random Horizontal Flip
Random Vertical Flip
Random Rotation (15 degree)
Color Jitter
82.6386.74
Random Horizontal Flip
Random Vertical Flip
79.4786.45
Random Horizontal Flip
Random Rotation (15 degree)
80.8386.39
Random Horizontal Flip
Color Jitter
79.4786.24
Random Vertical Flip
Random Rotation (15 degree)
79.2786.34
Random Vertical Flip
Color Jitter
80.8786.63
Random Rotation (15 degree)
Color Jitter
78.9186.51
Random Horizontal Flip
Random Vertical Flip
Random Rotation (5 degree)
Color Jitter
80.9986.71
Random Horizontal Flip
Random Vertical Flip
Random Rotation (25 degree)
Color Jitter
83.7186.77
Publisher’s Note: MDPI stays neutral with regard to jurisdictional claims in published maps and institutional affiliations.