Featured Application
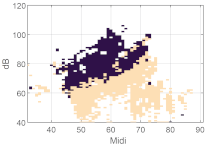
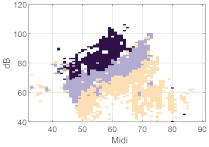
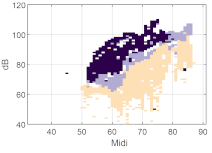
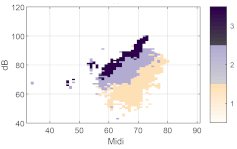
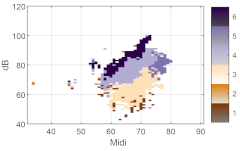
Categorical voice assessment based on a classification algorithm that can assist clinicians by visualizing phonation types on a 2-D voice map.
Abstract
For voice analysis, much work has been undertaken with a multitude of acoustic and electroglottographic metrics. However, few of these have proven to be robustly correlated with physical and physiological phenomena. In particular, all metrics are affected by the fundamental frequency and sound level, making voice assessment sensitive to the recording protocol. It was investigated whether combinations of metrics, acquired over voice maps rather than with individual sustained vowels, can offer a more functional and comprehensive interpretation. For this descriptive, retrospective study, 13 men, 13 women, and 22 children were instructed to phonate on /a/ over their full voice range. Six acoustic and EGG signal features were obtained for every phonatory cycle. An unsupervised voice classification model created feature clusters, which were then displayed on voice maps. It was found that the feature clusters may be readily interpreted in terms of phonation types. For example, the typical intense voice has a high peak EGG derivative, a relatively high contact quotient, low EGG cycle-rate entropy, and a high cepstral peak prominence in the voice signal, all represented by one cluster centroid that is mapped to a given color. In a transition region between the non-contacting and contacting of the vocal folds, the combination of metrics shows a low contact quotient and relatively high entropy, which can be mapped to a different color. Based on this data set, male phonation types could be clustered into up to six categories and female and child types into four. Combining acoustic and EGG metrics resolved more categories than either kind on their own. The inter- and intra-participant distributional features are discussed.
1. Introduction
By ear, humans can usually distinguish between different types of phonations. A voice can be perceived as ‘breathy,’ ‘tense,’ ‘hoarse,’ and so on. This is known in voice science as the phonation type. In some languages, phonation types are used as suprasegments to distinguish phonological meanings [1,2,3]. Phonation type is also used to express paralinguistic information, such as the creaky voice to express irritation in Vietnamese [4]. Such ‘phonation types’ are manifested by the shape of transglottal airflow modulated by the activation of the laryngeal muscles and respiratory efforts. Phonation types can be seen as distributed along one continuum from voiceless (no vocal fold contacting) to glottal closure (full vocal fold contacting) [5] and along at least one other continuum of the regularity of vibration. Sundberg [6] defined ‘phonation modes’ by the waveform and amplitude of vocal fold (VF) vibration.
In the practice of voice professionals, the subjectively perceived voice quality is still a reference standard for assessing outcomes. Quantitative metrics in isolation are weak at assessing changes in vocal status. This both encourages researchers to improve the metrics and suggests that the characterization of one phonation mode might become more specific if several metrics are collated. What we are trying to do here is to offer to voice professionals, e.g., speech clinicians or voice teachers, a representation of the quantitative and objective measurements of phonation type in a 2D and interactive way that they can relate to their practice.
1.1. Classifying Phonation Types
To classify phonation into various types, many metrics and methods have been tested. Those time domain or frequency domain metrics reflect attributes of airborne voice signals. Glottal inverse filtering (GIF) [7] is the estimate of flow waveforms; H1–H2 is the amplitude difference between the first and second harmonic proposed by Hillenbrand [8]; Gowda et al. [9] use low-frequency spectral density (LFSD) to distinguish breathy, modal, and pressed phonation; and so on.
The electroglottographic signal (EGG) is a method for representing the contacting of the vocal folds that is relatively low-cost and non-invasive, as compared to endoscopic imaging. Since the EGG signal can represent the changing contact area of the oscillating vocal folds, while neither impeding nor being much affected by the articulation, the EGG is often used to characterize phonatory behavior, sometimes as an ancillary diagnostic tool in clinical practice. A few EGG metrics have been widely used, such as the open quotient (OQ), the contact quotient (CQ), and the speed quotient (SQ). Additionally, some researchers used other signals such as neck surface acceleration [10]. However, the physiological interpretation of these metrics [11], that is, in what manner these artificially selected and defined metrics are correlated with the physiological structures or movements, is still incompletely described.
Some approaches successfully classify phonation types using multiple metrics combined with signal processing methods [12] and algorithms such as the Gaussian mixture model, random forests, DNN [7], or using classification on the EGG waveform itself [7,13]. Those models have shown better discrimination compared to the attempts that use one particular metric for detecting phonation types. However, the interpretation of some EGG metrics remains to be elaborated upon.
1.2. Definitions and Metrics
The basic concepts of voice mapping are presented by Ternström and Pabon [14]. Here, we briefly recapitulate an example of visually representing multiple metrics across the 2D voice field. Its dimensions are the fundamental frequency fo (horizontal axis, in semitones) and the signal level in dB (vertical axis, SPL re 20 µPa at 0.3 m), which serve as the two independent variables. Note that both axes are on a logarithmic scale. Each metric is represented as a scalar field or curved surface above the plane of SPL × fo and has the role of a dependent variable. In this study, all metrics were analyzed for voiced segments only, the criterion for voicing being that the autocorrelation of the acoustic signal at one cycle delay must exceed a threshold of 0.96.
The metric is sampled at integer values of semitones and decibels, i.e., in the ‘cells’ of the map. Each cell contains the average of the metric for all visits to that cell (Figure 1). Each metric is visualized on its own ‘layer’ in a multi-layer map. The six metrics selected for this example and for the present study are the following. The first three are metrics of the EGG signal, and the last three pertain to the acoustic signal.
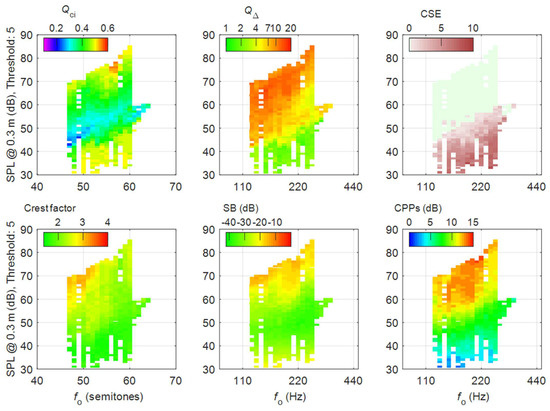
Figure 1.
Six layers of a voice map, each layer showing values of one metric, averaged per cell. In the top row are three EGG metrics, and in the bottom are three acoustic metrics. An amateur choir baritone sang messa di voce on the vowel /a:/, with increasing and decreasing SPL on tones spanning just over one octave. Data from Selamtzis and Ternström [15].
The quotient of contact by integration (Qci) is the area under the EGG pulse that has been normalized to 1 in both time and amplitude. The Qci was computed according to [16]. Like other metrics of the contact quotient, Qci can vary from nearly zero for a narrow EGG pulse to nearly 1 for a broad EGG pulse. The Qci thus represents the relative amount of contacting during a cycle. The exception is when the vocal folds are oscillating without contacting, in which case, the EGG becomes a low-amplitude sine wave, and so the area under the normalized pulse (Qci) approaches 0.5. This commonly happens in a soft and/or breathy voice.
The normalized peak derivative (Q∆) is the maximum derivative of an EGG signal; it represents the maximum rate of contacting during closure. Q∆ was computed as in [16]:
where T is the period length in integer samples, Ap−p is the peak-to-peak amplitude, and δmax is the largest positive difference observed over the period between two consecutive sample points in the discretized EGG signal. In phonation without vocal fold collision, the EGG becomes a low-amplitude sine wave. Hence, the minimum value that Q∆ can assume is the peak derivative of a normalized sine wave, which is 1.
The cycle-rate sample entropy (CSE) metric is low for a regular, self-similar signal and high when a signal is transient, erratic, or noisy. A threshold parameter is set to keep its value at zero when the phonation is stable, even with pitch changing. When something ‘abnormal’ happens, such as a voice break between falsetto and modal voice, the CSE peaks. CSE represents the cycle-to-cycle instability of the EGG waveform. The CSE was computed as described in [17].
The audio crest factor is computed as the ratio of the peak amplitude of the RMS amplitude for every phonatory cycle. It is a simple indicator of the relative high-frequency energy of the voice signal [18]. It increases with the abruptness of glottal excitation and is indirectly related to the maximum first derivative of glottal flow (the maximum flow declination rate, or mfdr). The crest factor is highest in a strong or creaky voice, with sparse transients in the glottal excitation, and high damping of the vocal tract resonances. This is typically the case at low fo and high SPL on open vowels, i.e., /a/. At all but the lowest signal-to-noise ratios, the crest factor is insensitive to noise. The crest factor is not meaningful in very resonant conditions when a vocal tract resonance frequency is closely matched by that of a harmonic.
The spectrum balance (SB) is here defined as the difference in the acoustic power level (dB) above 2 kHz and below 1.5 kHz.
The choice of 1.5 kHz was motivated by the desire to classify formants 1 and 2 of the vowel /a/ as part of the low band, even with female and child voices. The SB is indirectly related to the maximum second derivative of glottal flow [19]. The spectrum balance usually increases (becomes less negative) as the voice power output increases. It also increases when the relative amount of noise in the signal increases, regardless of whether that noise originates in the voice or in the audio chain.
The cepstral peak prominence smoothed (CPPs) is a measure of regular periodicity in the acoustic signal. The higher the CPPs, the more regularity and the less noise in the audio signal. The actual value of the CPPs is highly dependent on the setting of the smoothing parameters, and on the accurate selection of voiced non-fricated speech sounds. Here, the calculation of smoothed Cepstral Peak Prominence (CPPs) follows Awan et al. [20] (seven frames in time, 11 bins in quefrency), which gives lower values of the CPPs than in many other studies.
In summary, for both the acoustic and EGG signals, we have chosen two metrics, where the second is related to the time derivative of the first, and a third metric that represents the degree of the (ir-)regularity of the phonation.
1.3. Basis for Clustering
To explain our rationale for clustering, we first visualize how one of the metrics varies with SPL only. In the example of Figure 1, the ubiquitous upward trend with increasing fo happens to be close to linear (although this is not always the case). To simplify the visualization, we now factor out this dependency, so as to consider only the variation with SPL, or rather, with the new ‘fo-detrended’ SPL.Figure 2 shows this operation for the Q∆ metric (the normalized peak dEGG). It can be seen that in soft phonation (<65 dB adjusted SPL), the Q∆ metric is close to its minimum value of 1 (green), and as vocal fold collision sets in, it increases abruptly. If we were to map other metrics, they too are aligned intrinsically with the fo and SPL, but each metric varies differently in different regions of the voice map.
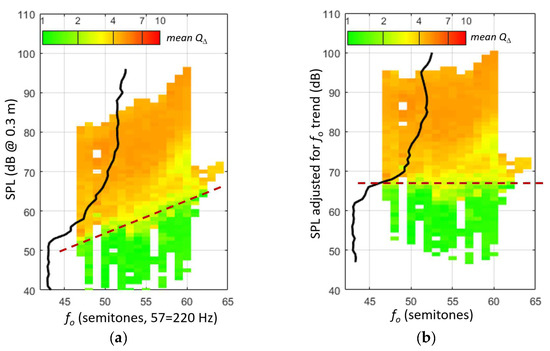
Figure 2.
(a) A map of an exemplary metric Q∆ (the per-cycle-normalized peak derivative of the EGG signal), typically skewed with increasing fo. The black line shows the average of Q∆ taken horizontally over all semitones. Its abscissa is the vertical SPL axis; its ordinate is on the horizontal color bar. (b) The same map with the dependency on fo was removed by adjusting the SPLs so as to make the dashed trend line horizontal. The increase in Q∆ is now more sharply focused, on the scale of adjusted SPL.
We now create a graph similar to the black curve in Figure 2 but of all the six metrics that are objects of the present study (Figure 3). Here, the six metrics have been brought to a suitable ratio scale or log scale and scaled to 0%…100% of their maximum expected range of variation in anticipation of statistical clustering. The metrics Qci and log10 (Q∆) are already in the range 0…1 and thus need no pre-scaling. For the following example, each metric has also been smoothed, with a 5 dB running average on the SPL axis.
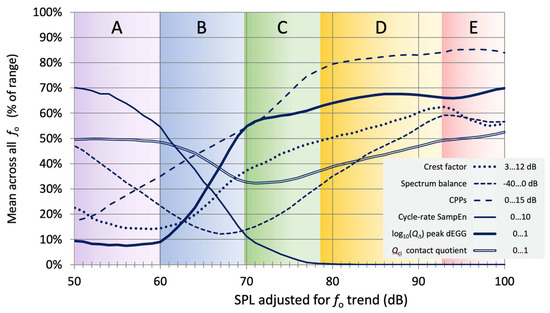
Figure 3.
Variation of six metrics over the SPL range shown in Figure 2. The broken lines refer to acoustic metrics and the solid lines to EGG metrics. The adjusted SPL axis can be visually divided into five subranges based on the metric values. Range A: soft phonation without vocal fold contact; B: transition zone where vocal fold contact sets in; C: ‘loose’ phonation but not entirely stable; D: ‘firm’ phonation with high stability; E: ‘hard’ phonation, approaching saturation in most metrics.
In Figure 3, five subranges can be qualitatively discerned on the axis of adjusted SPL, following a rationale that we will now discuss in detail. Consider first range A (50…60 dB), of very soft and breathy phonation. Here, the EGG cycle-rate sample entropy (CSE) is high, meaning that the EGG wave shape is unstable. The quotient of contact by integration (Qci) is 0.5 (50%) because there is no vocal fold contact; therefore, the EGG signal is of very low amplitude and the average EGG wave shape is sinusoidal, and thus the area under the normalized wave shape is 0.5. The spectrum balance (SB) is relatively high but descending, as the low-frequency band energy rises above some noise floor (which could be due to aspiration noise, low-level system noise, or both). The cepstral peak prominence smoothed (CPPs) is low, due to irregular vibration, noise, or both, but rises as the periodicity of the acoustic waveform gradually increases. The crest factor is low, indicating a lack of transients in the acoustic waveform. The normalized peak EGG derivative (Q∆) is at its minimum because there is no vocal fold contact.
Range B (60…70 dB) is a transition zone where vocal fold contact is setting in. This is most evident from the sharp rise in Q∆ and a fairly steep drop in CSE. Qci now drops from its uncontacted 50% state into a range with just a little contact in each cycle, about 30%. The SB reaches its minimum as the spectrum becomes more dominated by the fundamental partial. The CPPs continues to climb as phonation becomes more stable and less breathy. The crest factor is starting to increase.
Range C (70…79 dB) might be termed ‘loose’ phonation: the CSE is approaching zero, meaning that only a small instability remains in the EGG waveform; conversely, the CPPs is now picking up rapidly, indicating increased stability in the acoustic waveform. Qci is turning around and starts to rise as adduction increases. The (log of) Q∆, or the peak rate of contacting, has almost reached its maximum and will increase only slowly from here. The harmonic content of the acoustic signal is now increasing, as evidenced by a steady growth both in the SB and in the crest factor.
In range D (79…93 dB), phonation is ‘firm’ and stable. The CSE is zero, and the CPPs is near its maximum. The Qci continues to increase steadily, together with the SB and the crest factor, while the Q∆ has settled at a high value.
Finally, in range E (>93 dB), the acoustic metrics level out, or even reverse, in a manner that is reminiscent of spectral saturation [21]. Only Qci still manages to increase a little, implying a slight increase in adduction. This range might perhaps be called ‘hard’ phonation.
This example is intended to show how we might infer with some confidence the character of the phonation, even though we have access only to external signals and not to endoscopic imaging or internal aerodynamics. The changes with increasing SPL appear to comply consistently in all six metrics with the proposed phonatory scenarios, A to E. This particular example was chosen because in this task and with this subject, the fo dependency of most metrics was simple enough to be factored out by a linear transform. This is not generally the case: in most participants, when phonating over the larger range of the full voice range, the metrics exhibit considerable non-linear variation also with fo, which is challenging to visualize effectively. This is where clustering becomes useful, as we hope to demonstrate.
Clearly, the above observations suggest the possibility of classifying phonation types by clustering combinations of metrics. From A through E, those combinations have provided essential phonetic information. Though they will require independent physiological evidence for their validation, the different phonatory characters, when played back selectively, are also (informally) audible to the authors. The clustering of these six (and/or any other) metrics in combination will allow us to plot the outcomes not just along the SPL axis but across the 2D voice field, so as to also visualize dependencies on fo.
1.4. Problem Formulation
We now ask whether unsupervised learning can succeed at a partitioning of the voice range that can be motivated in terms of phonatory function, as we demonstrated here. We first examine the outcomes from the clustering algorithm for different values of the number k of clusters. Then, we compare the discriminatory power of the acoustic and EGG metrics separately and in combination. Lastly, we try to find an optimal cluster number k for the three groups of voices, i.e., men, women, and children in the present data set. A perceptual validation will be a necessary later step, but it is not part of the present study.
2. Methods
2.1. Data Acquisition
This retrospective study used data previously collected by Patel and Ternström [22], who describe the data acquisition in greater detail. In total, 22 pre-pubertal children (9 boys, 13 girls) aged 4–8 years (mean 6.3, i.e., before mutation), and 26 vocally healthy adults (13 men, 13 women) aged 22–45 years (mean 28.7) were recruited (data from one female were removed due to background noise). None of these participants reported vocal disorders or speech complaints. Each participant gave informed consent before the recording.
Simultaneous recordings were made of the EGG and airborne voice (44.1 kHz/16 bits) in a quiet recording studio. The SPL was calibrated in dB, at 0.3 m relative to 20 μPa. A bespoke voice analysis software, FonaDyn v1.5 [23], was used for real-time monitoring, visual feedback to the participant, recording, and data pre-processing.
Habitual speech for the speech range profile (SRP) was elicited for the adult participants by three readings of the Rainbow Passage, while the children spoke spontaneously of a drawing of a playground scene. The participants were then instructed to phonate on /a/ over their full voice range (the voice range profile, VRP) until as large an area of cells (SPL × fo) as possible was populated.
The VRP was elicited following a protocol [24,25] by recording sustained phonation and glissandi first in a soft voice at the lowest, then at a comfortable, and finally at the highest fo. The participants first filled the map in the lower vocal intensity regions, then the upper regions, and so on, until a connected contour in this map was obtained. After completing the main parts of the map, the participants were asked to expand the upper and lower contours, with a live voice map in FonaDyn as visual feedback, by varying vocal loudness and fundamental frequency.
2.2. The Choice of Observation Sets
In this original data set, the i-th observation C is a list of several parameters, denoted as:
where n is the number of metrics (EGG and/or acoustic metrics, denoted as m). The grand total number of cycles is 3,732,124. The first two metrics, fo and SPL, are the indices for each observation on the voice map. fo is in semitones on the MIDI scale (60 = 261 Hz) and ranges from 30 to 90. SPL is in the range of 40–120 dB. We define a cell on the voice map as 1 semitone × 1 dB.
We then define two kinds of observations: (a) the cycle-by-cycle observations of metrics m1, …, mn extracted directly from each phonated cycle are denoted as , defined as:
and (b) the cell-by-cell averaged observations on the integer grid of fo × SPL,
where p is the count of observations that lie inside each grid unit. The grand total number of cells is 43,235. Each cell typically contains a mean of some 100 cycles.
In (a), each recording provides on the order of 100,000 observations of phonatory cycles per participant, while in (b), we have one observation per cell. On a map of the full voice range, there are on the order of 1000 cells, where each cell contains the metric averages for a number of cycles, which is on the order of 100. The latter method is much faster, but the per-cell averaging causes some loss of information. The tradeoff in quantity and computational time was assessed by comparing the classification results from these two types of observations.
One set of K-means centroids was trained on the cycle-by-cycle observations, assigning a cluster number to each cycle. On the subsequent binning into cells, however, a given cell can receive points from more than one cluster, because the same fo and SPL can be produced with different kinds of phonation. In this case, with cycle-by-cycle clustering, the cell is displayed as belonging to the cluster that attracted the majority of cycles in that cell. For the faster method of clustering, each cell is directly assigned a cluster number on the basis of the metric means that it contains.
The agreement of the two methods for assigning cells to clusters was 94% (±2%, p < 0.05). This degree of agreement is acceptable because, in the default voice map, the fo ranges from 30 to 90 in semitones, and the SPL ranges from 40 to 120 in dB, i.e., a map of units. An error rate of 6% on the sporadically distributed map is not easily discernible by the naked eye. Additionally, we are less concerned about to which cluster any particular SPL × fo cell is assigned. Instead, the actual distribution and the changes in distribution and centroids should be focused on, to assess the stability of the K-means algorithm.
Computations were much faster when using the voice map cell-by-cell representation rather than the data from the individual cycles. Even though K-means is known for its high-speed calculation, it is less efficient when the total number of observations reaches millions, which it does here when clustering groups of participants cycle-by-cycle. The chosen voice map representation instead holds one observation per cell, resulting in about a thousand observations per participant for a full voice range.
2.3. Computation of the Primary Metrics
For the computation of the individual metrics, the software FonaDyn v2.4.0 was used in two ways: (1) for computing data from every phonatory cycle on a timeline, and (2) for mapping the metric averages onto the voice field. FonaDyn computes numerous acoustic and EGG metrics and also clusters or classifies them in real time—but not faster. For this study, the subsequent clustering and classification were performed offline in MATLAB for speed and because the real-time clustering of incoming data will drift over the course of a recording.
Each voice metric is a dependent variable that defines a scalar field over the 2D voice field. Each metric is registered in its own ‘layer’ in a multi-layered voice map [26]. Table 1 shows the input metrics for the voice map.

Table 1.
The chosen EGG and acoustic metrics as inputs and their typical ranges.
For presentation, the metrics are averaged in each SPL × fo cell, cycle-by-cycle. The minimum number of cycles per cell presented in the voice map is set to 5, suppressing outliers and reducing the confidence interval for the mean in each cell.
In addition to the six metrics mentioned above, FonaDyn also produces descriptive metrics (total number of cycles) and the Fourier descriptors (magnitude and phase) of each EGG cycle for the ten lowest harmonics. All of these were subjected to principal component analysis (PCA).
It was found that the six chosen metrics together explained 91.5% of the variance in total and that each of them exhibited an explained variance ratio of more than 1%. In contrast, other metrics such as first harmonic, second harmonic, and so on, and also their differences (H1–H2, etc.) [8] did not perform as well in this data set, giving an explained variance ratio of less than 0.1% per metric.
2.4. Choice of Classification Method
The criteria for choosing which algorithm to use were: (1) it should be compatible with the data structures and features of the present study; hence, algorithms including density-based and hierarchy-based models are not appropriate for this data set since the metrics are not linearly distributed; (2) it should give interpretable and structured distributions in the voice map. The Gaussian mixture model and the DNN model showed good predictability but have not yet demonstrated well-structured voice maps in our pilot experiments; (3) it must be possible to run in real-time and be computationally inexpensive, so as to afford visual feedback with negligible delays. If a voice map of clusters is more structured and less sparse than another map, then it was made with the better algorithm.
We applied the K-means++ algorithm following the routine described by Arthur and Vassilvitskii [27]. We choose an initial center c1 at random from the data set, then select the next centroid with probability
where the distance between c1 and the observation m is denoted as . Then, the Euclidean distances from one observation to each centroid are computed until the algorithm converges to an optimum.
A fuzzy clustering algorithm based on distributions would be a possible alternative. However, in this study, the data points in each cell have a probability distribution because each cell can contain many cycles, not all of which will belong to the same cluster. In that sense, this K-means can be regarded as an alternative implementation of fuzzy clustering.
3. Results
3.1. The Optimal Number of Clusters
Now the question arises as to how many clusters k are optimal for describing the variation in the data. Intuitively, we expect the k to be limited to a countable range that, to some extent, corresponds to the phonation categories perceived by listeners.
A frequently used method for determining the optimum number of clusters is the Bayesian Information Criterion (BIC). BIC finds the large sample limit of the Bayes’ estimator, which leads to the selection of a model that is the most probable. It depends on whether the data observations are independent and identically distributed. BIC provides no more information than the model itself but selects the model by penalizing the complexity of several competing models. The BIC algorithm was improved by Teklehaymanot et al., whose variant shows better performance and goodness of fit on a large data set with many data points per cluster.
Here, the higher the BIC value, the better the tradeoff between the number of clusters and the performance, thus avoiding overfitting.
While keeping the configuration of the K-means model constant, we iterate the cluster number k from 1 to 10. Figure 4 shows the BIC tendency across females, males, and children with all six metrics. The BIC approaches its maximum at k = 6 clusters, then remains constant for males, while for females and children, the same occurs for k = 4. Notice that the absolute values of BIC across the three groups do not imply an actual difference in information because the amount of data points is not normalized across groups. Here, the BIC suggests the optimal value of the cluster number for the model using six chosen metrics to be 4 to 6. A larger k will be penalized by the BIC algorithm, in order to avoid overfitting.
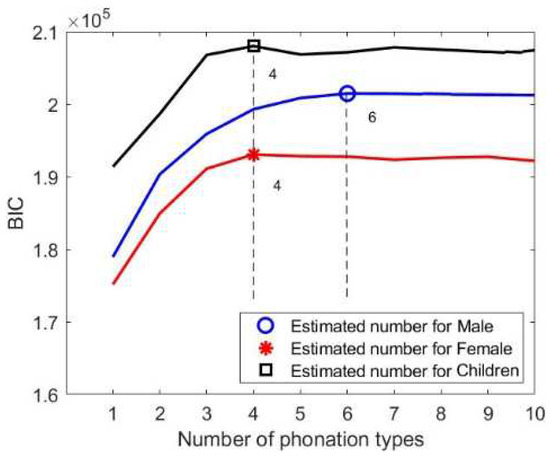
Figure 4.
BIC value, the maximum of which indicates the optimum number of clusters when using all six voice metrics. The circle marker represents the optimum for male voices of 6 clusters. For both female (star marker) and child voices (square marker), the optimum is 4 clusters.
Compared to the models with all six metrics, models with only one category of metrics (acoustic or EGG) show a different tendency in Figure 5. The models with only acoustic metrics reach a local maximum at the beginning of the curves of BIC, k = 2 for children, k = 3 for females, and k = 4 for males. The models with only EGG metrics, on the other hand, reach their maximum at k = 4 for all three groups. This can be taken to mean that, with the present data set and with the chosen metrics, the EGG signal can resolve a larger number of phonatory conditions than can the acoustic signal. In other words, for this data set, the models with only EGG metrics can yield higher distinguishability of phonation types while retaining a lower risk of overfitting.
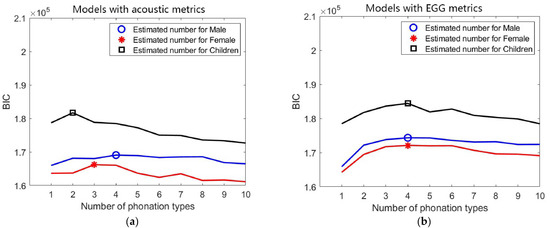
Figure 5.
BIC values for models with (a) acoustic metrics only and (b) EGG metrics only.
3.2. Description of the Classification Voice Maps
We first consider some basic examples of clustering to better understand the voice map representation. In Figure 6, a male’s (a), a female’s (b), and a child’s (c) voice maps with the same number of clusters k = 5 are displayed. The participant number is aligned with the original order in the data set. Each group was trained separately, i.e., the male group was trained with the voice and EGG signals of 13 male participants. In this map, each cell in the map represents a minimum of five phonatory cycles.

Figure 6.
Examples of using k = 5 clusters, on individual full voice range voice maps (VRPs) on /a:/ vowel (a) VRP of male participant M01; (b) VRP of female participant F02; (c) VRP of child (boy) participant B02. The color plotted in any given cell is that of the most frequently occurring phonation type in the cell, i.e., the dominant cluster. Each cell may contain cycles from other clusters as well, but such overlap is not visualized here. The x-axis is fo in semitones (on the midi scale, 48 = 110 Hz), and the y-axis is SPL in dB(C) at 0.3 m.
Inspecting broadly the overall contours, even though they are from individuals, it can be seen that the male participant has a lower pitch than the female and child; the child has a smaller pitch and SPL range than the adults, fully as might be expected. The adults exhibit a greater diversity of phonation types than the child. One can assume that every participant uses his/her strategy so that the phonation type distribution would inevitably vary. People will vary their phonation type in order to be able to phonate without undue effort at different fo and SPLs. In the map of the male voice (Figure 6a), it can be seen that there are three main regions in the higher, middle, and lower parts, which could be named, from top to bottom, as loud, transition, and soft regions, together with some subgroups around these regions. The map (Figure 6b) of the female voice shows similar partitions, with an extra split in the soft region. Except for the child (Figure 6c), the phonation type as classified by clustering is fairly consistent throughout the whole vocal range. Notice that the outliers near the contours are also classified as a cluster. In the softest regions, relatively breathy voices appear in the male and female participants.
3.2.1. Intra-Participant Distribution
Now, in Table 2 we may examine the distribution of phonation types in greater detail. The change of the distribution is given with an increasing cluster number k. The coordinates in the clustering space of the cluster centroids are given in polar plots in Appendix A.

Table 2.
Male participant M01, female participant F06, and child participant B09, with their voice maps by cluster numbers. Notice that the colors across k indicate only the relative position. The same color not necessarily denotes the same cluster. The last row represents the speech range profiles, marked as grids, overlapping on the density map, where the darker the region, the more VF cycles are contained. This enables a comparison of the whole voice range with the habitual speech range. The x-axis is fo in semitones (on the midi scale, 48 = 110 Hz), and the y-axis is SPL in dB(C) at 0.3 m.
Even though the cross-age comparison does not control well for the age variable and the cross-age groups are divided into an adult (male and female) group and a child (before mutation) group, the current plots still show clearly the large differences and variability due to age (or, in some sense, the impact of voice mutation).
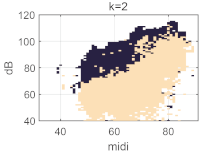
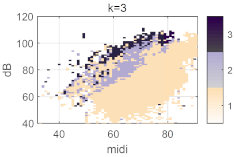
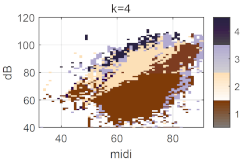
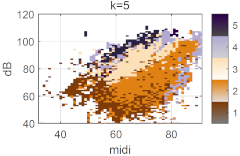
We now consider how the distribution of detected phonation types over the voice field changes as the number k of clusters is varied. As the number of k increases, the phonation type map progressively splits into more regions. For the male participant, it goes from the opposition of ‘loud’ and ‘soft’ for k = 2 to a third ’transition’ zone in between for k = 3.
The breathy soft zone in the bottom is characterized by the maximal values of CSE and Qci and very low CPPs. Together, the Q∆ and the Crest factor indicate great phonatory instability in this area, as the centroid polar plot shows in Table A1. The firm and loud regions at the top of the map are where the phonation is the most stable, described by the CPPs, SB, Crest factor, Qci, and Q∆ at their maximum, and a minimal CSE. Those regions are the loudest part of the voice map. Those metrics show a high-functioning phonation type. The transition zone starts with the lower left part of the voice map and ends in the upper right, with a slope of about +1.3 dB/semitone. The transition region is featured by its Qci slightly below its uncontacted 50% state. However, the values of the other metrics stay in the range between the top and bottom regions.
With the change from three to four clusters, an interesting split occurs on the left side of the loud region, in a cream color 2 next to the dark blue 4. It represents the low-pitch modal phonation type and forms the center of the habitual speech range (when the participant read the Rainbow passage thrice) that is denoted by the grids in the bottom row. Its centroid exhibits a very high Q∆ and Crest factor and a Qci of about 60%, while the voice metrics CSE, CPPs, and SB keep the same level as in the transition zone. This split corresponds to the habitual speech range.
When it comes to k = 5, the classifier picks up the breathiest regions as a new cluster, characterized by zero CPPs, high SB, CSE, and Qci, and a moderate Crest factor and Q∆. These illustrate the significant instability in the very soft voice. Finally, with k = 6, the transition zone in the male splits into a lower and an upper section, with the latter largely corresponding to the falsetto voice (color 5).
In the map of the female voice, the progression of splitting is structurally different—see also Table A2 for more details. When the cluster number k equals 3, a similar distribution, ‘loud-transition-soft,’ is manifested, with a set of centroids that is similar to the male voice. However, when the k increases to 4, it is instead the soft region that starts to split up, giving a specific size to the breathy region, which is characterized by zero CPPs, large CSE, SB, and Qci as adduction increases. The ‘fifth’ cluster still acts on the soft or breathy regions, evolving into a cluster with lower Q∆ and higher CPPs than the fourth cluster. This is due to a slightly more intense mode of phonation. The sixth cluster adds little to the overall picture. In this case, we may assume that the cluster number k = 4 for the female is consistent with the BIC curve because, in the soft or breathy region, there is a difference only in breathiness.
The child’s voice map shows similarities with that of the adult female—see Table A3. When the cluster number k is increased beyond 4, the general distribution does not change much.
The values of the metrics for all centroid locations are listed in Table A4.
3.2.2. Union Maps of the Classification
The inter-participant variability in voice maps is considerable, but there are methods for deriving a map that describes a group of participants. In Table 3, we present ‘union’ cluster maps where the categorical cluster of one fo-SPL cell is determined by the majority of all objects in the same group, i.e., the male, female, or child’s group. Constructing such a union map can visualize some structural similarities within the groups. However, it is worth noting that this data set has a limited number of participants. In addition to the apparent physiological differences within groups, the participants also exhibit different strategies of phonation.

Table 3.
‘Union’ maps of phonation types that display the majority count of all the cluster data in one group. The columns represent the groups: 13 males, 13 females, and 22 children. The rows represent the cluster number k from 2 to 6. The x-axis is fo in semitones (on the midi scale, 48 = 110 Hz), and the y-axis is SPL in dB(C) at 0.3 m.
Overall, male voices generally have a larger pitch and volume range than females and children. In contrast, the female and the child’s voices are more concentrated. All three groups produce similar distributional trends with k = 2 and k = 3. Soft and loud regions partition the map, and then a transition zone slanted upward appears in between these categories, though arrayed in slightly different manners in each group. When it comes to k = 4, the process of the split has changed. The fourth cluster occurs in the male’s loud region, the female’s soft region, and the children’s outer circle. This could mean that the male’s voice is more stable in the soft region, and the female’s voice is more stable in the loud region, as the order of split may indicate the likelihood of changes. The children’s voice group was stationary for this stage.
3.2.3. Acoustic Versus EGG Metrics
Instead of showing just one metric across the voice range, the voice map of clusters gives a solution for simultaneously picking up information from several metrics of both acoustic and EGG signals. For example, Figure 7 shows the map layers of all metrics for comparison with k = 4 clusters in another male, M06.
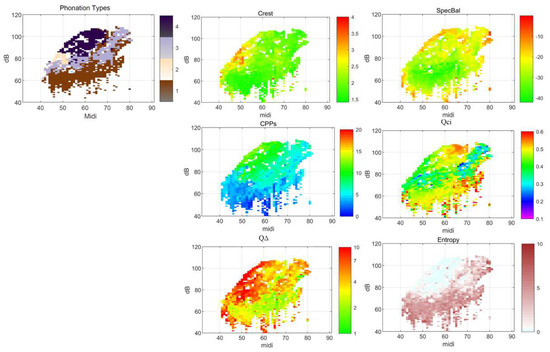
Figure 7.
Voice map layers of the phonation types and the underlying metrics, from a male speaker, M06, when k = 4. Clockwise from top left: four phonation type clusters, the Crest factor, the spectrum balance (SB), the cepstral peak prominence smoothed (CPPs), the EGG cycle-rate sample entropy (CSE), the normalized peak dEGG (Q∆), and the EGG quotient of contact by integration (Qci). The x-axis is fo in semitones (on the midi scale, 48 = 110 Hz), and the y-axis is SPL in dB(C) at 0.3 m.
The Crest factor contributes the most to the cluster corresponding to the speech range on the left of this voice map, colored by the pale yellow in the phonation type layer (and the redder region on the left of the Crest factor layer). At the same time, in EGG metrics, the Qci and Q∆ seemingly imply the tendency from the lower left to the upper right. The CPPs and CSE as stability indicators for voice signal and EGG signal each independently expose the lower breathy and soft regions. Though the CPPs and CSE show similar impacts on distinguishing the loud and soft regions, a slightly different portrait in the transitional region affects the boundaries of the loud and the transition voices.
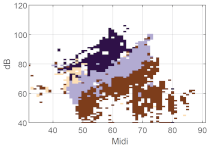
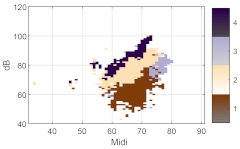
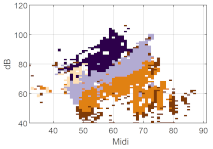
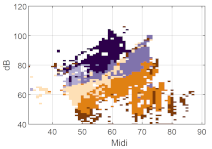
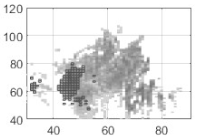
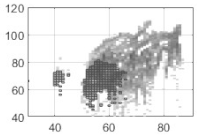
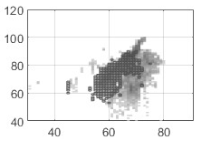
Are all these metrics needed? To address this question, the classification was performed with EGG only (three metrics), acoustic only (three metrics), and EGG + acoustic (six metrics), as can be seen for one participant in Figure 8. We see a better portrait of parallel layering in (Figure 8b) with acoustic metrics, but a better approximation of the modal speech range (the grey on the left around 50 semitones and 80 dB) in (Figure 8c) with EGG metrics. With combined acoustic and EGG features, we obtain a more structured voice map.

Figure 8.
A classification that uses (a) all six metrics combined, (b) acoustic metrics only, and (c) EGG metrics only. Here, the acoustic metrics are the crest factor, CPPs, and SB, and the EGG metrics are the Qci, Q∆, and CSE. The x-axis is fo in semitones (on the midi scale, 48 = 110 Hz), and the y-axis is SPL in dB(C) at 0.3 m.
This confirms that acoustic metrics and EGG metrics manifest different aspects of vocal function. Combining the metrics of the airborne signal and the EGG signal resolves the phonation types in greater detail. However, if limited by conditions, only one set of metrics can also be well interpreted, as in this case, the acoustic metrics are better at revealing the structural feature of the voice map. As a complement, the EGG metrics are more suited for finding the transition zone at the onset of vocal fold collision.
4. Discussion
As we can see above, the unsupervised learning method gives interpretable results that are relatively consistent with our prior knowledge of phonation. Thus, it is acceptable to stay with the current K-means++ method because of its computational rapidity and efficiency.
Our present choice of metrics was in part determined by the current availability of metrics in the bespoke software that we are using as an acquisition front-end for the clustering. There are of course several other candidates for metrics, especially if concurrent automatic inverse filtering proves to be possible. Of particular interest would be metrics that represent the power in the rest of the spectrum relative to that of the fundamental partial, such as the ‘harmonic richness factor’ (HRF) [28] for the inverse filtered glottal flow signal; Lrest/H1 [29] for the radiated sound or the maximum flow declination rate (mfdr).
This measurement paradigm strongly depends on the assumption that there should exist distinct regions in the fo/SPL voice map. We expect to see connected regions representing phonation types instead of a speckled field of scattered dots. This assumption, to some extent, serves as a validation criterion. Spatial coherence is what we expect the voice maps to show, since our experience tells us that different kinds of phonation tend to be used in different parts of the voice range. A further perceptual assessment performed by voice professionals and clinicians will be required to establish the classified phonation modes either physiologically or perceptually. This perceptual assessment would be purpose-oriented and empirical. Different investigators may have different criteria for categorization into phonation types. For example, a trained singer could require a more specialized set of phonation types than a singing amateur. A phonetician would call for more information on the vibratory status; thus, more information on the vocal folds is needed. For pathological voices, the complexity might increase further; the optimum number of clusters could be dependent on the type of voice disorder and the treatment involved. In this case, the ground truth must also be task-oriented and requires professional or non-professional knowledge to confirm the validity of the classification. To assist in such work, FonaDyn includes a built-in audio player, which allows users to interactively listen to or annotate what a region indicated in the voice map sounded like.
Many readers will be familiar with MDVP in Figure 9 (multidimensional voice program). The MDVP displays several objective voice quality parameters in a polar ‘radar’ plot, including Base Frequency (fo), Jitter, Shimmer, NHR (Noise to Harmonic Ratio), VTI (Voice Turbulence Index), and ATRI (Amplitude Tremor Intensity Index). MDVP is well established in clinical practice and may provide an objective yet non-invasive and comfortable alternative to assess voice quality—and to some extent, diagnose voice-related abnormalities. However, a limitation lies in that the MDVP is designed for use with individual sustained vowels, while most metrics are greatly affected by the fo and SPL.
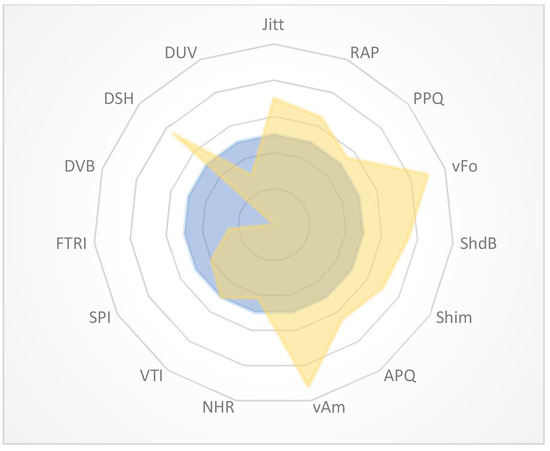
Figure 9.
Example of an MDVP graph, adapted from [30].
With clustering, we can combine the advantage of applying multiple metrics with the conceptual and graphical convenience of a flat 2D voice map. Such a representation collates the systematic changes across the voice range, thus providing a more complete basis for classification. This could be helpful for the clinical diagnosis and valuation of vocal status, for example, before and after medical intervention. The clinical application relies on the plausible assumption that different phonation types correspond to changes in the associated physiological structures and mechanisms, and/or that vocal intervention (such as therapy and surgery) has effects on different regions of one’s voice range. In other words, we expect that the effects of interventions can be observed in the voice maps.
Even if voice maps cannot be used in certain applicational scenarios, we would encourage improving recording protocols, by well controlling the fo and SPL and avoiding the excessive averaging of the metrics. The covariation between phonation type and pitch or SPL [1,31] will otherwise result in sources of variation that remain unaccounted for.
It is not quite safe to conclude that each cluster found represents a distinct type of phonation. The BIC analysis suggests a useful maximum number of clusters, and increasing k further will tend simply to stratify the data into more ‘clusters’, even when they are evenly distributed and not attributable to distinct modes of phonation. Applying the BIC criterion did not give a very clear outcome in this data set since the maxima in the BIC curves were not very prominent, except perhaps when all six metrics were clustered. Resolving this issue will require a deeper analysis of how the centroids were distributed.
The set of metrics chosen here has not been tested on some common phonation types, such as the creaky voice, nor have we yet tried to characterize pathological voices in this way. Other data sets will have to be collected, for which participants would be requested to produce a greater variety of phonation types. This problem becomes more prominent in a social or sociolinguistic context. “One person’s voice disorder might be another person’s phoneme” [32]. One phonation type considered ‘abnormal’ or ‘noisy’ could be another one’s feature, making only the comparison between pre- and post-intervention meaningful to some extent. A larger data set and a set of better-controlled parameters or algorithms are required to restrict these disadvantages.
Here, we have used the metric values themselves as the clustering features. It can be seen in Figure 2 that piecewise linear segments can reasonably approximate the variation with the SPL of the metrics, so it is possible that phonatory regions would be better characterized by instead clustering the gradients of the metrics [26] (pp. 40–70). However, computing the gradients (the metric derivatives with respect to SPL and fo) increases noise, and can be performed only when an entire map is completed, i.e., not in real-time. We intend to explore this further in future investigations.
5. Conclusions
By classifying the phonation types through K-means++, we then visualize the distribution of phonation types across the voice range on the voice map and found possible differences across participants, genders, and ages. It appears that the males exhibited a greater variety of phonation types than the females and the children. The optimal number of clusters for males in this data set is six, while the optimal number of clusters for females and children is four. This would be consistent with the notion of larger vocal folds being able to enter into more different modes of vibration.
A systematic phonation type splitting with increasing k manifested itself differently in the male, female, and child groups. The clinically relevant correlations of these distributions remain to be validated by relating the centroid locations to perceptual and physiological assessments. The EGG metrics contribute noticeably to the classification of phonation types in terms of vocal fold information, thus complementing the acoustic metrics. It appears that defining the phonation type by clustering features derived from the acoustic and EGG signals and visualizing them over the voice field is a promising technique.
Supplementary Materials
The following supporting information can be downloaded at: https://www.mdpi.com/article/10.3390/app122312092/s1.
Author Contributions
Conceptualization and methodology, H.C. and S.T.; Software, H.C. and S.T.; Data Curation, H.C.; Writing—original draft preparation H.C.; Writing—review and editing, S.T.; Supervision, S.T. All authors have read and agreed to the published version of the manuscript.
Funding
This research was funded by the China Scholarship Council, a funding institution under the Ministry of Education of China, grant number 202006010113 within the KTH-CSC programme. The data collection was carried out in an earlier project [22] that was supported by a travel grant for Rita Patel from the Wenner-Gren Foundations, number GFOh2018-0014. The FonaDyn software development is supported by in-kind KTH faculty grants for the time of author S.T.
Institutional Review Board Statement
The data collection for the earlier study [22] was approved by the Swedish Ethical Review Authority, Registration No. 2019–01283.
Informed Consent Statement
Informed consent was obtained from all participants involved in the earlier study for which the data collection was made.
Data Availability Statement
Complete voice maps for all individual participants are provided in the Supplementary File for the present article.
Acknowledgments
We are grateful to Rita R. Patel for initiating and collaborating on the preceding prospective study, for which the data collection was originally carried out, and to the participants. Andreas Selamtzis originally proposed the clustering of multiple metrics, during his doctoral studies in 2017. Olov Engwall co-supervised H.C. and kindly offered helpful comments on the manuscript.
Conflicts of Interest
The authors declare no conflict of interest.
Appendix A
The voice maps and polar plots of the metrics of the participants discussed above are listed. The centroid polar is normalized in a range of 0…1 and represents the metric values of the centroids. The color scheme in the centroid polar is the same as in the phonation type map, thus indicating the same cluster. The right columns contain the individual metric maps for the given participant. Notice that in Table 3, the ‘Union’ maps of the phonation types share the same sets of centroids by groups.

Table A1.
Male participant M01.
Table A1.
Male participant M01.
| Cluster Number | Phonation Type Map | Centroid Polar Plot (Range 0…1) | Metric Name | Single Metric Voice Map |
|---|---|---|---|---|
| k = 2 | 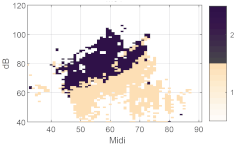  | Crest factor | 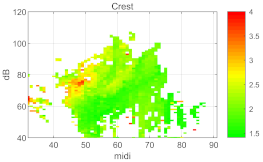 | |
| k = 3 | 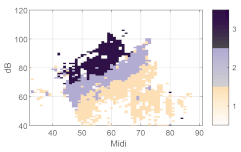  | Spectrum Balance |  | |
| k = 4 |  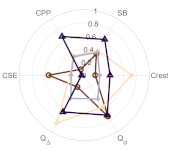 | CPPs |  | |
| k = 5 |  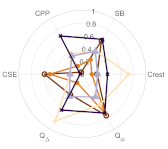 | Qci |  | |
| k = 6 |   | Q∆ |  | |
| Speech range profile |  | CSE |  | |

Table A2.
Female participant F06.
Table A2.
Female participant F06.
| Cluster Number | Phonation Type Map | Centroid Polar Plot (Range 0…1) | Metric Name | Single Metric Voice Map |
|---|---|---|---|---|
| k = 2 |   | Crest factor | 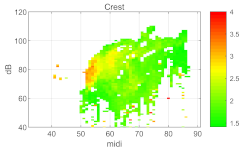 | |
| k = 3 |  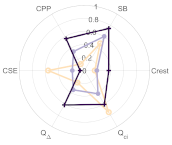 | Spectrum Balance | 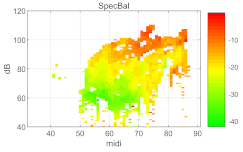 | |
| k = 4 |   | CPPs |  | |
| k = 5 | 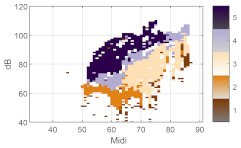  | Qci | 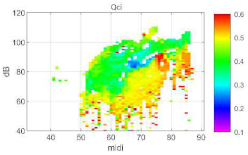 | |
| k = 6 |   | Q∆ |  | |
| Speech range profile |  | CSE |  | |

Table A3.
Child participant B09.
Table A3.
Child participant B09.
| Cluster Number | Phonation Type Maps | Centroid Polar Plot (Range 0…1) | Metric Name | Single Metric Voice Map |
|---|---|---|---|---|
| k = 2 | 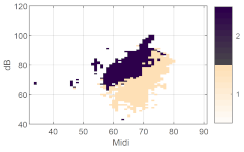 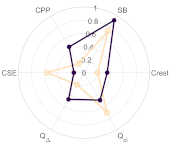 | Crest factor | 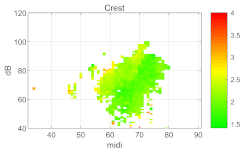 | |
| k = 3 | 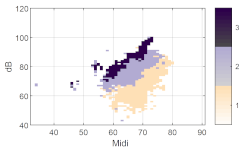 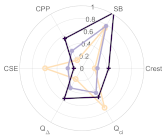 | Spectrum Balance |  | |
| k = 4 | 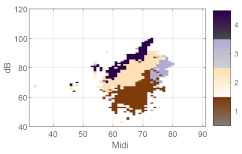  | CPPs |  | |
| k = 5 |   | Qci | 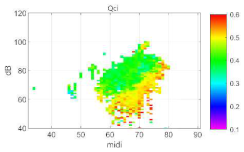 | |
| k = 6 |   | Q∆ | 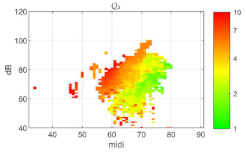 | |
| Speech range profile |  | CSE | 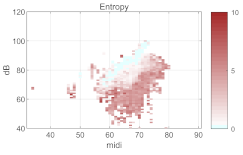 | |

Table A4.
Centroid values for k = 2…6.
Table A4.
Centroid values for k = 2…6.
| k | Centroid | Group | Crest Factor (dB) | SB (dB) | CPP (dB) | CSE | Q | Qci | Inferred Phonation Type |
|---|---|---|---|---|---|---|---|---|---|
| 2 | 1 | Male | 1.829 | −31.716 | 5.410 | 3.709 | 1.707 | 0.468 | soft |
| Female | 1.789 | −26.473 | 5.114 | 4.328 | 1.533 | 0.489 | soft | ||
| Children | 1.953 | −18.478 | 4.932 | 4.514 | 2.885 | 0.482 | soft | ||
| 2 | Male | 2.310 | −24.547 | 9.762 | 0.387 | 3.702 | 0.424 | loud | |
| Female | 2.083 | −19.495 | 8.659 | 0.579 | 3.636 | 0.403 | loud | ||
| Children | 2.329 | −12.529 | 8.436 | 1.231 | 5.260 | 0.395 | loud | ||
| 3 | 1 | Male | 1.820 | −31.693 | 5.269 | 4.294 | 1.449 | 0.493 | soft |
| Female | 1.799 | −26.559 | 5.062 | 4.442 | 1.470 | 0.497 | soft | ||
| Children | 1.955 | −18.389 | 4.796 | 4.733 | 2.792 | 0.493 | soft | ||
| 2 | Male | 2.003 | −27.684 | 7.291 | 0.957 | 3.125 | 0.370 | transition | |
| Female | 1.843 | −21.998 | 6.958 | 1.154 | 3.199 | 0.360 | transition | ||
| Children | 2.064 | −17.004 | 6.847 | 1.810 | 4.275 | 0.382 | transition | ||
| 3 | Male | 2.532 | −22.843 | 11.490 | 0.154 | 4.130 | 0.475 | loud | |
| Female | 2.283 | −17.535 | 10.083 | 0.216 | 4.003 | 0.443 | loud | ||
| Children | 2.530 | −9.117 | 9.588 | 1.036 | 6.052 | 0.414 | loud | ||
| 4 | 1 | Male | 1.820 | −31.700 | 5.267 | 4.296 | 1.444 | 0.493 | soft |
| Female | 1.798 | −26.608 | 5.057 | 4.446 | 1.467 | 0.497 | soft | ||
| Children | 1.891 | −22.639 | 4.302 | 4.759 | 3.112 | 0.490 | soft | ||
| 2 | Male | 2.975 | −26.402 | 10.936 | 0.215 | 4.167 | 0.428 | low modal | |
| Female | 2.487 | −21.014 | 10.494 | 0.158 | 4.124 | 0.425 | low modal | ||
| Children | 2.077 | −17.439 | 6.856 | 1.688 | 4.435 | 0.378 | low modal | ||
| 3 | Male | 1.973 | −27.858 | 7.230 | 0.994 | 3.112 | 0.366 | transition | |
| Female | 1.837 | −22.417 | 6.940 | 1.169 | 3.201 | 0.356 | transition | ||
| Children | 2.111 | −10.015 | 5.991 | 4.385 | 2.450 | 0.487 | transition | ||
| 4 | Male | 2.224 | −20.864 | 11.427 | 0.164 | 3.994 | 0.499 | loud | |
| Female | 2.063 | −14.266 | 9.378 | 0.368 | 3.785 | 0.459 | loud | ||
| Children | 2.519 | −9.527 | 9.786 | 0.829 | 6.296 | 0.410 | loud | ||
| 5 | 1 | Male | 2.01 | −22.74 | 3.42 | 4.74 | 4.36 | 0.50 | soft |
| Female | 2.22 | −18.41 | 3.29 | 4.30 | 5.84 | 0.53 | soft | ||
| Children | 3.068 | −13.786 | 4.448 | 4.381 | 6.722 | 0.482 | soft | ||
| 2 | Male | 1.80 | −33.64 | 4.74 | 4.09 | 2.42 | 0.48 | transition | |
| Female | 1.70 | −31.61 | 3.90 | 4.40 | 3.43 | 0.49 | transition | ||
| Children | 1.873 | −22.840 | 4.283 | 4.758 | 3.037 | 0.488 | transition | ||
| 3 | Male | 3.30 | −28.58 | 7.41 | 1.48 | 8.67 | 0.42 | low modal | |
| Female | 1.87 | −23.19 | 5.46 | 4.30 | 2.02 | 0.49 | low modal | ||
| Children | 2.060 | −17.634 | 6.887 | 1.629 | 4.370 | 0.377 | low modal | ||
| 4 | Male | 2.04 | −28.88 | 6.94 | 1.53 | 4.69 | 0.37 | falsetto | |
| Female | 1.91 | −22.52 | 7.15 | 1.38 | 4.15 | 0.36 | falsetto | ||
| Children | 1.995 | −10.352 | 6.221 | 4.311 | 2.293 | 0.484 | falsetto | ||
| 5 | Male | 2.44 | −21.87 | 11.27 | 0.27 | 6.87 | 0.48 | loud | |
| Female | 2.35 | −18.48 | 10.17 | 0.35 | 6.62 | 0.44 | loud | ||
| Children | 2.427 | −9.160 | 10.077 | 0.642 | 6.033 | 0.406 | loud | ||
| 6 | 1 | Male | 2.020 | −24.113 | 7.870 | 0.811 | 3.446 | 0.309 | soft |
| Female | 1.708 | −31.765 | 4.632 | 4.123 | 1.390 | 0.497 | soft | ||
| Children | 2.092 | −17.451 | 3.604 | 4.943 | 5.341 | 0.535 | soft | ||
| 2 | Male | 1.814 | −32.139 | 5.199 | 4.536 | 1.350 | 0.497 | transition | |
| Female | 1.890 | −21.419 | 5.467 | 4.761 | 1.553 | 0.496 | transition | ||
| Children | 3.352 | −13.193 | 4.898 | 4.073 | 6.815 | 0.447 | transition | ||
| 3 | Male | 1.909 | −22.562 | 7.087 | 1.206 | 2.655 | 0.439 | low modal | |
| Female | 2.510 | −21.150 | 10.551 | 0.151 | 4.137 | 0.427 | low modal | ||
| Children | 1.849 | −23.378 | 4.573 | 4.660 | 2.640 | 0.478 | low modal | ||
| 4 | Male | 2.990 | −26.321 | 10.941 | 0.207 | 4.183 | 0.428 | high modal | |
| Female | 1.755 | −25.489 | 6.862 | 1.103 | 3.073 | 0.390 | high modal | ||
| Children | 2.064 | −17.656 | 6.906 | 1.613 | 4.388 | 0.376 | high modal | ||
| 5 | Male | 2.000 | −35.203 | 6.699 | 1.251 | 3.093 | 0.388 | falsetto | |
| Female | 1.964 | −18.399 | 7.246 | 1.102 | 3.414 | 0.322 | falsetto | ||
| Children | 2.009 | −9.954 | 6.366 | 4.241 | 2.239 | 0.477 | falsetto | ||
| 6 | Male | 2.261 | −21.097 | 11.878 | 0.110 | 4.128 | 0.503 | loud | |
| Female | 2.076 | −14.320 | 9.609 | 0.282 | 3.867 | 0.463 | loud | ||
| Children | 2.424 | −9.169 | 10.097 | 0.625 | 6.039 | 0.406 | loud |
References
- Kuang, J.; Keating, P. Vocal fold vibratory patterns in tense versus lax phonation contrasts. J. Acoust. Soc. Am. 2014, 136, 2784–2797. [Google Scholar] [CrossRef] [PubMed]
- Yu, K.; Lam, H. The role of creaky voice in Cantonese tone perception. J. Acoust. Soc. Am. 2014, 136, 1320–1333. [Google Scholar] [CrossRef] [PubMed]
- Wang, C.; Tang, C. The Falsetto Tones of the Dialects in Hubei Province. In Proceedings of the 6th International Conference on Speech Prosody, SP 2012, Shanghai, China, 22–25 May 2012; Volume 1. [Google Scholar]
- Davidson, L. The versatility of creaky phonation: Segmental, prosodic, and sociolinguistic uses in the world’s languages. Wiley Interdiscip. Rev. Cogn. Sci. 2021, 12, e1547. [Google Scholar] [CrossRef] [PubMed]
- Gordon, M.; Ladefoged, P. Phonation types: A cross-linguistic overview. J. Phon. 2001, 29, 383–406. [Google Scholar] [CrossRef]
- Sundberg, J. Vocal fold vibration patterns and modes of phonation. Folia Phoniatr. Logop. 1995, 47, 218–228. [Google Scholar] [CrossRef]
- Borsky, M.; Mehta, D.D.; Van Stan, J.H.; Gudnason, J. Modal and non-modal voice quality classification using acoustic and electroglottographic features. IEEE/ACM Trans. Audio Speech Lang. Process. 2017, 25, 2281–2291. [Google Scholar] [CrossRef]
- Hillenbrand, J.; Cleveland, R.A.; Erickson, R.L. Acoustic correlates of breathy vocal quality. J. Speech Hear. Res. 1994, 37, 769–778. [Google Scholar] [CrossRef] [PubMed]
- Gowda, D.; Kurimo, M. Analysis of breathy, modal and pressed phonation based on low frequency spectral density. In Proceedings of the Interspeech, Lyon, France, 25–19 August 2013; pp. 3206–3210. [Google Scholar] [CrossRef]
- Kadiri, S.R.; Alku, P. Glottal features for classification of phonation type from speech and neck surface accelerometer signals. Comput. Speech Lang. 2021, 70, 101232. [Google Scholar] [CrossRef]
- Hsu, T.Y.; Ryherd, E.E.; Ackerman, J.; Persson Waye, K. Psychoacoustic measures and their relationship to patient physiology in an intensive care unit. J. Acoust. Soc. Am. 2011, 129, 2635. [Google Scholar] [CrossRef]
- Kadiri, S.R.; Alku, P.; Yegnanarayana, B. Analysis and classification of phonation types in speech and singing voice. Speech Commun. 2020, 118, 33–47. [Google Scholar] [CrossRef]
- Selamtzis, A.; Ternstrom, S. Analysis of vibratory states in phonation using spectral features of the electroglottographic signal. J. Acoust. Soc. Am. 2014, 136, 2773–2783. [Google Scholar] [CrossRef] [PubMed]
- Ternström, S.; Pabon, P. Voice Maps as a Tool for Understanding and Dealing with Variability in the Voice. Appl. Sci. 2022, 12, 11353. [Google Scholar] [CrossRef]
- Selamtzis, A.; Ternström, S. Investigation of the relationship between electroglottogram waveform, fundamental frequency, and sound pressure level using clustering. J. Voice 2017, 31, 393–400. [Google Scholar] [CrossRef] [PubMed]
- Ternstrom, S. Normalized time-domain parameters for electroglottographic waveforms. J. Acoust. Soc. Am. 2019, 146, EL65. [Google Scholar] [CrossRef]
- Johansson, D. Real-Time Analysis, in SuperCollider, of Spectral Features of Electroglottographic Signals. Master’s Thesis, KTH Royal Institute of Technology, Stockholm, Sweden, 2016. Available online: https://kth.diva-portal.org/smash/get/diva2:945805/FULLTEXT01.pdf (accessed on 24 November 2022).
- Pabon, J.P.H. Objective acoustic voice-quality parameters in the computer phonetogram. J. Voice 1991, 5, 203–216. [Google Scholar] [CrossRef]
- Fant, G. The LF-model revisited. Transformations and frequency domain analysis. Speech Trans. Lab. Q. Rep. Royal Inst. Tech. Stockholm 1995, 36, 119–156. [Google Scholar]
- Awan, S.N.; Solomon, N.P.; Helou, L.B.; Stojadinovic, A. Spectral-cepstral estimation of dysphonia severity: External validation. Ann. Otol. Rhinol. Laryngol. 2013, 122, 40–48. [Google Scholar] [CrossRef]
- Ternström, S.; Bohman, M.; Södersten, M. Loud speech over noise: Some spectral attributes, with gender differences. J. Acoust. Soc. Am. 2006, 119, 1648–1665. [Google Scholar] [CrossRef]
- Patel, R.R.; Ternstrom, S. Quantitative and Qualitative Electroglottographic Wave Shape Differences in Children and Adults Using Voice Map-Based Analysis. J. Speech Lang. Hear. Res. 2021, 64, 2977–2995. [Google Scholar] [CrossRef]
- Ternström, S.; Johansson, D.; Selamtzis, A. FonaDyn—A system for real-time analysis of the electroglottogram, over the voice range. SoftwareX 2018, 7, 74–80. [Google Scholar] [CrossRef]
- Damsté, P.H. The phonetogram. Pract. Otorhinolaryngol. 1970, 32, 185–187. [Google Scholar]
- Schutte, H.K.; Seidner, W. Recommendation by the Union of European Phoniatricians (UEP): Standardizing voice area measurement/phonetography. Folia. Phoniatr. 1983, 35, 286–288. [Google Scholar] [CrossRef] [PubMed]
- Pabon, P. Mapping Individual Voice Quality over the Voice Range: The Measurement Paradigm of the Voice Range Profile. Comprehensive Summary. Ph.D. Thesis, KTH Royal Institute of Technology, Stockholm, Sweden, 2018. [Google Scholar]
- Arthur, D.; Vassilvitskii, S. k-means++: The advantages of careful seeding. In Proceedings of the Eighteenth Annual ACM-SIAM Symposium on Discrete Algorithms, New Orleans, LA, USA, 7–9 January 2007; pp. 1027–1035. [Google Scholar]
- Childers, D.G.; Lee, C.K. Vocal quality factors: Analysis, synthesis, and perception. J. Acoust. Soc. Am. 1991, 90, 2394–2410. [Google Scholar] [CrossRef] [PubMed]
- Pabon, P.; Ternstrom, S. Feature Maps of the Acoustic Spectrum of the Voice. J. Voice 2020, 34, 161.e1–161.e26. [Google Scholar] [CrossRef] [PubMed]
- Stomeo, F.; Rispoli, V.; Sensi, M.; Pastore, A.; Malagutti, N.; Pelucchi, S. Subtotal arytenoidectomy for the treatment of laryngeal stridor in multiple system atrophy: Phonatory and swallowing results. Braz. J. Otorhinolaryngol. 2016, 82, 116–120. [Google Scholar] [CrossRef] [PubMed]
- Kuang, J. Covariation between voice quality and pitch: Revisiting the case of Mandarin creaky voice. J. Acoust. Soc. Am. 2017, 142, 1693. [Google Scholar] [CrossRef] [PubMed]
- Ladefoged, P. Cross-Linguistic Studies of Speech Production. In The Production of Speech; MacNeilage, P.F., Ed.; Springer: New York, NY, USA, 1983; pp. 177–188. [Google Scholar]
Publisher’s Note: MDPI stays neutral with regard to jurisdictional claims in published maps and institutional affiliations. |
© 2022 by the authors. Licensee MDPI, Basel, Switzerland. This article is an open access article distributed under the terms and conditions of the Creative Commons Attribution (CC BY) license (https://creativecommons.org/licenses/by/4.0/).
