1. Introduction
Spectroscopy reveals the essential characteristics of atoms, molecules, and molecular structures of substances [
1]. It plays an important role in various fields, such as nondestructive testing, food safety testing, meteorological monitoring, agricultural general survey, geological resource exploration, and military target reconnaissance. With the development of spectrometry, the snapshot, miniaturized, and integrated methods and instruments have been gradually expanded [
2,
3,
4,
5]; however, they still face unprecedented challenges.
A conventional spectrometer is realized primarily through light splitting, filtering or interference. Computational spectrometry based on compressed sensing theory promotes the development of a new method of integrated and snapshot spectrum measurement. Brady et al. took the lead in using a two-dimensional coding template and dispersive optical element to study snapshot compressed sensing spectrometry [
6,
7]. This method uses both a binary-valued aperture to realize transmittance coding and a dispersive element to mix signals arriving at the focal plane of detector arrays. The spectrum is further inverted through the compressed sensing reconstruction algorithm. The target spectral data can be obtained after several measurements, and the spectrometry is fast and efficient. However, this method requires transformation from the spectral to the spatial dimension; consequently, it uses spatial coding to realize spectral coding, which undoubtedly increases the complexity of instrument architecture, cost and volume. Adrian et al. placed a liquid crystal variable retarder (LCVR) between two orthogonal polarizers, and the regulation of incident spectral transmittance was flexibly realized by controlling LCVR’s phase retardation [
8]. Spectrum measurement with a high compressed ratio was demonstrated by coding the transmittance under different retardations. The method accomplished the coding in the spectral dimension, thereby producing a simpler and smaller system structure. Furthermore, compressed spectrometry is proposed using a Fabry Perot (FP) resonator, and the piezoelectric driver was used to adjust the distance between the two mirrors of the FP resonator to obtain different spectral transmittance regulations [
9]. LCVR and FP resonators can realize direct coding in the spectral dimension, which significantly reduces the volume of the system. Nevertheless, the time responses of the methods are both in the order of ms. This is not conducive for applications that require ultrafast spectrum measurements, such as the fluorescence spectrum, explosion radiation spectrum etc. In addition, LCVR and FP are significantly affected by ambient temperature; additionally, the FP resonator is also sensitive to vibration interference. Further, the methods have poor environmental adaptability and limited working stability.
Recently, a new type of computational spectrometry combines recent progress in nanophotonics. Etalon arrays, etched thin films, and metasurfaces have been built on the focal plane of detector arrays for the development of micro spectrometers [
10,
11,
12,
13,
14]. These methods are also coded in the spectral dimension, and their spectral resolutions are directly constrained by the number of coding arrays. The spectral resolution has exceeded 1 nm, but the fabrication of a large scale metasurface composed of hundreds different coding arrays is not only time-consuming but also costly.
In summary, fast, snapshot, and integrated spectrometry based on compressed sensing with transmittance coding in the spectral dimension must be studied. In this study, compressed sensing spectrometry based on electro-optic transmittance coding is proposed as an alternative to LCVR, FP and film coding templates. The sinusoidal driven transmittance coding and uncorrelated discrete compression measurement mechanism are explored, and a precision reconstruction algorithm is established. Additionally, a fast hyperspectral compressed measurement method is developed.
2. Principle
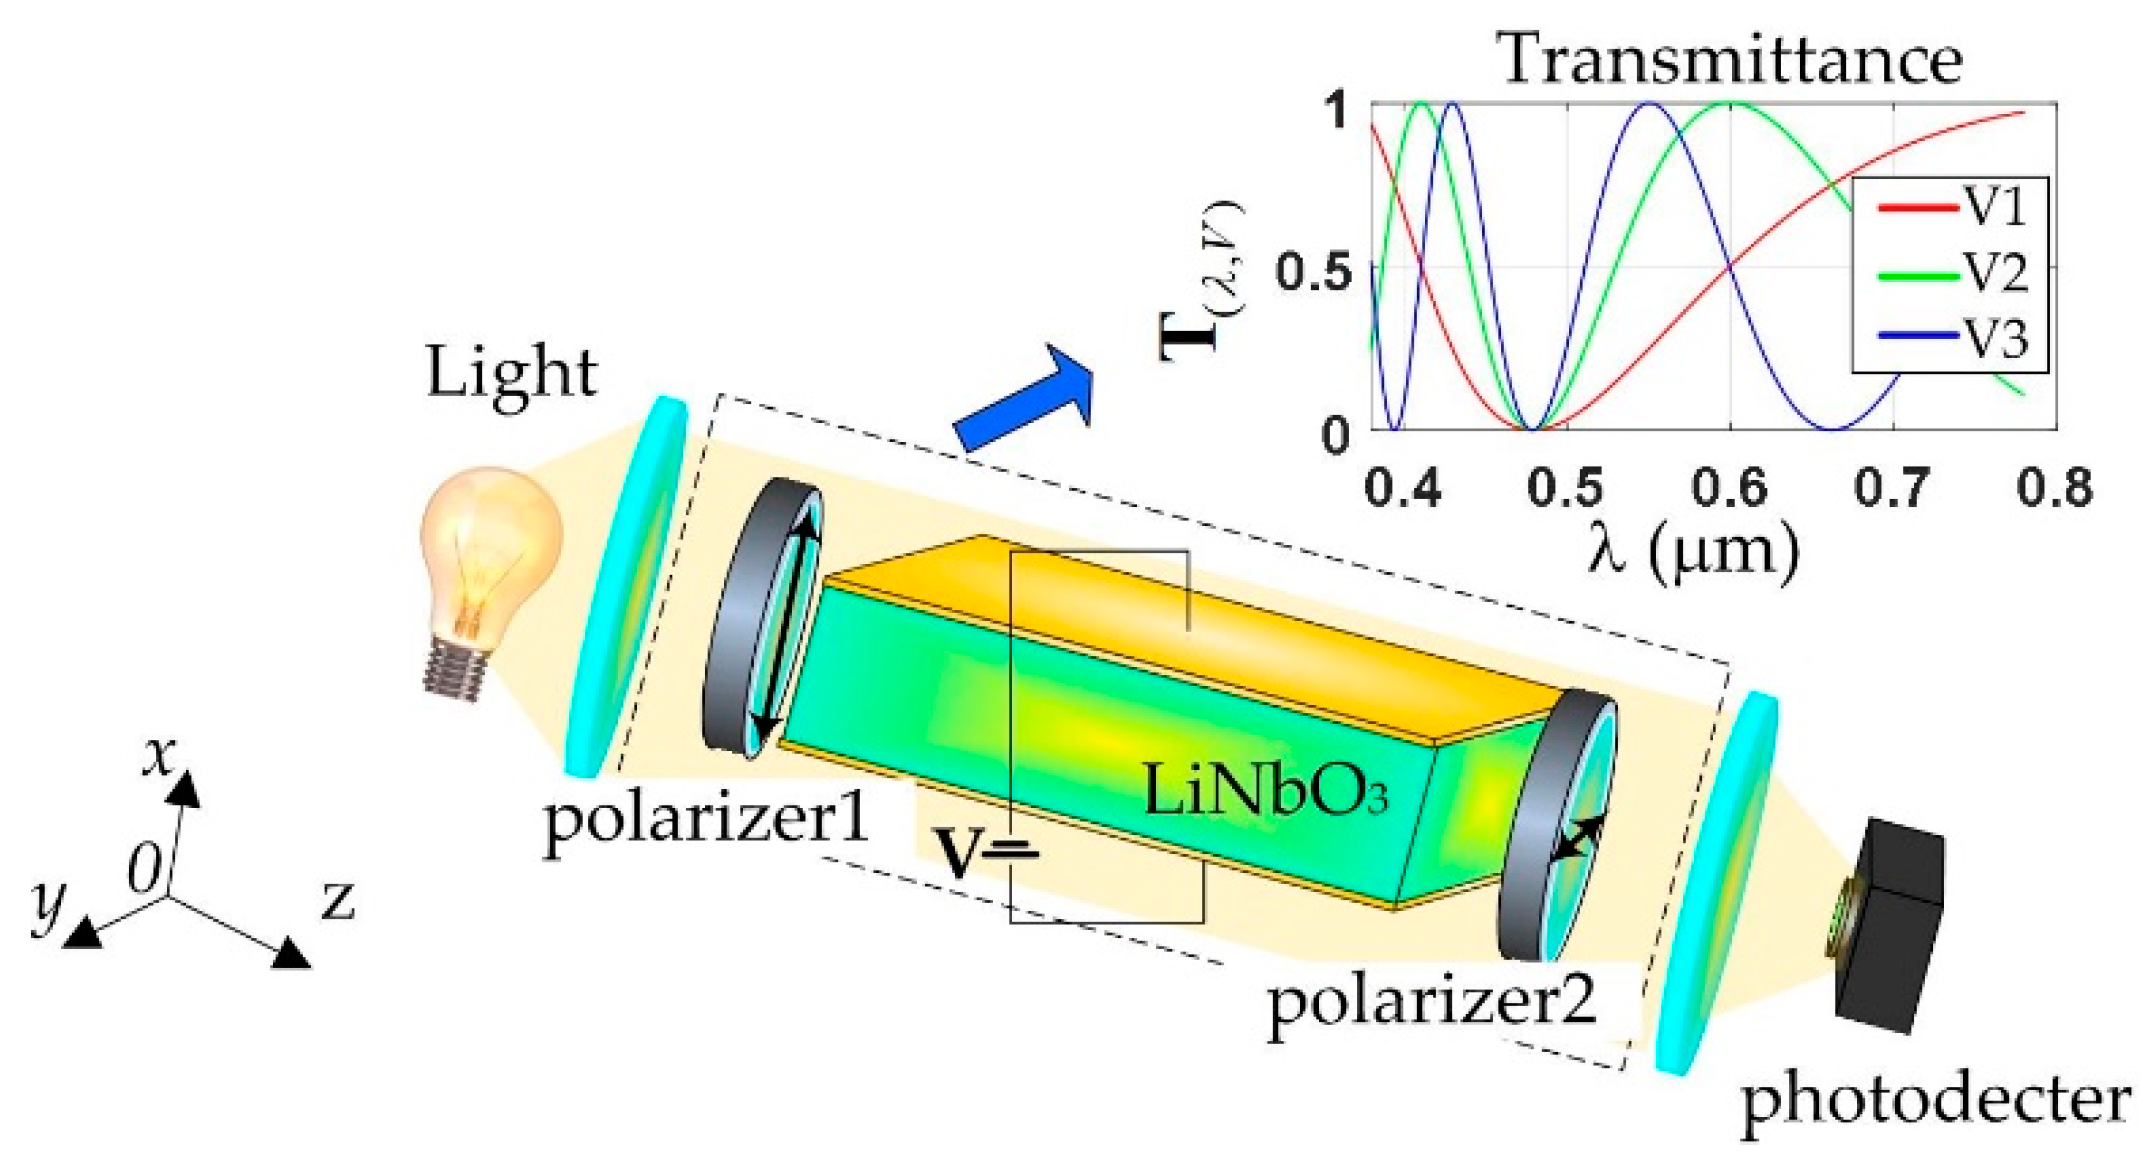
Coding compression measurements are necessary processes in compressed sensing spectrometry. Compared with transmittance control devices, such as LCVR, FP or films, this study proposes the transverse electro-optic modulation of LiNbO
3 to realize transmittance control coding. The basic principle is shown in
Figure 1. A X-cut LiNbO
3 electro-optic crystal is the key component of the coding modulator. Herein, incident light passes along the optical axis (
z-axis), and the driving electric field is applied along the
x-axis, which is perpendicular to the light direction. The electro-optic device is placed between two polarizers with orthogonal transmittance axes. The intensity of incident light is regulated, which presents transmittance regulation, and realizes intensity coding in the spectral dimension.
In
Figure 1, two transverse refractive index axes of the LiNbO
3 electro-optic crystal are formed at 45° around the X axis under the action of an electric field, and the value of the crystal’s refractive index changes according to the applied electric intensity. When the incident light passes through the electro-optical coding modulator between the polarizers, the optical transmittance can be described as [
15]
where,
λ is the wavelength of the incident light;
V is the voltage of the external electric field applied to the electro-optical transmittance coding modulator;
and
are the light intensity before and after passing through the modulator, respectively;
is the phase retardation of two polarization components in the LiNbO
3 electro-optic crystal, and it changes with the change of the refractive index, which can be expressed as [
16]
where,
and
are the length of the crystal in the
x-axis and
z-axis, respectively. The electric field applied in the x-direction is directly proportional to the voltage
V. According to Equations (1) and (2), when the size of the LiNbO
3 crystal is optimally designed, the spectral transmittance can be determined by the external electric field voltage
V only. Therefore, the transmittance can be regulated by the modulator with different external electric field voltages. Multiple and different transmittance peaks can appear in the entire spectral range, and different external electric field voltages can realize the separation of transmittance peak wavelengths and the least overlap. This condition is conducive to the realization of compressed sensing spectrum measurements. As shown in
Figure 1, the detector detected the light intensity each time, which is regulated by the electro-optic modulator. Each circumstance constitutes a special coding measurement in the process, and it can be described as
is the spectral power distribution of the incident light. To perform compressed spectrum measurement analysis and inversion reconstruction, the light intensities detected by the detector are recorded in a series of discrete values. The measurement process is described in a matrix form as follows.
The spectral signal is represented by
x, and the number of spectral channels is set to
N such that
x meets
. Multiple measured spectral signals are represented by
y, and the number of measurements is set to
M such that
y meets
. For compressed sensing measurements,
M is much less than
N. The point is that the coding measurement matrix
(
) must be optimally designed to ensure that it is irrelevant as far as possible. By combining Equations (1) and (2), the design and implementation of
can be achieved by coding the spectral transmittance via the external electric field voltage.
composed of different spectral transmittance coding can be further described as
For the
N spectrum channels,
M external electric field voltages are used to obtain the compressed sensing measurement data, where M << N, as shown in
Figure 2.
The measurement matrix in Equation (5) is particularly similar to the partial Fourier matrix in the typical compressed sensing measurement matrix. Each element of is , where is determined by the optical path difference induced by the LiNbO3 electro-optic crystal. This parameter can be randomly selected after the transmittance calibration experiment is carried out. From the calibration results, the most uncorrelated transmittance under M external electric field voltages is selected, and M highly uncorrelated compressed sensing measurements can be realized.
Most of the spectral signals are sparse. The sparsity for the
N channels spectral signals can be expressed as
.
is the K-sparse vector of spectral signals (including K <<
N non-zero elements), and
is the sparse matrix. Equation (4) can be rewritten as
where
A is the sensing matrix, this is,
. For continuous spectral signals, mathematical transformations such as FFT, DCT and the wavelet basis or learning dictionary can be applied to the sparsity of spectral signals [
7]. Thus, the sparse matrix
, combined with the coding measurement matrix
, can be used to determine the sensing matrix
A. Therefore, with the compressed sensing measurement signals
y and after solving the inverse problem of Equation (6) and the optimal spectral sparse signal,
can be solved.
where,
r is a regularization parameter. The spectrum signal can be recovered from the sparse signal
.
3. Experiment
According to
Figure 1, a compressed sensing spectrometry system is built, as shown in
Figure 3. The size of the LiNbO
3 electro-optic crystal (
LX,
Ly,
LZ) is selected as 2 mm × 4 mm × 40 mm, the light passing surface is the
xoy plane, and the size is 2 mm × 4 mm. The distance the light travelled is 40 mm. The LiNbO
3 electro-optic crystal (provided by Shanghai Institute of Optics and Fine Mechanics, Chinese Academy of Sciences) was grown by the Czochralski method. Its absorption loss is less than 0.1%. The dimensional tolerance of the crystal is ±0.1 mm. To uniformly apply the driving voltage to the LiNbO
3 electro-optic crystal plate, a 30 μm thick aluminum film was plated on the two main sections of the crystal plate—
yoz plane. The aluminum film serves as the electrode layer and can evenly distribute the applied voltage on the electrode surface and form a uniform electric field in the LiNbO
3 electro-optic crystal plate. The electric field is provided by a high voltage driving circuit made by ourselves, and the driving circuit is composed primarily of an FPGA and an LC circuit. The FPGA provides a 1 kHz frequency of sinusoidal AC driving control voltage, and the magnitude of the driving voltage can be more than 2000 V resonantly amplified by the LC circuit. The voltage will choose all the values in the range of 0–2000 v within 0.25 ms in 1/4 cycles.
The polarizers are uncoated calcite Gran Taylor polarizers, the light transmission range is 0.35~2.3 μm, and the extinction ratio is up to 105:1. The light transmission aperture is 5 mm × 5 mm, which not only meets the light transmission requirements, but also reduces the volume of the spectrum measurement optical system as much as possible. The silicon-based amplified photodetector PDA10 A2 produced by Thorlabs company, with a wavelength response range of 0.2~1.1 μm and a measurement bandwidth response of DC-150 MHz was selected for photoelectric detection. Both collimating lens f1 and converging lens f2 are K9 glass flat convex lenses, with a focal length f = 6 mm and diameter D = 6 mm. Optical input and output interfaces are equipped with an optical fiber FC/PC adapter. Throughout the entire spectrometry system, the light to be measured is coupled by optical fiber and collimated into parallel light via the collimating lens f1; subsequently, the incident light is collimated into the LiNbO3 electro-optical transmittance coding modulator composed of polarizer1, the LiNbO3 electro-optic modulator, and polarizer2. The encoded optical signal is concentrated and emitted through converging lens f2, and finally detected by the photodetector. The dimensions of the entire spectrometry system are only 30 mm × 30 mm × 90 mm.
To verify the feasibility of this scheme, the system was selected to be operated in the visible light range of 0.38–0.78 μm. After the optical transmittance coding was calibrated, the compressed sensing spectrum measurement experiment was performed.
3.1. Transmittance Coding Experiment
A halogen tungsten lamp was used as the light source, and the LiNbO
3 electro-optic modulator was driven by a DC high voltage to calibrate the transmittance. In the calibration experiment, the voltage increases from 0 to 2000 V in step of 1 V. The partial spectral transmittance calibration results were selected and recorded, as shown in
Figure 4.
The calibration results in
Figure 4 reveal that the transmittance can be flexibly adjusted according to the driving voltage, and the number of peaks in the spectral transmittance increases when increasing the driving voltage. Multiple and different transmittance peaks were achieved. This provides sufficient elements to construct the coding measurement matrix
. The sequential forward floating selection (SFFS) algorithm was employed to select the most irrelevant transmittance from the values of spectral transmittance regulation to form the coding measurement matrix
and realize spectral transmittance coding [
17]. The correlation coefficient (
) is regarded as the characteristic criterion (
J) for selecting the elements of the matrix
, and the criterion (
J) is
. The spectral transmittance with measurement times from 2 to 200 form the electro-optical transmittance coding measurement matrix
. Their characteristic criterion (
J) was obtained and is shown in
Figure 5.
Note that
M external electric field voltages must be measured to realize an uncorrelated coding measurement matrix
to meet the non-correlation as much as possible. As shown in
Figure 5, before 30 measurements, the correlation coefficient of the matrix
changes considerably with an increase in the number of measurements. When the number of measurements increases from 30 to 50, the change is gradual. In addition, the correlation of the measurement matrix changes negligibly, for more than 50 measurements.
3.2. Compressed Sensing Spectrum Measurement Experiment
The built compressed sensing spectrometry system was used to measure the blue, green, and red LED light sources. The FPGA provides a sinusoidal AC driving control voltage source, and simultaneously collects the driving voltage signal and measured spectrum signals. For the blue LED light sources, as shown in
Figure 6, the non-correlation measurement with transmittance coding is adopted. The measurement data collected by the detector under different driving voltages are shown in
Figure 6b. To solve the minimization problem in Equation (7), a sparsity adaptive matching pursuit (SAMP) solver was used [
18]. Further, the sparse matrix Ψ was set as wavelet transform-db4, which exhibits good compressibility and reconstruction performance. The number of spectral bands are
N = 1024. The spectrum signal recovered using
M = 35 electro-optical transmittance coding compressed sensing measurements is shown in
Figure 6c.
Figure 6 shows that the measured spectral signals are different under the transmittance coding realized by different driving voltages, and the driving voltage of non-correlated measurements obtained using the SFFS algorithm is not selected at equal intervals. The original spectrum of the blue LED was also measured via a commercial spectrometer, Ocean Optics HR4000, a high-resolution optical fiber spectrometer with a resolution of 0.2 nm. The experimental results of the measurement methods agree well. Additionally, the reconstruction spectrum was also obtained using different numbers of measurements from 20 to 100, and the spectral reconstruction accuracy can be calculated using the reconstruction relative error defined as
According to
Figure 6d, the relative error does not exceed 3.69% when the measurements number reaches 35. The spectral measurements and reconstruction results of green LED and red LED light sources were recorded concurrently for M = 35 measurements, as shown in
Figure 7.
The spectral measurement reconstruction results of LED light sources reveal that the compressed spectral measurement results obtained using our method are in good agreement with the measurement results of the commercial spectrometer HR4000. The reconstruction relative errors of blue, green, and red LED according to Equation (8) are recorded in
Table 1.
The experimental results of the LED light sources verify that compressed spectrum measurement with the electro-optical transmittance coding method can achieve high-precision spectrum reconstruction and measurements. Moreover, a narrow linewidth semiconductor laser with a center wavelength of 660 nm and line width of 0.06 nm is used to test the resolution of the method. In the experiment, the number of measurements is also
M = 35 and the number of reconstructed spectral data is
N = 1024. The experimental results are shown in
Figure 8.
As shown in
Figure 8, the relative error of laser spectral reconstruction is 7.20%. The full width at half maximum (FWHM) of the laser spectrum measured by the compressed sensing spectrum measurement system is 1.2 nm, which is slightly less than 0.8 nm of HR4000 measurements. This similarity further demonstrates that the FWHM of the spectrum measurement system designed in this paper is small. The system has a high spectral resolution, and the theoretical spectral resolution can reach approximately 0.4 nm for a wide spectral range (0.38–0.78 μm) with 1024 spectral channels. Further, the spectrum of the lighting fluorescent lamp in the laboratory was measured. The experimental results are shown in the
Figure 9.
The experimental result exhibits good agreement with that of HR4000, and the relative error of spectral reconstruction is 7.65%, which further proves that the proposed spectral measurement system scheme produces high precision measurements and spectrum reconstructions.
4. Discussion
The experimental results of LED light sources demonstrate that the reconstruction relative error does not decrease for M = 35 measurements. The compressed sensing spectrometry method was manipulated in the visible light band of 0.38~0.78 μm for spectral N = 1024 channels; thus, the compressed ratio is M/N = 1:29, which indicates that the spectrometry achieves a high compressed ratio measurement. The compressed spectral measurement results exhibit good agreement with the results of the commercial spectrometer HR4000. The reconstruction relative error of LED light source is less than 3.79%, whereas the reconstruction relative errors of laser and fluorescent lamp spectrums are slightly more than double. This difference is primarily because laser and fluorescent lamp spectrums have narrower spectral bands compared with the LED light spectrum. Nevertheless, the relative errors are maintained in the order of 10−2; thus, their reconstruction accuracy is high.
The FWHM of the spectral measurement is as high as 1.2 nm, which is slightly more than 0.8 nm of the HR4000 measurement. Furthermore, the spectral resolution can reach approximately 0.4 nm in the visible light band range (0.38~0.78 μm) with 1024 spectral channels. For comparison, performance of several reported methods were listed in
Table 2. Hence, the proposed scheme can achieve more hyperspectral resolution measurements with less measurements. In addition, there are no moving elements in our optical system, and the LiNbO
3 electro-optic crystal has good temperature stability, thus the spectrometry method is not affected by the temperature change and vibration interference.
The LiNbO3 electro-optical transmittance coding modulator has a wide allowable light transmission range of 0.35~5 μm, the detection spectral range can be prolonged to near infrared or shortwave infrared regions. Moreover, the measurement of the compressed spectral signal is completed within 1/4 cycles of the driving voltage of the electro-optic modulator, and the signal measurement time does not exceed 0.25 ms, which is better than the minimum integration time of 4 ms of HR4000. Thus, the proposed method realizes fast and wide spectral range hyperspectral resolution measurements. The size of the LiNbO3 electro-optic crystal (LX, Ly, LZ) was selected as 2 mm × 4 mm × 40 mm in this paper. To ensure sufficient beam aperture and the uniformity of the driving electric field, it is best to set the light passing area (xoy plane) to 2 mm × 4 mm. It is appropriate to set the length of crystal (LZ) to 20 mm to 60 mm. Significantly, the shorter the length is, the easier it is to align the optical path. While a higher driving voltage needs to be provided to obtain the irrelevant transmittance elements for the coding measurement matrix according to Equations (2) and (5).


