
Infrared Thermography to Evaluate Thermal Comfort under Controlled Ambient Conditions


Abstract
:1. Introduction
1.1. Skin Temperature
1.2. Assessing Thermal Comfort via IRT
1.3. Gap and Objective
2. Framework
2.1. Methodology
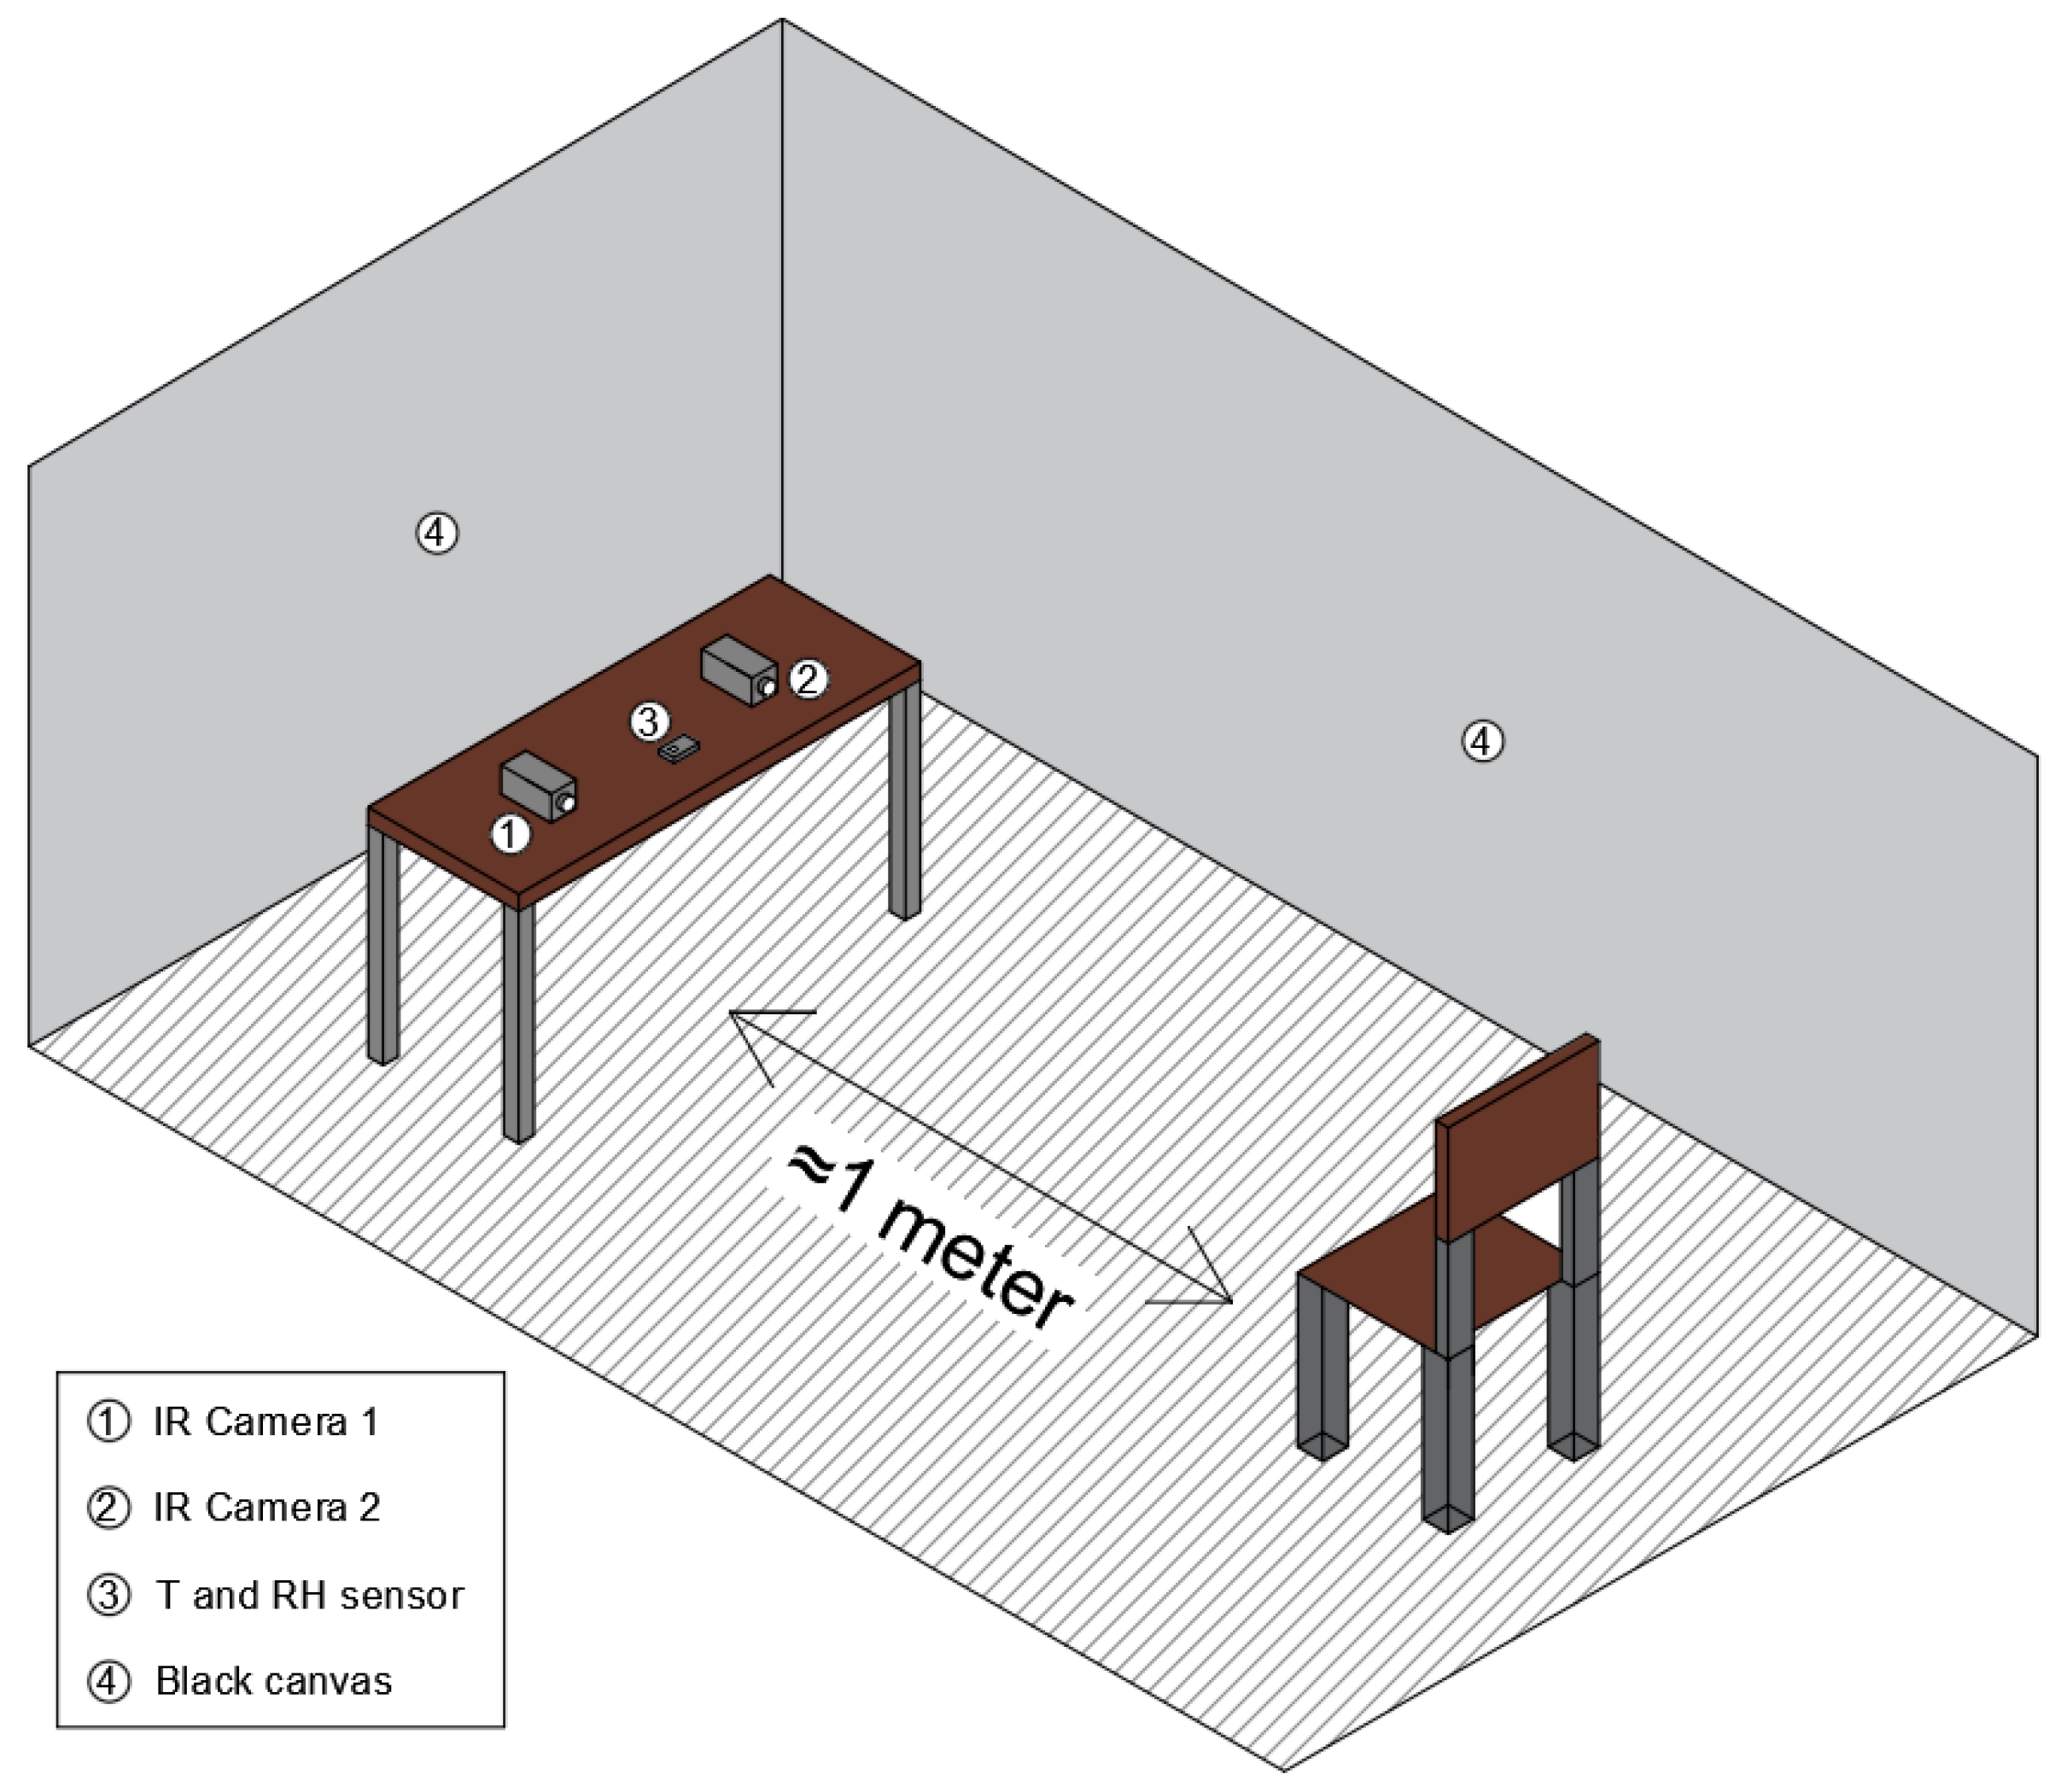
2.2. Equipment
2.3. Experimental Campaign
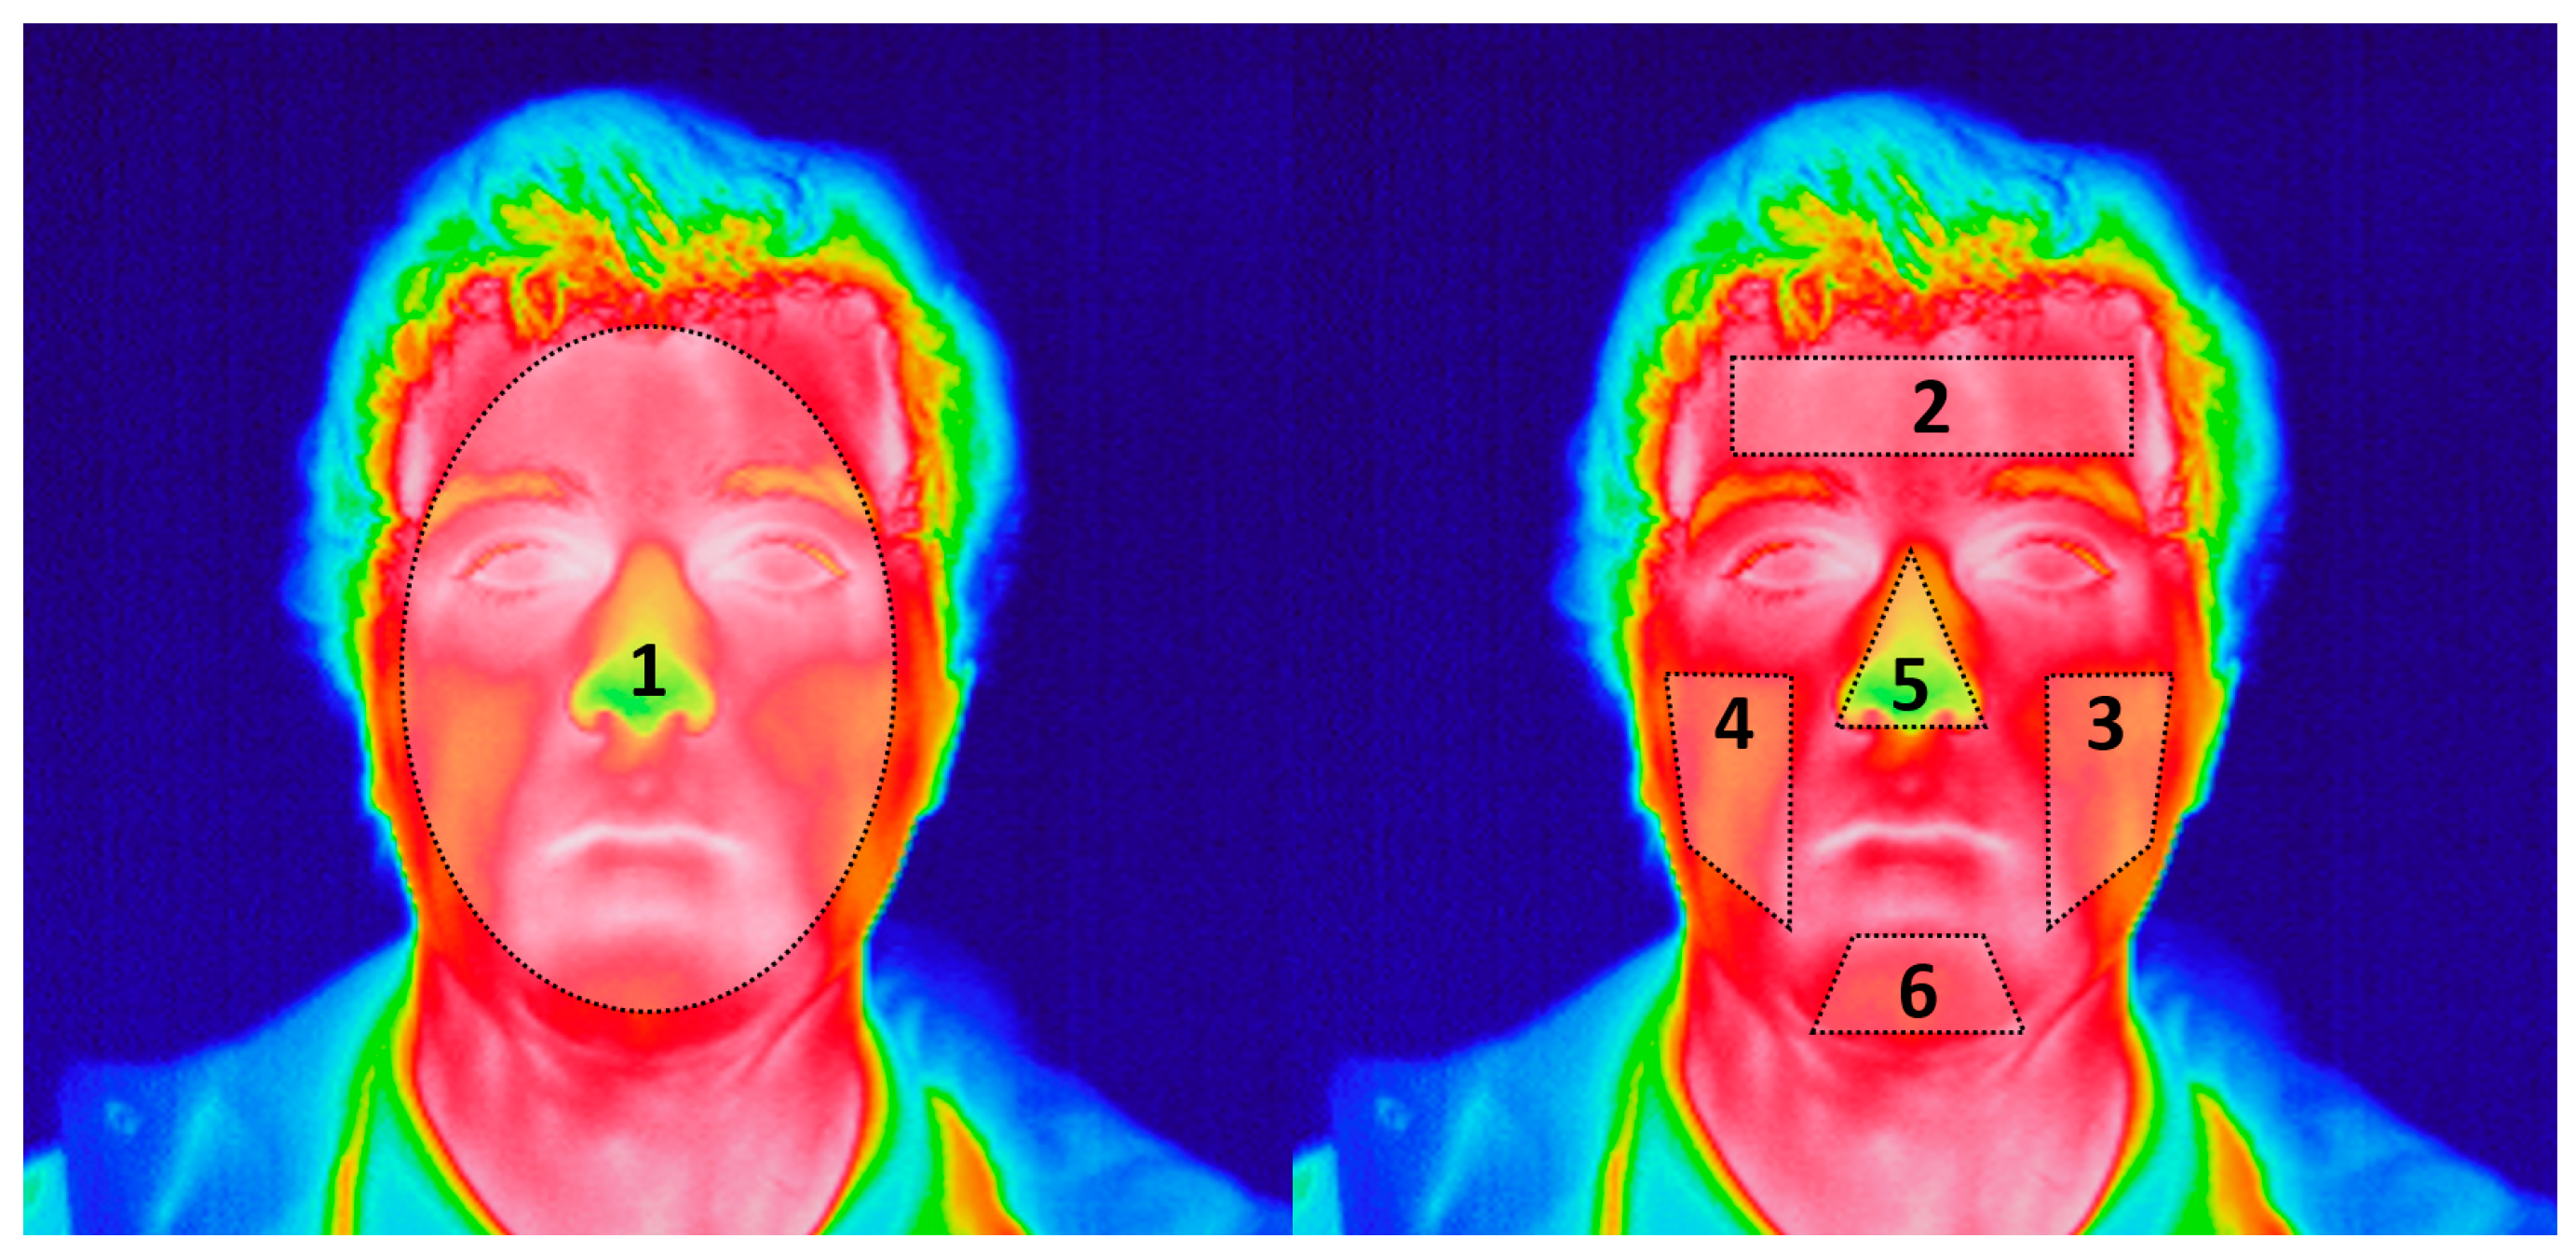
2.4. Data Analysis
2.4.1. Phase I: IR Camera Comparison
2.4.2. Phase II: Evaluation of Thermal Comfort
3. Results of Phase I: IR Camera Comparison
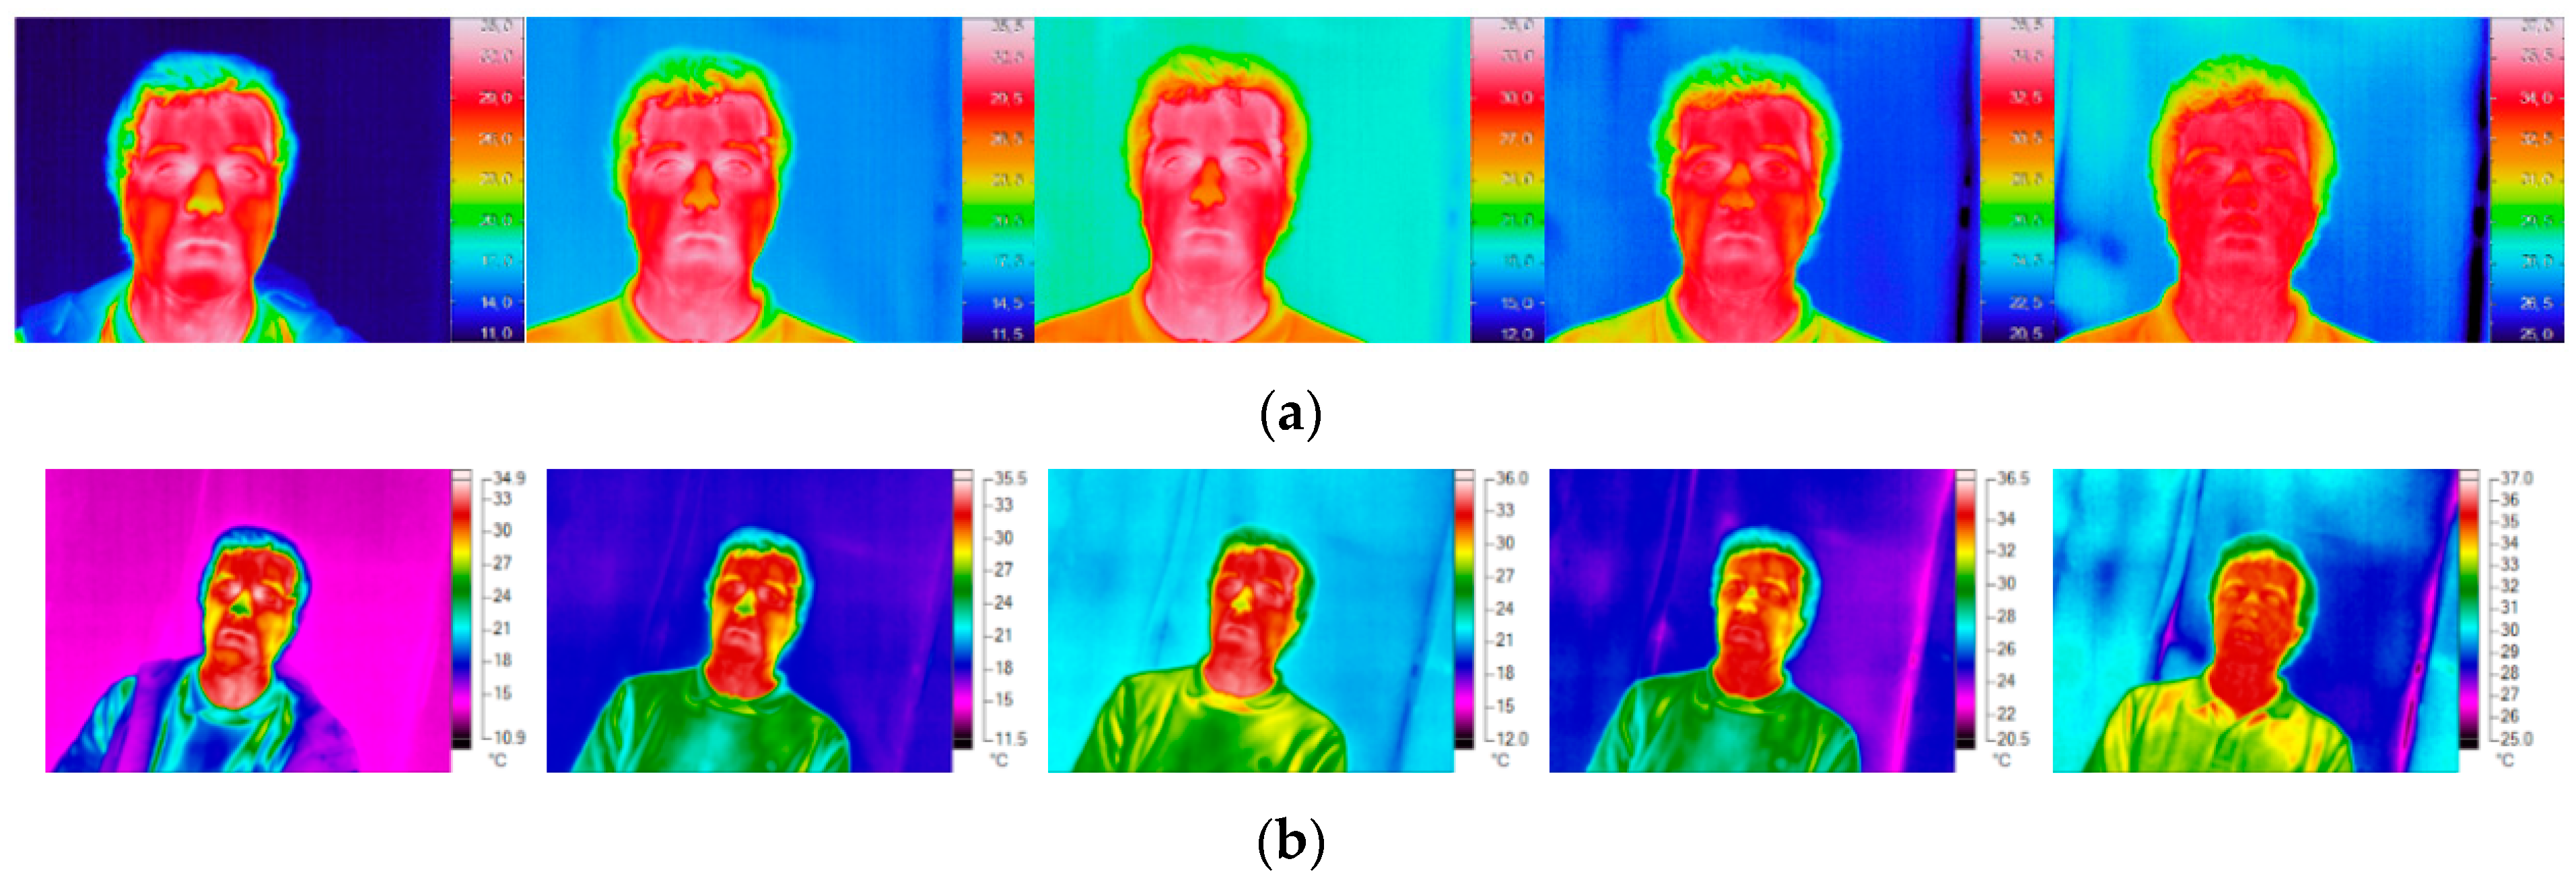
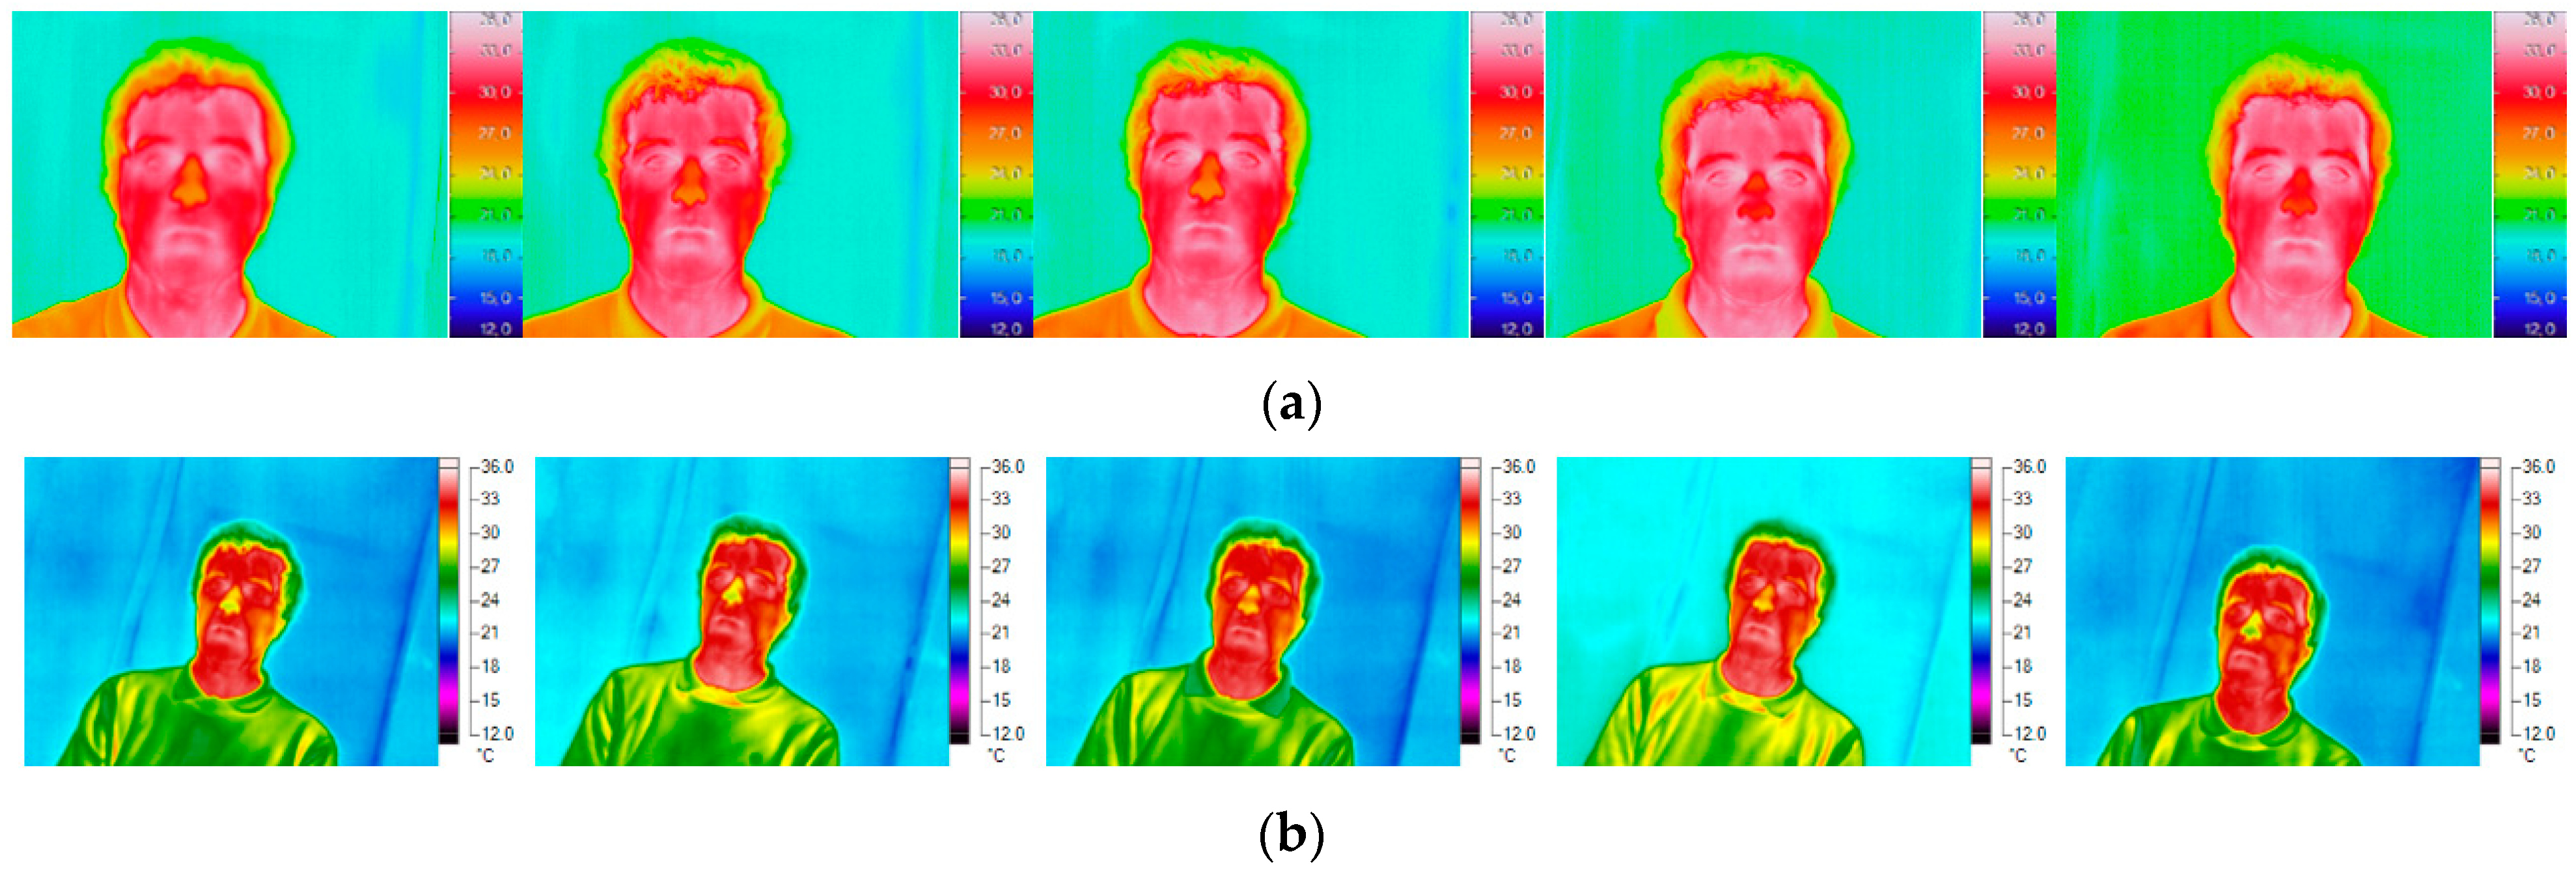
3.1. Qualitative Analysis
3.2. Quantitative Analysis
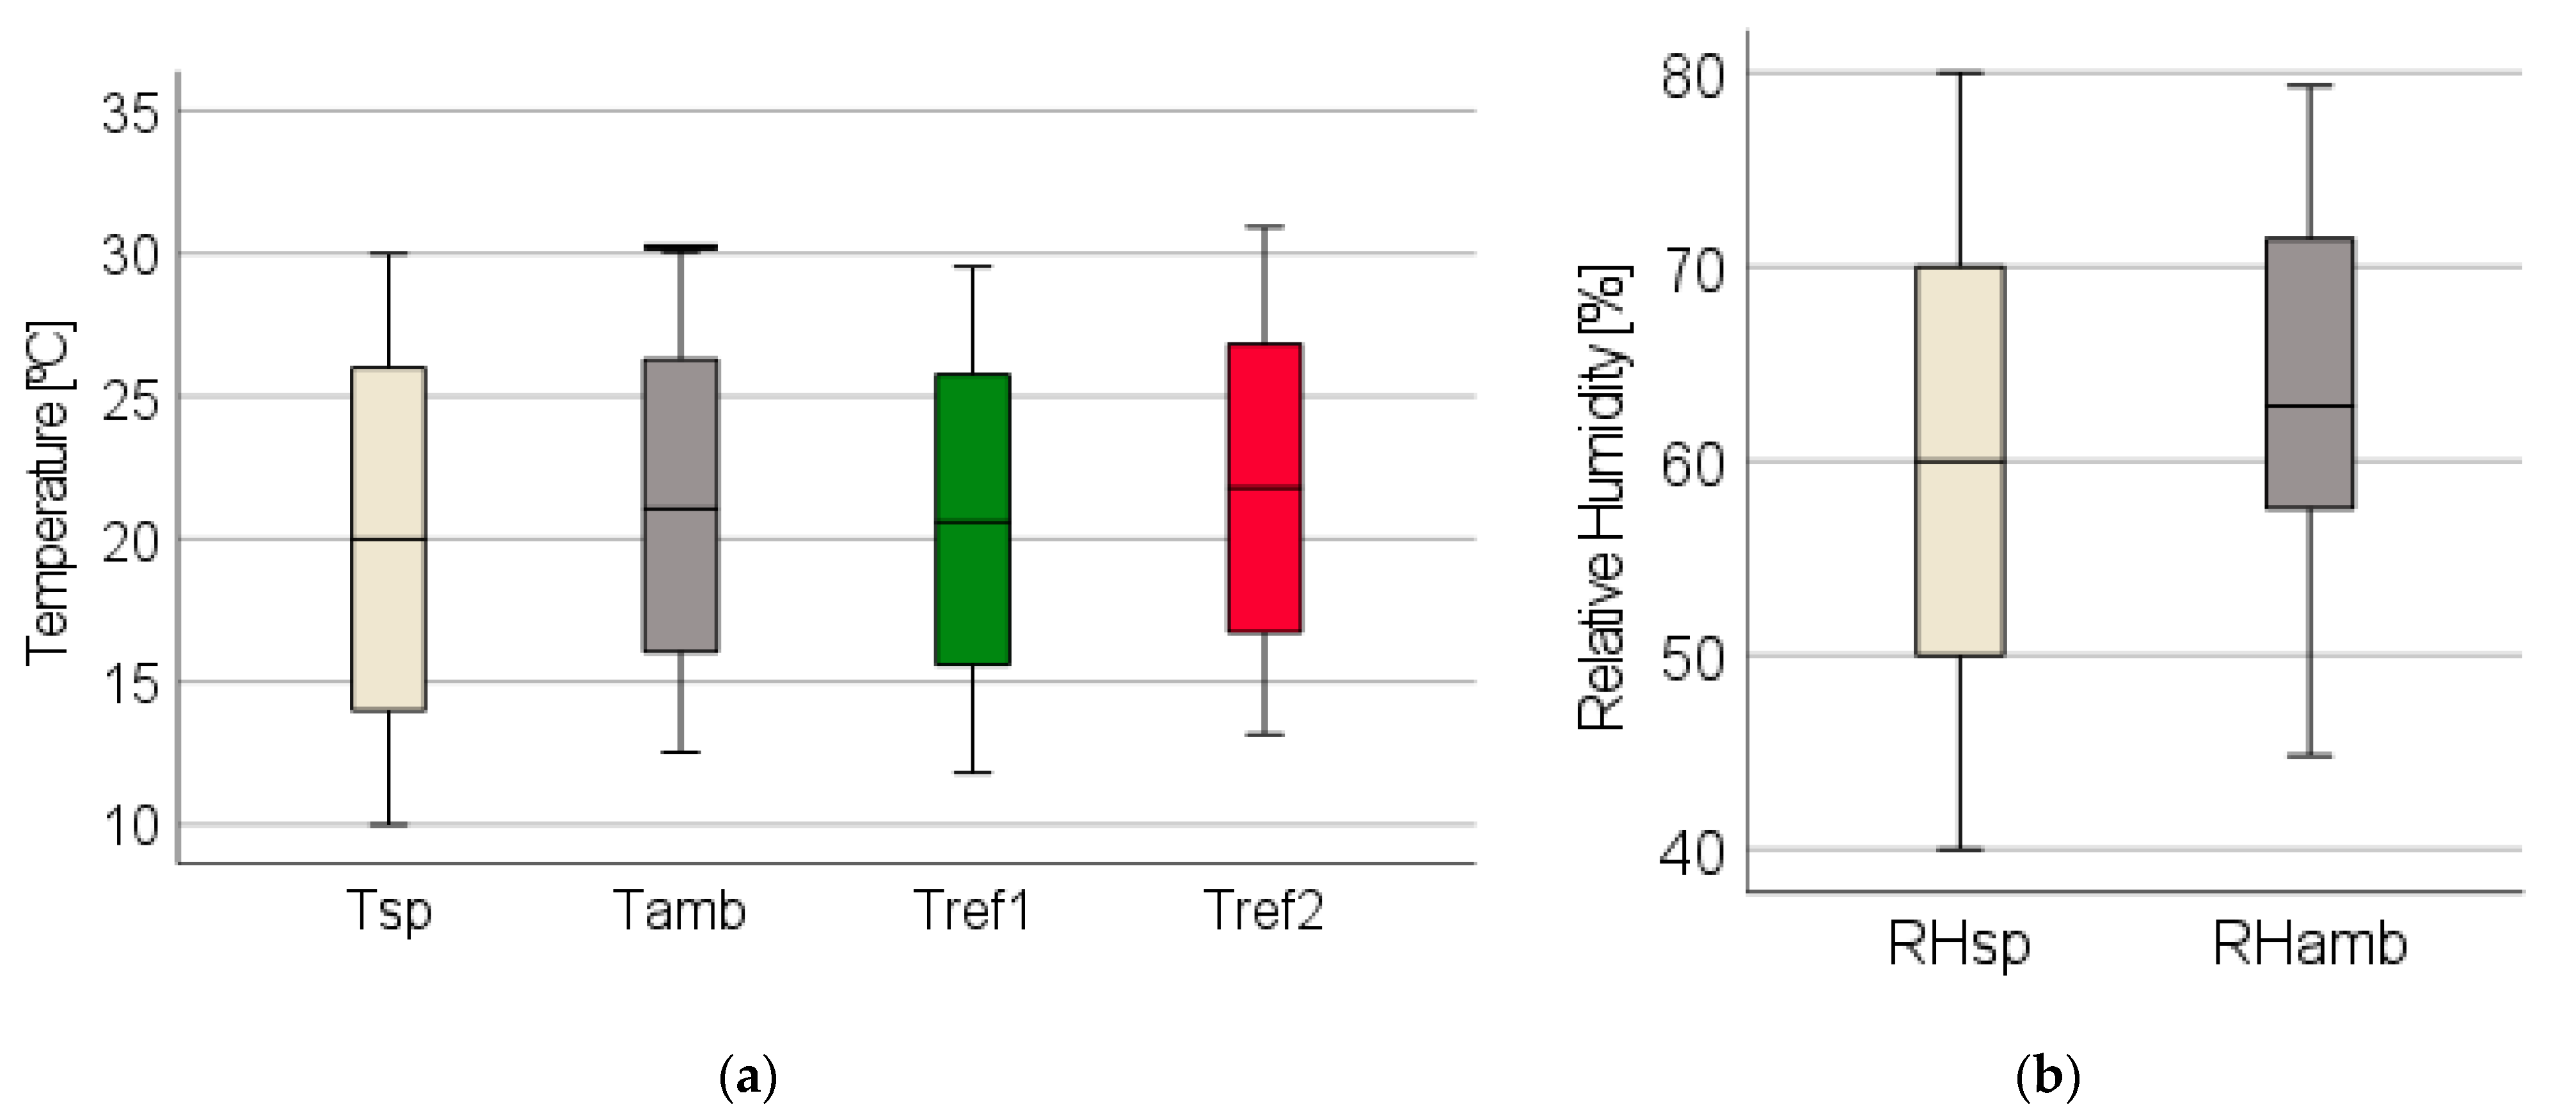
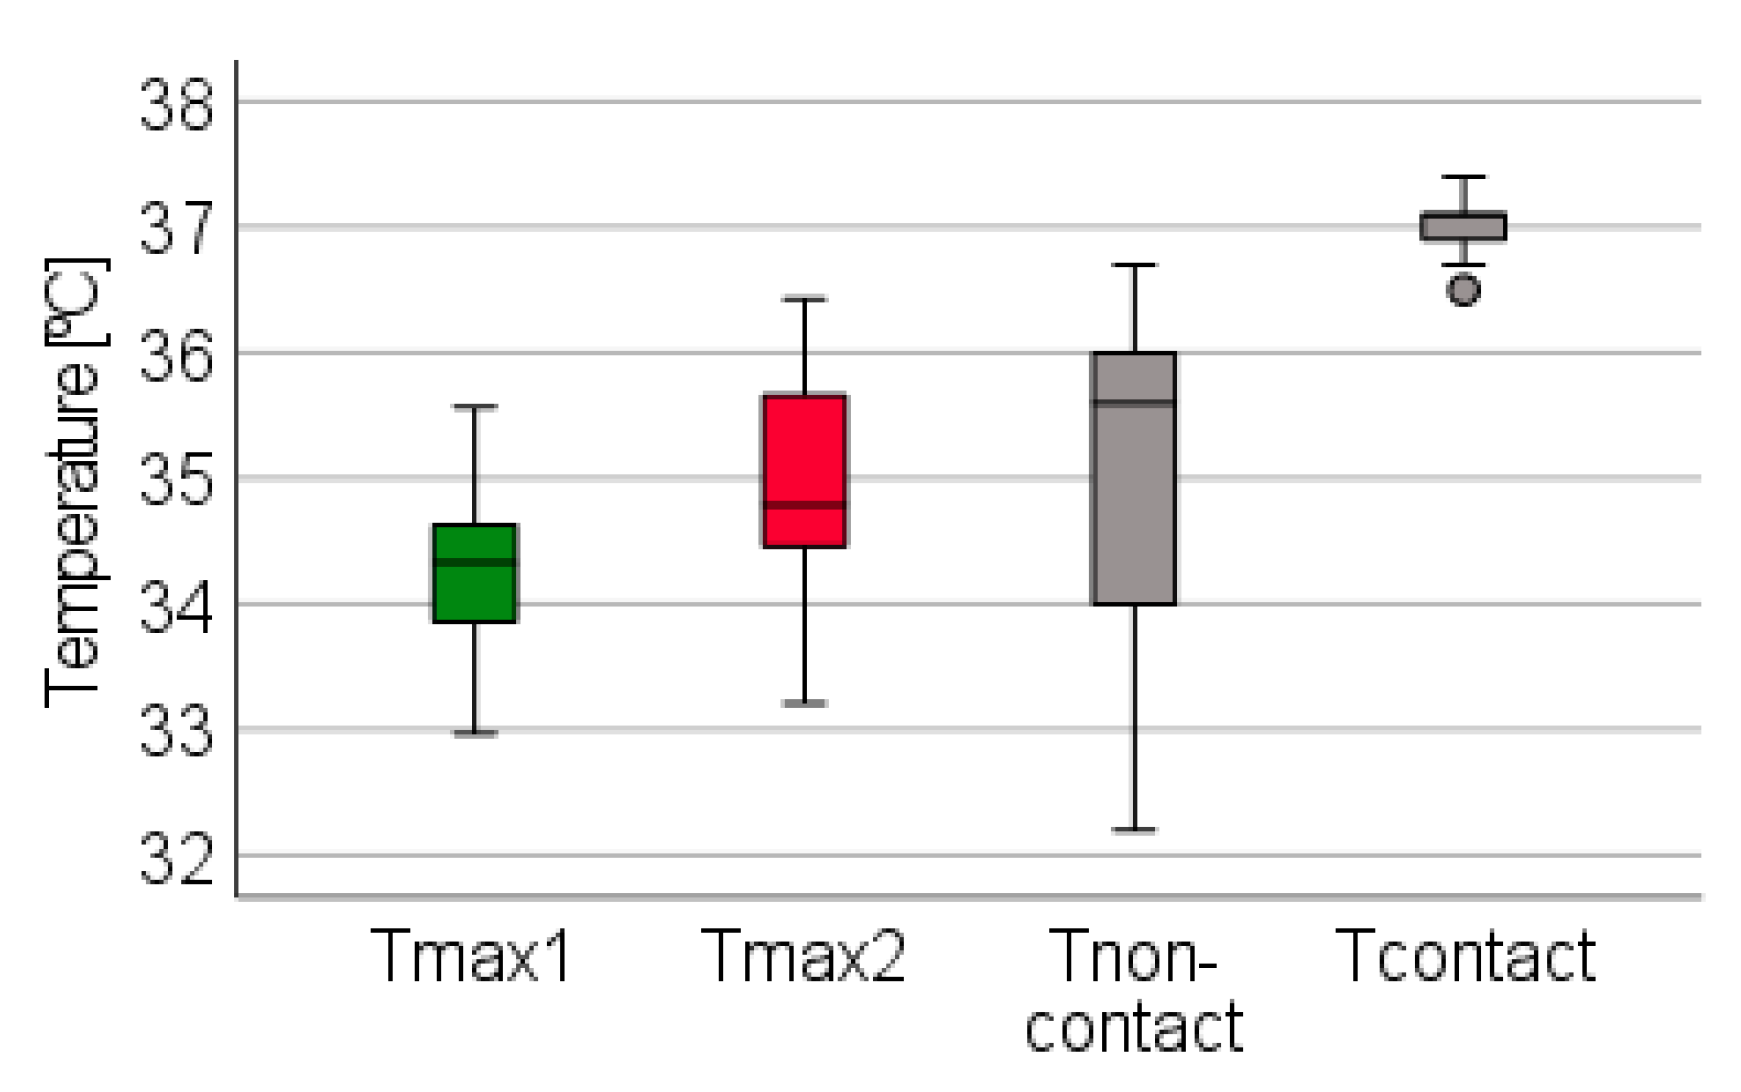
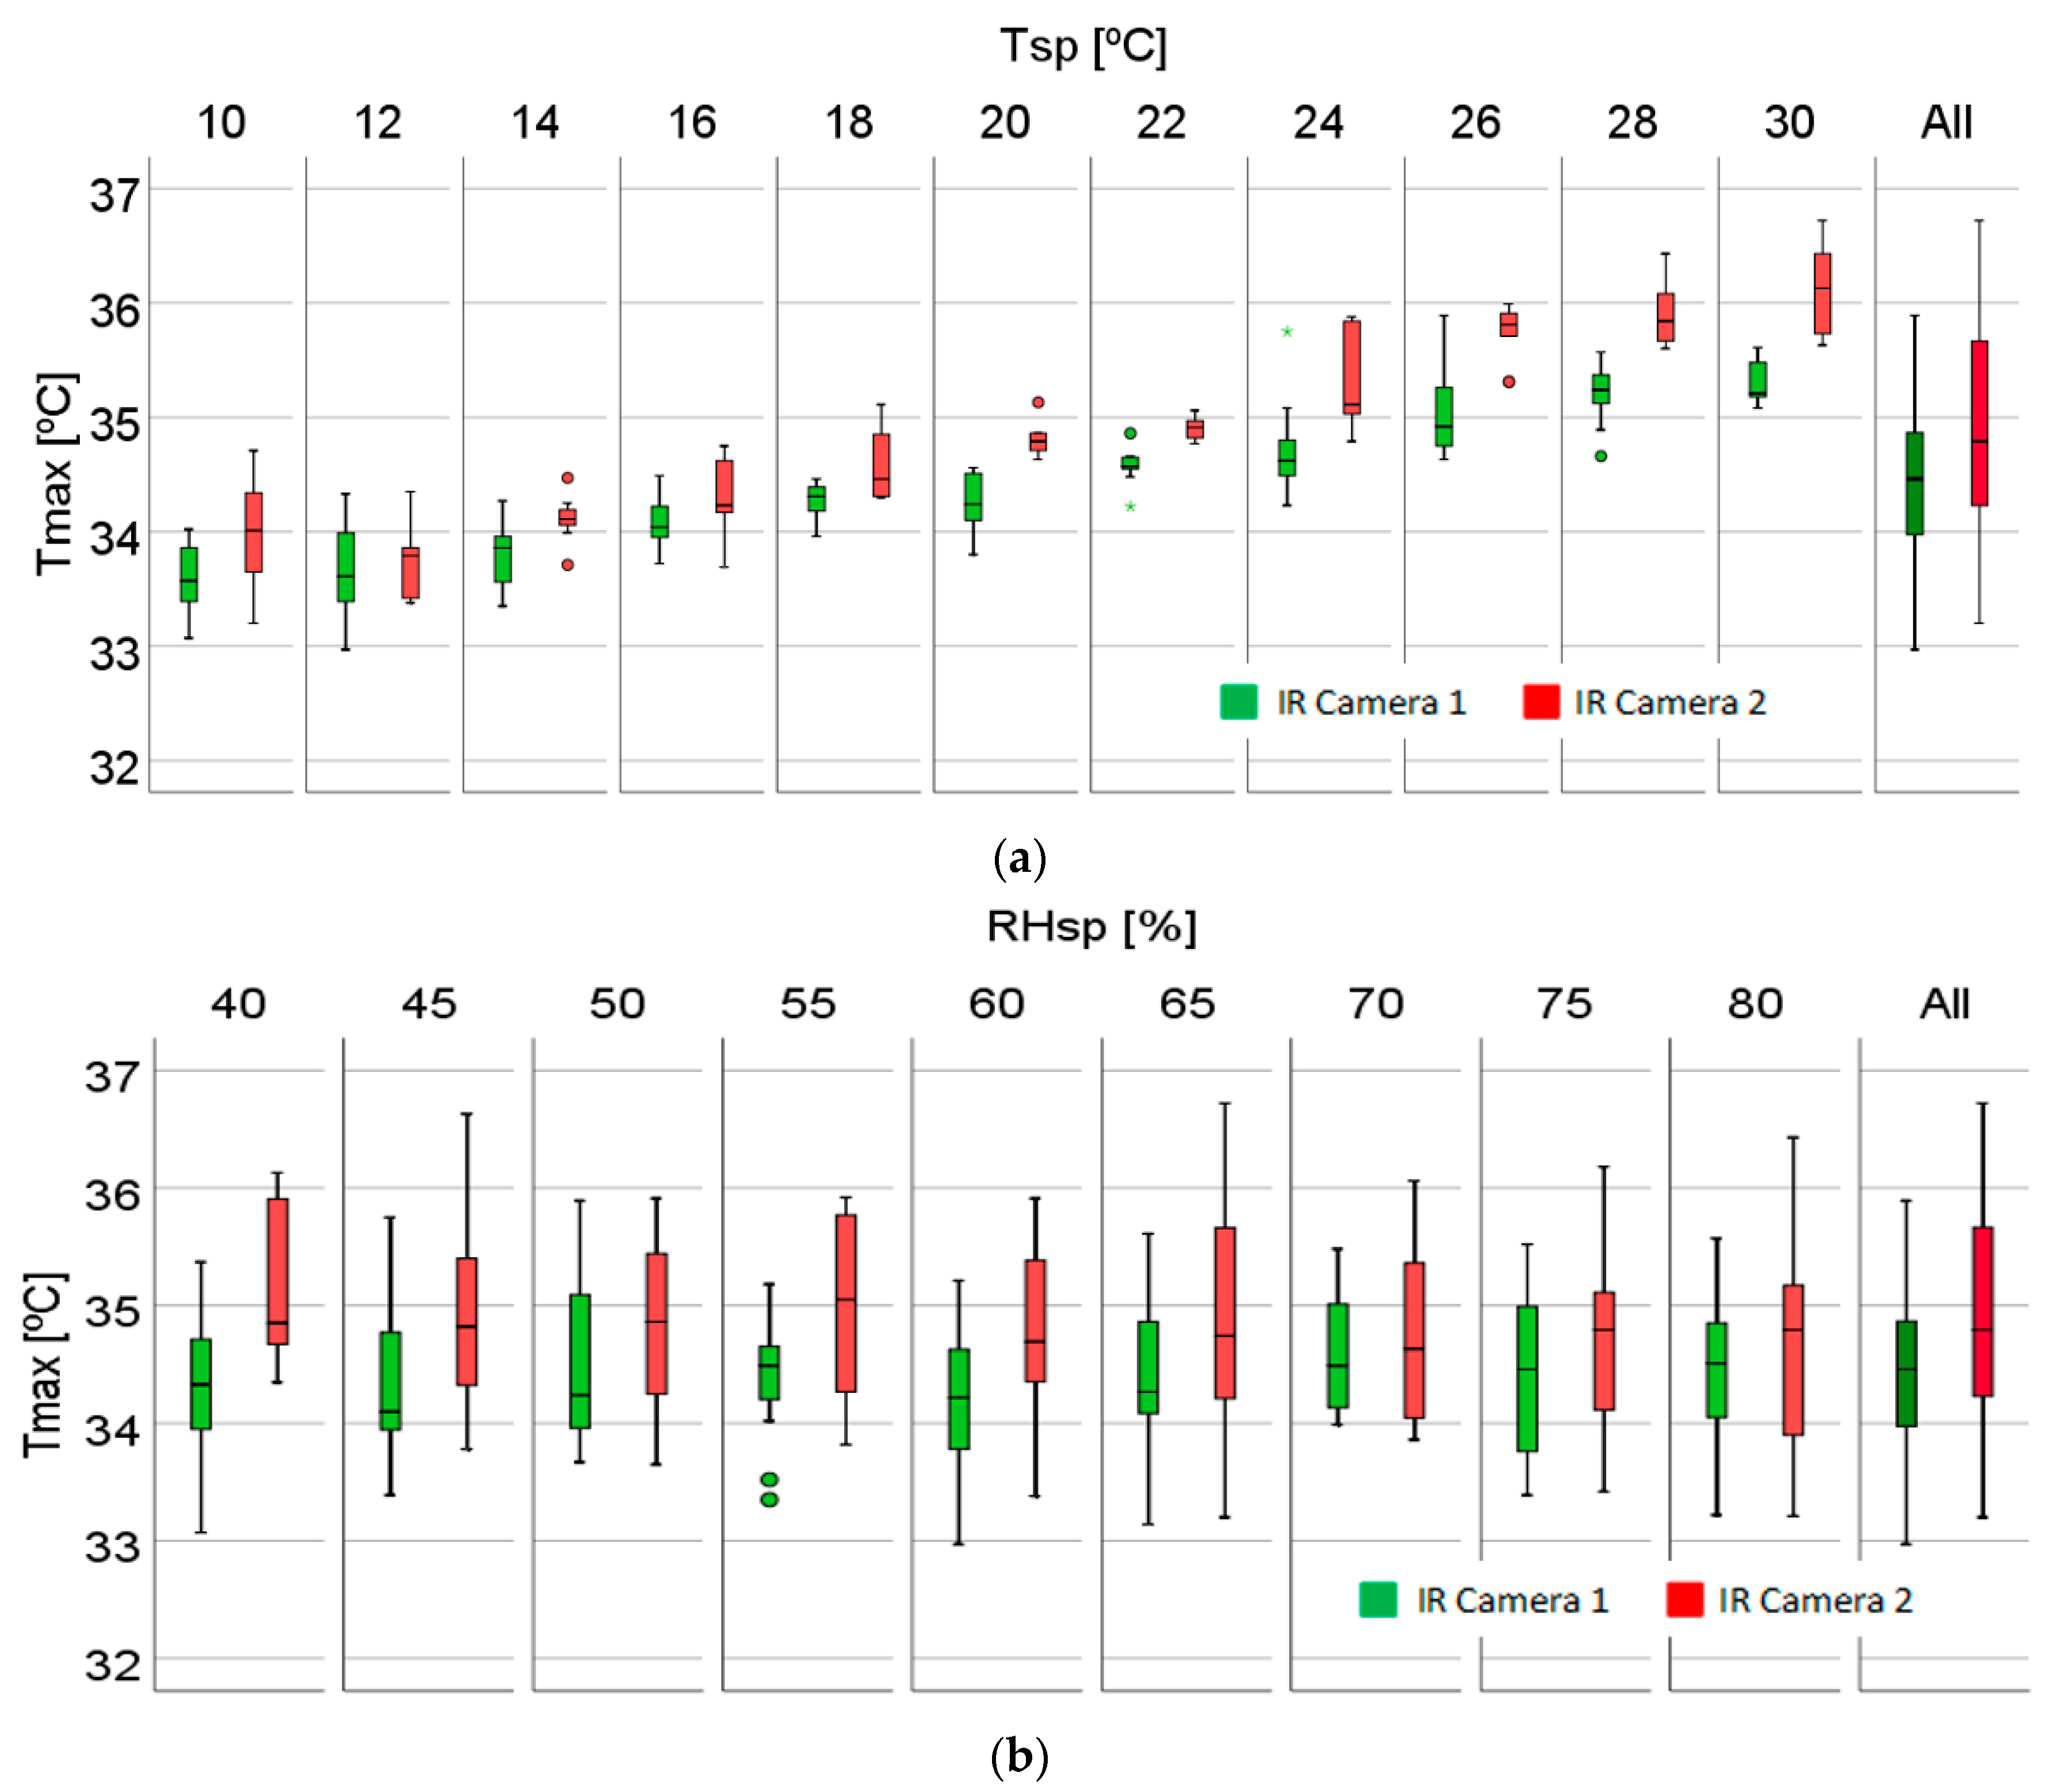
3.2.1. Impacts of the Ambient Conditions on the Superficial Temperature
3.2.2. Location of the Hottest Point
3.2.3. Statistical Analysis
4. Results of Phase II: Evaluation of Thermal Comfort
4.1. Temperature Variation within the Face
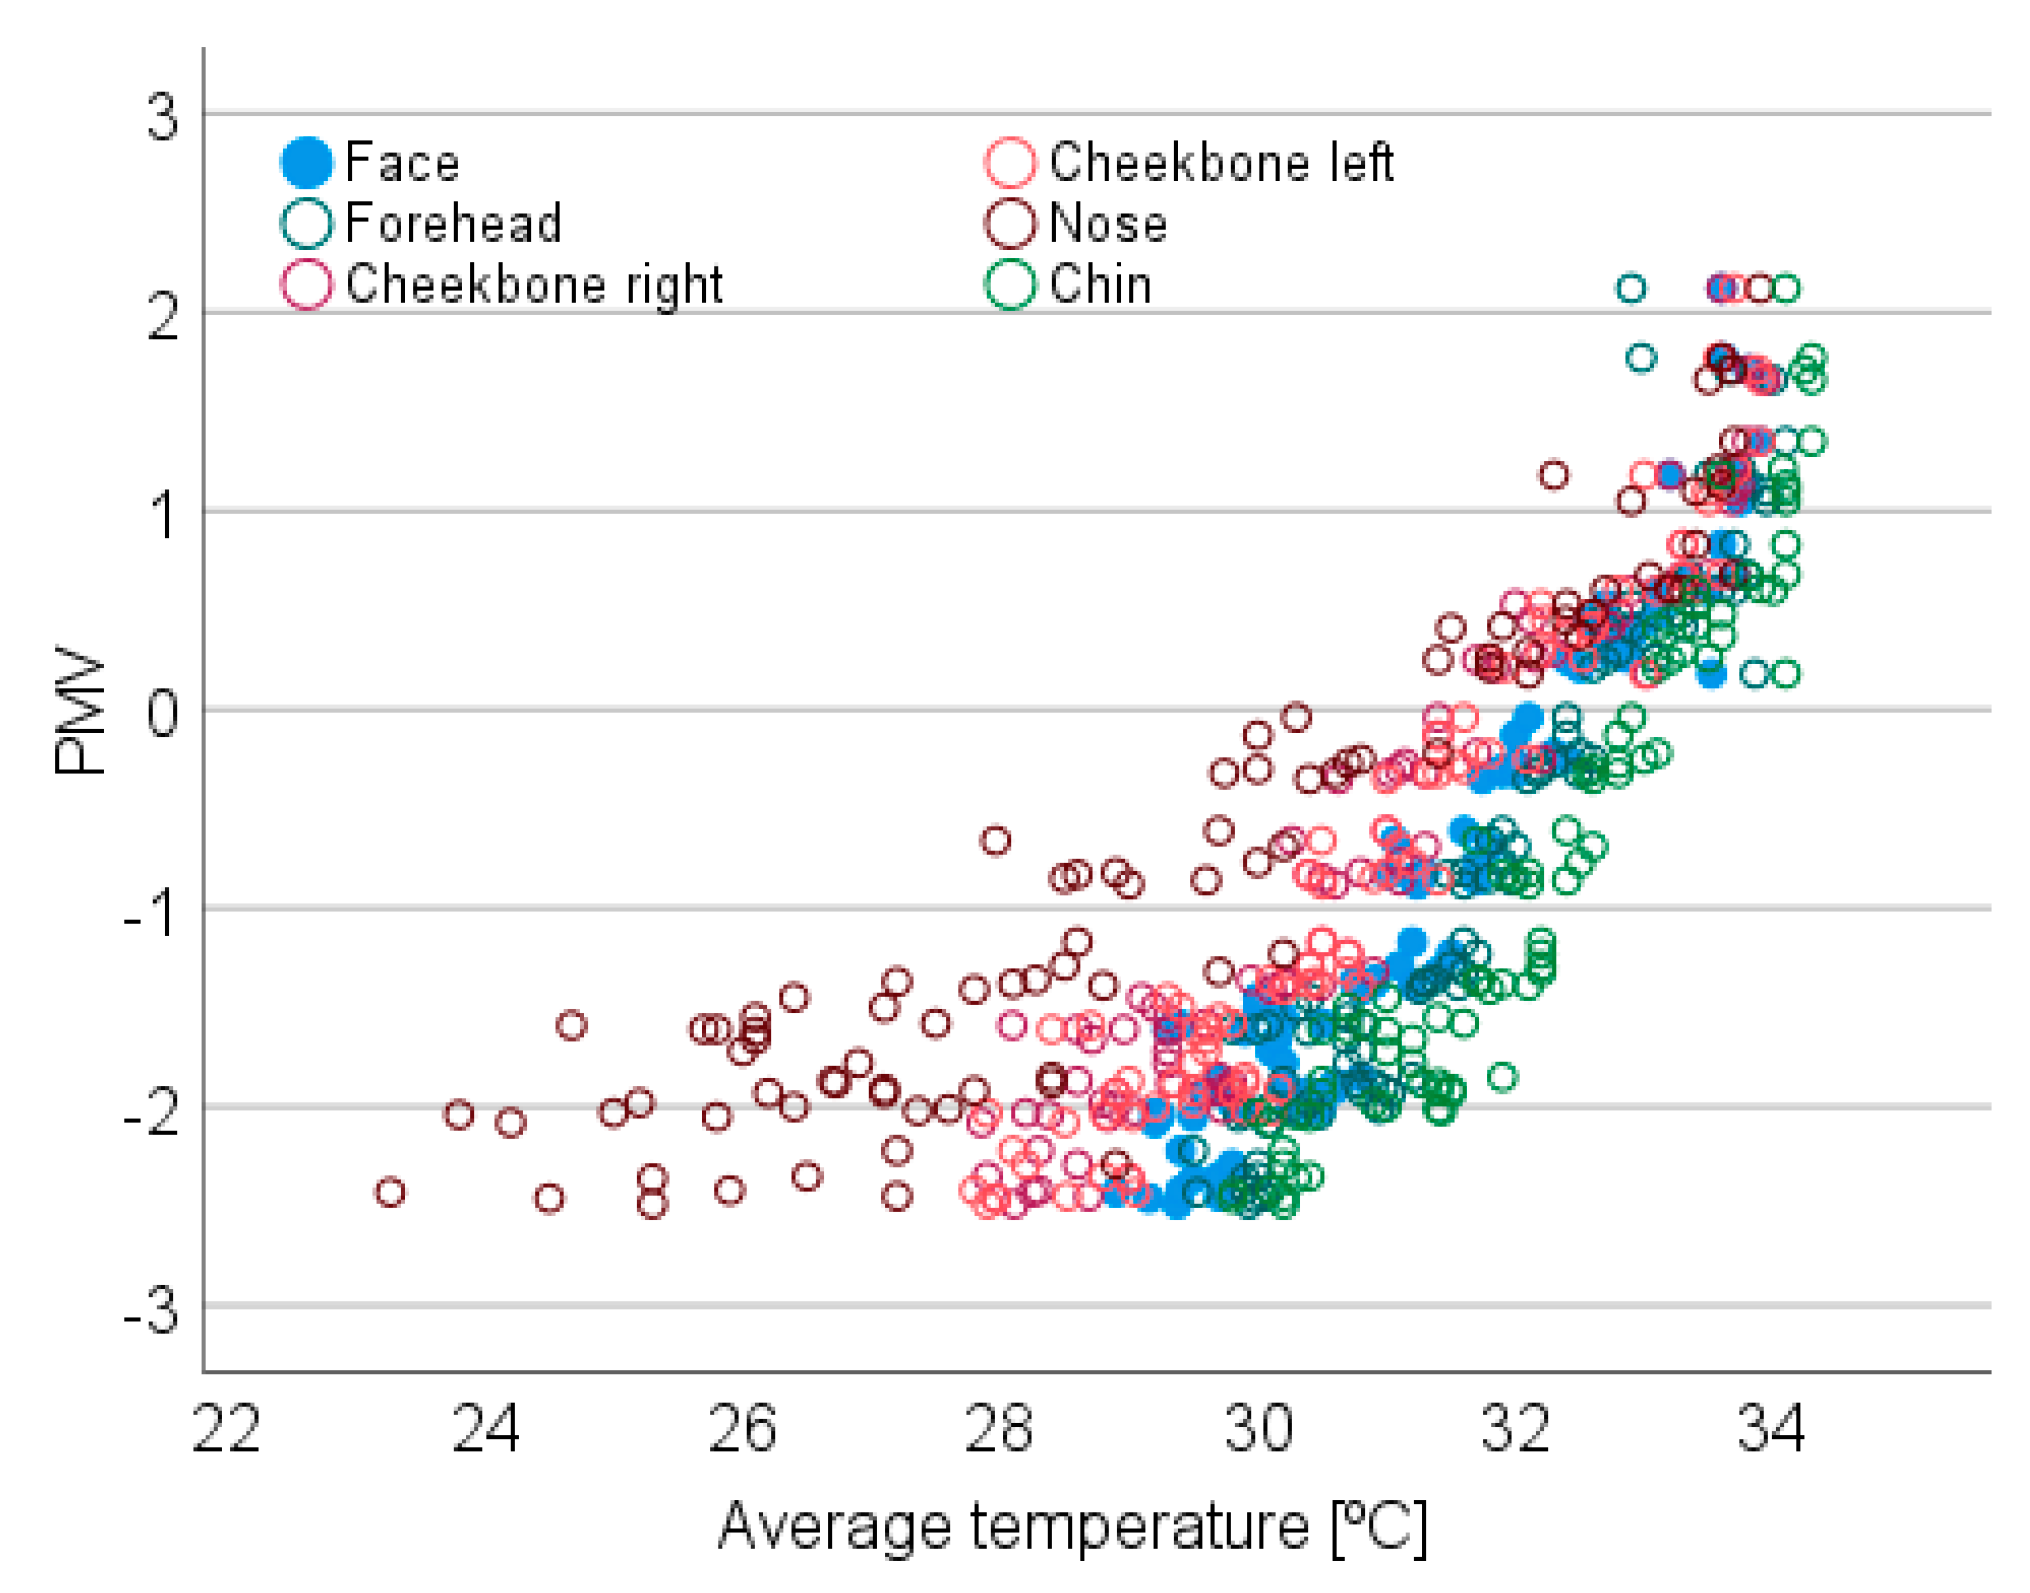
4.2. Face Temperature vs. PMV
4.3. Prediction Model for PMV Based on IRT
5. Conclusions
Author Contributions
Funding
Institutional Review Board Statement
Informed Consent Statement
Data Availability Statement
Conflicts of Interest
References
- Balaras, C.A.; Argiriou, A.A. Infrared thermography for building diagnostics. Energy Build. 2002, 34, 171–183. [Google Scholar] [CrossRef]
- Cheung, M.Y.; Chan, L.S.; Lauder, I.J.; Kumana, C.R. Detection of body temperature with infrared thermography: Accuracy in detection of fever. Hong Kong Med. J. 2012, 18, 31–34. [Google Scholar] [PubMed]
- Lahiri, B.B.; Bagavathiappan, S.; Jayakumar, T.; Philip, J. Medical applications of infrared thermography: A review. Infrared Phys. Technol. 2012, 55, 221–235. [Google Scholar] [CrossRef] [PubMed]
- Tanda, G. Skin temperature measurements by infrared thermography during running exercise. Exp. Therm. Fluid Sci. 2016, 71, 103–113. [Google Scholar] [CrossRef]
- Takada, S.; Matshumoto, S.; Matshushita, T. Prediction of whole-body thermal sensation in the non-steady state based on skin temperature. Build. Environ. 2013, 68, 123–133. [Google Scholar] [CrossRef]
- Liu, W.; Lian, Z.; Deng, Q.; Liu, Y. Evaluation of calculation methods of mean skin temperature for use in thermal comfort study. Build. Environ. 2011, 46, 478–488. [Google Scholar] [CrossRef]
- Liu, W.; Tian, Z.; Yang, D.; Deng, Y. Evaluation of individual thermal sensation at raised indoor temperatures based on skin temperature. Build. Environ. 2021, 188, 107486. [Google Scholar] [CrossRef]
- Choi, J.-H.; Loftness, V. Investigation of human body skin temperatures as a bio-signal to indicate overall thermal sensations. Build. Environ. 2012, 58, 258–269. [Google Scholar] [CrossRef]
- Chaudhuri, T.; Zhai, D.; Soh, Y.C.; Li, H.; Xie, L. Thermal comfort prediction using normalized skin temperature in a uniform built environment. Energy Build. 2018, 159, 426–440. [Google Scholar] [CrossRef]
- Chaudhuri, T.; Soh, Y.C.; Li, H.; Xie, L. Machine learning driven personal comfort prediction by wearable sensing of pulse rate and skin temperature. Build. Environ. 2020, 170, 106615. [Google Scholar] [CrossRef]
- Sakoi, T.; Tsuzuki, K.; Kato, S.; Ookam, R.; Song, D.; Zhu, S. Thermal comfort, skin temperature distribution, and sensible heat loss distribution in the sitting posture in various asymmetric radiant fields. Build. Environ. 2007, 42, 3984–3999. [Google Scholar] [CrossRef]
- Aryal, A.; Becerik-Gerber, B. A comparative study of predicting individual thermal sensation and satisfaction using wrist-worn temperature sensor, thermal camera and ambient temperature sensor. Build. Environ. 2019, 160, 106223. [Google Scholar] [CrossRef]
- Metzmacher, H.; Wölki, D.; Schmidt, C.; Frisch, J. Real-time human skin temperature analysis using thermal image recognition for thermal comfort assessment. Energy Build. 2018, 158, 1063–1078. [Google Scholar] [CrossRef]
- Ghahramani, A.; Castro, G.; Becerik-Gerber, B.; Yu, X. Infrared thermography of human face for monitoring thermoregulation performance and estimating personal thermal comfort. Build. Environ. 2016, 109, 1–11. [Google Scholar] [CrossRef] [Green Version]
- Li, D.; Menassa, C.C.; Kamat, V.R. Non-intrusive interpretation of human thermal comfort through analysis of facial infrared thermography. Energy Build. 2018, 176, 246–261. [Google Scholar] [CrossRef]
- Ghahramani, A.; Castro, G.; Karvigh, S.A.; Becerik-Gerber, B. Towards unsupervised learning of thermal comfort using infrared thermography. Appl. Energy 2018, 211, 41–49. [Google Scholar] [CrossRef] [Green Version]
- Tejedor, B.; Casals, M.; Gangolells, M.; Macarulla, M.; Forcada, N. Human comfort modelling for elderly people by infrared thermography: Evaluating the thermoregulation system responses in an indoor environment during winter. Build. Environ. 2020, 186, 107354. [Google Scholar] [CrossRef]
- Cosma, A.C.; Simha, R. Thermal comfort modeling in transient conditions using real-time local body temperature extraction with a thermographic camera. Build. Environ. 2018, 143, 36–47. [Google Scholar] [CrossRef]
- Loredan, N.P.; Lipovac, D.; Jordan, S.; Burnard, M.D.; Sarabon, N. Thermal effusivity of different tabletop materials in relation to users’ perception. Appl. Ergon. 2022, 100, 103664. [Google Scholar] [CrossRef]
- Li, D.; Menassa, C.C.; Kamat, V.R. Personalized human comfort in indoor building environments under diverse conditioning modes. Build. Environ. 2017, 126, 304–317. [Google Scholar] [CrossRef]
- Li, X.; Chen, Q. Development of a novel method to detect clothing level and facial skin temperature for controlling HVAC systems. Energy Build. 2021, 239, 110859. [Google Scholar] [CrossRef]
- Li, P.; Dai, P.; Cao, D.; Liu, B.; Lu, Y. Non-intrusive comfort sensing: Detecting age and gender from infrared images for personal thermal comfort. Build. Environ. 2022, 219, 109256. [Google Scholar] [CrossRef]
- Yi, C.; Childs, C.; Peng, C.; Robinson, D. Thermal comfort modelling of older people living in care homes: An evaluation of heat balance, adaptive comfort, and thermographic methods. Build. Environ. 2022, 207, 108550. [Google Scholar] [CrossRef]
- Fernández-Cuevas, I.; Bouzas Marins, J.C.; Arnáiz Lastras, J.; Gómez Carmona, M.; Piñonosa Cano, S.; Ángel García-Concepción, M.; Sillero-Quintana, M. Classification of factors influencing the use of infrared thermography in humans: A review. Infrared Phys. Technol. 2015, 71, 28–55. [Google Scholar] [CrossRef]
- ASTM: E 1862-97; Standard Test Methods for Measuring and Compensating for Reflected Temperature Using Infrared Imaging Radiometers. American Society for Testing and Materials: West Conshohocken, PA, USA, 2010.
- Angelova, R.A.; Velichkova, R. Using face masks in the classroom: The effect on the indoor environment parameters and face thermophysiological reactions. Appl. Ecol. Environ. 2022, 20, 135–151. [Google Scholar] [CrossRef]
- ISO 7730: 2005; Ergonomics of the Thermal Environment-Analytical Determination and Interpretation of Thermal Comfort Using Calculation of the PMV and PPD Indices and Local Thermal Comfort Criteria. International Organization for Standardization: Geneva, Switzerland, 2005.
- Thermal Environmental Conditions for Human Occupancy; ASHRAE: Peachtree Corners, GA, USA, 2013; Volume 55.
- Almeida, R.M.S.F.; Ramos, N.M.M.; Freitas, V. Thermal comfort models and pupils’ perception in free-running school buildings of a mild climate country. Energy Build. 2016, 111, 64–75. [Google Scholar] [CrossRef]
- Cardoso, V.; Ramos, N.M.M.; Almeida, R.M.S.F.; Barreira, E.; Martins, J.P.; Simões, M.L.; Sanhudo, L. A discussion about thermal comfort evaluation in a bus terminal. Energy Build. 2018, 168, 86–96. [Google Scholar] [CrossRef]


| IR Camera 1 | IR Camera 2 | |
|---|---|---|
| Temperature range | −20 °C to 100 °C | −20 °C to 400 °C |
| Accuracy | ±2 °C or 2% | ±2 °C or 2% |
| Thermal sensitivity | 0.06 °C at 30 °C | ≤0.045 °C at 30 °C |
| IFOV | 1.2 mrad | 1.86 mrad |
| Infrared resolution | 320 × 240 pixels | 320 × 240 pixels |
| Field of view | 20.1° × 22.7° | 34.1°H × 25.6°H |
| Minimum focus distance | 30 cm | <46 cm |
| Infrared spectral range | 8 to 14 μm | 7.5 to 14 μm |
| Tamb | RHamb | Tmax1 | Tmax2 | Tref1 | Tref2 | |
|---|---|---|---|---|---|---|
| Tamb | 1.000 | 0.093 (0.361) | 0.886 (0.000) | 0.918 (0.000) | 0.999 (0.000) | 0.996 (0.000) |
| RHamb | 1.000 | 0.144 (0.156) | −0.062 (0.544) | 0.115 (0.256) | 0.130 (0.200) | |
| Tmax1 | 1.000 | 0.842 (0.000) | 0.890 (0.000) | 0.882 (0.000) | ||
| Tmax2 | 1.000 | 0.915 (0.000) | 0.906 (0.000) | |||
| Tref1 | 1.000 | 0.997 (0.000) | ||||
| Tref2 | 1.000 |
| Face | Forehead | Cheekbone Left | Cheekbone Right | Nose | Chin | |
|---|---|---|---|---|---|---|
| Constant | −25.74 | −28.56 | −20.98 | −21.99 | −12.73 | −29.56 |
| Slope | 0.80 | 0.88 | 0.66 | 0.69 | 0.41 | 0.90 |
| R2 | 93.3% | 90.4% | 93.9% | 93.7% | 89.1% | 91.8% |
Publisher’s Note: MDPI stays neutral with regard to jurisdictional claims in published maps and institutional affiliations. |
© 2022 by the authors. Licensee MDPI, Basel, Switzerland. This article is an open access article distributed under the terms and conditions of the Creative Commons Attribution (CC BY) license (https://creativecommons.org/licenses/by/4.0/).
Share and Cite
Almeida, R.M.S.F.; Barreira, E.; Simões, M.L.; Sousa, T.S.F. Infrared Thermography to Evaluate Thermal Comfort under Controlled Ambient Conditions. Appl. Sci. 2022, 12, 12105. https://doi.org/10.3390/app122312105
Almeida RMSF, Barreira E, Simões ML, Sousa TSF. Infrared Thermography to Evaluate Thermal Comfort under Controlled Ambient Conditions. Applied Sciences. 2022; 12(23):12105. https://doi.org/10.3390/app122312105
Chicago/Turabian StyleAlmeida, Ricardo M. S. F., Eva Barreira, Maria Lurdes Simões, and Tiago S. F. Sousa. 2022. "Infrared Thermography to Evaluate Thermal Comfort under Controlled Ambient Conditions" Applied Sciences 12, no. 23: 12105. https://doi.org/10.3390/app122312105