Abstract
In the shaking table test of a soil–pile–bridge structure system, it is difficult to keep the similarity relations of the model structure and that of the model soil consistent. Due to the difference of geometry and material similarity ratios for the model structure and model soil, the determination of the duration compression ratio of input motions is a key problem. The spectrum characteristics of input motions will be varied by the duration compression ratio so that the seismic responses of structure and soil system will be affected. There are three commonly used approaches to determine the duration compression ratio of input motions in shaking table tests: the time similarity ratio of model structure; the time similarity ratio of model soil; and uncompressed. To study the influence of the duration compression ratio on the seismic response of a soil–structure system in shaking table tests, the El Centro record and the Wolong record were chosen as the input motions, and the durations were compressed by the three commonly used approaches in this paper. The influence of the duration compression ratios of the input motions on the acceleration response of a soil–pile–bridge structure system was compared and analyzed through a series of shaking table tests. The results showed that the duration compression ratio affected the acceleration response of the model soil and the model structure, and the effect was more obvious when the peak ground acceleration (PGA) was small. If the research is focused on the seismic response of the soil, it is recommended to use the time similarity ratio of the model soil to compress the input motions. If the research is focused on the seismic response of the structure, it is recommended to use the time similarity ratio of the model structure to compress the input motions. This study could provide a reference for the design of the shaking table test of a soil–pile–bridge structure system.
1. Introduction
In the earthquake engineering field, the shaking table test is a direct and common method to study the earthquake response and failure mechanism of structures and sites. Moreover, it is also one of the important means to research and evaluate the seismic performance of a structure. When a structure and soil move integrally under an earthquake, the structural motion and soil motion mutually affect each other, that is, the soil–structure interaction (SSI). In shaking table tests, the test model of the soil–structure system is composed of a model structure and model soil. Due to the difference of geometry and material similarity ratios for two different parts (the model structure and model soil), the determination of the duration compression ratio of the input motions is a key and difficult issue in the shaking table test of a soil–structure system. The spectrum characteristics of input motions will be changed by different duration compression ratios. Therefore, the seismic responses of the structure and soil will be affected. No matter how the duration compression ratio of input motions is determined, it is difficult to satisfy the similarity requirement of the model structure and model soil simultaneously. Because there is no unified recognition in this issue, the duration compression ratios of input motions are given different values in relative shaking table tests. Much research has been carried out on shaking table tests considering the soil–structure interaction. There are three commonly used approaches to determine the duration compression ratio of input motions: time similarity ratio of model structure; time similarity ratio of model soil; and uncompressed.
The duration compression ratio of input motions determined by the time similarity ratio of a model structure is widely applied in shaking table tests. Yang [1] performed a series of shaking table tests to better understand the characteristics of the seismic response of nuclear power stations with fixed-base and pile-raft foundations. Hokmabadi [2] studied the effects of the seismic soil–pile–structure interaction (SSPSI) on the dynamic response of a building with various heights by conducting a series of shaking table tests on 5-story, 10-story, and 25-story model structures, in which the structure was supported by an end-bearing pile foundation in soft soil. Wang [3] conducted the shaking table tests of a series of soil–structure and soil–structure group systems. The influence of structure height, the number of structures, the composition of the structure group, and seismic records was considered. Pai [4] set up a comparison of conventional pile types under the same test conditions, and a series of shaking table tests. The distribution and spatial variation of acceleration and the dynamic soil pressure response of a soil slope strengthened by EPS pile under earthquake action were studied. Hamayoon [5] conducted 1 g shaking table tests with a unified system consisting of a ground, a group-pile foundation, and a superstructure, and the study showed that it was impossible to satisfy all similarity laws in 1 g model tests. Sun [6] studied a 1/70 scaled model of a cable-stayed bridge with a central span of 1400 m using a multiple shaking table array system. Choi [7] performed a series of shaking table tests using a soil–pile model with three different sizes to verify the existing similitude law used in 1 g shaking table tests. Hussein [8] performed a series of model shake table tests to investigate the effect of model scale on the seismic response of prototype helical pile groups. Iiba [9] set up a scaled model of a building, foundation, and soil deposit on a shaking table to investigate the effects of the vibration of soil deposits and buildings. Shen [10] studied the dynamic characteristics and seismic response of high-rise buildings considering the effect of the soil–structure interaction. The model soil for soil box test was sand, sandy silt, and silty clay from bottom to top. Zhou [11] studied the seismic behavior of the frame-type underground subway station structure in loess ground. The time-history of the seismic wave was compressed according to the similarity relationship of the experimental model. In the studies mentioned above, the duration compression ratios of input motions were all determined by the time similarity ratio of a model structure in shaking table tests.
In some other studies, the duration compression ratios of input motions were determined by a time similarity ratio of model soil in shaking table tests. Taking CAP1400 nuclear power plant structure as an example, Li [12] studied the suitability and seismic response characteristics of the nuclear power plants on a non-rock site, and the time similarity of input motions was adopted as the time similarity ratio of model soil. Chen [13] performed shaking table tests to investigate the damage mechanisms of a subway structure in soft while experiencing strong ground motions, in which the time scaling factor was determined as the time similarity ratio of model soil. Chen [14] performed a series of large-scale shaking table tests to investigate the damage mechanisms of a frame-type subway station structure in a loess site. The author considered that it was unprocurable to make all parameters meet the similitude law in the soil–structure shaking table test. The selection of the duration compression ratio of input motions is determined according to the purpose of the series of shaking table tests. Besides, some scholars chose uncompressed earthquake records as input motions to analyze the seismic responses of structures in a liquefaction site [15,16].
To achieve the same similarity between a model structure and model soil in shaking table tests, experts conducted have relevant research. Xing [17] carried out shaking table tests of shallow foundation structures in seasonal frozen soil regions. The influence of structural natural frequency, soil frozen depth, and seismic load on the seismic response of structure was studied. Durante [18] studied the complex seismic soil–structure interaction phenomena by the shaking table test. The model soil and the small-scale model structure with their prototype satisfied the same physical and geometrical similarity. Liang [19] investigated the seismic behavior of a shield tunnel with an ultra-large diameter of 15 m passing through a soft-hard stratum and proposed a modified similitude ratio design method. The time similitude ratios of the tunnel and soil models were consistent.
In summary, experts and scholars have studied the seismic responses of structures considering SSI through a large number of shaking table tests, and made some achievements. However, there is no uniform principle for adopting the duration compression ratio of input motion on shaking table tests of a soil–structure system. It is the best choice to make the time similarity ratio of model structure consistent with that of model soil according to the similarity theory, but it is difficult to achieve this in shaking table tests due to the limitation of test conditions. Different principles and methods for determining the values of the duration compression ratio have been adopted by different researchers. While few people have considered different duration compression ratios in the shaking table tests, and there are also few comparative studies on the influence of duration compression ratio on the seismic responses of model structure and model soil. In view of the shortcomings of previous research, a small radius curved bridge was chosen as the research object in this paper, and a series of shaking table tests were performed considering soil–pile–structure interaction. Three commonly used approaches were separately chosen to determine the duration compression ratio of the input motions in the tests. The representative similarity ratios were 1/4, 1/2, and 1/1 in time, respectively. Comparison and analysis were performed for the seismic responses, especially for the acceleration responses, of a model structure and model soil, and the test results influenced by the duration compression ratio of input motions are discussed.
2. Shaking Table Test Condition
2.1. Similarity Ratio
A small radius curved bridge with a radius of 40 m in Beijing was taken as a prototype structure, and this bridge was reported in detail in reference [20]. The similarity relationship of the model structure was deduced from the Buckingham π theorem [21]. The size of the shaking table used in this study was 5 m × 5 m, the bearing capacity was 45 t, and the maximum allowable acceleration was 1.2 g. Considering the size and bearing capacity of the shaking table, the geometry similarity ratio of the model structure was 1/16. The acceleration similarity ratio was 1.0. Micro-concrete was used to make the test model, and the similarity ratio of elastic modulus was 1/4.
The similarity relationship of the model soil was determined by the Froude value from the Dimensional analysis theory [22], which reflects the criterion of gravitational force similarity.
where vs is the shear-wave velocity, l is the geometrical dimension, and g is the acceleration of gravity. Froude value of model soil remained the same as the prototype required the criterion of gravitational force similarity. The geometry similarity ratio of the model soil to the prototype soil is defined as follows:
where vsm and vsp are the shear-wave velocity of the model soil and the prototype soil, respectively.
Before the shaking table tests, sthe hear-wave velocity of the model soil was measured, and the value was about one half of that of the prototype soil. Therefore, the geometry similarity ratio of model soil was 1/4, and other similarity ratios could be derived. The similarity relations of the model structure and model soil are shown in Table 1.

Table 1.
Similarity relations.
To analyze the influence of duration compression ratio of input motions, three duration compression ratios were adopted, including: (1) 1/4 provided by the time similarity ratio of model structure; (2) 1/2 provided by the time similarity ratio of model soil; (3) 1/1 without considering the similarity relationships.
2.2. Test Model
The test system is illustrated in Figure 1. The box section was used for the bridge deck, and the spans of the model structure were 1125 mm, 1250 mm, and 1125 mm, respectively. The heights of piers from 1# to 4# were 454 mm, 550 mm, 647 mm, and 690 mm. The pile had a length of 1200 mm and a diameter of 75 mm. Two middle piers (2#, 3#) and the girder were consolidated, and two side piers (1#, 4#) were connected to the girder through rubber bearings. The layout is illustrated in Figure 2 and the design of pier 3# is shown in Figure 3. The reinforcement of the model structure components is shown in Figure 4. Moreover, the dynamic characteristics of the model soil were obtained by cyclic triaxial tests and dynamic tests. The typical G/Gmax-γ and λ-γ curves of the model soil are shown in Figure 5, where G, Gmax, λ, and γ are the shear modulus, the maximum shear modulus, the damping ratio, and the shear strain, respectively.
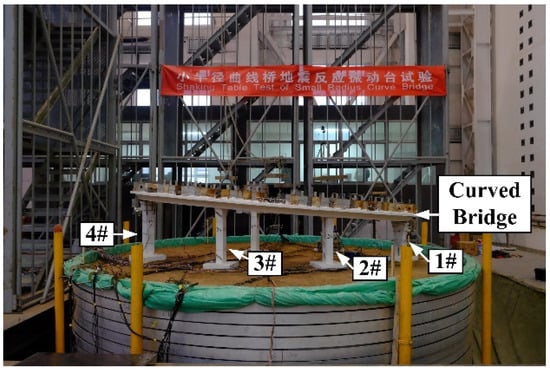
Figure 1.
Layout of the shaking table test.
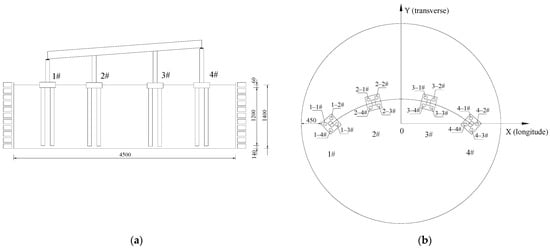
Figure 2.
Layout of the test system (unit: mm): (a) elevation view; (b) plan view.
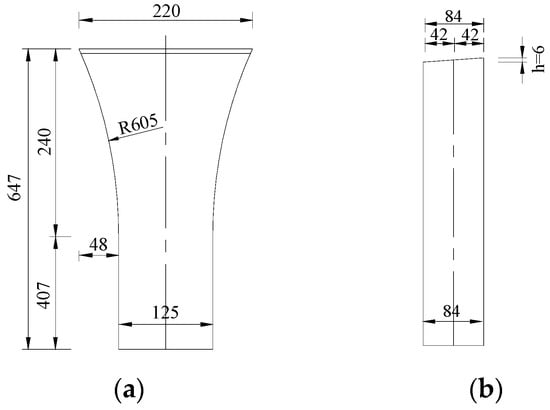
Figure 3.
Design of pier 3# (Unit: mm): (a) elevation view; (b) lateral view.
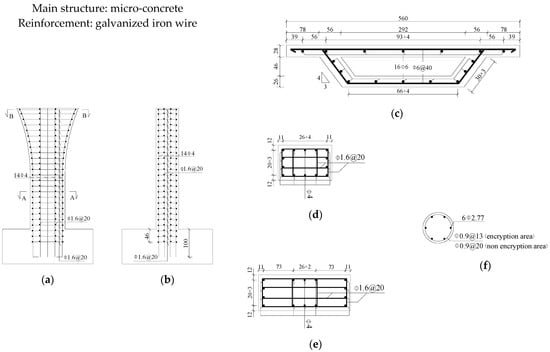
Figure 4.
Reinforcement of the model structure components (mm): (a) Elevation of pier; (b) Side elevation of pier; (c) Mid−span cross-section of girder; (d) A−A section; (e) B−B section; (f) Pile section.
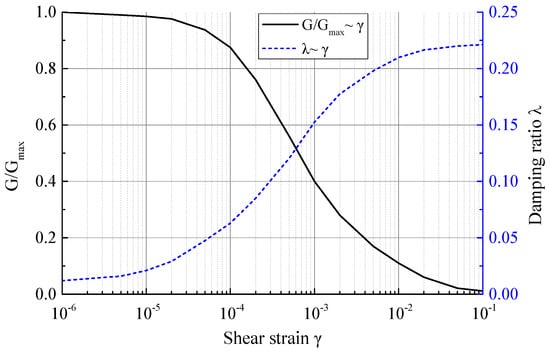
Figure 5.
Dynamic characteristics of the model soil.
2.3. Instrumentation
The purpose of this paper was to discuss the influence of the duration compression ratios, and only the differences of acceleration responses in the tests were analyzed. To record the actual motion of shaking table, a strong motion seismograph was fixed on the table. The acceleration responses of model structure and model soil were measured using piezoelectricity IEPE (Integrated Electronics Piezo Electric) acceleration sensors. Six acceleration sensors were arranged in the soil to record the seismic response of the model soil. In the four piers, piers 2# and 3# had similar seismic response characteristics, so did piers 1# and 4#. Therefore, the acceleration sensors were only arranged on piers 1# and 3# and their corresponding piles. One acceleration sensor was arranged in the middle of the girder. The arrangements of fifteen acceleration sensors are shown in Figure 6.
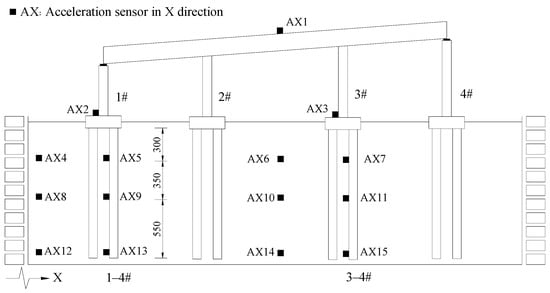
Figure 6.
Layout of the acceleration sensors (unit: mm).
2.4. Input Motions and Test Cases
El Centro record and Wolong record were chosen as the input motions in the tests. The El Centro record has richer low-frequency components, while the Wolong record is the ground motion with fewer low-frequency components and rich high-frequency components. The frequency contents of the two records were abundant in the main frequency band of the structure.
The durations of two records were compressed to 1/4, 1/2 and 1/1, and the factor of 1/1 was the original record of the ground motion. The scaled acceleration time histories of the two adopted ground motions together with the corresponding response spectra are illustrated in Figure 7.
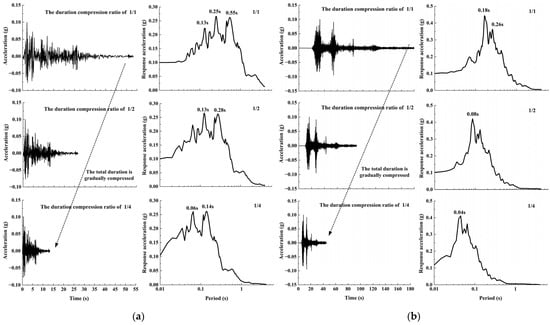
Figure 7.
Adopted ground motions: (a) El Centro records; (b) Wolong records.
In order to examine the seismic responses of model structure and model soil during the loading process and prevent a sudden earthquake collapse, the PGA of the input motions was adjusted from 0.05 g to 0.25 g. The input motions were applied in the direction of X-axis. The experimental loading scheme is listed in Table 2.
Table 2.
Experimental loading scheme.
In this study, to make full use of the experiment model and carry out more tests for different input motions, three stages for input motions with three PGAs were conducted into the shaking table tests of the soil–pile–bridge structure system, successively. Because of the nonlinear behavior, the characteristics of models were changed by the tests already performed to some degree in the whole experiment, which affected the seismic responses of successive tests. The purpose of this shaking table test was to study influence of duration compression ratios of input motions on the seismic responses of the soil–pile–bridge structure system. Even if the model had been changed certainly after each experimental stage, the model was considered as a model with new properties transformed by preliminary tests, as long as it was not damaged obviously. Indeed, the effects between different test cases in each stage were worth considering. The maximum value of the input motion PGA was controlled into a range of the PGA of 0.25 g, in order to reduce the influence between different test cases in each stage.
3. Test Result
3.1. Experimental Phenomena
For input motions with a low PGA (e.g., 0.05 g), there were no obvious changes in model structure and model soil compared with the previous tests. With the increase in input motion PGA, the seismic responses of the model structure increased significantly. Under the Wolong records, the responses for the scaling factor of 1/1 were greater than that of 1/2 and 1/4. The experimental phenomena are shown in Figure 7 and Figure 8. Before the tests, the soil was well contacted with the caps (Figure 8a). After input motions with the PGA of 0.05 g, the separation between soil and caps was not obvious. After input motions with the PGA of 0.15 g, separation occurred at the contact between soil and caps. After input motions with the PGA of 0.25 g, the structure was basically intact and there were no obvious cracks on the girder and piers. The soil around the caps 1# and 4# was uplifted in different degrees, and caps 2# and 3# were separated from the soil with the crack width of 1–2 cm (Figure 8b). In the cases of the shaking table tests, the characteristics of the soil–pile–bridge structure system were changed due to the nonlinear behavior of the soil and structure.
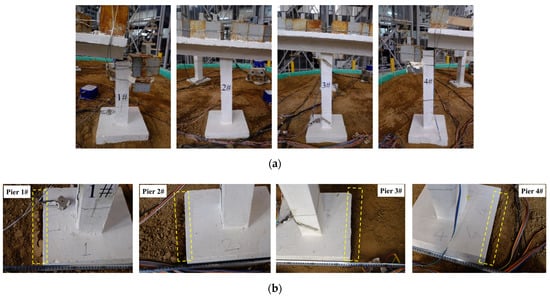
Figure 8.
Experimental phenomena: (a) before tests; (b) after test case No.21.
3.2. Natural Frequencies of the Model Soil and Model Structure
The time histories of the flat noise tests at the model soil and deck were obtained from the acceleration sensors of AX6 and AX1, respectively. Then the relevant natural frequencies of the model soil and mode structure were obtained from Fourier transform. The first-order natural frequency and change law are listed in Table 3. It can be seen that frequency variation of model soil was more obvious than that of model structure, and the actual characteristics of the model soil–pile–structure system varied in each experimental stage. After the shaking table tests, the frequency of model soil and model structure decreased by 30.8% and 7.1%, respectively. The frequency variation was consistent with the experimental phenomena.
Table 3.
First-order natural frequency of the model soil and model structure.
3.3. Input Motions Influenced by the Model System
In the shaking table tests, the control effect of the shaking table system was influenced by the interaction between the shaking table and test model, which meant that there was a difference between the input motions and the actual motions of the shaking table. The actual motion of the shaking table was obtained from the strong motion seismograph. The comparisons of acceleration response spectra between the input motion and actual motion of table with the PGA of 0.05 g are shown in Figure 9. It indicates that the errors were in a reasonable range and varied in different duration compression ratios. To reflect the test results accurately, the actual records of shaking table motions were adopted to input motions in the analysis as in the following.
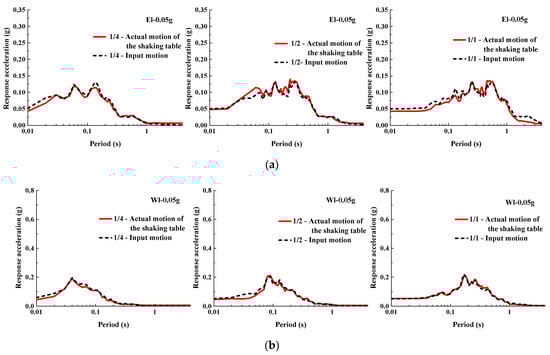
Figure 9.
Acceleration response spectra: (a) El Centro record; (b) Wolong record.
3.4. Response of the Model Soil
3.4.1. Peak Acceleration Variation at Different Depths of Soil
The variation curves of peak acceleration amplification ratio (ratio of response peak acceleration to peak acceleration of table output motion) with the model soil depth are shown in Figure 10 and Figure 11. It can be seen that there were significant differences in the model soil response under three different input motions with the duration compression ratio of 1/4, 1/2, and 1/1. Under input motions with the PGAs of 0.05 g and 0.15 g, the acceleration responses of the model soil were relatively close when the time similarity ratios were 1/4 and 1/2. When the time similarity ratio was 1/1, the acceleration responses of model soil were the smallest and there was a large difference between them and that when the time compression ratios were 1/4 and 1/2. This difference decreased with the increase in input motion amplitude. Under input motions with the PGA of 0.25 g, the difference of acceleration response was small under three duration compression ratios and the duration compression ratio had little effect on the acceleration response of the model soil. Under El Centro records and Wolong records, the peak accelerations of model soil were different, which was determined by the characteristics of ground motions.
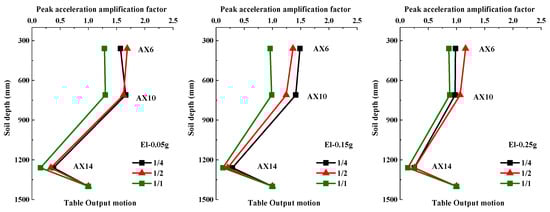
Figure 10.
The peak acceleration amplification ratio of the model soil under scaled El Centro records.
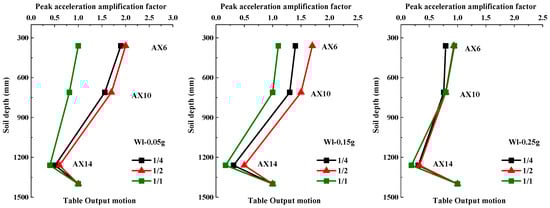
Figure 11.
The peak acceleration amplification ratio of the model soil under scaled Wolong records.
3.4.2. Spectrum Characteristics of the Acceleration Response of the Model Soil
According to the theory of structural dynamics, the acceleration response spectrum can reflect the response of the structure under input motions and the characteristics of the structure [23]. Taking the measuring point AX6 of the model soil as an example, the acceleration response spectra of the measuring point AX6 with different duration compression ratios are shown in Figure 12 and Figure 13.
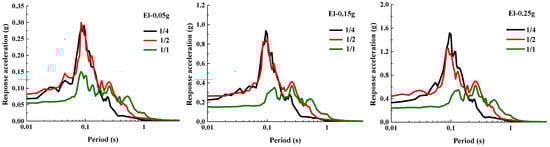
Figure 12.
Acceleration response spectra of the measuring point AX6 under scaled El Centro records.
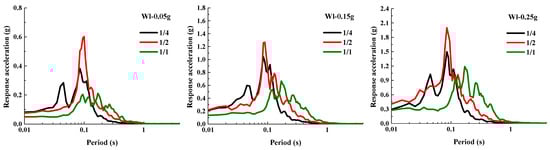
Figure 13.
Acceleration response spectra of the measuring point AX6 under scaled Wolong records.
This implies that the spectra were affected by the model soil and the amplitudes increased greatly in the specified period range (about 0.1 s), especially for the scaled El Centro record. There were obvious differences in seismic response of model soil with the duration compression ratios of 1/4, 1/2, and 1/1. Under the input of the El Centro record, for the frequency band with the periods less than 0.2 s, the differences between duration compression ratios of 1/4 and 1/2 were relatively small, and for the frequency band with the periods greater than 0.2 s, the differences between duration compression ratios of 1/2 and 1/1 were relatively small. Under the input of the Wolong record, the differences between duration compression ratios of 1/4, 1/2, and 1/1 were large, which differed from the response law of El Centro record. The characteristics of the test results for the three input motion PGAs were basically consistent, while the degree of difference in response varied under the inputs of El Centro and Wolong record, which was more significant in Wolong record. These results mean that the actual input motions to the model structure were different for the shaking table tests with different duration compression ratios. The selection of duration compression ratio directly affected the acceleration response of model soil and the evaluation of the prototype soil.
From the above analysis, it is clear that the variation of the acceleration response spectrum was not consistent under the same PGA and different types of ground motion. This was due to the difference in the spectral characteristics between the El Centro record and the Wolong record. In order to eliminate the influence of this difference and study the effect of duration compression ratios on spectrum characteristics intuitively, the transfer function was introduced. Transfer function f (T) is the ratio of acceleration response spectrum of each measuring point to that of table output motion, as shown below.
where is the acceleration response spectrum of measuring point i when the duration compression ratio is q, here, q = 1/4, 1/2, and 1/1; is the acceleration response spectrum of table output motion.
Taking the measuring point AX6 in upper model soil as an example, the transfer functions fAX6, q(T) of the measuring point AX6 under input motions with different duration compression ratios are shown in Figure 14 and Figure 15.
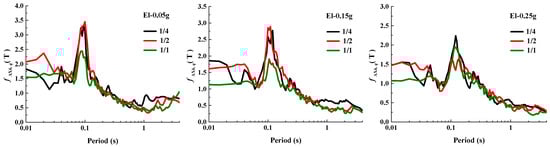
Figure 14.
Transfer functions of measuring point AX6 under scaled El Centro records.
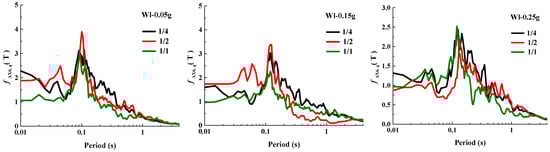
Figure 15.
Transfer functions of measuring point AX6 under scaled Wolong records.
When the PGA of input motion is large, the softening and nonlinearity of model soil will affect the study of duration compression ratio. When the PGA of input motion is small, the nonlinearity of model will have less influence, and the law of transfer function is more representative. Therefore, the comparisons of transfer functions should be focused when the PGAs are 0.05 g and 0.15 g. As shown in Table 3, the period corresponding to the first-order frequency of the model soil was about 0.1 s. It can be seen from the comparison of transfer functions that when the PGAs were 0.05 g and 0.15 g, the amplitude of transfer function with the duration compression ratio of 1/2 was the largest near the period of 0.1 s, but that with the duration compression ratio of 1/1 was the smallest.
3.4.3. Influence of the Duration Compression Ratio on the Model Soil
Comparisons of the acceleration amplification ratios and the transfer functions show that: (1) With the increase in PGA of input motions, the influence of duration compression ratio on peak acceleration and transfer function decreased gradually. (2) When the duration compression ratio was 1/1, the acceleration responses of model soil were the smallest. The duration compression ratio of 1/1 was not suitable for studying the acceleration response of model soil. (3) Near the period corresponding to the first-order frequency of model soil, the amplitude of transfer function with the duration compression ratio of 1/2 was larger than that of 1/4. It is better to compress the input motions by the time similarity ratio of model soil.
Qualitatively, for the seismic responses of model soil, more realistic test results could be obtained when the input motions are compressed by the dynamic similarity of model soil. In the seismic responses of the soil–structure system, structural responses had relatively little influence on model soil responses (especially for the model soil away from the structural foundation), but model soil responses had a relatively significantly influence on structural responses. Therefore, the key to determine the rationality of structural responses is to simulate the model soil responses reasonably.
3.5. Response of the Model Structure
3.5.1. Peak Acceleration Variation at Different Heights of the Structure
The variation curves of peak acceleration amplification ratio with structural height are shown in Figure 16 and Figure 17. Generally, the seismic responses of the structure increased significantly from bottom to top. With the increase in peak acceleration of input motion, the acceleration amplification factors of structure decreased gradually. This was due to the nonlinear effect of the model soil. It can be seen that there were some differences in the structural responses under three different input motions with the duration compression ratios of 1/4, 1/2, and 1/1. The curves of the acceleration amplification factor with duration compression ratios of 1/4 and 1/2 were close, and there was a large gap between them and the curve with duration compression ratio of 1/1. As the time similarity ratio increased from small to large, the structural responses did not change regularly but varied due to the intensity and frequency spectrum of the input motion.
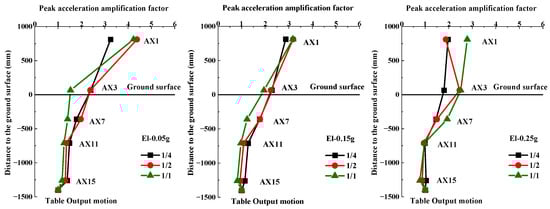
Figure 16.
The peak acceleration amplification ratio of the structure under scaled El Centro records.
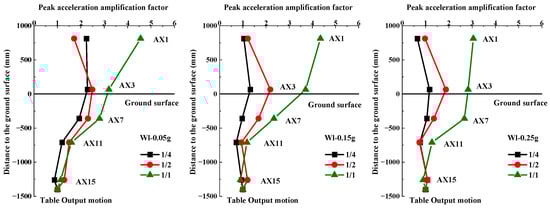
Figure 17.
The peak acceleration amplification ratio of the structure under scaled Wolong records 3.5.2. Spectrum Characteristics of the Acceleration Response of the Model Structure.
Taking the central point AX1 of bridge deck as an example, the transfer functions fAX1, q(T) of the measuring point AX1 under input motions with different duration compression ratios are shown in Figure 18 and Figure 19.
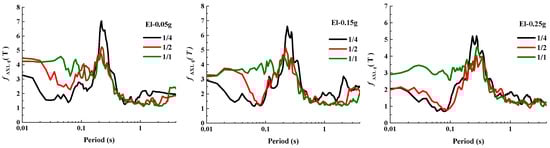
Figure 18.
Transfer functions of measuring point AX1 under scaled El Centro records.
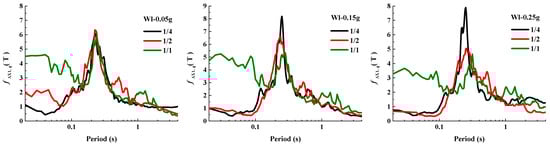
Figure 19.
Transfer functions of measuring point AX1 under scaled Wolong records.
Similar to the analysis of model soil, the comparisons of transfer functions were focused when the PGAs were 0.05 g and 0.15 g, and those with the PGA of 0.25 g were used as a reference. As shown in Table 3, the period corresponding to the first-order frequency of the model structure was about 0.20 s–0.23 s. It can be seen that the amplitude of transfer function with the duration compression ratio of 1/4 was the largest near the period of 0.20 s–0.23 s, but that with the duration compression ratio of 1/1 was the smallest.
3.5.2. Influence of the Duration Compression Ratio on the Model Structure
Comparisons of the acceleration amplification ratios and the transfer functions show that: (1) The spectral characteristics of ground motion had a great influence on the acceleration response of the model structure. Under Wolong records with different duration compression ratios, the acceleration responses of the model structure were quite different. (2) On the whole, the acceleration responses of the model structure were relatively close when the time similarity ratios were 1/4 and 1/2. (3) Near the period corresponding to the first-order frequency of model structure, the amplitude of transfer function with the duration compression ratio of 1/4 was the largest.
For the soil–pile–bridge structure system, the ground motion was transmitted to the structure through the model soil. Although the model soil had filtering and amplification effects on the ground motion, the input motions compressed by the time similarity ratio of model structure caused a larger response. Although SSI affects the seismic response of the structure, if the research focus is on the seismic response of the structure and the parts prone to damage in the earthquake, the input motions should be compressed by the time similarity ratio of model structure.
4. Conclusions
A series of shaking table tests of the soil–pile–bridge structure system were carried out. Different intensities and spectral characteristics of input motions were considered and three different duration compression ratios of 1/4, 1/2, and 1/1 were adopted. The influence of the duration compression ratio of the input motions on the peak acceleration and acceleration response spectrum of the model soil and the model structure was compared and studied. The main conclusions and suggestions are as follows.
After the shaking table tests, the structure was basically intact without any clear cracks. The caps were separated from the soil with a crack width of 1–2 cm. The characteristics of the soil–pile–bridge structure system were changed due to the nonlinear behavior of the soil and structure.
The duration compression ratio affected the acceleration response of the model soil and the model structure, and the effect was more obvious when the PGA was small. If the research focuses on the seismic response of the model soil, it is recommended to use the time similarity ratio of the model soil to compress the input motions. However, if the research focuses on the seismic response of the structure, it is recommended to use the time similarity ratio of the model structure to compress the input motions.
The results of this study could provide a reference for the design of the shaking table test of a soil–pile–bridge structure system. Due to the limitation of test conditions, only three duration compression ratios were analyzed in this paper. In further research, more duration compression ratios could be considered through numerical simulations to systematically study the relationship between the duration compression ratio of the input motion and the seismic response of the structure.
Author Contributions
Conceptualization, Z.Z. and X.L.; methodology, X.L.; investigation, Z.Z.; resources, C.S.; data curation, Z.Z. and C.S.; writing—original draft, Z.Z.; writing—review and editing, C.S. and X.Q.; visualization, C.S.; supervision, Z.Z. project administration, X.L.; funding acquisition, Z.Z., C.S. and X.Q.; All authors have read and agreed to the published version of the manuscript.
Funding
This research was funded by Shandong Provincial Natural Science Foundation, China, grant number ZR2020QE280; the National Natural Science Foundation, grant number 51908338; Doctoral Fund of Shandong Jianzhu University, grant number X19060Z0101 and X18078Z; the Science and Technology Project of Shandong Provincial Department of Transportation, grant number 2020B69 and 2022B06.
Institutional Review Board Statement
Not applicable.
Informed Consent Statement
Not applicable.
Data Availability Statement
Not applicable.
Acknowledgments
This research is supported by Shandong Provincial Natural Science Foundation, China (ZR2020QE280), the National Natural Science Foundation of China (51908338), Doctoral Fund of Shandong Jianzhu University (X19060Z0101; X18078Z), and the Science and Technology Project of Shandong Provincial Department of Transportation (2020B69, 2022B06).
Conflicts of Interest
The authors declare no conflict of interest.
References
- Yang, Y.; Gong, W.M.; Cheng, Y.P.; Dai, G.L.; Zou, Y.W.; Liang, F.Y. Effect of soil-pile-structure interaction on seismic behaviour of nuclear power station via shaking table tests. Structures 2021, 33, 2990–3001. [Google Scholar] [CrossRef]
- Hokmabadi, A.S.; Fatahi, B.; Samali, B. Physical Modeling of Seismic Soil-Pile-Structure Interaction for Buildings on Soft Soils. Int. J. Geomech. 2015, 15, 04014046. [Google Scholar] [CrossRef]
- Wang, J.S.; Guo, T.; Du, Z.Y.; Yu, S.Q. Shaking table tests and parametric analysis of dynamic interaction between soft soil and structure group. Eng. Struct. 2022, 256, 114041. [Google Scholar] [CrossRef]
- Pai, L.F.; Wu, H.G.; Guan, W.; Wei, H.; Tang, L. Shaking table test for seismic optimization of soil slope reinforced by new EPS pile under earthquake. Soil Dyn. Earthq. Eng. 2022, 154, 107140. [Google Scholar] [CrossRef]
- Hamayoon, K.; Morikawa, Y.; Oka, R.; Zhang, F. 3D dynamic finite element analyses and 1 g shaking table tests on seismic performance of existing group-pile foundation in partially improved grounds under dry condition. Soil Dyn. Earthq. Eng. 2016, 90, 196–210. [Google Scholar] [CrossRef]
- Sun, L.M.; Xie, W. Experimental studies on super long-span cable-stayed bridge by using multiple shake table testing. Eng. Mech. 2016, 33, 38–48. [Google Scholar] [CrossRef]
- Choi, J.I.; Yoo, M.T.; Yang, E.K.; Han, J.T.; Kim, M.M. Evaluation of 1-G Similitude Law in Predicting Behavior of a Pile-Soil Model. Mar. Georesources Geotechnol. 2015, 33, 202–211. [Google Scholar] [CrossRef]
- Hussein, A.F.; El Naggar, M.H. Effect of model scale on helical piles response established from shake table tests. Soil Dyn. Earthq. Eng. 2022, 152, 107013. [Google Scholar] [CrossRef]
- Iiba, M.; Tamori, S.; Kitagawa, Y. Shaking Table Test on Effects of Combination of Soil and Building Properties on Seismic Response of Building. In Proceedings of the 4th International Conference on Recent Advances in Geotechnical Earthquake Engineering and Soil Dynamics, San Diego, CA, USA, 30 March 2001. [Google Scholar]
- Shen, C.; Qian, D.L. Dynamic characteristics and seismic response of frame–core tube structures, considering soil–structure interactions. Struct. Des. Tall Spec. Build. 2019, 28, e1575. [Google Scholar] [CrossRef]
- Zhou, X.H.; Cheng, X.S.; Qi, L.; Wang, P.; Chai, S.F.; Liu, Y.J. Shaking Table Model Test of Loess Tunnel Structure under Rainfall. KSCE J. Civ. Eng. 2021, 25, 2225–2238. [Google Scholar] [CrossRef]
- Li, X.J.; Wang, X.H.; He, Q.M.; Liu, A.W. Shaking Table Test for Evaluation of Seismic Behavior of Nuclear Power Plants on Non-Rock Site. Nucl. Power Eng. 2017, 38, 31–35. [Google Scholar]
- Chen, G.X.; Chen, S.; Zuo, X.; Du, X.L.; Qi, C.Z.; Wang, Z.H. Shaking-table tests and numerical simulations on a subway structure in soft soil. Soil Dyn. Earthq. Eng. 2015, 76, 13–28. [Google Scholar]
- Chen, S.; Zhuang, H.Y.; Qu, D.Z.; Yuan, J.; Zhao, K.; Ruan, B. Shaking table test on the seismic response of large-scale subway station in a loess site: A case study. Soil Dyn. Earthq. Eng. 2019, 123, 173–184. [Google Scholar] [CrossRef]
- Jia, K.M.; Xu, C.S.; El Naggar, M.H.; Zhang, X.L.; Du, X.L.; Dou, P.F.; Cui, C.Y. Large-scale shake table testing of pile group-bridge model in inclined liquefiable soils with overlying crusts. Soil Dyn. Earthq. Eng. 2022, 163, 107555. [Google Scholar] [CrossRef]
- Chen, S.; Tang, B.Z.; Kai, Z.; Li, X.J.; Zhuang, H.Y. Seismic response of irregular underground structures under adverse soil conditions using shaking table tests. Tunn. Undergr. Space Technol. 2020, 95, 103145. [Google Scholar] [CrossRef]
- Xing, S.; Wu, T.; Li, Y.B.; Miyamoto, Y. Shaking table test and numerical simulation of shallow foundation structures in seasonal frozen soil regions. Soil Dyn. Earthq. Eng. 2022, 159, 107339. [Google Scholar] [CrossRef]
- Durante, M.G.; Di Sarno, L.; Mylonakis, G.; Taylor, C.A.; Simonelli, A.L. Soil–pile–structure interaction: Experimental outcomes from shaking table tests. Earthq. Eng. Struct. Dyn. 2015, 45, 1041–1061. [Google Scholar] [CrossRef]
- Liang, J.W.; Xu, A.Q.; Ba, Z.N.; Chen, R.D.; Zhang, W.; Liu, M.G. Shaking table test and numerical simulation on ultra-large diameter shield tunnel passing through soft-hard stratum. Soil Dyn. Earthq. Eng. 2021, 147, 106790. [Google Scholar] [CrossRef]
- Zhang, Z.; Li, X.J.; Lan, R.Q.; Song, C.N. Shaking table tests and numerical simulations of a small radius curved bridge considering SSI effect. Soil Dyn. Earthq. Eng. 2019, 118, 1–18. [Google Scholar] [CrossRef]
- Meymand, P.J. Shaking Table Scale Model Tests of Nonlinear Soil Pile-Superstructure Interaction in Soft Clay. Ph.D. Thesis, University of California, Berkeley, CA, USA, 1998. [Google Scholar]
- Chen, G.X.; Zuo, X.; Wang, Z.H.; Du, X.L.; Sun, T. Shaking table model test of subway station structure under far field and near field ground motion. J. Zhejiang Univ. 2010, 44, 1956–1961. (In Chinese) [Google Scholar]
- Chopra, A.K. Dynamics of Structures-Theory and Applications to Earthquake Engineering, 4th ed.; Higher Education Press: Beijing, China, 2007. [Google Scholar]


Publisher’s Note: MDPI stays neutral with regard to jurisdictional claims in published maps and institutional affiliations. |
© 2022 by the authors. Licensee MDPI, Basel, Switzerland. This article is an open access article distributed under the terms and conditions of the Creative Commons Attribution (CC BY) license (https://creativecommons.org/licenses/by/4.0/).