Article

Development and Application of Intelligent Temperature Control System for Large Aqueduct

School of Civil Engineering and Communications, North China University of Water Resources and Electric Power, Zhengzhou 450045, China
*
Author to whom correspondence should be addressed.
Appl. Sci. 2022, 12(23), 12138; https://doi.org/10.3390/app122312138
Submission received: 2 November 2022 / Revised: 22 November 2022 / Accepted: 25 November 2022 / Published: 27 November 2022

Abstract

:
When the temperature rise and fall rates of a large-scale aqueduct with traditional water-cooling technology exceeds the standard, it is difficult to avoid the temperature change of aqueduct concrete deviating from its control curve in the process of temperature rise and fall by adjusting the water flow rate or cooling the water temperature of a water pipe only by manual experience. Aiming at such problems, an intelligent temperature control system for a large aqueduct body is developed and applied, which is composed of an information processing and decision-making module, simulation calculation module and information collection and control module, with real-time interactive information and real-time update of the temperature change control curve. The system is applied to the 1:30 Dongjia Village Aqueduct model experiment. The model experiment results show that the system can automatically adjust the water flow velocity of concrete according to the temperature variation control curve, and update the temperature variation control curve according to the changes of environmental parameters and cooling water parameters.

1. Introduction

A large aqueduct is a typical thin-walled structure. In the early stage of concrete pouring, the structural parts of aqueduct such as the main beam and the upper wall are prone to cracking under the influence of temperature rise caused by the heat of hydration and temperature drop caused by the changes of the ambient temperature, thus destroying the water tightness of the structure and promoting the infiltration of water and salt, which seriously affects the construction quality and durability of the projects [1,2]. Therefore, it is necessary to take certain temperature control and crack prevention measures for the concrete during the construction of the aqueduct. Water cooling is an important temperature control and crack prevention measure in the construction of massive concrete; domestic and foreign research on the cooling theory of concrete water pipes and its application have reached a certain breadth and depth. An artificial water-cooling method has become a key temperature control and crack prevention measure in the construction of massive concrete structures. However, the traditional water-cooling method mainly relies on manual operation, the accuracy of data collection is poor, low efficiency and poor regulation and control accuracy. Especially when the rate of temperature drop of concrete exceeds the standard, it is difficult to avoid the temperature deviation from the design control curve during the cooling process of concrete by adjusting the flow velocity of water pipe or cooling water temperature only by artificial experience, which leads to the cracking of concrete.
The pipe cooling method was implemented in 1931 for the construction of the Owyhee Dam in Oregon [3]. This technique has been used in many countries to control the temperature of large concrete masses, because it is suitable and less expensive for large concrete structures [4,5]. In recent years, with the vigorous promotion of information technology research in the construction industry, many scholars have combined pipeline cooling methods with modern information technology to study the intelligence and digitalization of concrete temperature control and crack prevention. Su [6] constructed a temperature monitoring database of Xiluodu Dam and analyzed the cooling water temperature and the maximum temperature using the correlation analysis method to limit the cooling water temperature. Peng [7] proposed a two-dimensional temperature field reconstruction method based on distributed fiber optic dam field temperature monitoring data and kriging space temperature interpolation to determine the true temperature field of concrete blocks and improve the maximum temperature difference control standard of concrete blocks to 3.5 °C. Liao [8] developed a BIM intelligent temperature control system, which builds a temperature measurement and control system and establishes a temperature warning mechanism based on the secondary development of BIM software, can achieve accurate and sensitive data acquisition, timely temperature early warning and ideal temperature control in practical tests. Ning [9] based on the closed-loop control theory of “multi-source sensing, real analysis, and intelligent control”, a new intelligent cooling control system (ICCS) suitable for the SCC is developed and is further applied to the Wudongde large-scale underground powerhouse. Through the use of on-site monitoring data, numerical simulation and field investigation, the effectiveness of the system for improving the quality of temperature control of the spiral case concrete is verified. Sun [10] developed an intelligent temperature control software system, analysis model and hardware equipment based on the Datengxia Hydraulic Project. This technology can realize the accurate sensing and transmission of information of the whole process from precooling of raw materials to insulation and improve the management of concrete construction. Zhang [11] developed the digital Huangdeng Dam concrete temperature control intelligent monitoring system in combination with Huangdeng Dam. The system is integrated by multiple software and multiple subsystems, which can realize the automated analysis of information, evaluation, early warning alarm and unmanned cooling of dam water pipes.
Scholars have made different contributions to the intellectualization of mass concrete water-cooling methods based on practical projects. Su and Peng [6,7], based on temperature monitoring methods and a temperature database, used different methods to analyze temperature data and get more accurate temperature data and control indicators, but they did not more in-depth research on the intelligence of concrete temperature control. Liao and Ning [8,9] developed an intelligent temperature control system for concrete based on the intelligent cooling of concrete after pouring in bridge and underground powerhouse projects, while Sun and Zhang [10,11] developed an intelligent temperature control system for concrete based on the information interaction and intelligent control of the whole process from raw materials to thermal insulation in hydro junction and dam projects. However, these temperature control systems are based on mass concrete such as dams and bridge foundations, and the ideal control curves used are also determined before construction based on analytical calculations, and no real-time dynamic adjustment is made during the construction process. In contrast, most of the large aqueducts are thin-walled structures, which are usually cast with higher strength concrete, and their temperature control sensitivity and accuracy requirements are significantly different from those of massive concrete such as dams.
Therefore, based on the combination of concrete water pipe cooling and modern information technology, this paper proposes an intelligent temperature control system for large aqueduct troughs in which the concrete temperature variation control curve follows the real-time changes of temperature control measures. The intelligent temperature control system of large aqueduct trough is mainly composed of three modules: information processing and decision-making module, simulation calculation module and information acquisition and control module. The information processing and decision-making module receives the environmental parameters, concrete parameters and cooling water parameters transmitted by the information acquisition and control module in real time. By comparing the temperature change of concrete feature points with the temperature change control curve of each point, the cooling water flow rate to be adjusted is determined. The simulation calculation module automatically calls the solver through the batch file, loads the command stream after modifying the parameters, calculates the temperature stress field of the aqueduct body and then transmits the temperature stress data of the feature points used to update the concrete temperature variation control curve back to the information processing and decision-making module. Information collection and control module receives information processing and decision module control instructions, automatically adjusting the flow rate and valve switch.

2. Intelligent Temperature Control System for Large Aqueduct

2.1. Architecture of Intelligent Temperature Control System

In the early stage of the project, the simulation calculation module is used to simulate and calculate the actual boundary conditions of the project, concrete parameters and the temperature stress field of the aqueduct concrete under different water-cooling conditions. The temperature changes of the concrete at the characteristic point obtained under the working conditions where the stress value of the characteristic point is close to the design value of the tensile strength is taken as the initial temperature variation control curve and stored in the information processing and decision-making module to provide a reference for the intelligent regulation of the water flow rate; At the construction site, the temperature instrument records the machine inlet temperature, warehousing temperature and pouring temperature in real time and automatically transmits them to the information processing and decision-making module, providing necessary data preparation for temperature control effect evaluation, early warning and forecasting and intelligent regulation. During the construction process, the temperature sensor is fixed at the corresponding position of the concrete. The temperature and humidity meter, solar radiation meter, anemometer, flow meter and temperature sensor are used to monitor the temperature and humidity, solar radiation, wind speed, water flow rate, water temperature and other information on the surface of the pouring bin. Data are transmitted to the information processing and decision-making module for storage and management in real time through the signal transmission line and signal acquisition transmitter. The information processing and decision-making module determines the flow rate of cooling water and the valve switch according to the measured temperature variation and temperature variation control curve of concrete characteristic points. The simulation calculation module simulates and calculates the temperature stress field of the aqueduct based on the real boundary conditions and the adjusted cooling water parameters and then transmits back to the information processing and decision module the temperature stress data at the characteristic points. The total control box in the information collection and regulation module receives the regulation instructions from the information processing and decision-making modules, controls the water flow rate and water valve of the water pipe through the connected water pump and solenoid valve and realizes the ideal temperature control of the concrete. The system architecture is shown in Figure 1, and the closed-loop control block diagram is shown in Figure 2.

2.2. Key Technologies and Functions of Intelligent Temperature Control System

The system development and operation environment are shown in Table 1. The simulation and calculation module is based on finite element analysis software and the finite element method, using thermal coupling element to calculate the temperature field and stress field of aqueduct concrete. The information processing and decision-making module are based on the C # program development system, which stores, classifies, calculates and shares data and displays various temperature control information dynamically and intuitively in the form of graphs, tables and lines to realize efficient management of data. The information acquisition and regulation module based on message queue telemetry transmission protocol (MQTT) to achieve lightweight data transmission of wireless information and programmable logic controller (PLC) automation regulation technology. Its modules can achieve wireless transmission of monitoring equipment and systems, accurate real-time access to key engineering parameters and intelligent regulation of the cooling water flow rate and valve switches.

2.3. Features of Intelligent Temperature Control System

(1) The system builds the Internet of Things and adopts wireless transmission to dynamically display temperature, cooling water flow and other data in real time combined with BIM technology, which can realize project visualization, strong applicability and a high degree of automation and intelligence.
(2) The system has a wide range of applications, which can be applied to most hydraulic aqueducts, as well as mass concrete temperature control and crack prevention, and the intelligent data collection can avoid human error.
(3) The system is highly integrated with equipment, monitoring and control are integrated, and data processing is effective and high-speed.

3. Engineering Application of Intelligent Temperature Control System for Large Aqueduct

3.1. Project Overview

The Dongjia Village Aqueduct of Dali Section II of the Central Yunnan Water Diversion Project is planned to be poured at the end of 2022. Its inlet and outlet floor elevations are 1955.333 m and 1955.214 m, respectively, and the design flow is 120 m3/s. The total length of the aqueduct body is 240 m, which is a simply supported prestressed C50 concrete structure in the form of three rectangular box sections, with a total of eight spans of 30 m each.
The construction plan of the aqueduct was poured in two layers with an interval of 15 days; the first layer was poured from the longitudinal beam, bottom rib and bottom plate to the vertical section 50 cm above the bottom “eight” of the wall, with a height of 350 cm. The second layer was poured for the superstructure, including the wall, the walkway plate and the installation of prefabricated tie beam, with a height of 660 cm. The 1.0-cm-thick foam plastic plates were used to attach to the surface of the steel formwork to keep the temperature constant, which was removed on the 9th day after casting.
The four seasons of the aqueduct project area do not change obviously, with an average temperature of 9.5 °C in January and 21.8 °C in June. The temperature is constant in the winter and spring, rainy in the summer and autumn and the dry and wet seasons are clearly distinguished. According to the information from the local meteorological observatory, its multi-year monthly average temperature is shown in Table 2.

3.2. Simulation Calculation Module

One span of the Dongjia Village Aqueduct was selected as the calculation model. The aqueduct and water pipe model was established by the heat flow coupling method, as shown in Figure 3. The material parameters are shown in Table 3.
The formula of the outside air temperature T q during the construction period of the aqueduct is shown in Equation (1), the cooling water temperature is taken as the average temperature T j in the month of construction and the pouring temperature of concrete is set to 25 °C. The simulated calculation time is 20 days, and the calculation step is 3 h. The water is opened immediately after pouring, and the water opening time is 8 days. The adiabatic boundary was set to the bottom surface, the equivalent exothermic coefficient β s of the slot body and the air is calculated by Formulas (2) and (3) [12].
T q = T j + 5 × cos π × i 4
β = 18 . 46 + 17 . 36 ν a 0.883
β s = 1 1 / β + h / λ
where i is the number of calculation step, β is the exothermic coefficient of solid surface in air, ν a is the average wind speed at the construction site, h is the thickness of insulation material and λ is the thermal conductivity of insulation material.

3.2.1. Tensile Strength of C50 Concrete

C50 concrete has the highest strength among ordinary strength concrete, and its material properties such as strength and modulus of elasticity change with time in a significantly different way from other ordinary strength concrete, which is essential for the control of temperature stress in the structure of the aqueduct during the construction period. Equation (4) is an expression for the variation of the cube compressive strength of C50 concrete with time fitted by Zhao [13] based on experimental data. The mean, standard and design values of the axial tensile strength of concrete were obtained sequentially according to the cube compressive strength [14,15,16], as shown in Figure 4.
f c u , t = 56.8 t 0.83 1.54 + 0.94 t 0.83
f t , m = 0.395 f c u , t 0.55
f t k = 0.88 α c 2 f t , m 1 1.645 δ
f t = f t k / γ c
where f c u , t is the cubic compressive strength of concrete at age t , δ is the variation coefficient of concrete (0.11 for C50 concrete), α c 2 is the brittle reduction coefficient of concrete (0.97 for C50 concrete) and γ c is the material subitem coefficient of concrete (taken as 1.40).

3.2.2. Establishment of the Characteristic Point

The aqueduct is a thin-walled structure cast with C50 concrete. Early cracks may arise on the surface of the side walls or the joint surface of the old and new concrete, which may affect the structure safety [17,18]. Sidewall surface: C50 concrete exerts heat quickly in the early stage. The internal and surface of the aqueduct can produce a large temperature difference in two or three days after pouring, and cracks will occur when the tensile stress of the concrete surface exceeds the design value. A combined surface of old and new concrete: the concrete of the aqueduct is poured in layers with an interval of 15 days when the second layer of concrete is poured, which will be constrained by the first layer. The large tensile stresses will be generated in surface of old and new concrete due to the constraint and temperature, which will result cracks [19].
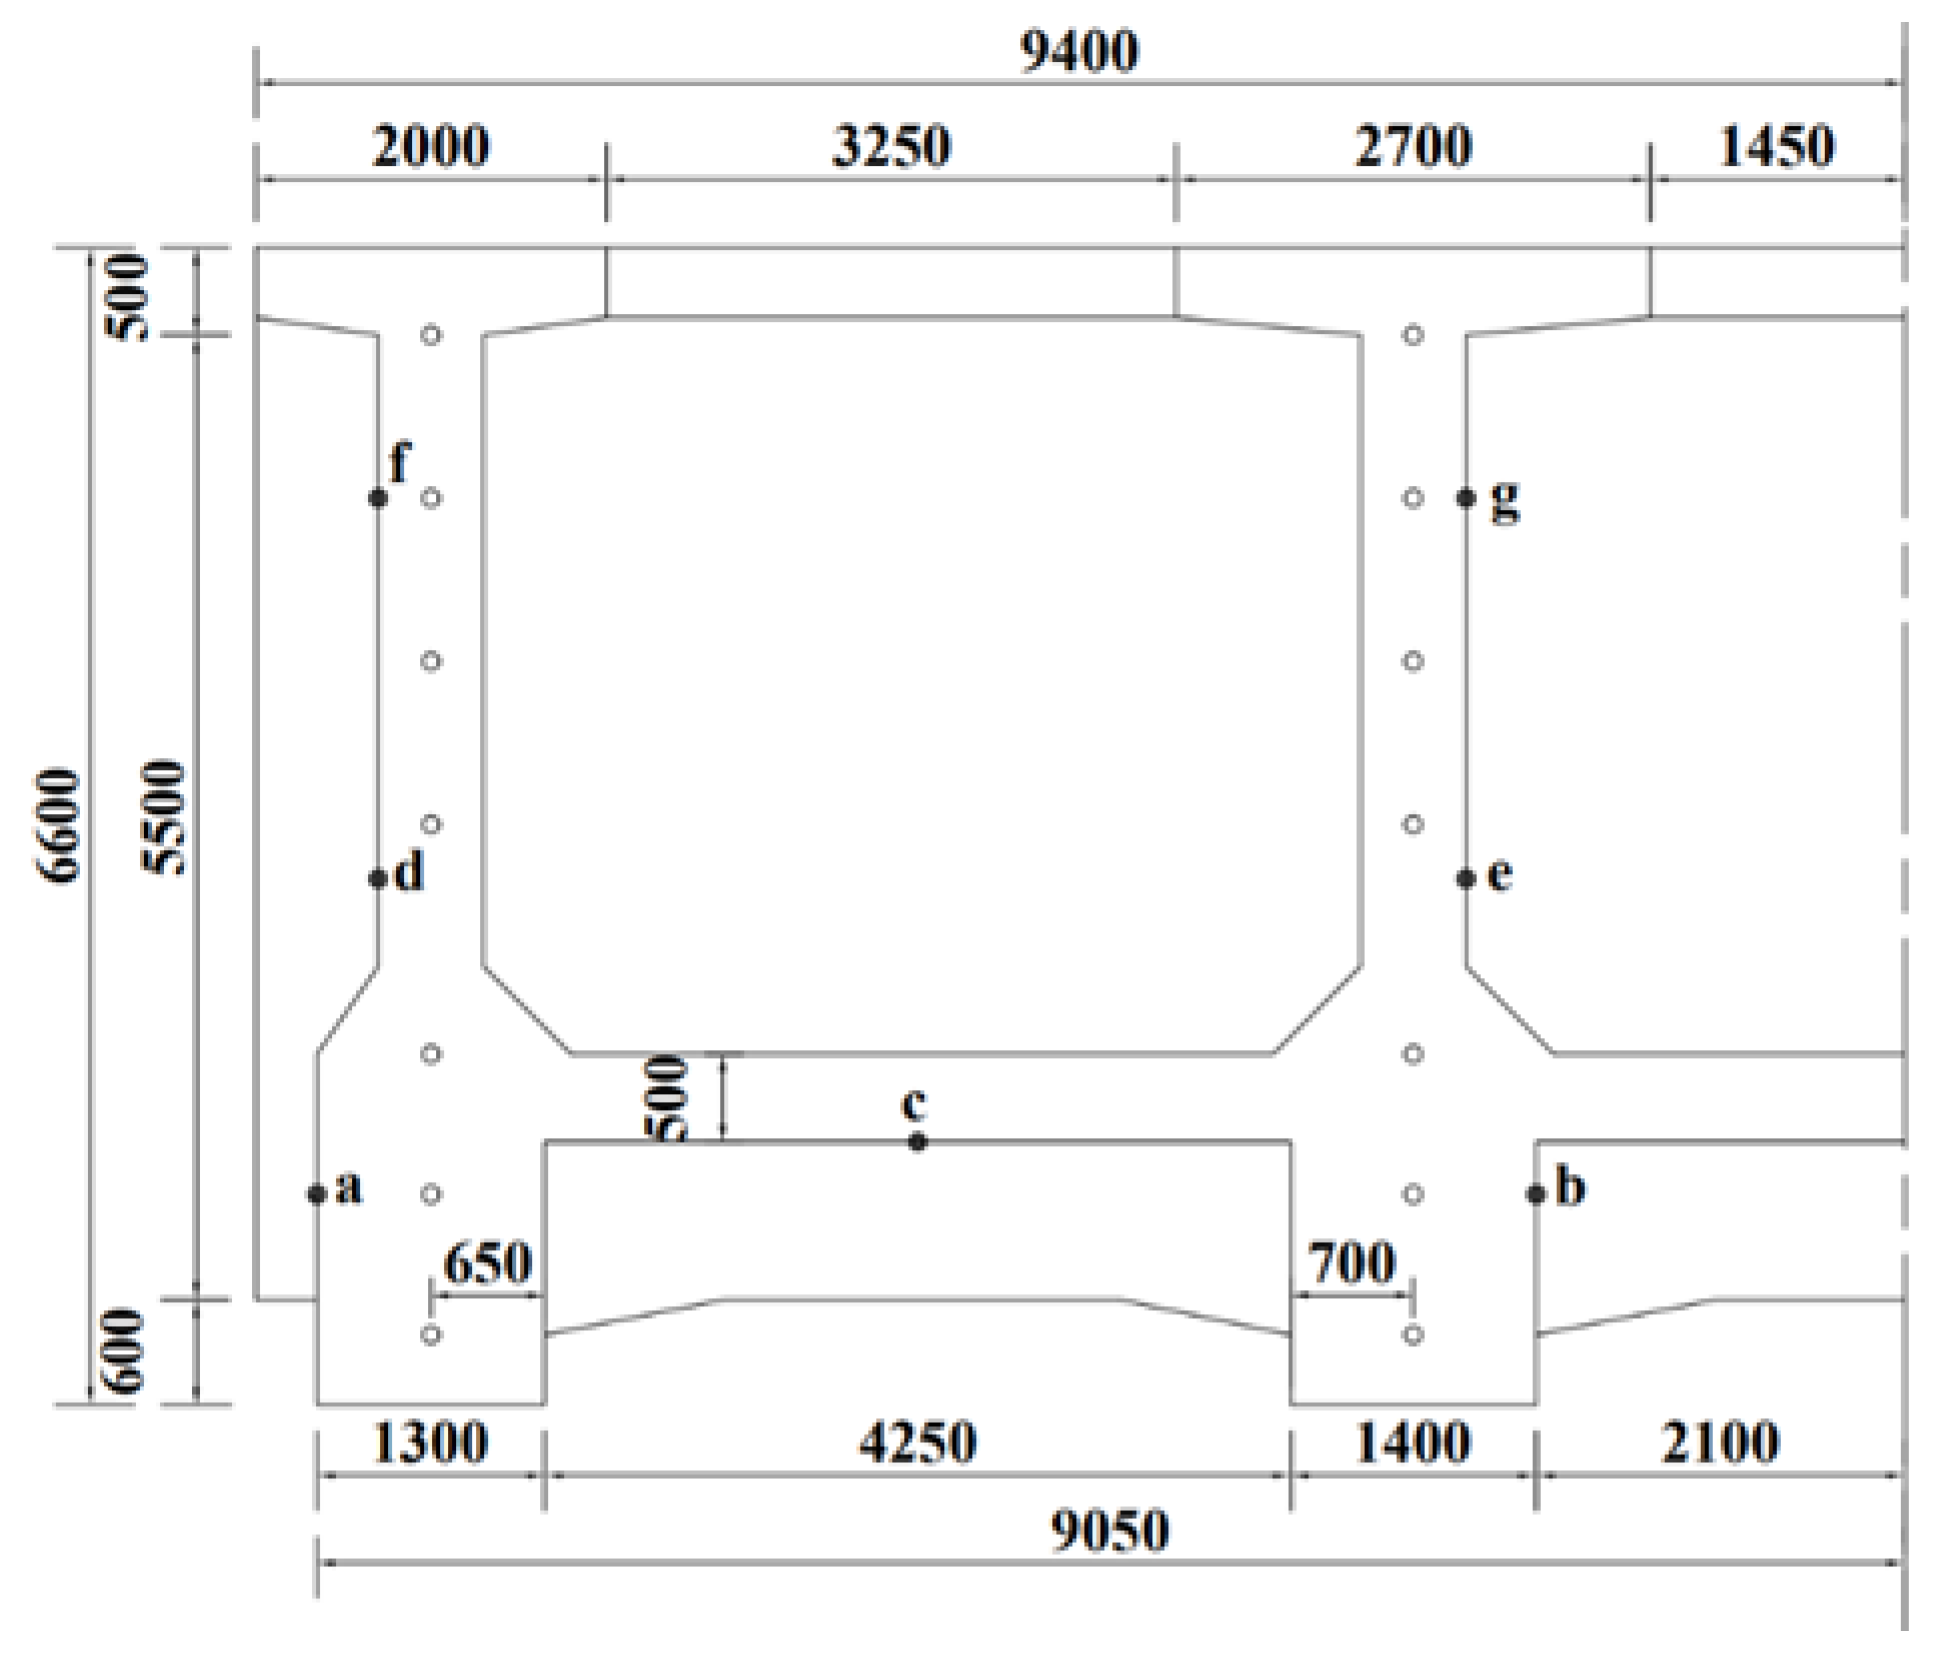
In order to prevent the occurrence of cracks affecting structural safety and to characterize the temperature stress field of concrete for the aqueduct, the characteristics of seven locations (a–g) on the mid-span section of the aqueduct are taken as the characteristics, taking into account the symmetry of the aqueduct structure, the temperature stress and the comprehensive influence of concrete gravity, as shown in Figure 5.

3.2.3. Initial Temperature Variation Control Curve

According to the literature [20], the cooling effect of turbulent flow is better than laminar flow when water is passed, and the plastic water pipe with an inner diameter of 40 mm and an outer diameter of 46 mm is used in this project. The critical flow velocity of turbulent flow and laminar flow in the pipe is 0.066 m/s, and the recommended flow velocity is about 0.6 m/s [21,22].
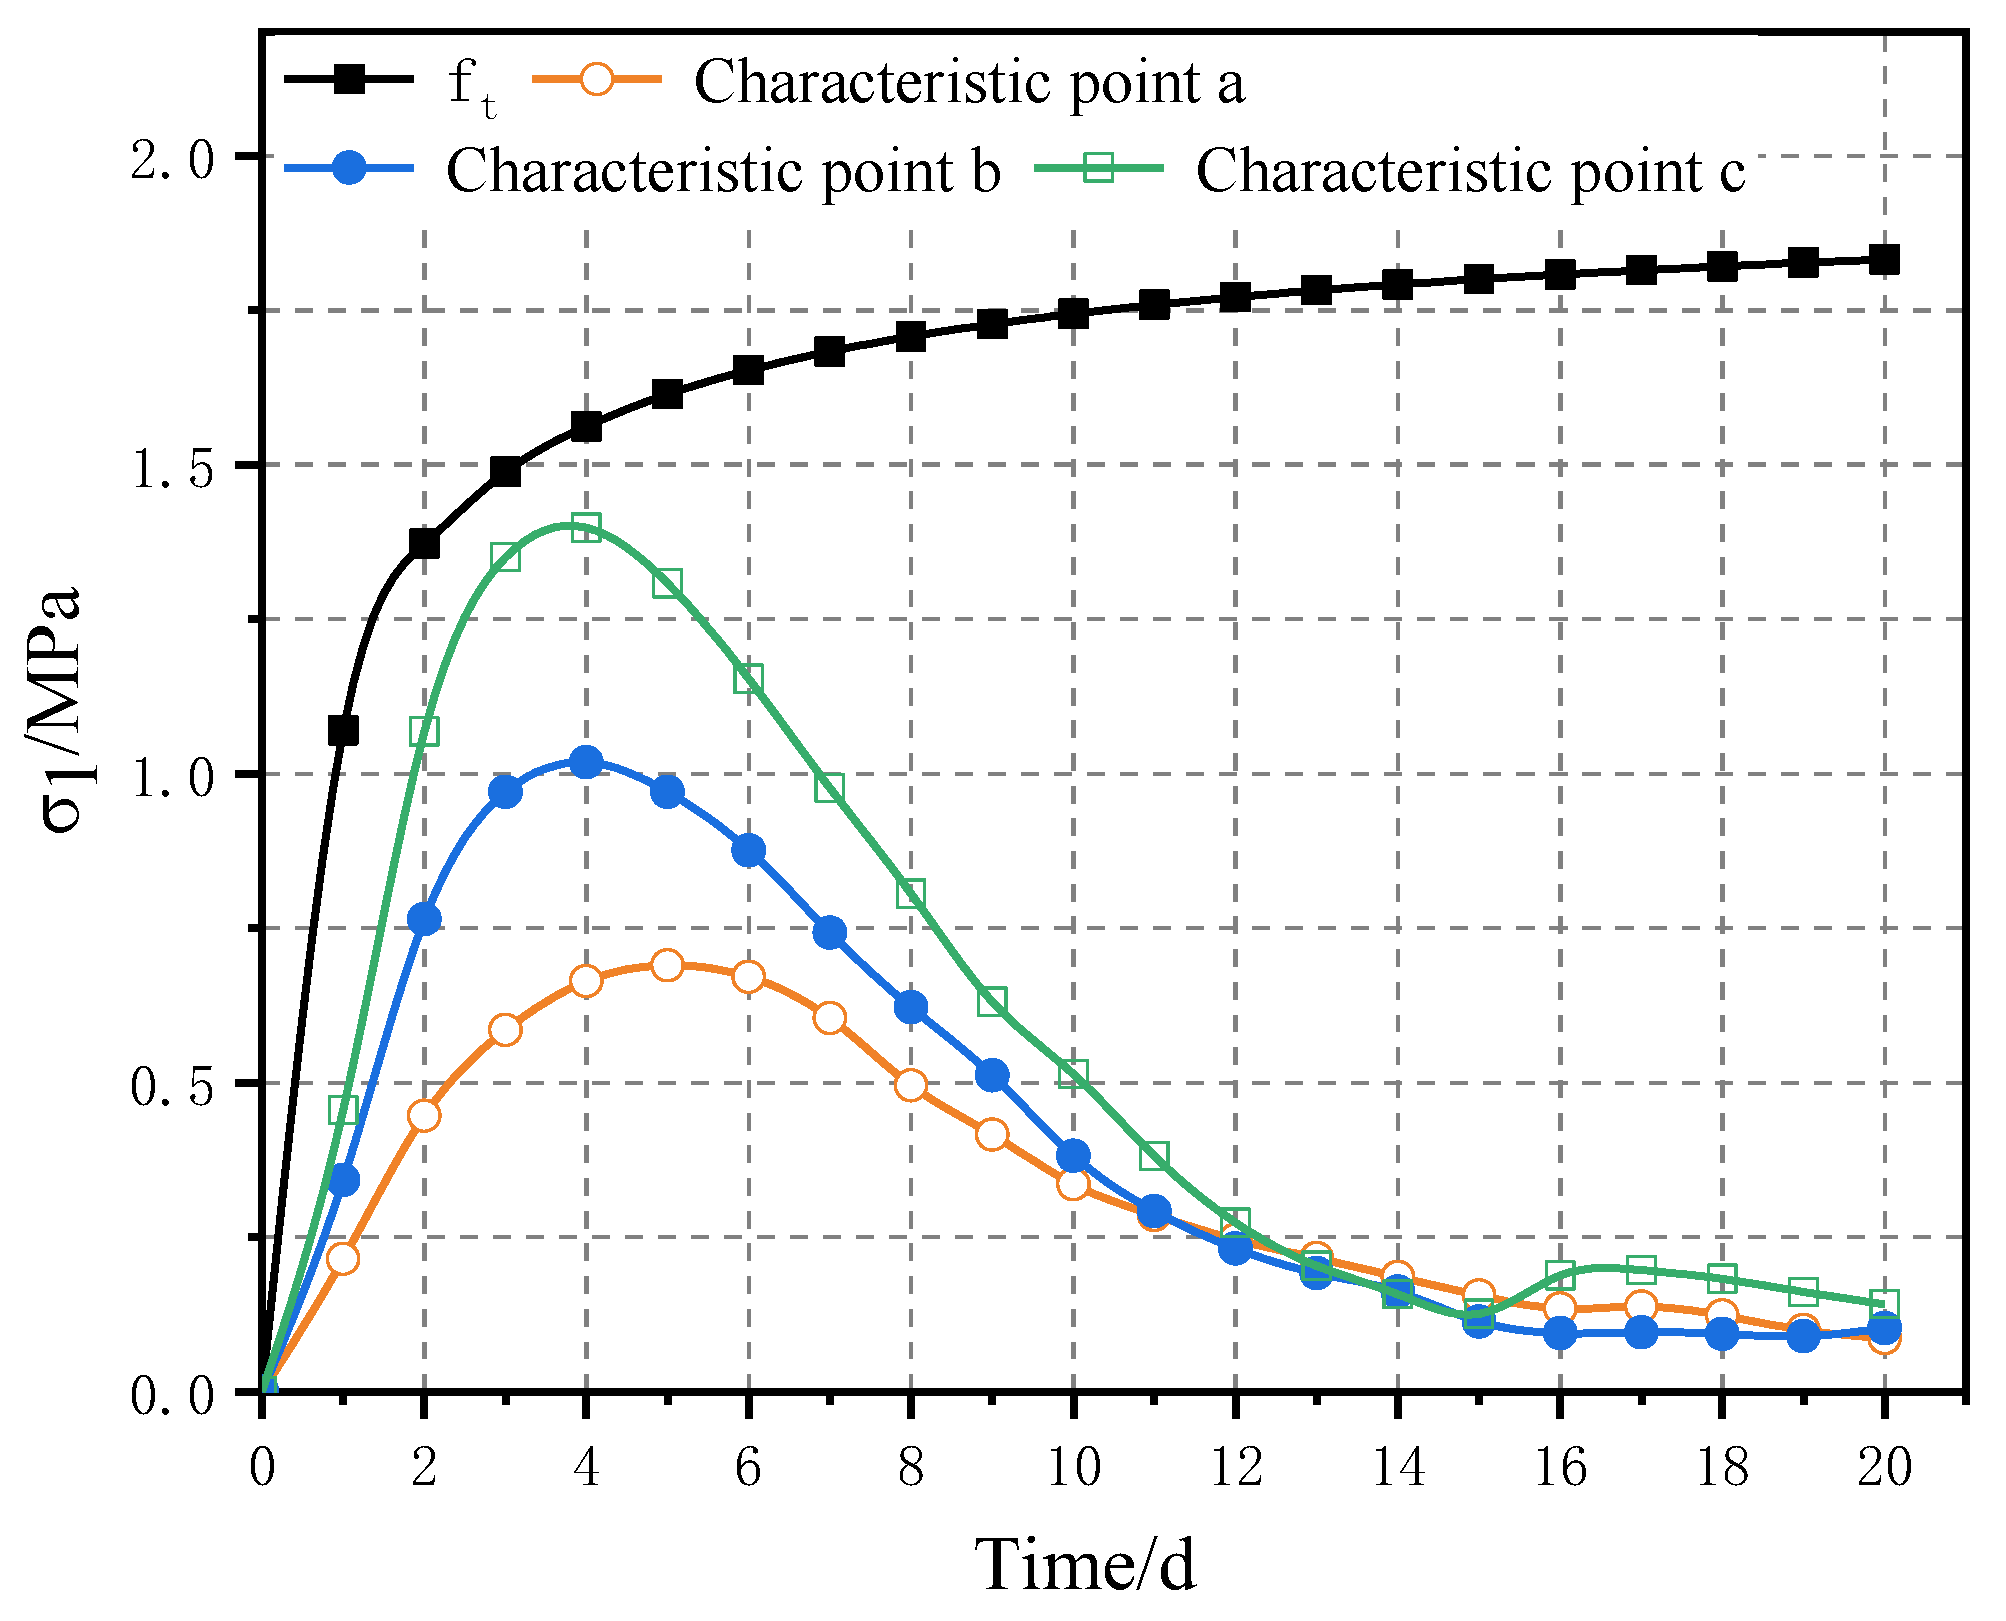
According to the expected pouring time of the actual project, the concrete pouring temperature of the aqueduct was temporarily set at 25 °C. The cooling water temperature and boundary temperature were 15.2 °C, the average temperature in March. Under the same working conditions, the stress at the characteristic point c is greater than that at other characteristic points. The simulations calculate the stress values of the characteristic point c at the combination surface of new and old concrete when no water or water flow rate at 0.1 m/s, 0.3 m/s, 0.5 m/s and 0.7 m/s are shown in Figure 6, respectively.
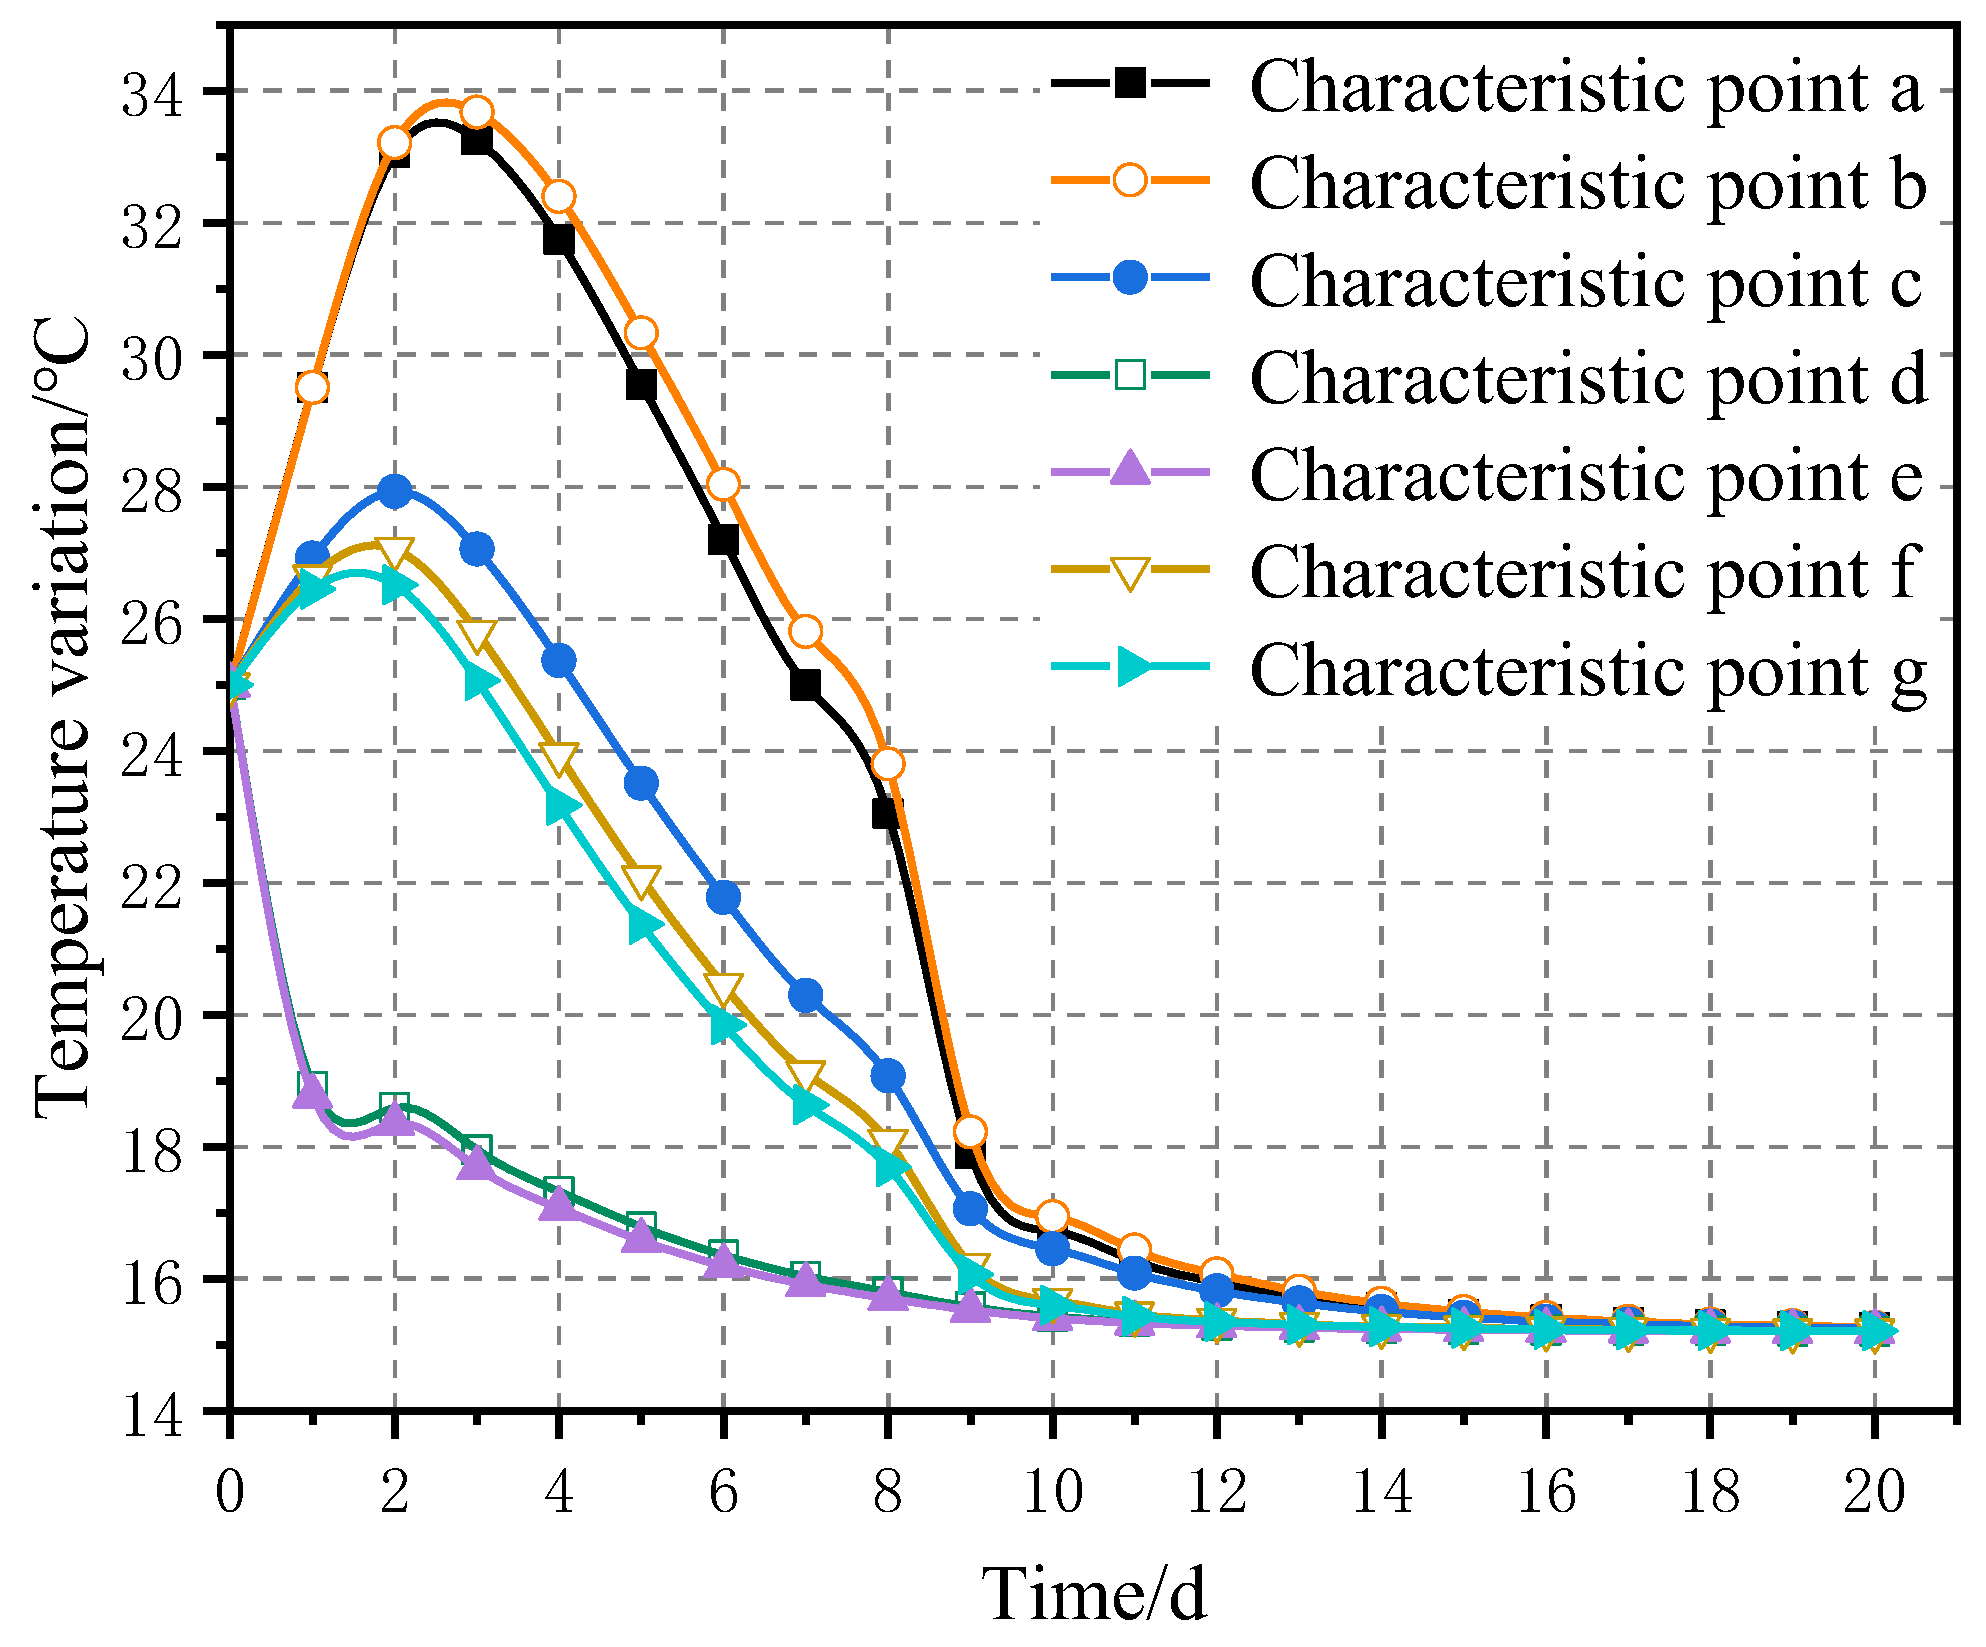
In various working conditions, when the cooling water flow rate is greater or equal to 0.5 m/s, the stress value of characteristic point d will be less than the design value of the real-time tensile strength of C50 concrete. Figure 7 and Figure 8 show the stress duration curves of each characteristic point when the cooling water flow rate is 0.5 m/s. On the third day after placing the second layer concrete of the aqueduct, the tensile stress value of characteristic point C reaches 1.48 MPa, while the design value of the tensile strength of C50 concrete is 1.49 MPa. Figure 9 shows each characteristic point of the temperature variation curve for the initial temperature variation control curve at the cooling water flow rate of 0.5 m/s working conditions.

3.2.4. Information Interaction between the Simulation Calculation Module and the Information Processing and Decision-Making Module

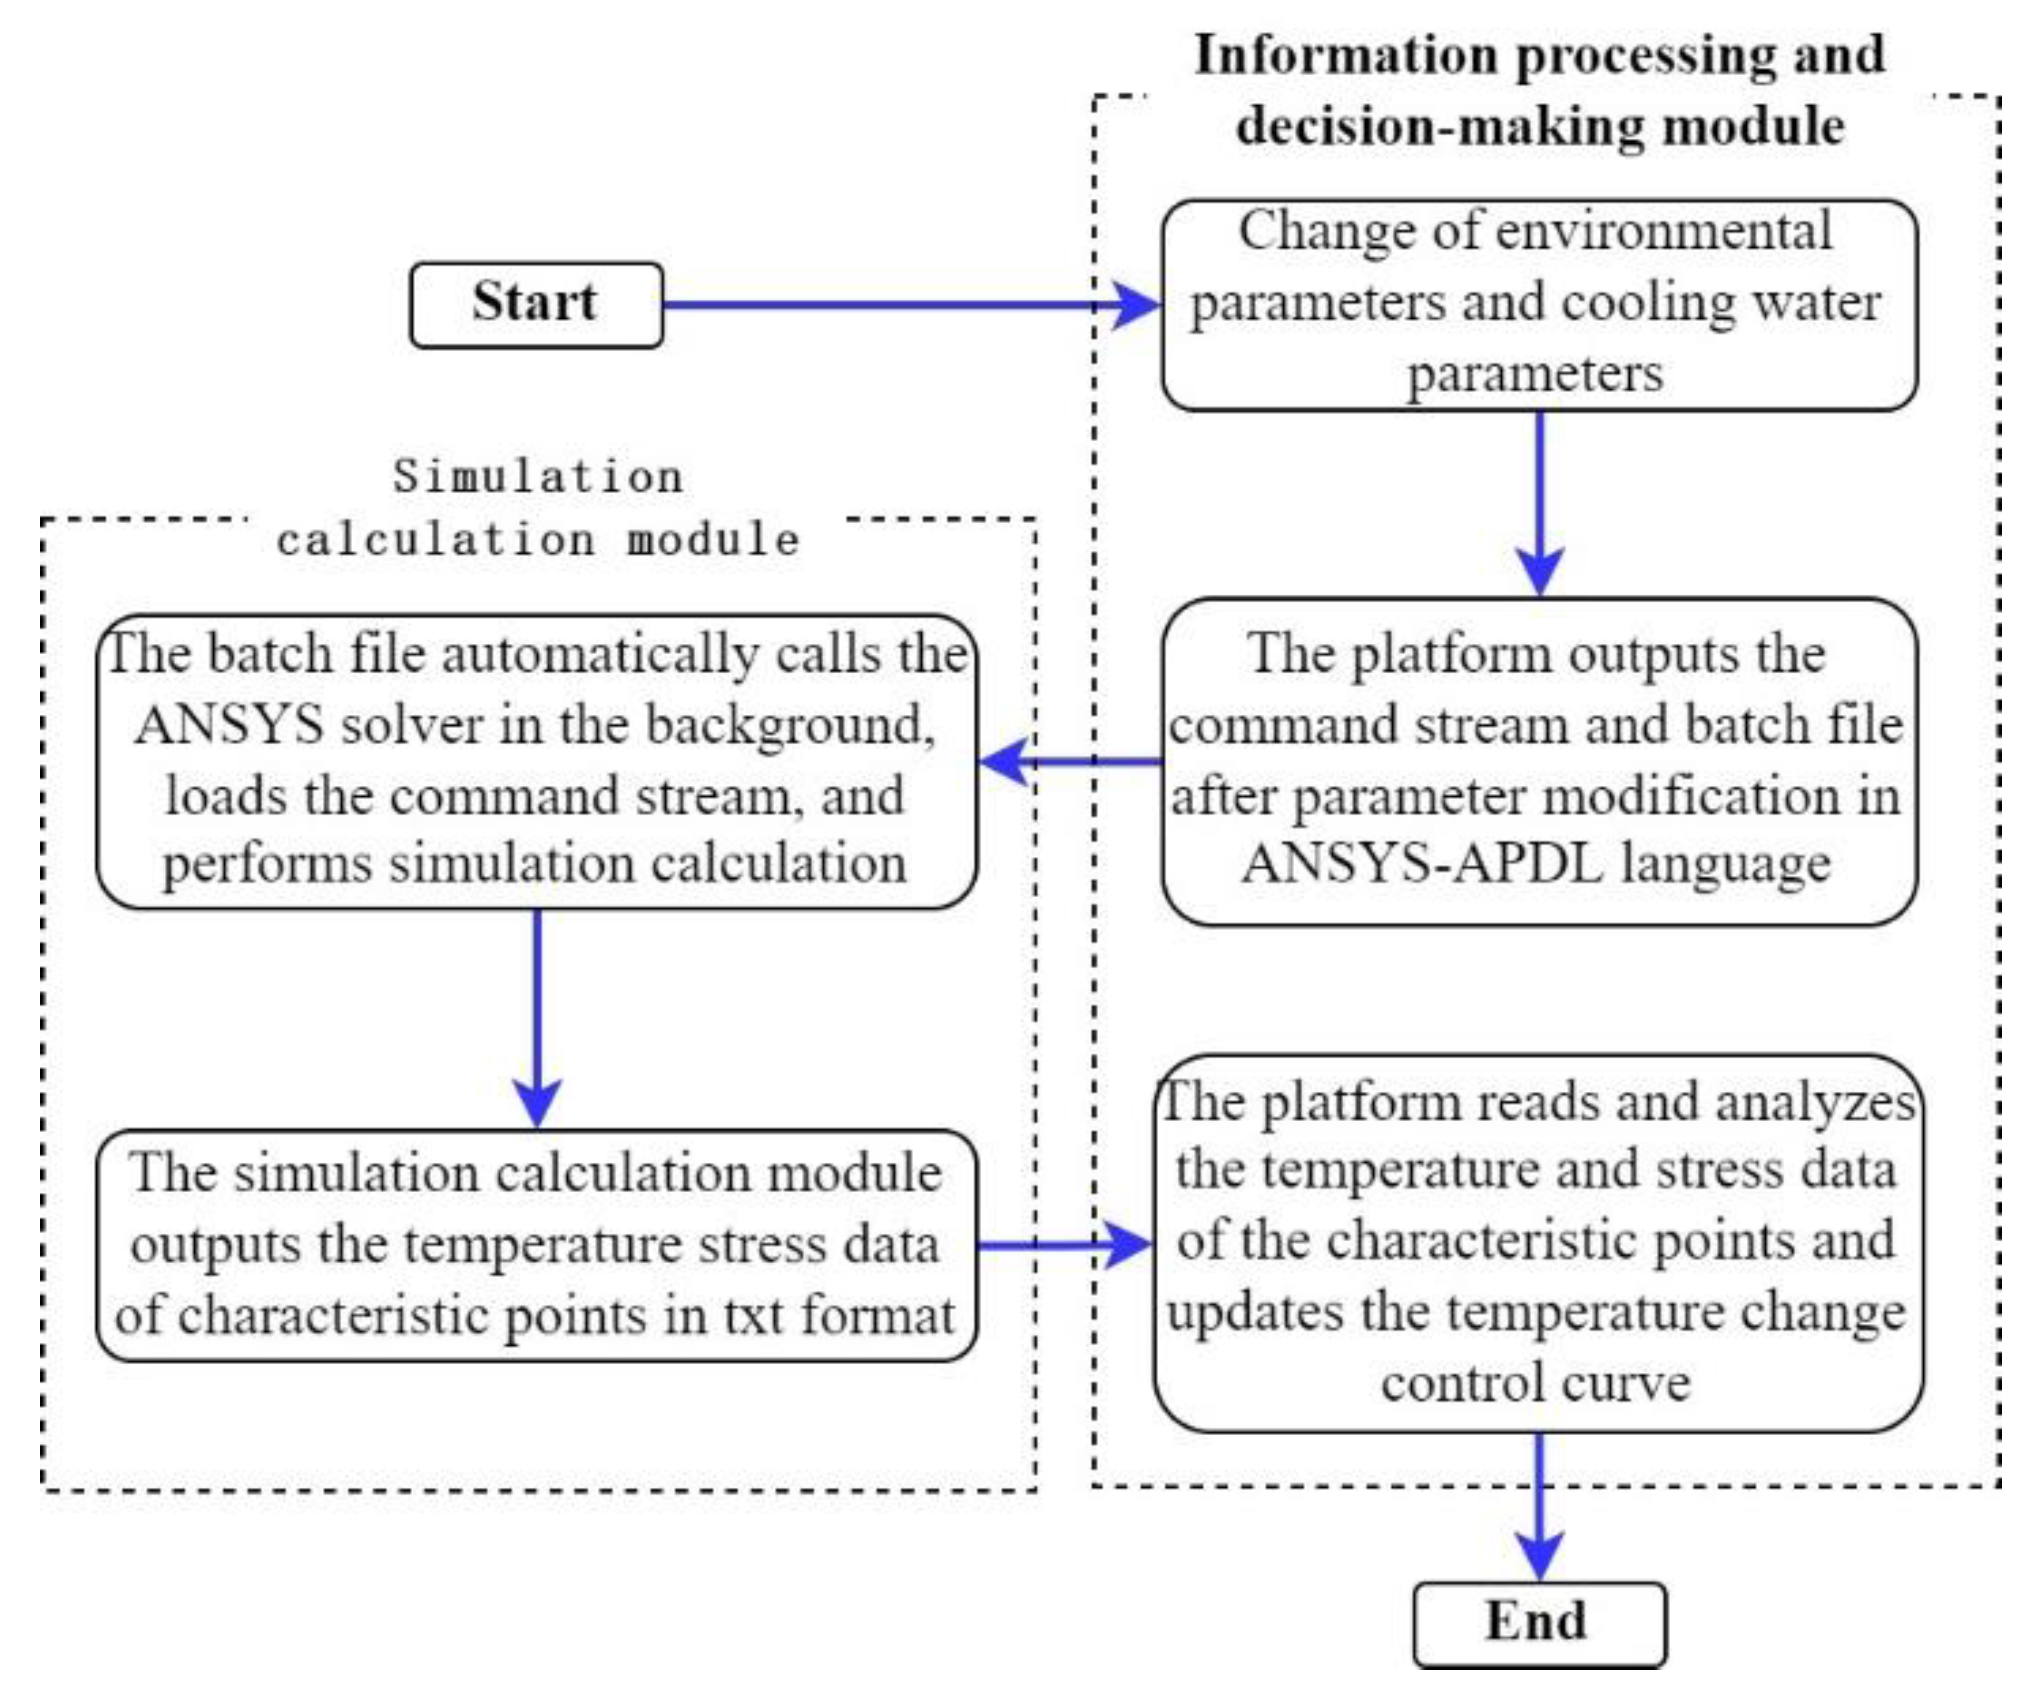
During the construction period of the aqueduct, there is real-time information interaction between the system simulation calculation module and the information processing and decision-making module. The purpose is to update the temperature variation control curve based on the changes of environmental parameters and cooling water parameters. The detailed interaction process is shown in Figure 10.

3.2.5. Tracking of Parameter Change by Temperature Change Control Curve

The temperature of the construction site is set to be 2 °C higher than that of previous years, and the temperature stress field of the aqueduct concrete is simulated and calculated. It can be seen from Figure 7 and Figure 8 that characteristic points c and d are the points with higher stress among all characteristic points, and the stress duration curves of characteristic points c and d are given. As shown in Figure 11, on the third day, the stress value of characteristic point d exceeds the design value of the axial tensile strength of concrete at this time. Take some adjustment measures and adjust the water flow velocity from 0.5 m/s to 0.7 m/s after the first day. At this time, the stress duration curves of characteristic points c and d are shown in Figure 11, meeting the strength requirements. The temperature change control curve of aqueduct concrete with parameter change is shown in Figure 12.

3.3. Model Experiments

3.3.1. Establishment of Experimental Scenario

The experimental structure is shown in Figure 13. According to the “bow” path; the cooling pipes in the aqueduct are arranged, the inlet pipes are connected to the inlet tank 1.1 through flow meter 4, solenoid valve 3 and water pump 2; the return pipes are connected to the return tank 1.2 through flow meter 4 and the water tanks 1.1 and 1.2 are connected through pipes. One temperature sensor and one flowmeter are, respectively, arranged at the water inlet and the return outlet, three temperature sensors at equal intervals next to the cooling pipe of the aqueduct.
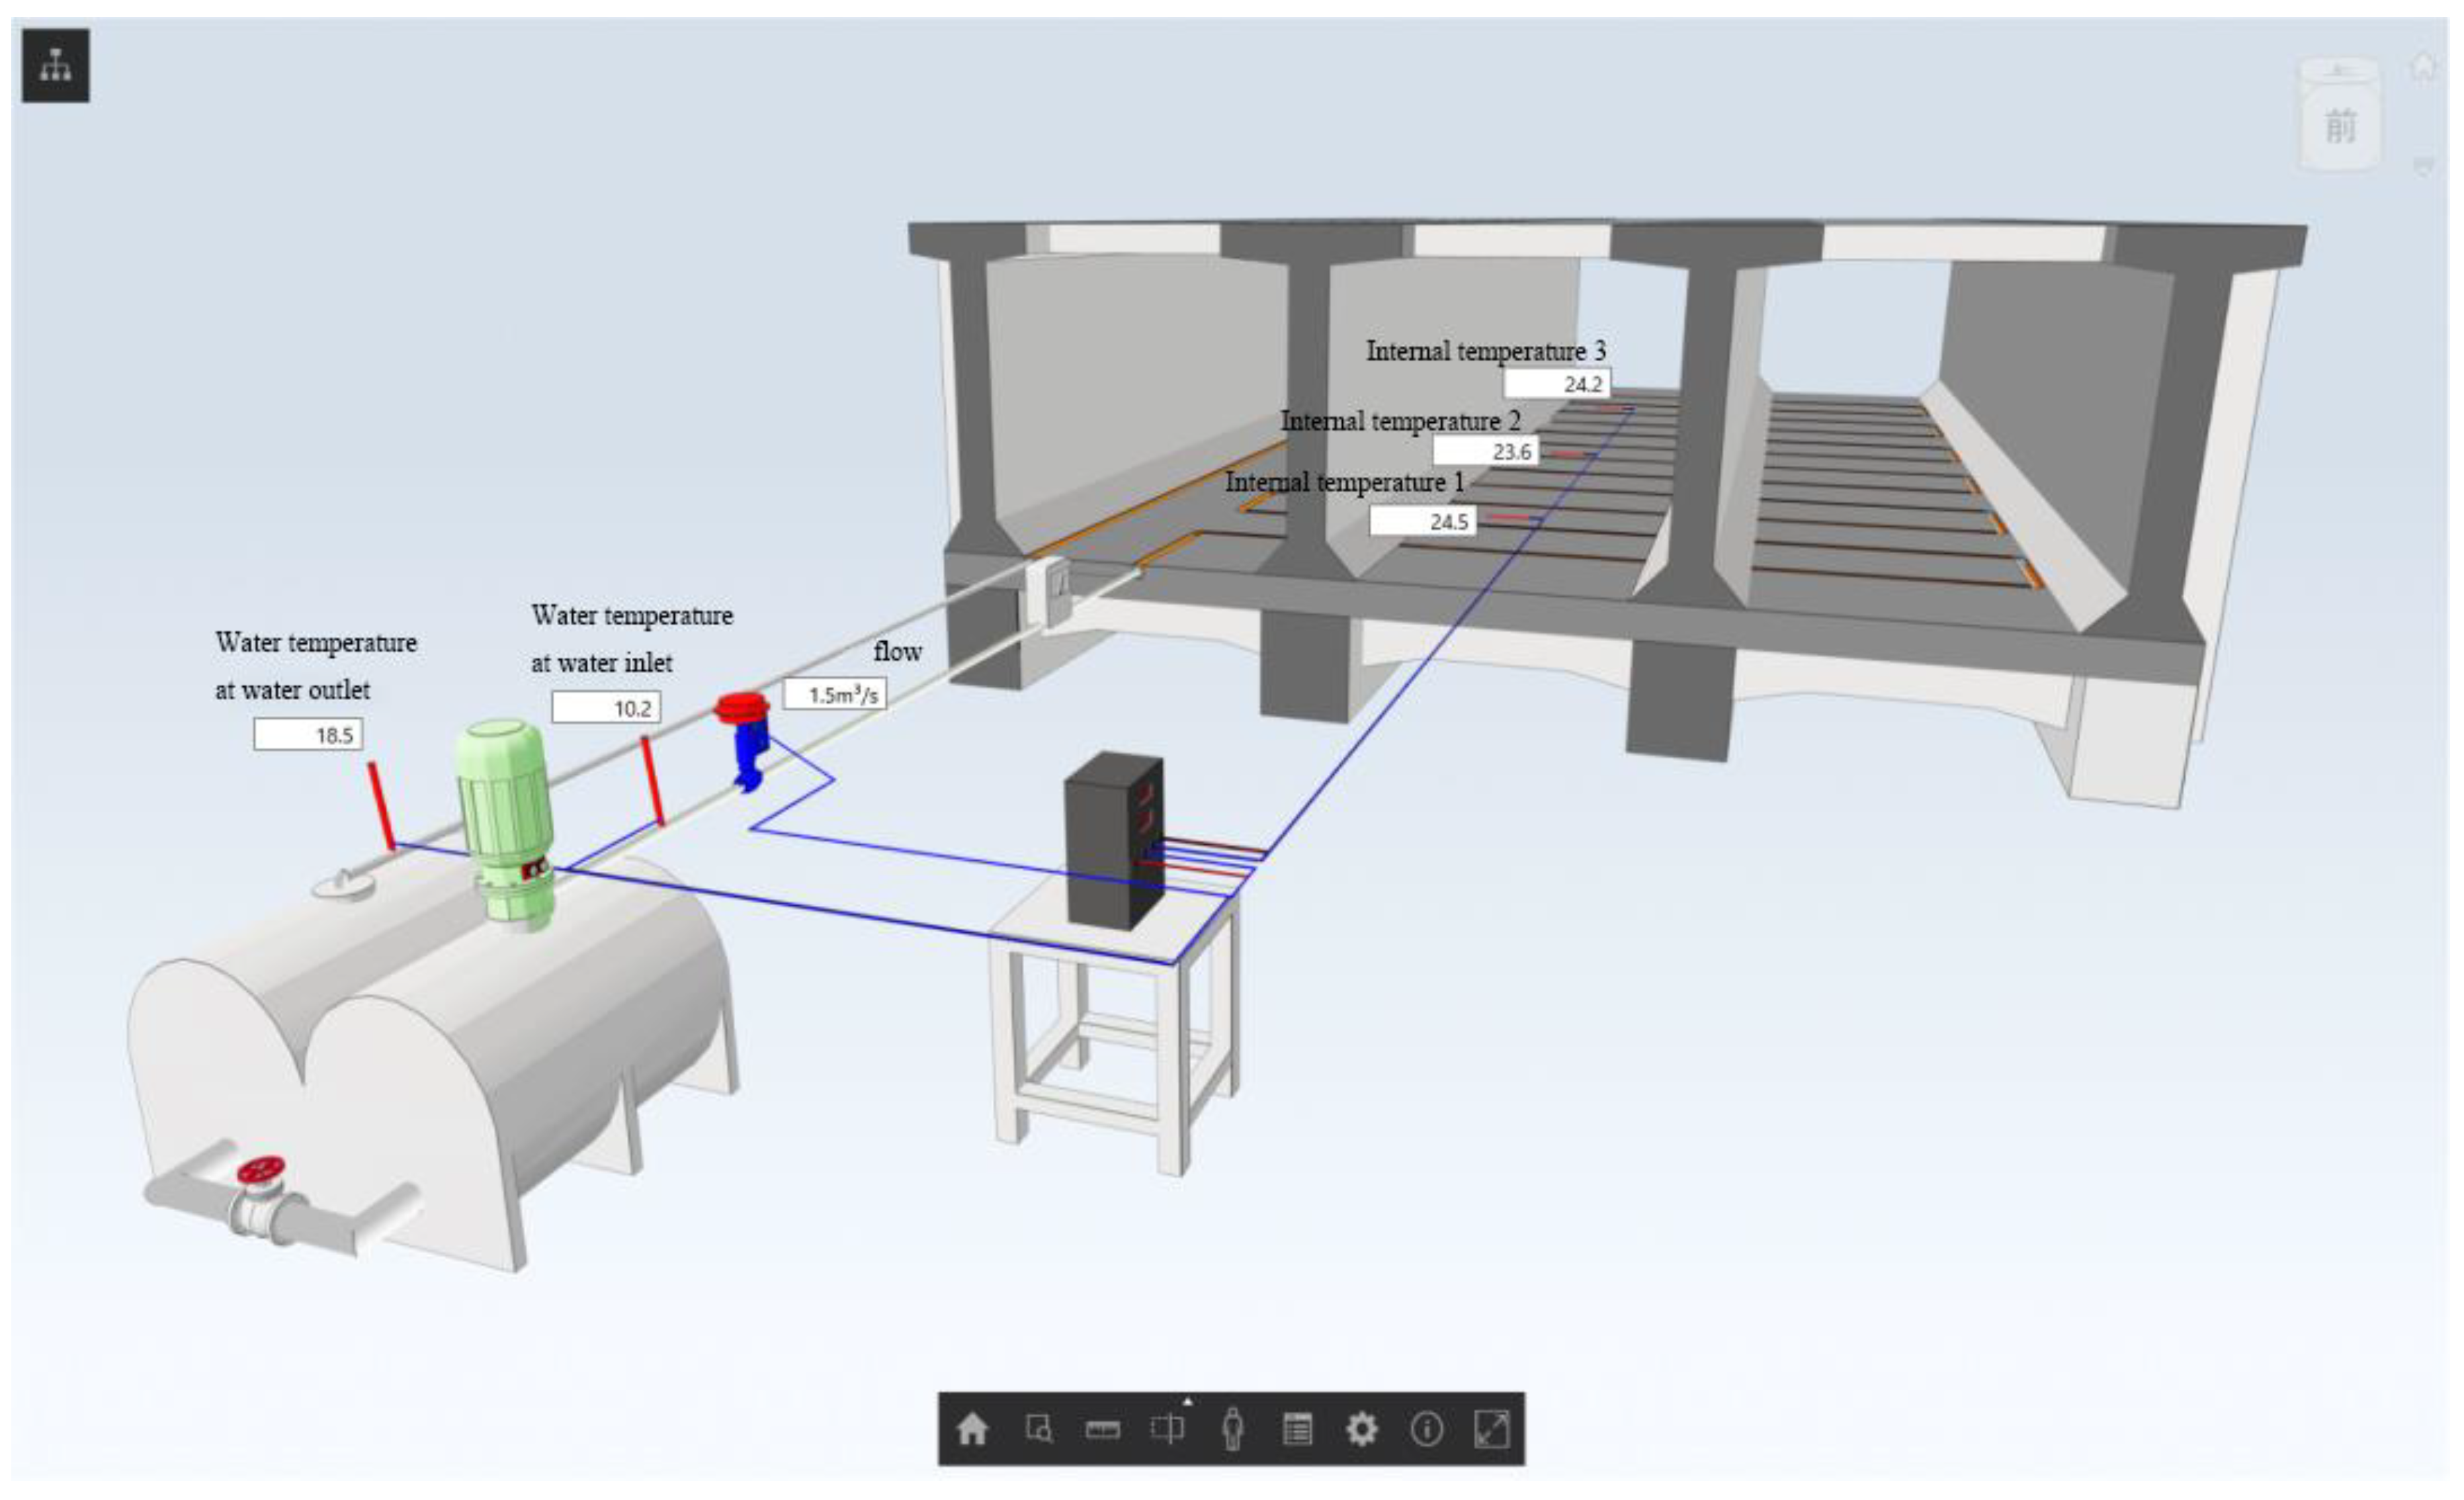
According to the structure drawing of Dongjia Village Aqueduct, a 1:30 solid model of the aqueduct was established, with an opening at the upper end of the trough and the arrangement path of the pipes reserved at the bottom of the trough. Transparent material is used for through the water cooling pipe with a diameter of 6 mm, and tracers such as pigments are added for observation during the experiments. Figure 14 presents the model experiment of the aqueduct, and Figure 15 shows the BIM model of the aqueduct.

3.3.2. Measuring and Control Unit

The measurement and control unit includes pump drive control device 6, pump command control device 7, solenoid valve command control device 8, flow collection module 9 and temperature collection module 10. The temperature sensor in the aqueduct, the temperature sensors 5 at the inlet and return ports and the flow meter 4 are connected to temperature collection module 10 and flow collection module 9, respectively, through concrete signal transmission lines; the pump command control device 7 and the pump drive control device 6 are connected to pump 2 through signal transmission lines and the solenoid valve command control device 8 is connected to solenoid valve 3 through signal transmission lines. The flow collection module 9 and the temperature collection module 10 collect information in real time and transmit the collected environmental parameters, concrete parameters and cooling water parameters to the information processing and decision-making module. The information processing and decision-making module issues control commands for the cooling water and changes the switching of the water pump and the flow rate of the cooling water through the pump command control of device 7 and the solenoid valve command control of device 8.

3.3.3. Experimental Situation

The information processing and decision-making module can receive environmental parameters, concrete parameters and cooling water parameters in real time and send commands through wireless transmission to realize the automatic switch of the cooling water pipe valve and control of flow velocities.

4. Conclusions

An intelligent temperature control system for large-scale aqueduct body is developed, which consists of information processing and decision-making module, simulation calculation module and information acquisition and control module.
The simulation calculated the temperature field and stress field of Dongjia Village Aqueduct, realized real-time information interaction between information processing and decision-making module and simulation calculation module and provided the initial temperature variation control curve of aqueduct concrete and the method of real-time updating temperature change control curve, which provided a control target for meeting the requirements of concrete temperature control and crack prevention.
The real-time interaction between the information processing and decision-making module and the model experiment site information are realized through the 1:30 aqueduct model experiment. In the BIM model, the information processing and decision-making module will display the monitoring data in real time. According to the deviation between the temperature variation and the temperature variation control curve measured at the concrete characteristic points, the automatic control of the cooling water flow rate is carried out, which verifies the feasibility of the system.

Author Contributions

Conceptualization, K.S.; data curation, S.Z.; writing—original draft preparation, Z.W.; writing—review and editing, Y.S.; project administration, D.Z.; All authors have read and agreed to the published version of the manuscript.

Funding

The support by the National Natural Science Foundation of China (No. 11502081), the Science and Technology Project of Henan Province (No. 212102310951) and the Foundation of MWR Center for Levee Safety and Disease Prevention Research (No. 2019005) is gratefully acknowledged.

Institutional Review Board Statement

Not applicable.

Informed Consent Statement

Not applicable.

Data Availability Statement

Not applicable.

Conflicts of Interest

The authors declare that they have no conflict of interest to report regarding the present study.

References

  1. Chu, I.; Lee, Y.; Amin, M.N.; Jang, B.-S.; Kim, J.-K. Application of a thermal stress device for the prediction of stresses due to hydration heat in mass concrete structure. Constr. Build. Mater. 2013, 45, 192–198. [Google Scholar] [CrossRef]
  2. Briffaut, M.; Benboudjema, F.; Torrenti, J.-M.; Nahas, G. Effects of early-age thermal behaviour on damage risks in massive concrete structures. Eur. J. Environ. Civ. Eng. 2012, 16, 589–605. [Google Scholar] [CrossRef]
  3. Zuo, Z.; Hu, Y.; Li, Q.; Zhang, L. Data Mining of the Thermal Performance of Cool-Pipes in Massive Concrete via In Situ Monitoring. Math. Probl. Eng. 2014, 2014, e985659. [Google Scholar] [CrossRef] [Green Version]
  4. Tang, H.; Cai, D.S.; Yang, L. New Planning of Pipe Cooling in Temperature Control for Mass Concrete. Appl. Mech. Mater. 2013, 300–301, 1584–1588. [Google Scholar] [CrossRef]
  5. Azenha, M.; Sfikas, I.P.; Wyrzykowski, M.; Kuperman, S.; Knoppik, A. Temperature Control. In Thermal Cracking of Massive Concrete Structures: State of the Art Report of the RILEM Technical Committee 254-CMS; Fairbairn, E.M.R., Azenha, M., Eds.; RILEM State-of-the-Art Reports; Springer International Publishing: Cham, Switzerland, 2019; pp. 153–179. ISBN 978-3-319-76617-1. [Google Scholar]
  6. Su, Z.; Zhou, Y.; Zhao, C.; Zhou, H.; Peng, Y. Analysis of temperature monitoring data of Xiluodu Dam during construction based on data mining. Water Resour. Power 2016, 34, 70–73. [Google Scholar]
  7. Peng, H.; Lin, P.; Yang, N.; Li, M.; Qiao, Y. Real time thermal field analysis on Wudongde super high arch dam during construction. Glob. Energy Interconnect. 2019, 2, 264–269. [Google Scholar] [CrossRef]
  8. Liao, Z.; Wei, W.; Zhao, L.; Zhang, Y. Application of intelligent temperature control system of mass concrete based on BIM. J. Civ. Archit. Environ. Eng. 2016, 38, 132–138. [Google Scholar]
  9. Ning, Z.; Lin, P.; Ouyang, J.; Yang, Z.; He, M.; Ma, F. Intelligent cooling control for mass concrete relating to spiral case structure. Adv. Concr. Constr. 2022, 14, 57–70. [Google Scholar] [CrossRef]
  10. Sun, X.; Li, S. Intelligent temperature control system for concrete crack prevention of Datengxia Hydraulic. China Water 2020, 4, 45–47. [Google Scholar]
  11. Zhang, L.; Zhang, G.; Liu, Y.; Zheng, A.; Chi, F.; Pang, B. Development and application of digitalized intelligent concrete temperature control system for Huangdeng Dam. Water Resour. Hydropower Eng. 2019, 50, 108–114. [Google Scholar] [CrossRef]
  12. Zhu, B. Thermal Stresses and Temperature Control of Mass Concrete; China Water & Power Press: Beijing, China, 2012. [Google Scholar]
  13. Zhao, S.; Gao, Y.; Chen, J.; Liu, S.; Sun, Y. Application and study on time-dependent compressive strength and elastic modulus of C50 pumping concrete. Concrete 2015, 1, 98–101. [Google Scholar]
  14. Zhao, S. Concrete Structural Fundamentals; Tongji University Press: Shanghai, China, 2004. [Google Scholar]
  15. Oluokun, F. Prediction of Concrete Tensile Strength from its Compressive Strength: An Evaluation of Existing Relations for Normal Weight Concrete. Mater. J. 1991, 88, 302–309. [Google Scholar] [CrossRef]
  16. Fib. Fib Model Code for Concrete Structures 2010: FIB MODEL CODE 2010 O-BK; Wiley-VCH Verlag GmbH & Co. KGaA: Weinheim, Germany, 2013. [Google Scholar] [CrossRef]
  17. Zhang, Y.; Li, Q. Technology of temperature control and crack prevention for Diao river aqueduct project. Concrete 2014, 11, 143–147. [Google Scholar]
  18. Xie, L.; Huang, G.; Li, D.; Zhang, B. Analysis on the causes of cracks on the inner surface of the side wall of Shahe aqueduct and research on temperature control and crack prevention measures. China Rural Water Resour. Hydropower 2022, 1, 134–140. [Google Scholar]
  19. Maruyama, I.; Lura, P. Properties of early-age concrete relevant to cracking in massive concrete. Cem. Concr. Res. 2019, 123, 105770. [Google Scholar] [CrossRef]
  20. Yang, L. Study the Drop of Temperature during Construction by Cooling Pipes Built-in Concrete Dams and Optimize of Temperature Control Measures. Ph.D. Thesis, Wuhan University, Wuhan, China, 2005. [Google Scholar]
  21. Finnemore, E.J.; Franzini, J.B. Fluid Mechanics with Engineering Applications; McGraw-Hill Science/Engineering/Math: New York, NY, USA, 2001; ISBN 9780072432022. [Google Scholar]
  22. Kheradmand, M.; Azenha, M.; Vicente, R.; de Aguiar, J.L.B. An innovative approach for temperature control of massive concrete structures at early ages based on post-cooling: Proof of concept. J. Build. Eng. 2020, 32, 101832. [Google Scholar] [CrossRef]
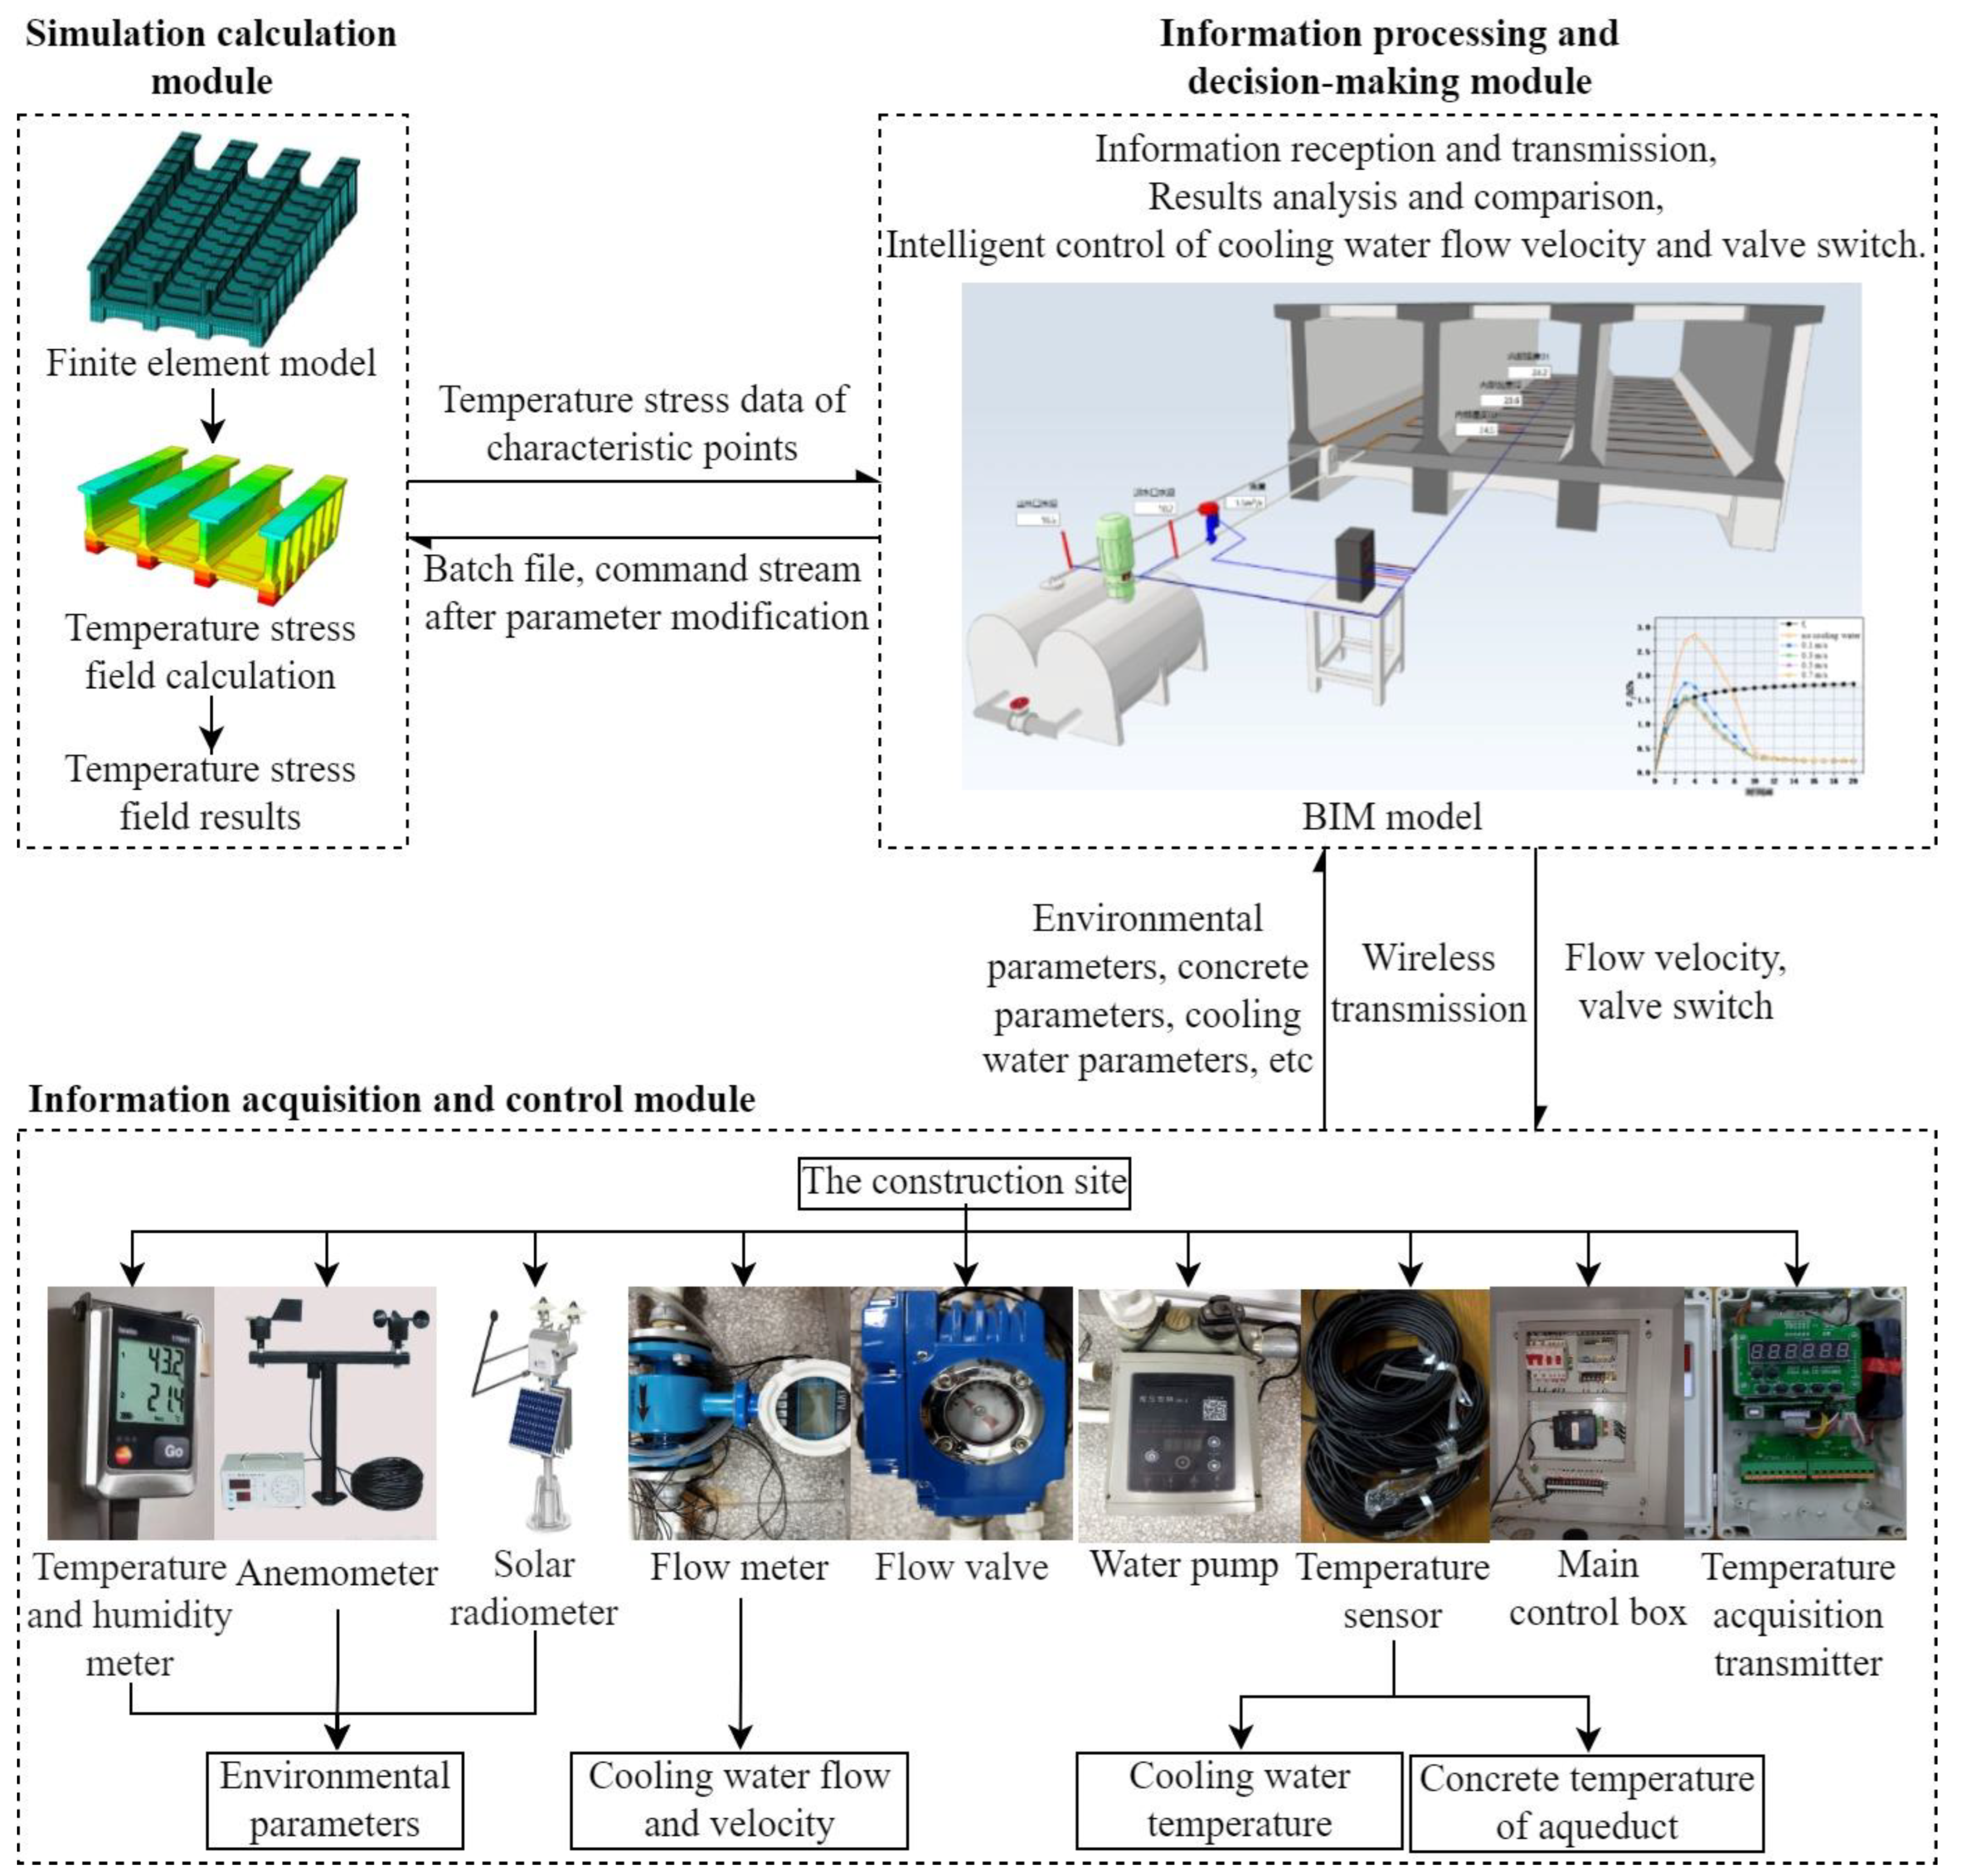
Figure 1. Sketch of intelligent temperature control system for a large aqueduct.
Applsci 12 12138 g001
Figure 2. Closed-loop control block diagram.
Applsci 12 12138 g002
Figure 3. Layout simulation diagram of cooling water pipes poured by stages in an aqueduct. (a) Overall model of aqueduct (b) The first stage of concrete pouring water pipe arrangement (c) The second stage of concrete pouring water pipe arrangement (d) water pipe simulation element.
Applsci 12 12138 g003
Figure 4. Tensile strength of C50 concrete.
Applsci 12 12138 g004
Figure 5. Locations of the characteristic points.
Applsci 12 12138 g005
Figure 6. Stress duration curve of characteristic point d under different working conditions.
Applsci 12 12138 g006
Figure 7. Stress duration curves of characteristic points a, b and c.
Applsci 12 12138 g007
Figure 8. Stress duration curves of characteristic points d, e, f and g.
Applsci 12 12138 g008
Figure 9. Initial temperature variation control curve.
Applsci 12 12138 g009
Figure 10. Sketch of the information interaction.
Applsci 12 12138 g010
Figure 11. Stress duration curves of characteristic points c and d.
Applsci 12 12138 g011
Figure 12. Temperature variation control curve.
Applsci 12 12138 g012
Figure 13. Structure diagram of the experimental system.
Applsci 12 12138 g013
Figure 14. Experimental aqueduct model.
Applsci 12 12138 g014
Figure 15. BIM model in the temperature control platform.
Applsci 12 12138 g015
Table 1. System development and operation environment.
Development Environment Runtime Environment
Database Server Deployment NodeApplication Server Deployment Node
Operating systemWindow10Microsoft windows server 2016
PlatformEclipse development platformMicrosoft SQL server database platformJava platform
Web ServerApache 2.0 + Tomcat 7.0
Table 2. The average monthly temperature of the project area for many years.
MonthJanuaryFebruaryMarchAprilMayJune
Average temperature/°C9.512.015.217.420.021.8
MonthJulyAugustSeptemberOctoberNovemberDecember
Average temperature/°C20.120.019.516.613.410.0
Table 3. Material parameters.
MaterialDensitySpecific Heat CapacityThermal Conductivity
(kg/m3)(kJ/kg °C)(kJ/mh °C)
Concrete24620.9589.32
Cooling water pipe13501.41.66
Water
Plastic foam
1000
4.2
2.12
0.1256
Publisher’s Note: MDPI stays neutral with regard to jurisdictional claims in published maps and institutional affiliations.