Article

Influence of the Metal Surface Texture on the Possibility of Controlling the Phase Transition of Water Droplets in the Single-Phase Regime

1
Heat and Mass Transfer Laboratory, National Research Tomsk Polytechnic University, 30 Lenin Ave., 634050 Tomsk, Russia
2
School of Energy & Power Engineering, National Research Tomsk Polytechnic University, 30 Lenin Ave., 634050 Tomsk, Russia
3
Institute of Thermal Nuclear and Power Engineering, National Research University “Moscow Power Engineering Institute”, 17 Krasnokazarmennaya Str., 111250 Moscow, Russia
*
Author to whom correspondence should be addressed.
Appl. Sci. 2022, 12(23), 12155; https://doi.org/10.3390/app122312155
Submission received: 25 October 2022 / Revised: 14 November 2022 / Accepted: 23 November 2022 / Published: 28 November 2022
(This article belongs to the Section Energy Science and Technology)

Abstract

:
We experimentally studied the influence of the texture of copper and steel surfaces on the possibility of controlling the phase transition of water droplets in the single-phase regime. The texture of metals was formed by polishing and grinding, which corresponded to the finishing treatment of heat transfer surfaces in cooling systems for energy-saturated equipment. The samples were studied by microscopy and profilometry. The texture was estimated by three-dimensional roughness parameters. It was found that, with a 2–2.5-fold increase in roughness, the wetting of copper deteriorates (the contact angle increases from 66° to 93°), whereas the wetting of steel improves (the contact angle decreases from 89° to 71°). It was experimentally proven that, among the two main factors that affect the spreading diameter (wetting and roughness), wetting is the most significant. A hypothesis was formulated regarding the reason for the increase in the contact angle of 7–10° and the drop in the decrease rate of the contact diameter during the transition from the pinning to the mixed stage of droplet evaporation. It was found that an increase in the surface area of 0.1% leads to an increase in the total droplet evaporation rate of 4–6.5%.

1. Introduction

Cooling systems of heat-stressed surfaces up to 100 W/cm2 are used in many engineering applications and industrial fields, such as, in particular, light–water reactors [1], the cooling of diode laser arrays [2], X-ray medical devices [3], and the cryogenic cooling of human tissues [4]. The rapidly growing demand of the world community for high-power microelectronic devices such as computer microchips [5], high-clock-speed processors [6], artificial intelligence technologies [3], and hybrid vehicle power electronics [3] has created the need to develop efficient cooling systems capable of removing heat fluxes of more than 100 W/cm2. Cooling systems for microelectronic devices used in ground and space units are subject to high reliability and service life requirements. Space and energy constraints under these conditions predetermine the use of equipment with a minimum area of condensation surfaces and a minimum weight.
Cooling systems are based on different cooling technologies; for instance, technologies using one phase of a cooling agent or two phases among them [3]. Cooling with air or water flows under free or forced convection is one example of the single-phase technology. Two-phase cooling technologies include thermosyphons [7], mini- and micro-channels [8], jet-impingement [9], and spray cooling [10]. The selection of cooling technology depends on both the value of the heat flux to be removed and on the features of technology itself. Air-free or forced convection is ineffective; the removed heat fluxes, as a rule, do not exceed 15–35 W/cm2 [11], and, in some cases, 150 W/cm2 [12]. Cooling with a water flow under forced convection makes it possible to remove up to 100 W/cm2 [11]. Meanwhile, such technologies require large volumes of coolants, which is inappropriate in terms of resource efficiency. Two-phase cooling technologies have a high heat flux removal capacity of more than 100 W/cm2. Spray (droplet) cooling is known to be the most efficient system based on two-phase cooling technologies. It provides a uniform cooling of a heat-loaded surface [11]. In [13], it was found that droplet-based cooling technologies are capable of removing heat flux from a heat-loaded surface from up to 150 to 200 W/cm2 when using the dielectric coolant HFE-7100 as a coolant. When water is used as a heat carrier, such cooling systems can remove up to 500 W/cm2 [14], 638 W/cm2 [15], and 945.7 W/cm2 [16].
When heat is supplied from a heat-loaded surface to a liquid droplet located on it, one of four phase transition regimes is implemented depending on the surface temperature [17,18]: a single-phase regime, nucleate boiling, transition boiling, and film boiling. The nucleate boiling regime is one of the most efficient in droplet-based cooling technologies. The film boiling regime is dangerous due to the formation of a vapor cushion between the coolant and the heat-loaded heating surface. This vapor cushion has a high thermal resistance, and its formation leads to overheating and further destruction of the heat-loaded surface. This is the cause of technological equipment failure, such as the accident at Fukushima [19]. Single-phase and transition boiling regimes are inefficient, but are often implemented during the operation of cooling systems. When a cooling system operates in these regimes, in practice, the thermal operational mode of heat-loaded equipment often disturbs, which leads to a decrease in its service life and a decrease in reliability. The solution to this problem is to intensify the processes in the single-phase regime, the shift in the onset of the transition boiling regime, and the Leidenfrost point to a higher temperature region. In order to achieve this, the heating surfaces were modified in various ways [20,21,22,23,24,25]. For example, in [20], the effect of copper surface roughness, after polishing with diamond pastes with an abrasives of 0.3–22 μm, on the efficiency of spray cooling was established. Smoother surfaces with a roughness of less than 1 μm provided a superior cooling performance [20]. This is due to the fact that the heat transfer is dominated by film conduction/evaporation. However, in [21,22,23], where copper was used as the heat transfer surface, the opposite result was obtained: the roughness led to more intense cooling in spray cooling systems. The formation of diamond nanotubes (50 μm) on copper allowed the copper to reach heat fluxes of 610 W/cm2 [24]. In [25], a copper surface with a coarse roughness contributed to the earlier onset of the nucleate boiling regime, whereas smoother ones, on the contrary, delayed its onset.
Spray cooling is a very complex technology; therefore, when studying the mechanisms of spray cooling, two main approaches can be conventionally distinguished: (a) the study of the evaporation (with or without boiling) of a single liquid droplet on a solid surface and (b) the study of the interaction of a group of droplets with a heated surface. In both cases, the characteristics of the phase transition regimes are influenced by many factors; for example, the thermophysical properties of the coolant and heat-loaded surface, and the chemical composition and surface texture, as well as the wetting properties and surface energy that depend on them [26]. At present, the fundamental problems lie in the fact that the known models [27,28,29] do not allow for predicting the characteristics of the phase transition of coolant droplets in the single-phase regime on metal surfaces with a given texture and roughness. Most studies [30,31,32] only showed the possibility of intensifying evaporation due to the formation of a certain configuration of texture on the surface.
With regard to studying the effect of the state of a cooled surface on the heat removal intensity, the most works are devoted to surface modification by various methods; for example, the formation of micro/nanopillars by deep reactive ion etching on silicon surfaces [33], the meshes on stainless steel surfaces [34], a nano-porous structure by nanoparticle deposition on silicon wafers [35], and a micro-structure with a pin-fin array by lithography [36]. It is noteworthy that methods used for the modification of surface topography can also lead to changing the wetting properties characterized by the contact angle formed between the liquid droplet and the surface. Numerous modern physical and chemical modification methods have been applied to control wetting properties and the relief of solid surfaces: among them, plasma treatment [37], photolithography [38], electron beam lithography [39], electrochemical deposition [40], laser interferometry [41], etc. In [37], a completely hydrophilic surface of polystyrene was obtained using plasma surface treatment. A wettability gradient range of over 150° from superhydrophobic to hydrophilic was achieved by etching silicon nanopillars and photolithography silicon dioxide stripes [38]. Superhydrophobic properties were achieved for obtaining waterproof semiconductor surfaces using a fast electron beam lithography technique [39] and copper-based surfaces using electrodeposition [40]. Laser-based interferometric methods used for creating textures imitating natural designs with different wetting properties are reviewed in [41].
Nevertheless, some of the known methods used for modifying metal surfaces are difficult to implement on an industrial scale due to their technical complexity and high capital and operating costs. Most often, the heating surfaces of real cooling systems for heat-loaded equipment are made of steel and copper and modified with abrasive materials by grinding or polishing procedures. For the reasons listed above, the purpose of this study is very relevant: to experimentally determine the influence of the roughness characteristics of metal surfaces on the possibilities of controlling the phase transition of water droplets in the single-phase regime at a temperature of 80 °C. The surface heating temperature was chosen due to it being the maximum allowable temperature of the external surfaces of production and technological equipment that excludes thermal injuries. In addition, it is the maximum allowable surface temperature of modern microelectronic devices, excluding their emergency operation associated with overheating [42].

2. Materials and Methods

2.1. Materials and Processing

DIN EN 1.4541 chromium–nickel–titanium austenitic steel and Cu-ETP copper were used as the materials. Chromium–nickel–titanium austenitic steel demonstrates high corrosion resistance in liquid media, good resistance to intergranular corrosion after welding heating, and is slightly brittle as a result of prolonged exposure to high temperatures. It is widely used as a heat-resistant material for various industrial products, including heating surfaces of power-generating equipment and heat transfer surfaces of heat exchange equipment. Cu-ETP copper has high electrical conductivity, low electrical resistivity, and high thermal conductivity. In practice, it is widely used for the manufacture of parts and technological units of equipment for various purposes; for example, in cryogenic technology and heat exchange equipment.
Grinding and polishing is the final technological operation for the manufacture of parts and technological units for various purposes. It is used to achieve the specified dimensions and geometry, as well as to create the necessary texture with the required roughness. During grinding and polishing, the surface layer of metal products is modified or removed. In practice, pastes and/or sandpaper containing abrasive material are used for grinding and polishing. As a rule, surface processing is conducted using a grinding and polishing machine in order to decrease the average grain size of the abrasive material used (η) from 1815 to 1 μm. The final stage of processing of finished products requires using abrasive materials with an average grain size of 50 μm. For these reasons, for experimental studies conducted on the surfaces of 1.4541 steel and Cu-ETP copper samples, nine series of samples were made, each with a texture modified by abrasive materials, with an average grain size of 1.0; 12.6; 15.3; 21.8; 25.8, and 46.2 µm. The polishing and grinding procedures were carried out using a FORCIPOL 1V machine and were accompanied by coolant dosing (distilled water) on the sample. The load acting on the sample was 15 N. The machine head with fixed sandpaper, as well as the samples, was rotated at 100 rpm in one direction. Samples used in this experiment were rectangular parallelepipeds that were 28 mm high, 28 mm wide, and 3 mm thick. The initial surface texture of these samples was formed by electrochemical polishing at the plant for the production of rolled sheets of 1.4541 steel and Cu-ETP copper and was characterized by an Sa parameter of no more than 0.5 μm and a metallic specular luster. The use of samples with a texture formed by electrochemical polishing ensured the identity of the characteristics of the surfaces before the modification procedure with abrasive materials.
After processing with abrasive materials, the surfaces of samples were cleaned from the remains of abrasive materials in an ultrasonic bath for 10 min successively in isopropyl alcohol and Milli-Q ultrapure water. After cleaning, the samples were dried in laboratory conditions for 48 h before the experiments. It should be noted that experimental studies using samples were conducted immediately after surface modification by abrasive materials, cleaning from contamination, and drying.

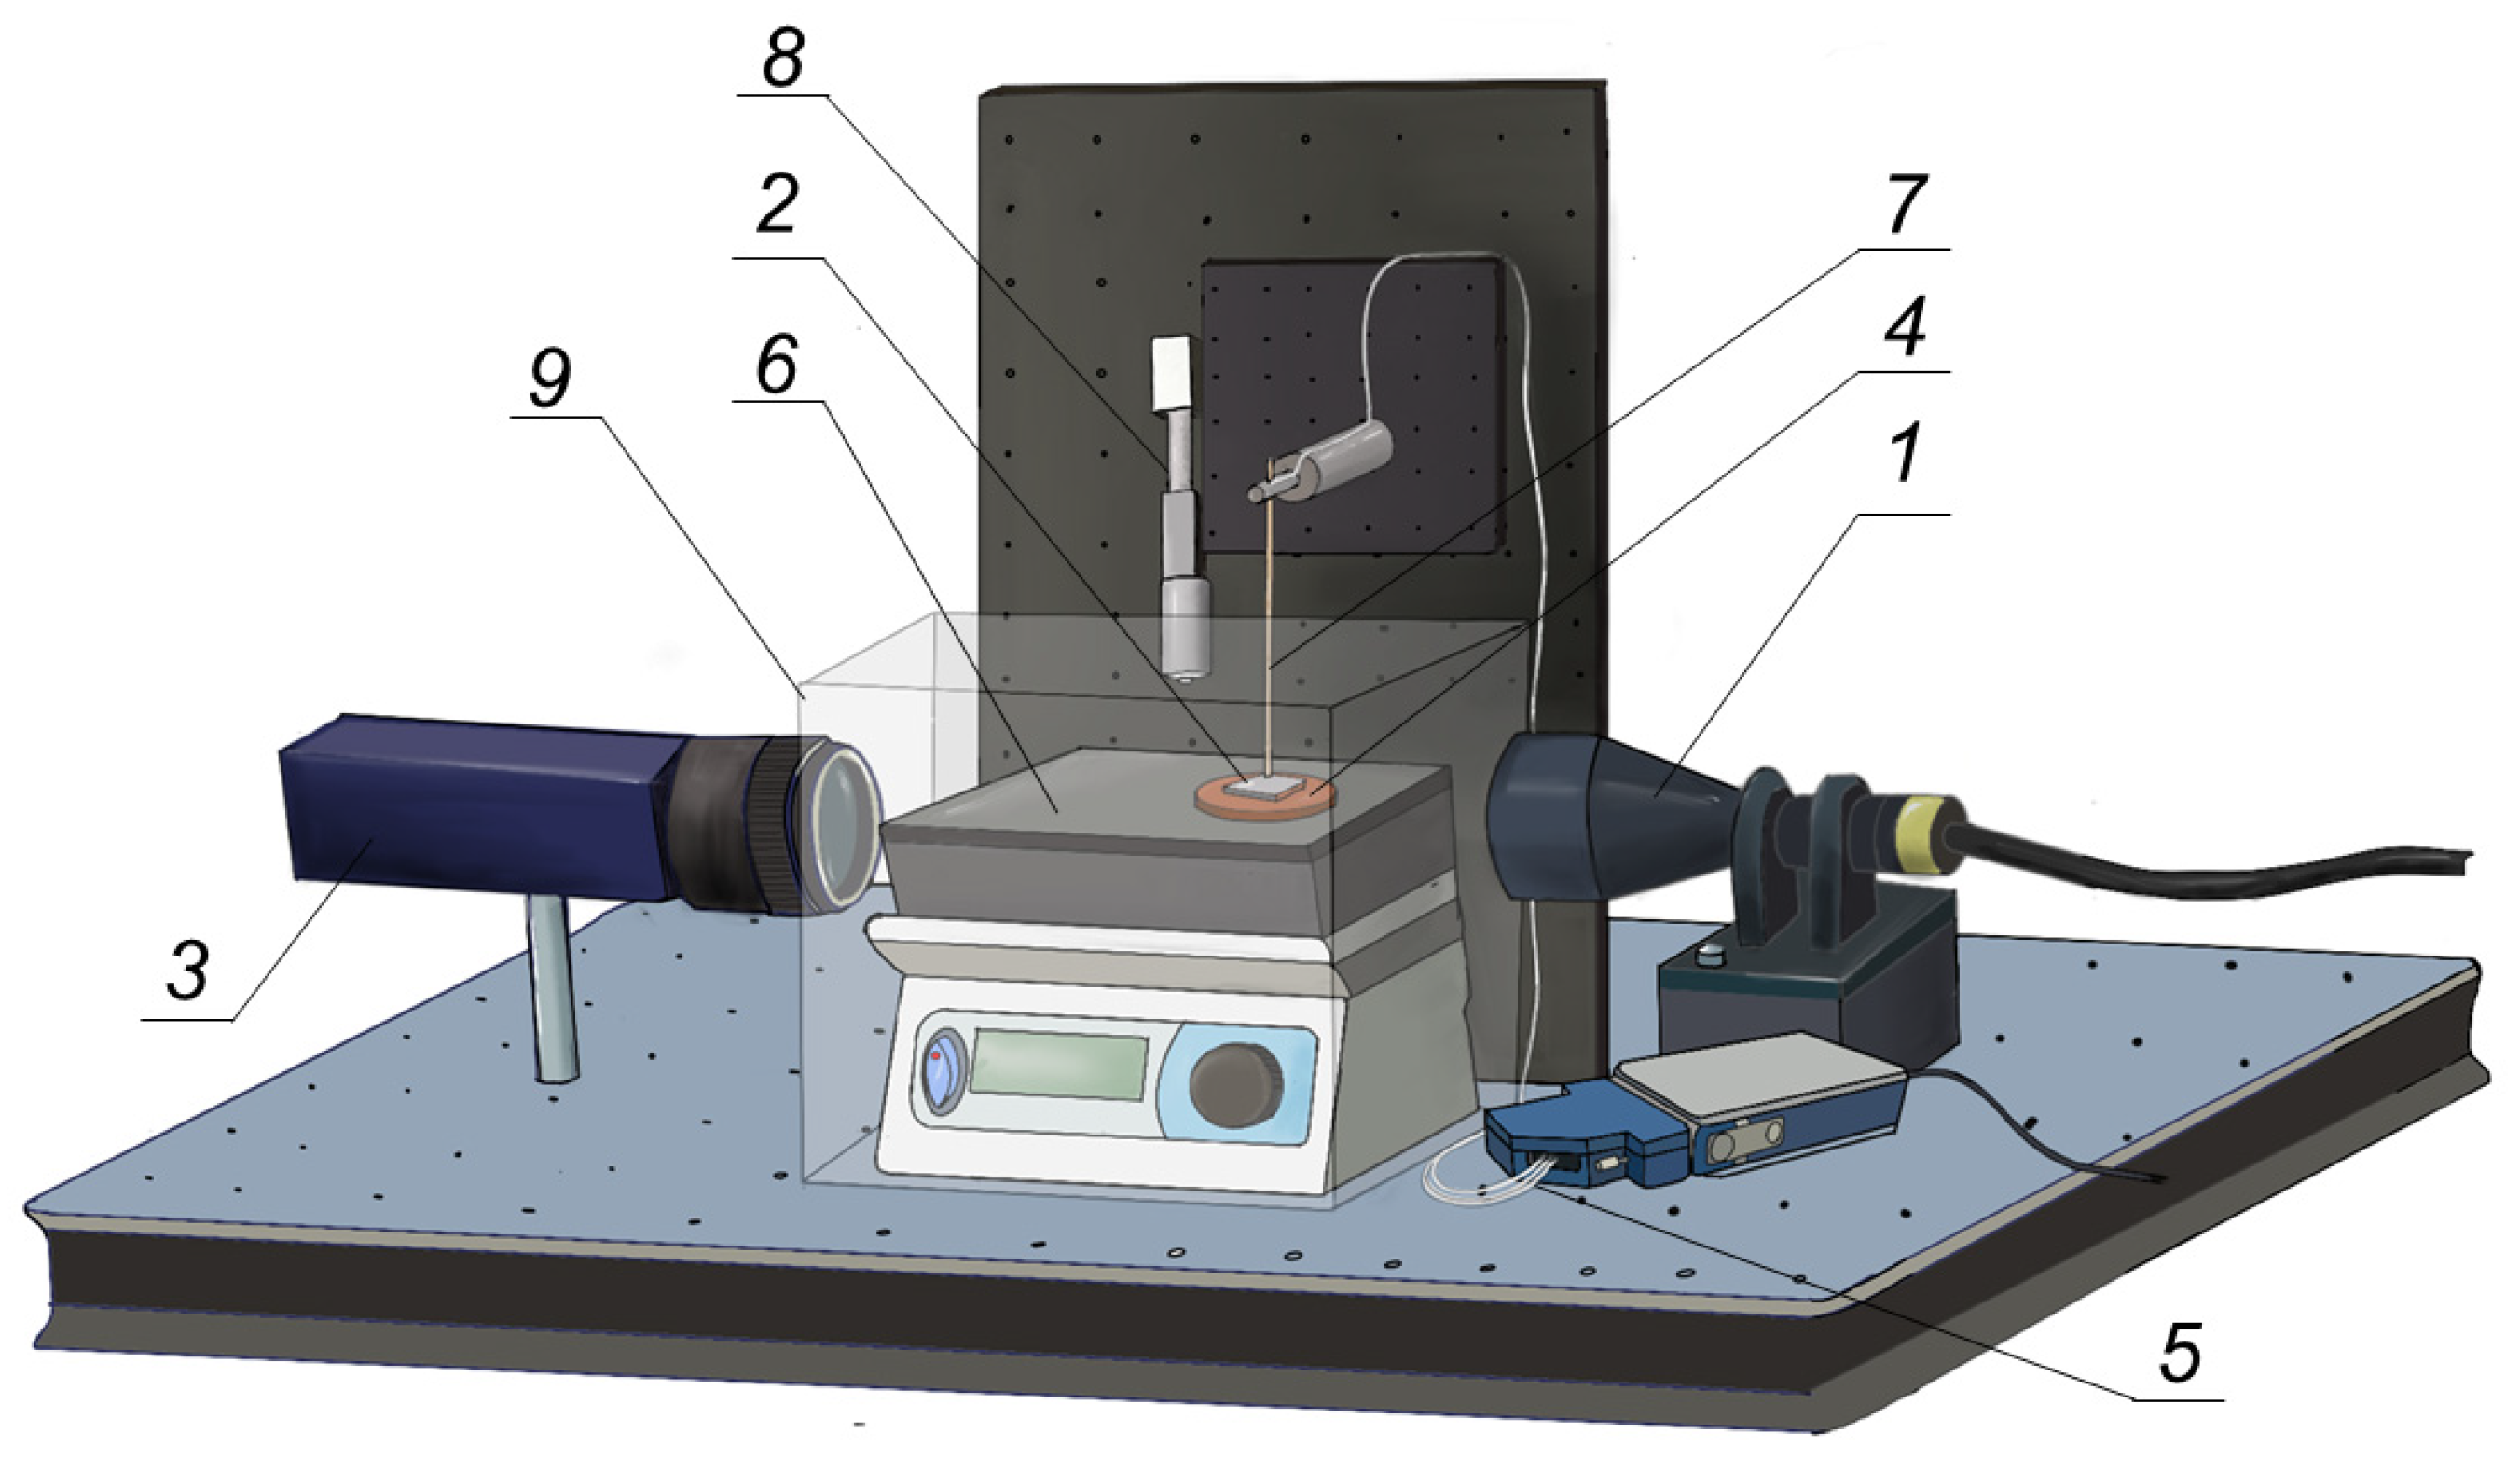
2.2. Equipment and Methods Used for Studying Droplet Evaporation on Metal Surfaces

An experimental setup (Figure 1) based on a shadow optical system was used to study the phase transition regimes of water droplets on studied samples. A detailed description and characteristics of the shadow optical system equipment are given in [10,43].
Before conducting the evaporation experiments, wetting properties of surfaces were analyzed. In order to carry this out, static contact angles and contact angle hysteresis were determined using a shadow optical system in laboratory conditions (temperature of air and metal surfaces of 22–23 °C, relative humidity of 55%) by dispensing a 10 µL droplet of Milli-Q ultrapure water.
In the shadow optical system, plane-parallel light generated by an Edmunds Optics Mi-150 source 1 (lamp characteristics: 150 W Quartz halogen, 21 V; 3100–3400 degrees Kelvin; Edmunds Optics, Barrington, IL, USA) illuminated a water droplet located on the surface of metal sample 2. The shadow image of the droplet was obtained using a Fastvideo-500M high-speed camera 3 (1280 × 1024, 8 bit, 500 fps, Full Camera Link; Fastvideo, Moscow, Russia). Metal sample 2 was fastened to copper disk 4 using a bolt clamp. The use of copper disk 4 with a diameter of 50 mm and a thickness of 10 mm excluded uneven heating of the metal sample 2, and also provided constant heat flow [42]. The temperature under the sample 2 was controlled using two K-type Chromel–Alumel thermocouples (diameter 0.08 mm, insulation PFA, tolerance value 0.4%; Omega, Norwalk, CT, USA) 5. They were located between sample 2 and disk 4 in grooves filled with high-temperature thermal paste (thermal conductivity 11.8 W/(m K), maximum operating temperature +800 °C, Coollaboratory, Magdeburg, Germany). Thermal paste was used to eliminate air pockets with high thermal resistance. Thermocouples were connected to C-series temperature input module 6 (National Instruments, Austin, TX, USA). Sample 2 and disk 4 were placed on glass–ceramic heater 7 (range of operating temperatures of the heating surface 40–500 °C, temperature setting accuracy ±1 °C, temperature unevenness over the surface 2 °C, Tom Analyt, Tomsk, Russia). The temperature of sample 2 was controlled using one K-type Chromel–Alumel thermocouple 5 with the same characteristics. Its junction was installed using high-precision positioning system 8 (accuracy 0.005 mm; Jiangxi Liansheng Technology Co., Ltd., Nanchang City, China) in a special channel filled with high-temperature thermal paste. When a given temperature on the metal surface was reached, a 10 μL droplet of water purified by the Milli-Q system was dosed onto the surface from a height not exceeding 10 mm using a Lenpipet Stepper single-channel electronic dispenser (accuracy ±1 μL, ThermoScientific, Moscow, Russia). Experimental studies were conducted with the temperature of metal surfaces at 80 °C (corresponding to 20 °C subcooling of water to nucleate boiling).
The working area in the experimental setup was isolated from the possible influence of external uncontrolled factors (fluctuations in temperature and air velocity in the laboratory room) with transparent box 9 made of polymer glass that was 3 mm thick. This ensured the consistency of the heat exchange with the external environment.
In experimental studies, the contact angle (θ), contact diameter (d), contact angle hysteresis (Δθ), droplet volume (V), and droplet surface area (S) were determined from the shadow images processed by the Young–Laplace and tangential 1 methods. The relative error in determining θ, d, and Δθ did not exceed 5%.
The duration of the phase transition regimes (τ) of water droplet on the surfaces of samples was recorded using high-speed video camera 3 from the moment when the droplet touched the surface. The systematic error in determining τ did not exceed 0.5%.
The specific evaporation rate of a droplet per unit surface area was determined by the formula [44]:
W specific = ρ ( V i V i + 1 ) Δ τ ( S i + S i + 1 ) / 2 , kg / ( m 2 s )
where ρ is liquid density, and Vi, Vi+1, Si, Si+1 are volume (m3) and surface area (m2) of a droplet at the time τi and τi+1, respectively. The error in determining the specific evaporation rate was calculated as indirect measurement error [45] and did not exceed 7%.

2.3. Equipment and Methods for Studying the Surfaces of Samples

Microtexture of samples was analyzed using a Hitachi S-3400N scanning electron microscope.
Surface topography of samples was analyzed using the Micro Measure 3D station profilometric complex (STIL, Aix-en-Provence, France). Three-dimensional roughness parameters were determined according to the recommendations developed in [26,46]. The surface roughness of samples was estimated based on the height parameters Sa and Sz and the hybrid parameter Sdr. The Sa parameter makes it possible to estimate the average surface roughness. The height of the asperities and the depth of the cavities are estimated by Sz. The increase in surface area due to increased roughness as a percentage is estimated by Sdr. The roughness parameters are determined for each surface of steel and copper as the average of the scanning results of three different areas of 800 × 800 µm in size with a step of 100 nm. The confidence interval of Sa, Sz, Sdr did not exceed 10%. The instrumental error of the profilometer did not exceed 1%. The scanning resolution along the horizontal and vertical directions was 0.1 µm.

3. Results and Discussion

3.1. Analysis of the Surfaces of Samples under Study

Table 1 and Table 2 show SEM images of the microtexture of Cu-ETP copper and 1.4541 steel surfaces modified by abrasive materials, as well as the values of three-dimensional roughness parameters (Sa, Sz, Sdr), static contact angles (θ), and contact angle hysteresis (Δθ). The surfaces of Cu-ETP copper are labeled as Cu1.0 … Cu46.2 (Table 1), and the 1.4541 steel surfaces are labeled as St1.0 … St46.2 (Table 2). The subscript indicates the size of the abrasive material used for surface processing.
According to the analysis of SEM images and roughness parameters (Table 1 and Table 2), it was found that abrasive processing forms an asymmetric texture on the surfaces of metals (copper and steel) consisting mainly of grooves, which are formed on the surface due to the plastic deformation of the material under the abrasive grain action. It can be seen from Table 1 and Table 2 that the values of the height roughness parameters (Sa, Sz) increase when an abrasive material with a coarser average grain value is used for grinding. For copper grinding, the increase in the Sa parameter was 0.29 µm (ΔSa = Sa(Cu46.2) − Sa(Cu1.0) = 0.35 − 0.06 = 0.29 µm), and the increase in the Sz parameter was 6.2 µm (ΔSz = Sz(Cu46.2) − Sz(Cu1.0) = 7.3 − 1.1 = 6.2 µm) (Table 1). Steel after grinding demonstrates an increase in Sa of 0.11 µm and an increase in Sz of 1.0 µm (Table 2). In addition, the values of the Sa and Sz of copper surfaces (for example, Cu1.0 and Cu46.2) are more than 2–2.5 times higher than that of steel surfaces (St1.0 and St46.2) under similar grinding conditions. The greater roughness of copper surfaces after grinding is connected with a lower hardness (more than 1.7 times) of this material relative to the hardness of steel. According to SEM images (Table 1 and Table 2), it was found that the number of grooves decreases when grinding metal surfaces using abrasive materials with a large average grain size. It is known that the heat transfer intensity from a heated surface to a liquid droplet lying on it depends on the heating surface/liquid droplet interfacial area contact. Therefore, the phase transition intensity of a droplet also significantly depends on the heating surface/liquid droplet interfacial area contact as noted in [47]. In turn, the heating surface/liquid droplet interfacial area contact depends on the spreading diameter (contact droplet diameter under single-phase regime) and texture (i.e., on the increase in surface area due to increased roughness evaluated by the Sdr parameter). The droplet diameter spreading over the surface depends on its wetting properties [48,49]. An increase in surface area due to increased roughness (Sdr) is directly dependent on the average roughness (Sa) and the size of asperities and cavities (Sz). Table 1 and Table 2 show that the use of an abrasive material with a large η leads to the formation of a texture with large Sdr values, i.e., it leads to an increase in the surface area due to an increased roughness. The surface area of copper after grinding by the coarsest average grain size used in the experiments increased by 4.6% (Cu46.2 in Table 1) and the surface area of steel increased by 0.8% (St46.2 in Table 2) compared to Cu1.0 and St1.0. It can be concluded that, when grinding copper and steel surfaces using abrasive materials with a large η, the synergistic effect of the texture characteristics estimated by Sa and Sz leads to an increase in the surface area (Sdr) due to an increased roughness.
It is known that wetting properties depend on the roughness and elemental composition of the surface layer of metals [50,51]. However, the elemental composition remains the same on surfaces treated with different abrasive materials. Therefore, in the conducted experimental studies, the elemental composition is not a significant factor affecting the difference in the wetting properties of copper (Table 1) and steel surfaces (Table 2). Based on the analysis of the measured contact angles (Table 1 and Table 2), it was found that, when increasing the roughness, the wetting properties of copper surfaces deteriorate and the contact angle increases from 66 ± 5° (Cu1.0) to 93 ± 4° (Cu46.2) (Table 1). In contrast, the wetting properties of the steel surface are enhanced and the contact angle decreases from 89 ± 4° (St1.0) to 71 ± 5° (St46.2) (Table 2). The texture (roughness) and wetting properties determine the phase transition characteristics of a droplet located on a heated metal surface in single-phase regime.
In the conducted studies, copper and steel surfaces were processed by abrasive materials under identical conditions. However, as noted earlier, when using the same abrasive materials, with other conditions being equal, a different texture was formed on copper and steel surfaces, characterized by different values of the roughness parameters. For example, the maximum height of irregularities for copper is in the range of Sz(Cu1.0 ÷ Cu46.2) = 1.1 ÷ 7.3 µm and, for steel, it is in the range of Sz(St1.0 ÷ St46.2) = 0.7 ÷ 1.7 µm. Moreover, these metals demonstrate the opposite change in the wetting properties with an increase in roughness. As the roughness increases, the wetting properties deteriorate (the contact angle increases) on copper surfaces, whereas, on steel surfaces, the wetting properties improve (the contact angle decreases). This is explained by the hypothesis formulated in [26] regarding the effect of the distance between adjacent irregularities that form a texture of metals treated by grinding or polishing on the wetting properties. In [26], there were two typical intervals of change in the contact angle depending on the roughness parameters of copper and steel. In the first interval, the wetting properties improve with an increase in roughness. Among the studied textures in this work, all steel surfaces (St1.0 ÷ St46.2) belong to this interval. A wetting improvement is associated with a sufficiently high density of peaks on the surface, and, consequently, with a small width of the cavities formed by them. Owing to such capillaries, which have an insignificant width compared to their depth (Sz no less than 1.7 μm), the liquid wets the surface more effectively due to capillary forces. In the second conventionally selected interval, the angle increases, and wetting worsens with an increase in roughness. Among the studied textures, Cu12.6 ÷ Cu46.2 belongs to this interval. The height of irregularities in the second interval increases, as does the distance between neighboring peaks, and the energy barrier grows, which must be overcome by the droplet contact line during the time from the moment the droplet is placed on the surface until the equilibrium state is reached.

3.2. Influence of the Metal Surface Texture on the Possibility of Controlling the Phase Transition of water Droplets in the Single-Phase Regime

Figure 2 and Figure 3 present the experimental dependencies of the contact angle and diameter on the evaporation time obtained for distilled water droplets evaporating in the single-phase regime from copper and steel surfaces heated to 80 °C.
Based on the analysis of Figure 2 and Figure 3, it was found that heating the copper and steel surfaces to 80 °C does not affect the initial geometric parameters (contact angle, contact diameter) of water droplets. The initial values of the contact angle and diameter at 80 °C are close to the values recorded without heating at a temperature of 22–24 °C (Table 1 and Table 2). This is due to the fact that, in the experiments with heating, water dosed on the surfaces had a temperature of 22–24 °C. When dosing a distilled water droplet on the heated copper and steel surfaces processed by grinding, the droplet had a spherical-segment shape immediately after spreading. The values of the contact diameter measured after rotating the surface with the droplet lying on it by 90° relative to the axis of the high-speed camera did not differ by more than 4% (i.e., in the initial position of the surface with the droplet relative to the high-speed camera and when the surface with the droplet was rotated 90°). After the droplet formation on the surface, the contact angle decreases, and the contact diameter is pinned (stays constant) after slight spreading during the first seconds. It is known that a droplet evaporating on heated metal surfaces is pinned due to balancing the forces acting on it (friction, gravity, and surface tension). It can be seen from Figure 2 and Figure 3 that the balance of forces acting on the evaporating droplet on Cu1.0, St1.0, St12.6, St15.3, St21.8, and St25.8 surfaces is disturbed upon the evaporation of 60–90% of the initial droplet volume. There is a transition from the constant contact diameter (CCD) stage to the mixed evaporation stage. The mixed stage is followed by a decrease in the contact diameter and contact angle. The contact angle decreases more quickly during the mixed stage than at the CCD stage (Figure 2 and Figure 3). A similar transition of the evaporation stages is well-studied and registered on relatively smooth metal surfaces [10]. However, in [52], three stages of droplet evaporation on polished steel surfaces were detected: CCD, constant contact angle, and mixed stages following one after another.
For the case of rougher surfaces of copper (Cu12.6, Cu15.3, Cu21.8, Cu25.8, Cu46.2) and steel (St46.2), the transition from the CCD to the mixed stage is accompanied by an increase in the contact angle (by 7–10°) and a significant decrease in the contact diameter in contrast to the case of copper (Cu1.0) and steel (St1.0, St12.6, St15.3, St21.8, St25.8), where a monotonous decrease in the contact angle and contact diameter was recorded. However, after such an abrupt increase in the angle on Cu12.6, Cu15.3, Cu21.8, Cu25.8, Cu46.2, and St46.2 presented in the insets of Figure 2a and Figure 3a, they decrease monotonically. This is confirmed by the analysis of the fitted curve θ = + b in Figure 2a and Figure 3a. As an example, Figure 2a and Figure 3a show fitted curves obtained for the sections of θ = f(τ) corresponding to the CCD and mixed stages of droplet evaporation on Cu46.2 and St46.2 surfaces. The k coefficient, which characterizes the slope of the dependencies θ = f(τ) in the mixed stage, is smaller in its absolute value (for Cu46.2, k = |0.25| as shown in Figure 2a; for St46.2, k = |0.61| as shown in Figure 3a) than in the CCD stage (for Cu46.2, k = |0.54| as shown in Figure 2a; for St46.2, k = |0.67| as shown in Figure 3a).
Figure 2b shows the fitted curves d = kdx + bd presented for the sections of d = f(τ) in the CCD and mixed stages of droplet evaporation on Cu1.0 and Cu46.2. It was found that the kd coefficient in the mixed stage on Cu46.2 is smaller in its absolute value (kd = |4.7·10−2|; Figure 2b) than that for Cu1.0 (kd = |5.6·10−2|; Figure 2b). The same result is correct for steel surfaces (St1.0 and St46.2). This indicates that the rate of the decrease in the contact diameter on the Cu46.2 surface is less than on the Cu1.0 surface. An increase in the contact angle by 7–10° and a drop in the decrease rate of the contact diameter during the transition from CCD to the mixed stage on rough Cu12.6, Cu15.3, Cu21.8, Cu25.8, Cu46.2, and St46.2 surfaces is explained by grooves with a depth and width of more than 1.7 μm. This is evaluated by the Sz parameter (Table 1 and Table 2). It is known that asperities and cavities on the surface are energy barriers that prevent three-phase contact line movement during droplet spreading and evaporation [53]. If the size of these texture elements does not exceed 1.7 µm (surface Cu1.0 in Table 1 and surfaces St1.0, St12.6, St15.3, St21.8, St25.8 in Table 2), then the three-phase contact line movement during the transition from the CCD to the mixed stage occurs uniformly from all sides (Figure 4).
If the size of these irregularities on the surface is greater than 1.7 µm (Cu12.6, Cu15.3, Cu21.8, Cu25.8, Cu46.2 surfaces in Table 1 and St46.2 in Table 2), then the three-phase contact line moves unevenly during the transition from the CCD to the mixed stage (Figure 5). The line predominantly moves along the grooves formed by the abrasive material on the surface. At the end of evaporation, there is an abrupt contact line movement, which is accompanied by an abrupt increase in the contact angle.
It can be seen from Figure 2b that the initial contact diameters decrease in the sequence Cu1.0–Cu12.6–Cu15.3–Cu21.8–Cu25.8–Cu46.2. In the same sequence, the roughness on the copper surfaces increases (Table 1) and the wetting properties deteriorate (the contact angle increases) (Figure 2a). In the case of steel surfaces (Figure 3b), the initial contact diameters decrease in the sequence St46.2–St25.8–St21.8–St15.3–St12.6–St1.0, the wetting properties deteriorate (Figure 3a), and the roughness decreases (Table 2). Wetting properties and surface roughness are the most significant factors affecting the diameter of the droplet spreading over metal surfaces. The greater the wetting properties and the lower the surface roughness, the larger the spreading diameter. In the case of copper, both factors (wetting properties and roughness) affect the decrease in the spreading diameter in the sequence mentioned above. On steel surfaces, the wetting properties affect the decrease in the spreading diameter, and the roughness affects its growth in the sequence mentioned above. As noted, the initial contact diameter decreases after balancing the forces acting on the droplet in this sequence. It can be concluded that wetting properties are the most significant factor that affects the contact spreading diameter when a texture on copper and steel surfaces is formed by abrasive materials. For this reason, the spreading diameter of a 10 µL droplet on the St46.2 surface is 0.6 mm larger compared to that on the St1.0 surface (Δd = d(St46.2) − d(St1.0) = 4.0 − 3.4 = 0.6 mm (Figure 3b)). An increase in the spreading diameter by 0.6 mm on the St46.2 surface is due to a decrease in the contact angle of 18° (Δθ = θ(St1.0) − θ(St46.2) = 89 − 71=18°) with an increase in roughness of ΔSz = 1.0 µm (ΔSz = Sz(St46.2) − Sz(St1.0) = 1.7 − 0.7 = 1.0 µm). It can be seen from Table 2 and Figure 3b that the spreading diameters on St12.6 and St15.3 surfaces are equal to each other (3.8 mm), as well as on St25.8 and St46.2 surfaces (4.0 mm). This is due to the fact that, in each pair of the surfaces under consideration, the possible increase in the contact angle due to the deterioration of the wetting properties is reduced by an increase in roughness. It can be concluded that, during finishing metal surfaces with abrasive materials, in order to achieve the largest contact diameter of water droplet spreading over Cu-ETP copper surfaces, it is necessary to use abrasive materials with the smallest average grain size. In the case of steel surfaces, it is necessary to use abrasive materials with the largest average grain size. From a practical point of view, achieving the largest contact diameter is important for intensifying the phase transition of droplets in the single-phase regime in cooling systems of energy-saturated equipment.
Figure 6 presents the dependencies of the specific evaporation rate of water droplets on copper (Figure 6a) and steel (Figure 6b) surfaces at a heating temperature of 80 °C. A similar nature of the specific evaporation rate of a water droplet on a hydrophobic Teflon surface was recorded in [10].
The experimental results (Figure 6) illustrate the significant dominance of the influence of the droplet spreading diameter, which, in turn, depends on the wetting properties and on the evaporation rate. It can be seen from Figure 6a that the specific evaporation rate of the water droplet on copper surfaces decreases in the sequence Cu1.0–Cu12.6–Cu15.3–Cu21.8–Cu25.8–Cu46.2, i.e., in the sequence of decreasing the initial contact diameter (Figure 2b). With an increase in the contact diameter, the heat exchange area between the surface and the droplet lying on it increases; therefore, the heat transferred to the droplet increases, as well as the evaporation rate. In practice, this leads to a more intensive cooling of energy-saturated equipment in cooling systems.
The specific evaporation rate of the droplet on steel surfaces decreases in the sequence St46.2–St25.8–St21.8–St15.3–St12.6–St1.0 (Figure 6b). The heat exchange area between the surface and droplet depends not only on the contact diameter, but also on the roughness. In the case of the same diameters on different surfaces (a pair of surfaces St12.6 and St15.3, as well as St25.8 and St46.2), the specific evaporation rate of the droplet is higher on the surface, which has a greater roughness, i.e., Wspecific (St15.3) > Wspecific (St12.6), and Wspecific (St46.2) > Wspecific (St25.8) (Figure 6b). The greater the roughness, the larger the heat exchange area and, consequently, the higher the evaporation rate. For two pairs of surfaces (St12.6 and St15.3, St25.8 and St46.2), the liquid / ambient interfacial surface area will be almost identical, since the initial spreading diameters and contact angles on them are very close to each other. Consequently, the difference in the evaporation rates of water droplets from St12.6 and St15.3, as well as St25.8 and St46.2 (Figure 6b), can only be due to the influence of an increase in the surface area due to an increased roughness.
According to the analysis of Figure 7, we have evaluated the effect of an increase in the surface area on an increase in the total evaporation rate of a water droplet (Wtotal) on St12.6 and St15.3, as well as St25.8 and St46.2 surfaces. It can be seen from Figure 7 that an increase in the surface area of 0.1% leads to an increase in the total evaporation rate of the droplet of 6.5% on the St15.3 surface, and of 4% on the St46.2 surface. This indicates that an increase in the surface area has a significant effect on the droplet evaporation rate, but this effect decreases with an increasing surface roughness. The results obtained should be used with caution when extrapolating too large surface area increments.
It was found that the specific evaporation rate of a 10 µL water droplet on steel surfaces is higher than that on copper surfaces (Figure 6). The result obtained is explained by the fact that the average mass heat capacity of steel (460 kJ/(kg·°C)) is greater than that of copper (385 kJ/(kg·°C)). The copper and steel surfaces had identical sizes; therefore, the volume of the samples was identical. Despite the fact that the mass of the copper sample was 14% greater than that of the steel sample, under identical conditions, where the surface heated to a temperature of 80 °C, the steel sample accumulated 4% more heat. Consequently, in the experiments performed, the specific heat flow from the steel samples to the droplet was higher than on copper samples. For these reasons, the heating of the droplet on the steel sample to the phase transition temperature was quicker, and the evaporation rate was higher. The effect of the higher thermal conductivity of copper compared to that of steel did not significantly affect the droplet evaporation rate due to the large size of the samples. A 10 µL water droplet with a temperature of 23 °C dosed onto copper and steel samples heated to 80 °C did not significantly affect the cooling of the samples. According to the data recorded by thermocouples, it was established that the temperature on the sample surface and under the sample did not change after dosing the droplet. It should be noted that, with a decrease in the size of the samples, including a significant decrease in thickness, the phase transition of a water droplet placed on copper and steel surfaces can reduce their temperature. Under such conditions, in practice, when the surfaces of heat-loaded equipment sections are cooled with water droplets, due to the constant heat supply from the heating source and the high thermal conductivity of copper, the droplet evaporation rate on copper surfaces will be higher than on steel surfaces. Therefore, in practice, in order to increase the cooling intensity of heat-loaded equipment by spray cooling systems operating in the evaporation (single-phase) regime, it is necessary to use low-mass heat transfer surfaces with a small thickness. However, in practice, the use of heat transfer surfaces with a small thickness causes an increase in the risk of their thermal destruction due to overheating. The search for the optimal thickness of heat transfer structures of cooling systems operating in the evaporation regime of coolant droplets is a further direction in the development of our research.

4. Conclusions

The use of abrasive materials with an average grain size of 1–46.2 µm for the finishing treatment of heat transfer surfaces of cooling systems for power-saturated equipment makes it possible to form a texture with a given roughness and wetting properties on copper and steel surfaces. It was found that, with an increase in roughness (2–2.5-fold increase in roughness parameters Sa, Sz, and Sdr), the wetting properties of copper surfaces deteriorate (the contact angle increases from 66° to 93°), whereas the wetting properties of steel surfaces improve (the contact angle decreases from 89° to 71°). It was also established that. if the size of cavities and asperities of the surfaces does not exceed 1.7 µm, then the three-phase contact line movement during the transition from the pinning stage to the mixed stage occurs without a sharp increase in the contact angle. However, if the size of these texture elements is higher than 1.7 µm, the transition from the constant contact diameter to a mixed stage is accompanied by an increase in the contact angle (by 7–10°) and a significant decrease in the contact diameter compared to the case of relatively smooth surfaces.
It was experimentally proven that, among two main factors that affect the contact spreading diameter (wetting and roughness), wetting is the most significant. In order to achieve the largest contact diameter of a water droplet spreading over Cu-ETP copper surfaces, it is necessary to use abrasive materials with the smallest average grain size for finishing. In the case of 1.4541 steel surfaces, it is necessary to use abrasive materials with the largest average grain size. From a practical point of view, achieving the largest contact diameter is important for intensifying the phase transition of droplets in the single-phase evaporation regime in cooling systems of energy-saturated equipment.
It was also found that an increase in the surface area of 0.1% leads to an increase in the total droplet evaporation rate of 4–6.5%. An increase in the surface area due to roughness has a significant effect on the droplet evaporation rate, but this effect decreases with an increasing surface roughness.

Author Contributions

Conceptualization, D.G.; writing—original draft preparation, E.O.; investigation, A.I.; visualization, D.N.; funding acquisition, investigation Y.L.; writing—review and editing, D.F. All authors have read and agreed to the published version of the manuscript.

Funding

The reported study was funded by RFBR and CNRS according to the research project No. 21-58-15010.

Conflicts of Interest

The authors declare no conflict of interest.

Abbreviations

CCDconstant contact diameter
Nomenclature
dcontact diameter, mm;
Ssurface area of a droplet, mm2;
Saarithmetic mean surface deviation, µm;
Sdrdeveloped interfacial area ratio, %;
Szmaximum height, µm;
Ttemperature, °C;
Vvolume, μL;
Wspecificspecific evaporation rate, kg/(s∙m2);
Wtotaltotal evaporation rate, kg/s
Greek symbols
θcontact angle, °;
Δθcontact angle hysteresis, °;
ρliquid density, kg/m3;
τevaporation droplet time, s;
ηaverage grain size, μm

References

  1. Sawan, M.E.; Carbon, M.W. A Review of Spray-Cooling and Bottom-Flooding Work for Lwr Cores. Nucl. Eng. Des. 1975, 32, 191–207. [Google Scholar] [CrossRef]
  2. Christensen, A.; Graham, S. Thermal Effects in Packaging High Power Light Emitting Diode Arrays. Appl. Therm. Eng. 2009, 29, 364–371. [Google Scholar] [CrossRef]
  3. Liang, G.; Mudawar, I. Review of Spray Cooling—Part 1: Single-Phase and Nucleate Boiling Regimes, and Critical Heat Flux. Int. J. Heat Mass Transf. 2017, 115, 1174–1205. [Google Scholar] [CrossRef]
  4. Datrice, N.; Ramirez-San-Juan, J.; Zhang, R.; Meshkinpour, A.; Aguilar, G.; Nelson, J.S.; Kelly, K.M. Cutaneous Effects of Cryogen Spray Cooling on In Vivo Human Skin. Dermatol. Surg. 2006, 32, 1007–1012. [Google Scholar] [CrossRef]
  5. Smakulski, P.; Pietrowicz, S. A Review of the Capabilities of High Heat Flux Removal by Porous Materials, Microchannels and Spray Cooling Techniques. Appl. Therm. Eng. 2016, 104, 636–646. [Google Scholar] [CrossRef]
  6. Kandlikar, S.G. Review and Projections of Integrated Cooling Systems for Three-Dimensional Integrated Circuits. J. Electron. Packag. 2014, 136, 024001. [Google Scholar] [CrossRef]
  7. He, Z.; Chen, Y.; Yang, J.; Tang, C.; Lv, J.; Liu, Y.; Mei, J.; Lau, W.M.; Hui, D. Fabrication of Polydimethylsiloxane Films with Special Surface Wettability by 3D Printing. Compos. Part B Eng. 2017, 129, 58–65. [Google Scholar] [CrossRef]
  8. Ronshin, F.V.; Chinnov, E.A.; Dementyev, Y.A.; Kabov, O.A. The Bridge Flow Regime in Microchannels. Dokl. Phys. 2021, 66, 229–233. [Google Scholar] [CrossRef]
  9. Eng Ewe, W.; Fudholi, A.; Sopian, K.; Solomin, E.; Hossein Yazdi, M.; Asim, N.; Fatima, N.; Pikra, G.; Sudibyo, H.; Fatriasari, W.; et al. Jet Impingement Cooling Applications in Solar Energy Technologies: Systematic Literature Review. Therm. Sci. Eng. Prog. 2022, 34, 101445. [Google Scholar] [CrossRef]
  10. Kabov, O.A.; Gatapova, E.Y.; Semenov, A.A.; Jutley, M.; Ajaev, V.V.; Kirichenko, E.O.; Feoktistov, D.V.; Kuznetsov, G.V.; Zaitsev, D.V. Experimental and Numerical Studies of Evaporation of a Sessile Water Drop on a Heated Conductive Substrate. Interfacial Phenom. Heat Transf. 2018, 6, 421–435. [Google Scholar] [CrossRef]
  11. Gao, X.; Li, R. Spray Impingement Cooling: The State of the Art. Adv. Cool. Technol. Appl. 2018. [Google Scholar] [CrossRef] [Green Version]
  12. Hamann, H.F.; Weger, A.; Lacey, J.A.; Hu, Z.; Bose, P.; Cohen, E.; Wakil, J. Hotspot-Limited Microprocessors: Direct Temperature and Power Distribution Measurements. IEEE J. Solid-State Circuits 2007, 42, 56–64. [Google Scholar] [CrossRef]
  13. Mudawar, I.; Bharathan, D.; Kelly, K.; Narumanchi, S. Two-Phase Spray Cooling of Hybrid Vehicle Electronics. IEEE Trans. Compon. Packag. Technol. 2009, 32, 501–512. [Google Scholar] [CrossRef]
  14. Lin, L.; Ponnappan, R. Heat Transfer Characteristics of Spray Cooling in a Closed Loop. Int. J. Heat Mass Transf. 2003, 46, 3737–3746. [Google Scholar] [CrossRef]
  15. Mudawar, I.; Valentine, W.S. Determination of the Local Quench Curve for Spray-Cooled Metallic Surfaces. J. Heat Treat. 1989, 7, 107–121. [Google Scholar] [CrossRef]
  16. Chen, R.H.; Chow, L.C.; Navedo, J.E. Effects of Spray Characteristics on Critical Heat Flux in Subcooled Water Spray Cooling. Int. J. Heat Mass Transf. 2002, 45, 4033–4043. [Google Scholar] [CrossRef]
  17. Bernardin, J.D.; Mudawar, I. The Leidenfrost Point: Experimental Study and Assessment of Existing Models. J. Heat Transf. 1999, 121, 894–903. [Google Scholar] [CrossRef]
  18. Auliano, M.; Auliano, D.; Fernandino, M.; Zhang, P.; Dorao, C.A. Water Droplet Dynamics on a Heated Nanowire Surface. Appl. Phys. Lett. 2018, 113, 253703. [Google Scholar] [CrossRef]
  19. Duursma, G.; Kennedy, R.; Sefiane, K.; Yu, Y. Leidenfrost Droplets on Microstructured Surfaces. Heat Transf. Eng. 2016, 37, 1190–1200. [Google Scholar] [CrossRef] [Green Version]
  20. Pais, M.R.; Chow, L.C.; Mahefkey, E.T. Surface Roughness and Its Effects on the Heat Transfer Mechanism in Spray Cooling. J. Heat Transf. 1992, 114, 211–219. [Google Scholar] [CrossRef]
  21. Sehmbey, M.S.; Chow, L.C.; Hahn, O.J.; Pais, M.R. Spray Cooling of Power Electronics at Cryogenic Temperatures. J. Thermophys. Heat Transf. 2012, 9, 123–128. [Google Scholar] [CrossRef]
  22. Lester Ortiz, J.E.G. Experiments on Steady-State High Heat Fluxes Using Spray Cooling. Exp. Heat Transf. 2010, 12, 215–233. [Google Scholar] [CrossRef]
  23. Zhang, Z.; Li, J.; Jiang, P.X. Experimental Investigation of Spray Cooling on Flat and Enhanced Surfaces. Appl. Therm. Eng. 2013, 51, 102–111. [Google Scholar] [CrossRef]
  24. Hsieh, S.S.; Luo, S.Y.; Lee, R.Y.; Liu, H.H. Spray Cooling Heat Transfer on Microstructured Thin Film Enhanced Surfaces. Exp. Therm. Fluid Sci. 2015, 68, 123–134. [Google Scholar] [CrossRef]
  25. Martínez-Galván, E.; Antón, R.; Ramos, J.C.; Khodabandeh, R. Influence of Surface Roughness on a Spray Cooling System with R134a. Part I: Heat Transfer Measurements. Exp. Therm. Fluid Sci. 2013, 46, 183–190. [Google Scholar] [CrossRef]
  26. Kuznetsov, G.V.; Islamova, A.G.; Orlova, E.G.; Ivashutenko, A.S.; Shanenkov, I.I.; Zykov, I.Y.; Feoktistov, D.V. Influence of Roughness on Polar and Dispersed Components of Surface Free Energy and Wettability Properties of Copper and Steel Surfaces. Surf. Coat. Technol. 2021, 422, 127518. [Google Scholar] [CrossRef]
  27. Olek, S.; Zvirin, Y.; Elias, E. The Relation between the Rewetting Temperature and the Liquid-Solid Contact Angle. Int. J. Heat Mass Transf. 1988, 31, 898–902. [Google Scholar] [CrossRef]
  28. Schroeder-Richter, D.; Bartsch, G. The Leidenfrost Phenomenon Caused by a Thermo-Mechanical Effect of Transition Boiling: A Revisited Problem of Non-Equilibrium Thermodynamics; ASME: New York, NY, USA, 1990. [Google Scholar]
  29. Segev, A.; Bankoff, S.G. The Role of Adsorption in Determining the Minimum Film Boiling Temperature. Int. J. Heat Mass Transf. 1980, 23, 637–642. [Google Scholar] [CrossRef]
  30. Ajaev, V.S.; Kabov, O.A. Levitation and Self-Organization of Droplets. Annu. Rev. Fluid Mech. 2021, 53, 203–225. [Google Scholar] [CrossRef]
  31. Kim, J.H.; You, S.M.; Choi, S.U.S. Evaporative Spray Cooling of Plain and Microporous Coated Surfaces. Int. J. Heat Mass Transf. 2004, 47, 3307–3315. [Google Scholar] [CrossRef]
  32. Chien, L.H.; Wu, T.L.; Lee, S.C. A Study of Spray-Impingement Cooling on Smooth and Pin-Finned Surfaces Using FC-72. J. Enhanc. Heat Transf. 2011, 18, 375–387. [Google Scholar] [CrossRef]
  33. Tran, T.; Staat, H.J.J.; Susarrey-Arce, A.; Foertsch, T.C.; Van Houselt, A.; Gardeniers, H.J.G.E.; Prosperetti, A.; Lohse, D.; Sun, C. Droplet Impact on Superheated Micro-Structured Surfaces. Soft Matter 2013, 9, 3272–3282. [Google Scholar] [CrossRef]
  34. Geraldi, N.R.; McHale, G.; Xu, B.B.; Wells, G.G.; Dodd, L.E.; Wood, D.; Newton, M.I. Leidenfrost Transition Temperature for Stainless Steel Meshes. Mater. Lett. 2016, 176, 205–208. [Google Scholar] [CrossRef] [Green Version]
  35. Kim, H.; Truong, B.; Buongiorno, J.; Hu, L.W. On the Effect of Surface Roughness Height, Wettability, and Nanoporosity on Leidenfrost Phenomena. Appl. Phys. Lett. 2011, 98, 083121. [Google Scholar] [CrossRef]
  36. Xu, R.N.; Cao, L.; Wang, G.Y.; Chen, J.N.; Jiang, P.X. Experimental Investigation of Closed Loop Spray Cooling with Micro- and Hybrid Micro-/Nano-Engineered Surfaces. Appl. Therm. Eng. 2020, 180, 115697. [Google Scholar] [CrossRef]
  37. Berczeli, M.; Weltsch, Z. Enhanced Wetting and Adhesive Properties by Atmospheric Pressure Plasma Surface Treatment Methods and Investigation Processes on the Influencing Parameters on HIPS Polymer. Polymers 2021, 13, 901. [Google Scholar] [CrossRef] [PubMed]
  38. Liu, C.; Sun, J.; Li, J.; Xiang, C.; Che, L.; Wang, Z.; Zhou, X. Long-Range Spontaneous Droplet Self-Propulsion on Wettability Gradient Surfaces. Sci. Rep. 2017, 7, 7552. [Google Scholar] [CrossRef] [Green Version]
  39. Ng, W.H.; Lu, Y.; Liu, H.; Carmalt, C.J.; Parkin, I.P.; Kenyon, A.J. Controlling and Modelling the Wetting Properties of III-V Semiconductor Surfaces Using Re-Entrant Nanostructures. Sci. Rep. 2018, 8, 3544. [Google Scholar] [CrossRef] [Green Version]
  40. Akbari, R.; Mohammadizadeh, M.R.; Antonini, C.; Guittard, F.; Darmanin, T. Controlling Morphology and Wettability of Intrinsically Superhydrophobic Copper-Based Surfaces by Electrodeposition. Coatings 2022, 12, 1260. [Google Scholar] [CrossRef]
  41. Lasagni, A.F.; Alamri, S.; Aguilar-Morales, A.I.; Rößler, F.; Voisiat, B.; Kunze, T. Biomimetic Surface Structuring Using Laser Based Interferometric Methods. Appl. Sci. 2018, 8, 1260. [Google Scholar] [CrossRef]
  42. Ponomarev, K.O.; Kuznetsov, G.V.; Orlova, E.G.; Feoktistov, D.V. Thermosyphon-Assisted Cooling System Working in the Moderate Heat Flux Range. Therm. Sci. Eng. Prog. 2022, 32, 101330. [Google Scholar] [CrossRef]
  43. Misyura, S.Y.; Feoktistov, D.V.; Morozov, V.S.; Orlova, E.G.; Kuznetsov, G.V.; Islamova, A.G. Effect of Heat Treatment on Corrosion of Laser-Textured Aluminum Alloy Surfaces. J. Mater. Sci. 2021, 56, 12845–12863. [Google Scholar] [CrossRef]
  44. Gatapova, E.Y.; Semenov, A.A.; Zaitsev, D.V.; Kabov, O.A. Evaporation of a Sessile Water Drop on a Heated Surface with Controlled Wettability. Colloids Surf. A Physicochem. Eng. Asp. 2014, 441, 776–785. [Google Scholar] [CrossRef]
  45. Fornasini, P. The Uncertainty in Physical Measurements; Springer: New York, NY, USA, 2008; ISBN 9780333227794. [Google Scholar]
  46. Feoktistov, D.V.; Glushkov, D.O.; Kuznetsov, G.V.; Orlova, E.G.; Paushkina, K.K. Ignition and Combustion Enhancement of Composite Fuel in Conditions of Droplets Dispersion during Conductive Heating on Steel Surfaces with Different Roughness Parameters. Fuel 2022, 314, 122745. [Google Scholar] [CrossRef]
  47. Kuznetsov, G.V.; Misyura, S.Y.; Volkov, R.S.; Morozov, V.S. Marangoni Flow and Free Convection during Crystallization of a Salt Solution Droplet. Colloids Surf. A Physicochem. Eng. Asp. 2019, 572, 37–46. [Google Scholar] [CrossRef]
  48. Emelyanenko, A.M.; Boinovich, L.B.; Emelyanenko, K.A. Spreading of Biologically Relevant Liquids over the Laser Textured Surfaces. J. Colloid Interface Sci. 2020, 567, 224–234. [Google Scholar] [CrossRef]
  49. Feoktistov, D.; Orlova, E.; Islamova, A. Spreading Modes on Copper and Steel Surfaces. In Proceedings of the EPJ Web of Conferences, Tomsk, Russia, 13–15 October 2016; Volume 110. [Google Scholar]
  50. Emel’yanenko, A.M.; Boinovich, L.B. Analysis of Wetting as an Efficient Method for Studying the Characteristics of Coatings and Surfaces and the Processes That Occur on Them: A Review. Inorg. Mater. 2011, 47, 1667–1675. [Google Scholar] [CrossRef]
  51. Emelyanenko, A.M.; Ermolenko, N.V.; Boinovich, L.B. Contact Angle and Wetting Hysteresis Measurements by Digital Image Processing of the Drop on a Vertical Filament. Colloids Surf. A Physicochem. Eng. Asp. 2004, 239, 25–31. [Google Scholar] [CrossRef]
  52. Czerwiec, T.; Tsareva, S.; Andrieux, A.; Bortolini, G.A.; Bolzan, P.H.; Castanet, G.; Gradeck, M.; Marcos, G. Thermal Management of Metallic Surfaces: Evaporation of Sessile Water Droplets on Polished and Patterned Stainless Steel. IOP Conf. Ser. Mater. Sci. Eng. 2017, 258, 012003. [Google Scholar] [CrossRef]
  53. De Gennes, P.G. Wetting: Statics and Dynamics. Rev. Mod. Phys. 1985, 57, 827–863. [Google Scholar] [CrossRef]
Figure 1. Experimental setup: 1—plane-parallel light source; 2—metal sample; 3—high-speed video camera; 4—copper disk; 5—thermocouples recording the temperature on and under the metal sample; 6—temperature input module; 7—glass–ceramic heater; 8—precise positioning system; 9—polymer glass box.
Applsci 12 12155 g001
Figure 2. Contact angle (a) and diameter (b) versus evaporation time for water droplet evaporated in the single-phase regime on copper surfaces heated to 80 °C.
Applsci 12 12155 g002
Figure 3. Contact angle (a) and diameter (b) versus evaporation time for water droplet evaporated in the single-phase regime on steel surfaces heated to 80 °C.
Applsci 12 12155 g003
Figure 4. Photo images of water droplet evaporation when the three-phase contact line moves uniformly during the transition from the CCD to the mixed stage on St1.0 surface.
Applsci 12 12155 g004
Figure 5. Photo images of water droplet evaporation when the three-phase contact line moves nonuniformly during the transition from the CCD to the mixed stage on St46.3 surface.
Applsci 12 12155 g005
Figure 6. Specific evaporation rate versus evaporation time of water droplets from copper (a) and steel (b) surfaces heated to 80 °C at an ambient temperature of 23 °C.
Applsci 12 12155 g006
Figure 7. Total evaporation rate of water droplets versus Sdr parameter (increment of surface area due to increased roughness) for St12.6, St15.3, St25.8, and St46.2 surfaces.
Applsci 12 12155 g007
Table 1. SEM images and parameters characterizing roughness and wetting of copper surfaces.
Cu-ETP Copper Surfaces
SEM imagesApplsci 12 12155 i001Applsci 12 12155 i002Applsci 12 12155 i003
RoughnessSa = 0.06 ± 0.005 μm; Sz = 1.1 ± 0.1 μm;
Sdr = 0.2 ± 0.02%
Sa = 0.15 ± 0.007 μm; Sz = 2.3 ± 0.15 μm;
Sdr = 1.4 ± 0.05%
Sa = 0.22 ± 0.01 μm; Sz = 2.9 ± 0.2 μm;
Sdr = 1.8 ± 0.06%
Wettingθ ± Δθ = 66 ± 5°
d = 4.1 ± 0.2 mm
θ ± Δθ = 78 ± 5°
d = 3.8 ± 0.15 mm
θ ± Δθ = 83 ± 6°
d = 3.7 ± 0.12 mm
SEM imagesApplsci 12 12155 i004Applsci 12 12155 i005Applsci 12 12155 i006
RoughnessSa = 0.24 ± 0.01 μm; Sz = 3.2 ± 0.2 μm,
Sdr = 2.7 ± 0.1%
Sa = 0.29 ± 0.02 μm; Sz = 5.1 ± 0.3 μm,
Sdr = 3.9 ± 0.2%
Sa = 0.35 ± 0.03 μm; Sz = 7.3 ± 0.4 μm,
Sdr = 4.6 ± 0.3%
Wettingθ ± Δθ = 85 ± 6°
d = 3.6 ± 0.12 mm
θ ± Δθ = 88 ± 4°
d = 3.5 ± 0.12 mm
θ ± Δθ = 93 ± 4°
d = 3.3 ± 0.1 mm
Table 2. SEM images and parameters characterizing roughness and wetting of steel surfaces.
1.4541 Steel Surfaces
SEM imagesApplsci 12 12155 i007Applsci 12 12155 i008Applsci 12 12155 i009
RoughnessSa = 0.03 ± 0.003 μm; Sz = 0.7 ± 0.05 μm;
Sdr = 0.1 ± 0.01%
Sa = 0.07 ± 0.005 μm; Sz = 1.2 ± 0.1 μm;
Sdr = 0.3 ± 0.03%
Sa = 0.08 ± 0.006 μm; Sz = 1.3 ± 0.1 μm;
Sdr = 0.5 ± 0.04%
Wettingθ ± Δθ = 89 ± 4°
d = 3.4 ± 0.11 mm
θ ± Δθ = 78 ± 7°
d = 3.8 ± 0.12 mm
θ ± Δθ = 77 ± 6°
d = 3.8 ± 0.12 mm
SEM imagesApplsci 12 12155 i010Applsci 12 12155 i011Applsci 12 12155 i012
RoughnessSa = 0.10 ± 0.005 μm; Sz = 1.4 ± 0.1 μm;
Sdr = 0.6 ± 0.05%
Sa = 0.12 ± 0.007 μm; Sz = 1.4 ± 0.1 μm;
Sdr = 0.7 ± 0.05%
Sa = 0.14 ± 0.01 μm; Sz = 1.7 ± 0.11 μm;
Sdr = 0.8 ± 0.06%
Wettingθ ± Δθ = 74 ± 5°
d = 3.9 ± 0.12 mm
θ ± Δθ = 73 ± 4°
d = 4 ± 0.15 mm
θ ± Δθ = 71 ± 5°
d = 4 ± 0.15 mm
Publisher’s Note: MDPI stays neutral with regard to jurisdictional claims in published maps and institutional affiliations.

