Article

Working Face Stability of Box Shield Tunneling under Non-Uniform Support Pressure

1
School of Rail Transportation, Soochow University, Suzhou 215131, China
2
Powerchina Huadong Engineering Corporation Limited, Hangzhou 311122, China
*
Author to whom correspondence should be addressed.
Appl. Sci. 2022, 12(23), 12360; https://doi.org/10.3390/app122312360
Submission received: 21 October 2022 / Revised: 29 November 2022 / Accepted: 30 November 2022 / Published: 2 December 2022
(This article belongs to the Special Issue Urban Underground Engineering: Excavation, Monitoring, and Control)

Abstract

:
This paper proposes a theoretical model for the stability analysis of a box tunnel face in non-cohesive soils considering the uneven distribution of support pressure caused by multiple cutter heads and screw conveyors. The support pressure distribution on the tunnel face is concave. Accordingly, the failure mechanism is composed of a prism and a wedge, both including three blocks. The relatively smaller support pressure acting on the middle blocks lead to the tendency of slide. Assuming that the support pressure acting on the side blocks is obtained using the active earth pressure coefficient, the support pressure acting on block II can be achieved by limit equilibrium analysis considering the interactions between the blocks. The influences of strength parameters and geometric parameters on the tunnel face stability are discussed in the parametric analysis. For comparison, numerical analysis is conducted in the commercial software OptumG3. It is found that the results given by the proposed model agree well with those from the numerical model. Therefore, the rationality of the proposed model in predicting the collapse geometry is verified.

1. Introduction

Rectangular tunnels are widely used in the construction of urban underground projects such as subways, which have advantages such as high space utilization and little impacts on ground traffic, etc. As a trenchless technique, box jacking is often adopted in urban construction. The stability of the tunnel face is one of the most important factors in tunneling. It is necessary to ensure face stability during the excavation of a tunnel. The cross section of a rectangular tunnel tends to be large, and the support pressure is unevenly distributed, both of which greatly increase the risk of tunnel face instability.
The methods to study the stability of a tunnel boring face mainly include theoretical analysis [1,2,3,4,5,6,7,8,9,10,11,12,13,14,15,16,17,18,19,20,21,22,23,24,25,26,27,28,29,30], model testing, and numerical simulation [31,32,33,34,35,36,37,38,39,40,41,42]. Theoretical analysis presents a clear force model, and the force analysis is scientific and accurate, which is ideal for engineering applications. Commonly used theoretical methods mainly include upper limit analysis and limit equilibrium analysis.
Limit analysis methods [1,2,3,4,5,6,7,8,9,10,11,12,13,14,15] construct a damage maneuver mechanism according to the plastic flow law for soil in the critical state and use an energy balance to derive the judgment criteria for the destabilization of the excavation surface. Davis et al. [1] studied the active failure mode of shield tunneling in undrained clay soil under 2D plane strain conditions and proposed the calculation method of the ultimate support pressure and stability coefficient. Leca & Dormieux [2] proposed a 3D cone model, constructed a translational maneuver field that satisfies the motion permission, and derived the upper limit solution of the limit support pressure. According to Leca & Dormieux [2], Soubra et al. [3] improved the cone model, and a 3D failure mechanism composed of a rigid cone and a logarithmic spiral shear body was proposed. Mollon et al. [4,5,6] focused on the elliptical failure area and the circle of the cone model and constructed the 3D logarithmic spiral failure mechanism for the first time using spatial discretization technology to achieve the full-section instability of the failure mechanism.
Based on the spatial discretization technology, Pan et al. [7,8,9] extended an advanced 3D failure mechanism into the face stability analysis in anisotropic and nonhomogeneous soils, achieved to generate a failure mechanism for a non-circular tunnel face to estimate the safety factor of a tunnel face. Senent et al. [10] used both planar triangular blocks and spiral blocks to construct an active instability maneuvering model and studied the influence of the tunnel excavation step on the stability of the driving face. Chen et al. [11] constructed the passive instability failure mechanism of a shallow tunnel driving face and considered the pore water, the influence of pressure, and an uneven overload on the stability of the driving face. Liu et al. [12,13] developed 2D and 3D kinematically admissible mechanisms, and the composite mechanism comprises rotational and translational blocks for analyzing the passive face stability during shield tunneling. Liu et al. [14] considered rectangular cross-sectional shield tunneling and derived the upper-bound solution of support pressure applied to maintain the face stability. Di et al. [15] proposed an analytical model of face stability for a tunnel under anisotropic seepage based on the limit analysis upper-bound method.
However, the maneuver model construction rule in limit analysis is influenced by the boundary conditions, and the construction model is complicated, which reduces the applications of limit analysis in engineering. In contrast, limit equilibrium analysis is more adaptable to the boundary conditions and easier to analyze by constructing a rigid-body limit equilibrium model. Jancsecz et al. [16] established a 3D wedge model based on the limit equilibrium method using the silo theory and proposed a calculation method for the limit support pressure. Broere [17] extended the calculation model to layered soil conditions and analyzed the earth pressure and mud–water balance shield construction limit support pressure. Anagnostou [18] studied the influence of the soil arching effect on the stability of the tunnel excavation surface, optimized the calculation model, and put forward the expression of support pressure. Xu et al. [19] considered the face stability of rectangular pipe jacking under the condition of gravel formation and used the trapezoidal wedge model to derive the expression of the active failure limit support pressure of the excavation face. Cheng et al. [20] assumed that the failure area is an arc-shaped wedge and derived the active limit support force calculation formula for the lower excavation face under dry sand conditions based on the silo theory. Lin et al. [21], based on the limit equilibrium method, proposed a logarithmic spiral prism model considering the unsupported length to analyze the stability of the shallow tunnel driving face in sand. Vu et al. [22] extended the calculation model to stratified soil conditions and derived the ultimate support pressure for the earth pressure and mud–water balance shield construction. Wei et al. [23,24] modified the 3D wedge model by assuming the sliding block shape to be a trapezoidal wedge when the excavation surface is destabilized and obtained better calculation results for the support force. Sun et al. [25,26,27] investigated the analytical solutions for the responses of tunnels excavated in rock masses and verified the proposed solutions by numerical simulations. The existing theoretical studies mainly focus on the stability of tunnel boring faces in circular cross-sections, and there is less research on rectangular cross-sections, and there are especially few theoretical studies on the uneven distribution of support pressure in the boring face. Liu et al. [28] focused on the situation in which the working face chamber is exposed to free air due to obstruction removal. In this situation, the support pressure distribution on the working face is characterized by zero in the middle. At this point, the soil in the middle of the working face has a great risk of destabilization because, without support pressure, the soil is likely to have an insufficient shear strength to maintain stability.
This paper investigates the stability of the box tunnel working face. An improved wedge–prism model is established for the uneven distribution of support pressure at the tunnel face due to the large cross-section and the characteristic behavior of the cutter head. In the proposed model, the wedge and prim blocks are each divided into three blocks according to the characteristics of the support pressure distribution. The support pressure distribution on the working face is characterized as concave. Therefore, the soil in the middle with a small support pressure has a downward sliding tendency relative to the soil on both sides because the support pressure is not sufficient to maintain stability, and even active damage may occur. Assuming that the support pressure on both sides of the tunnel face is known and taking into account the interactions between the blocks, the smaller support pressure in the middle can be calculated by force analysis. The rationality of the proposed model is investigated, and the results given by the proposed method are compared with those obtained by numerical simulation.

2. Materials and Methods

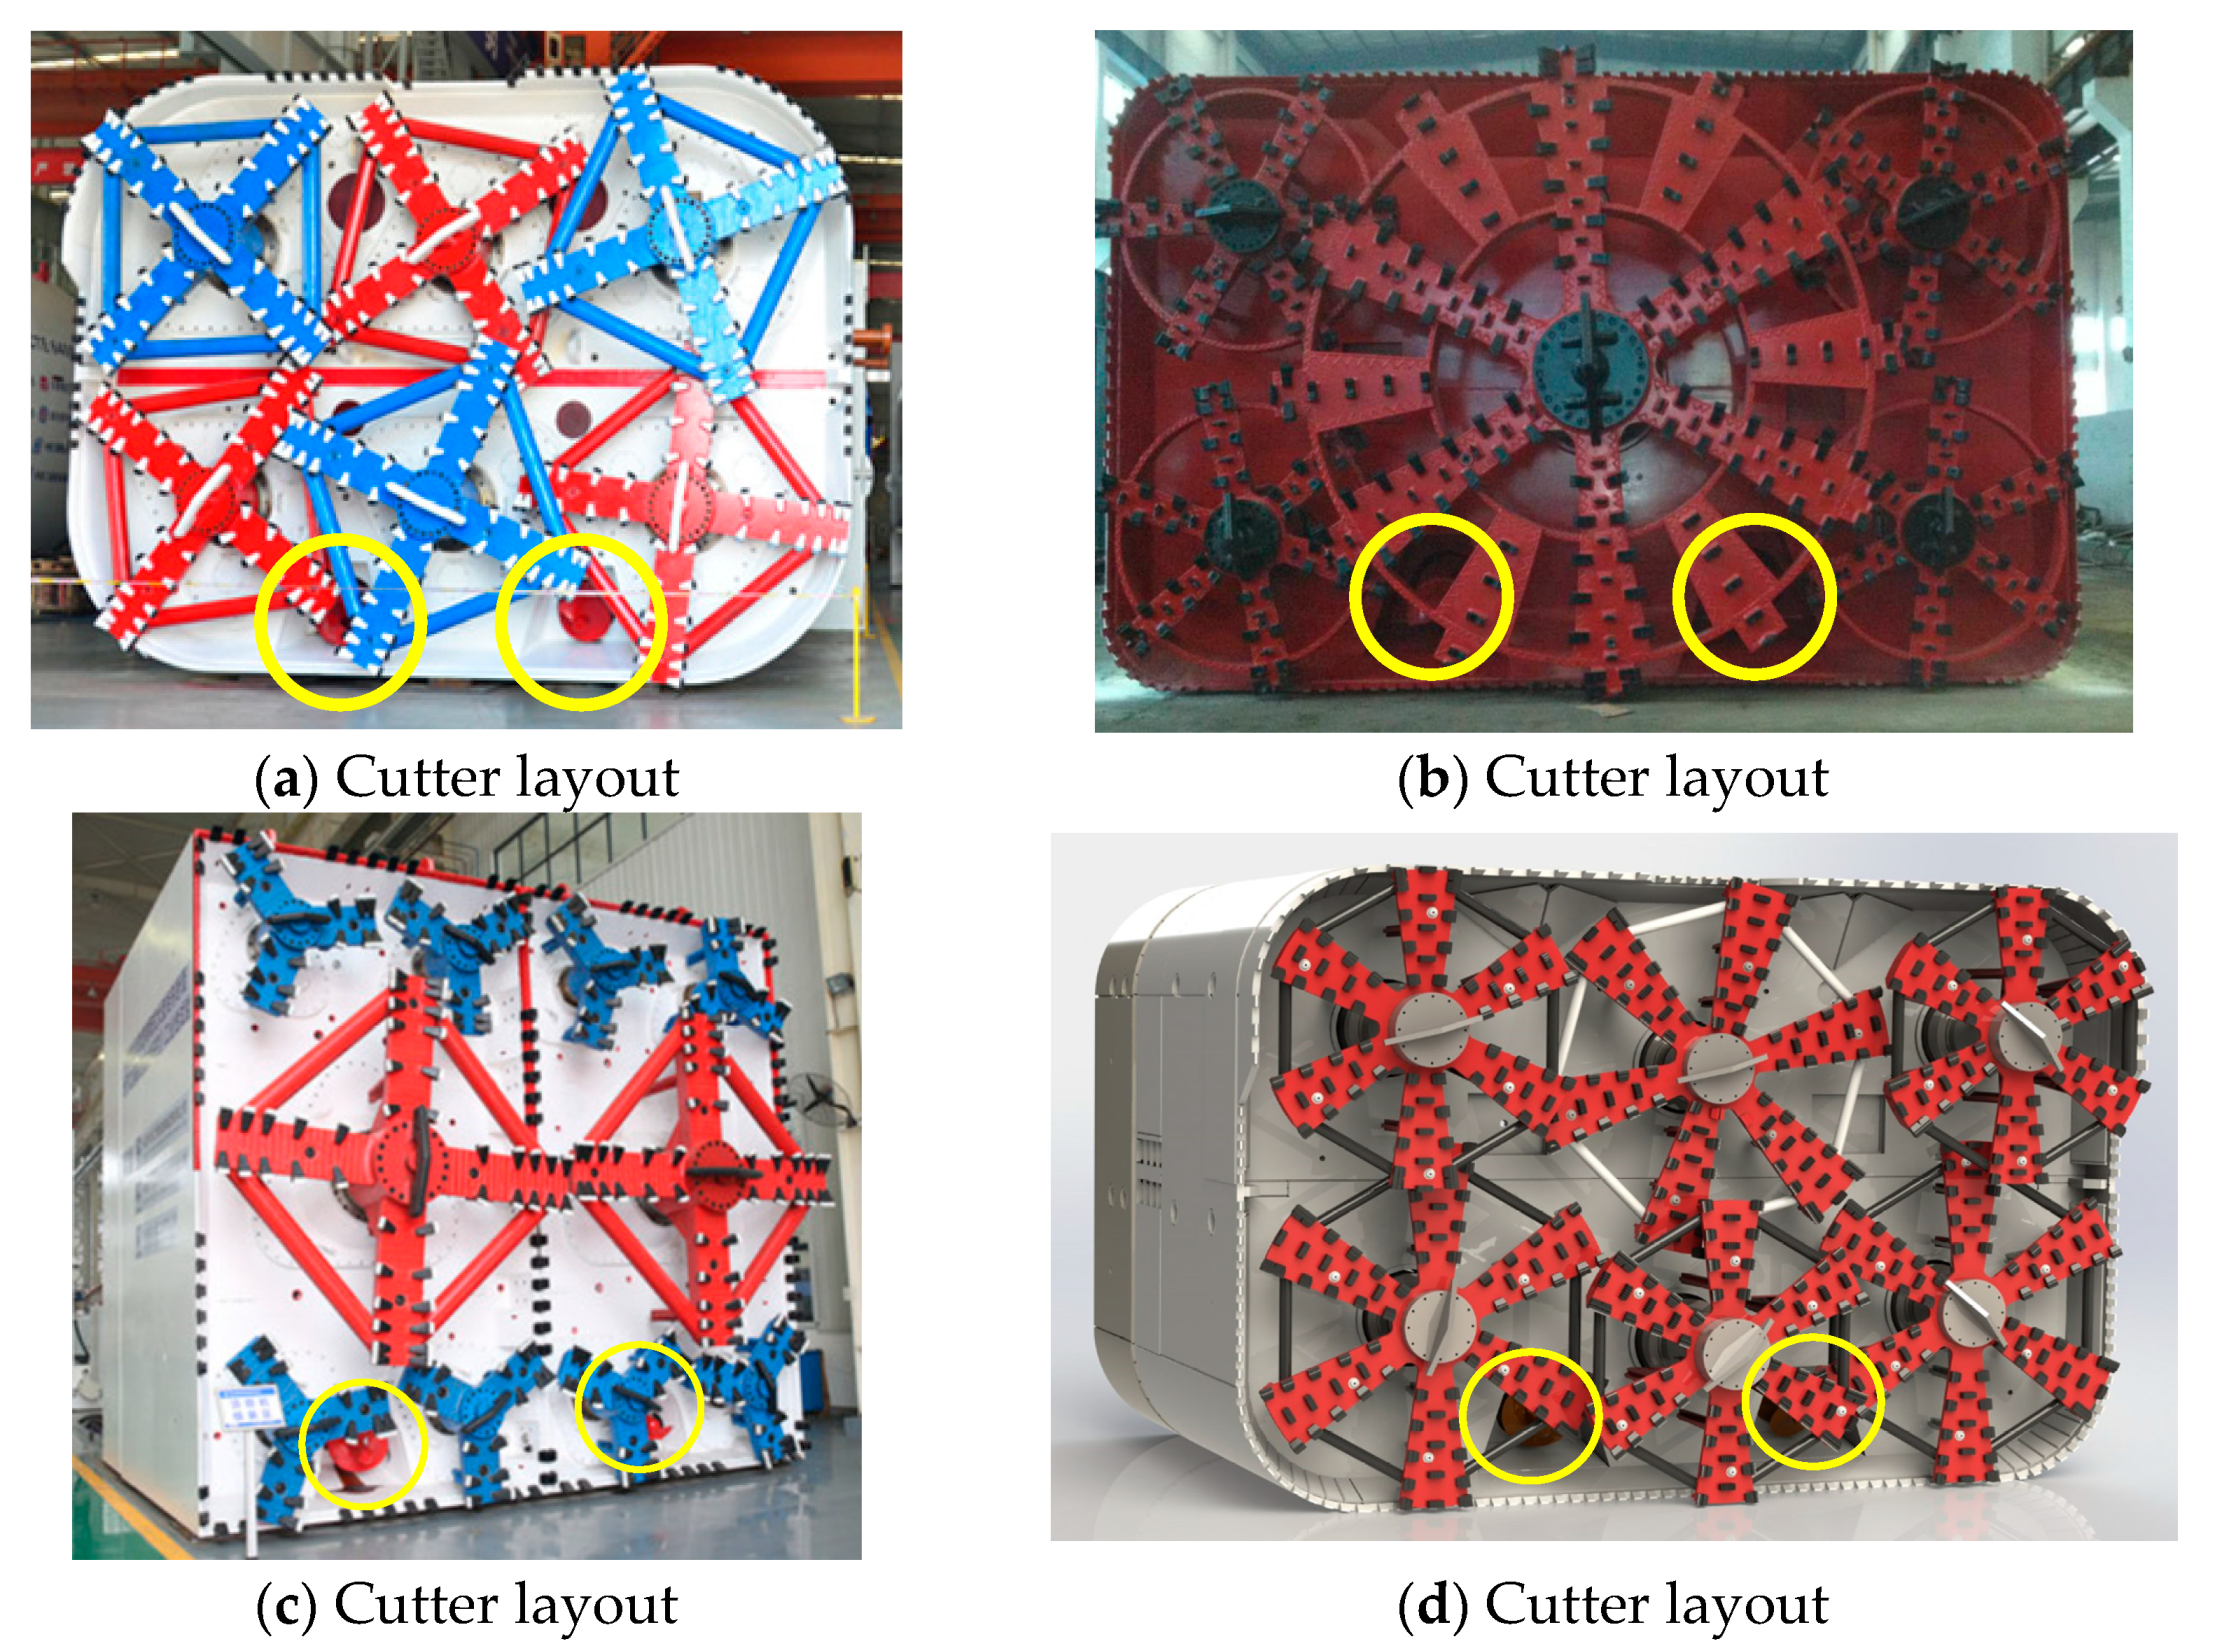
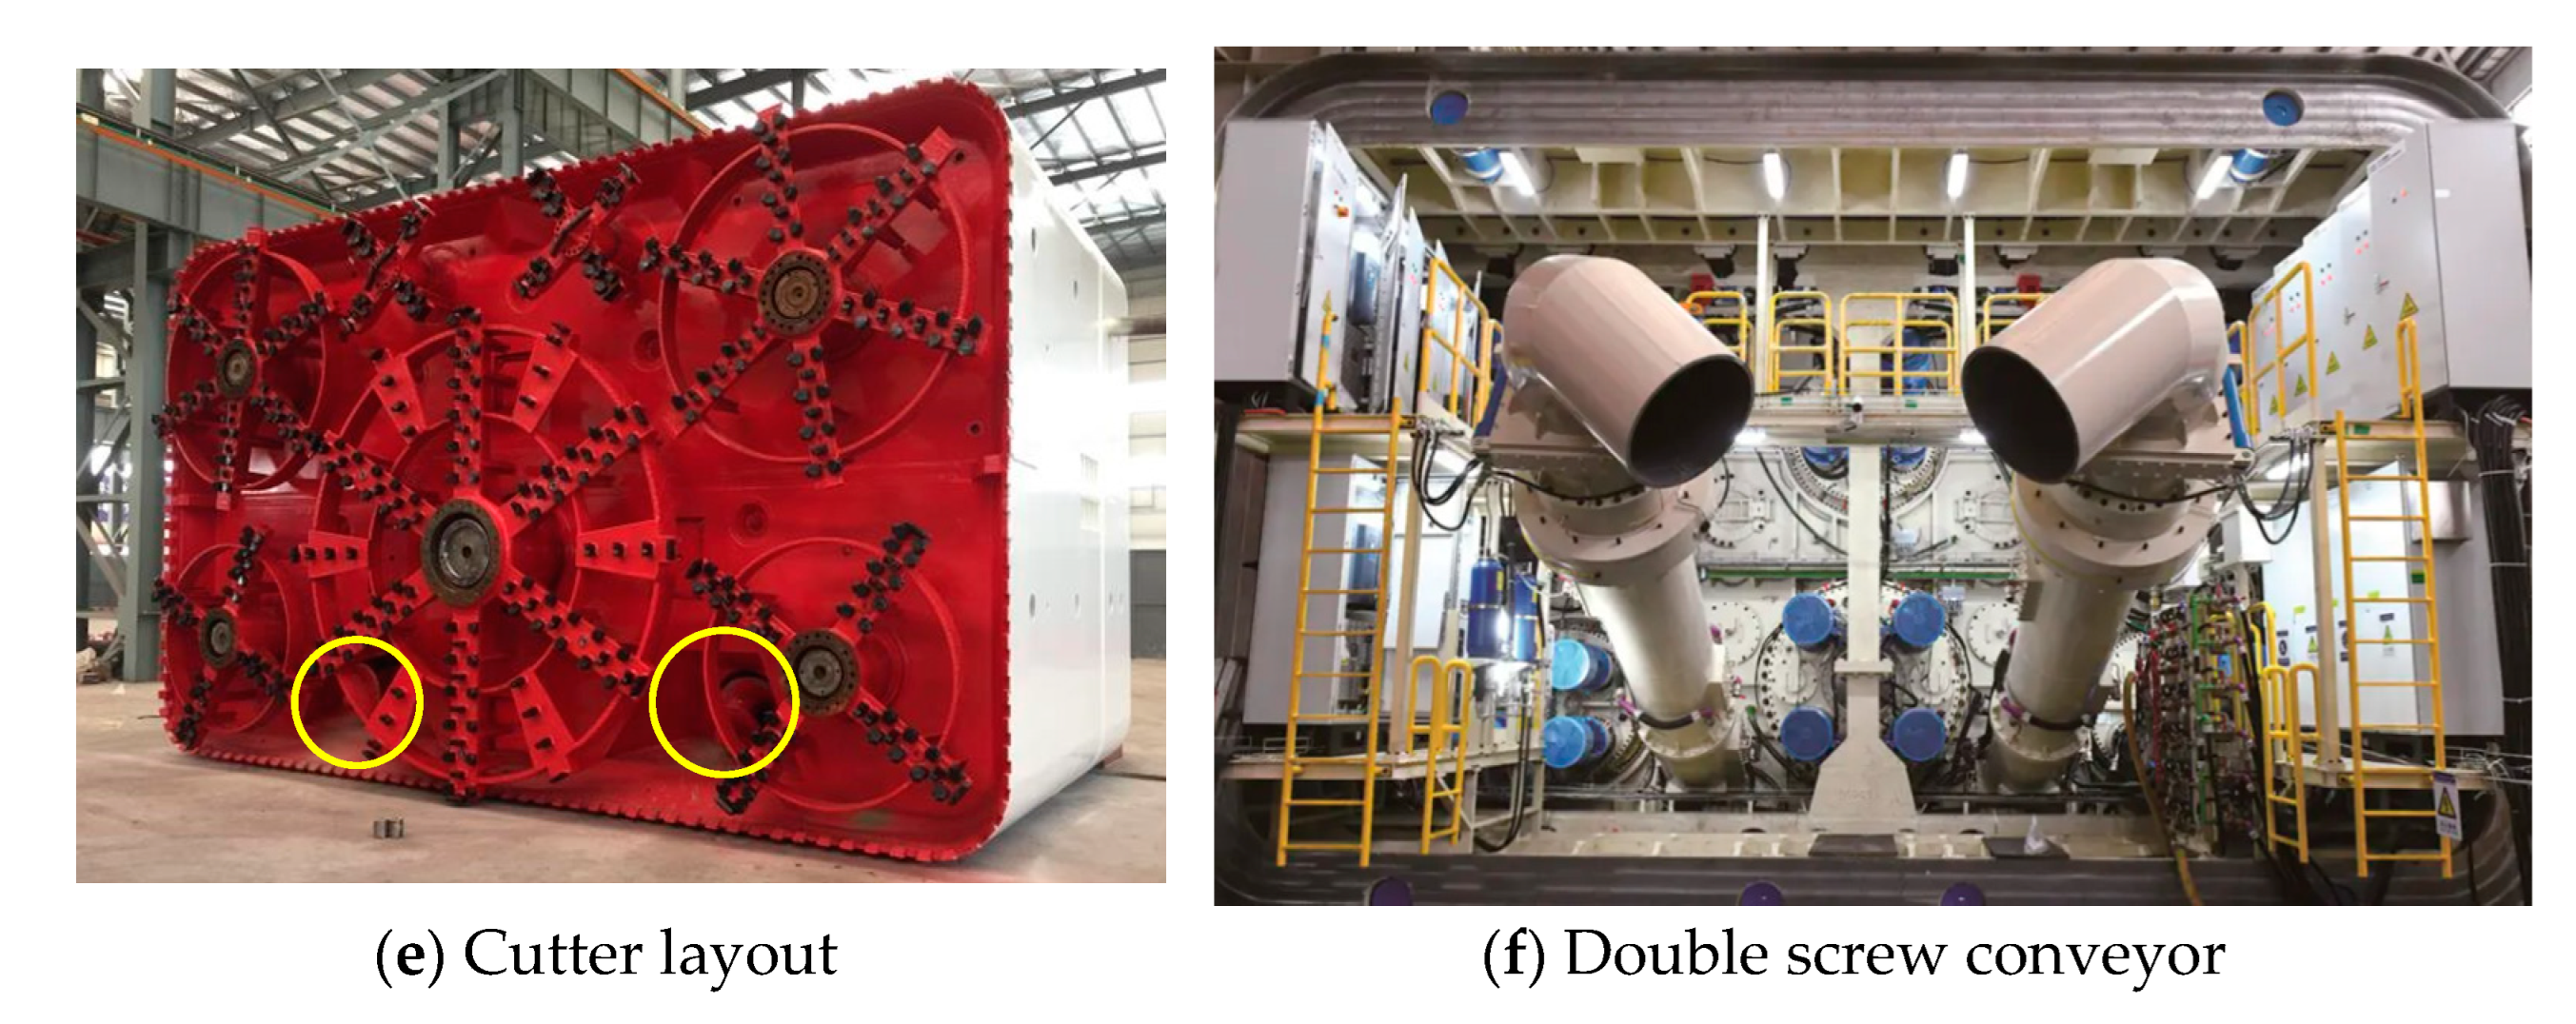
2.1. Distribution Characteristics of Support Pressure in Box Tunnels
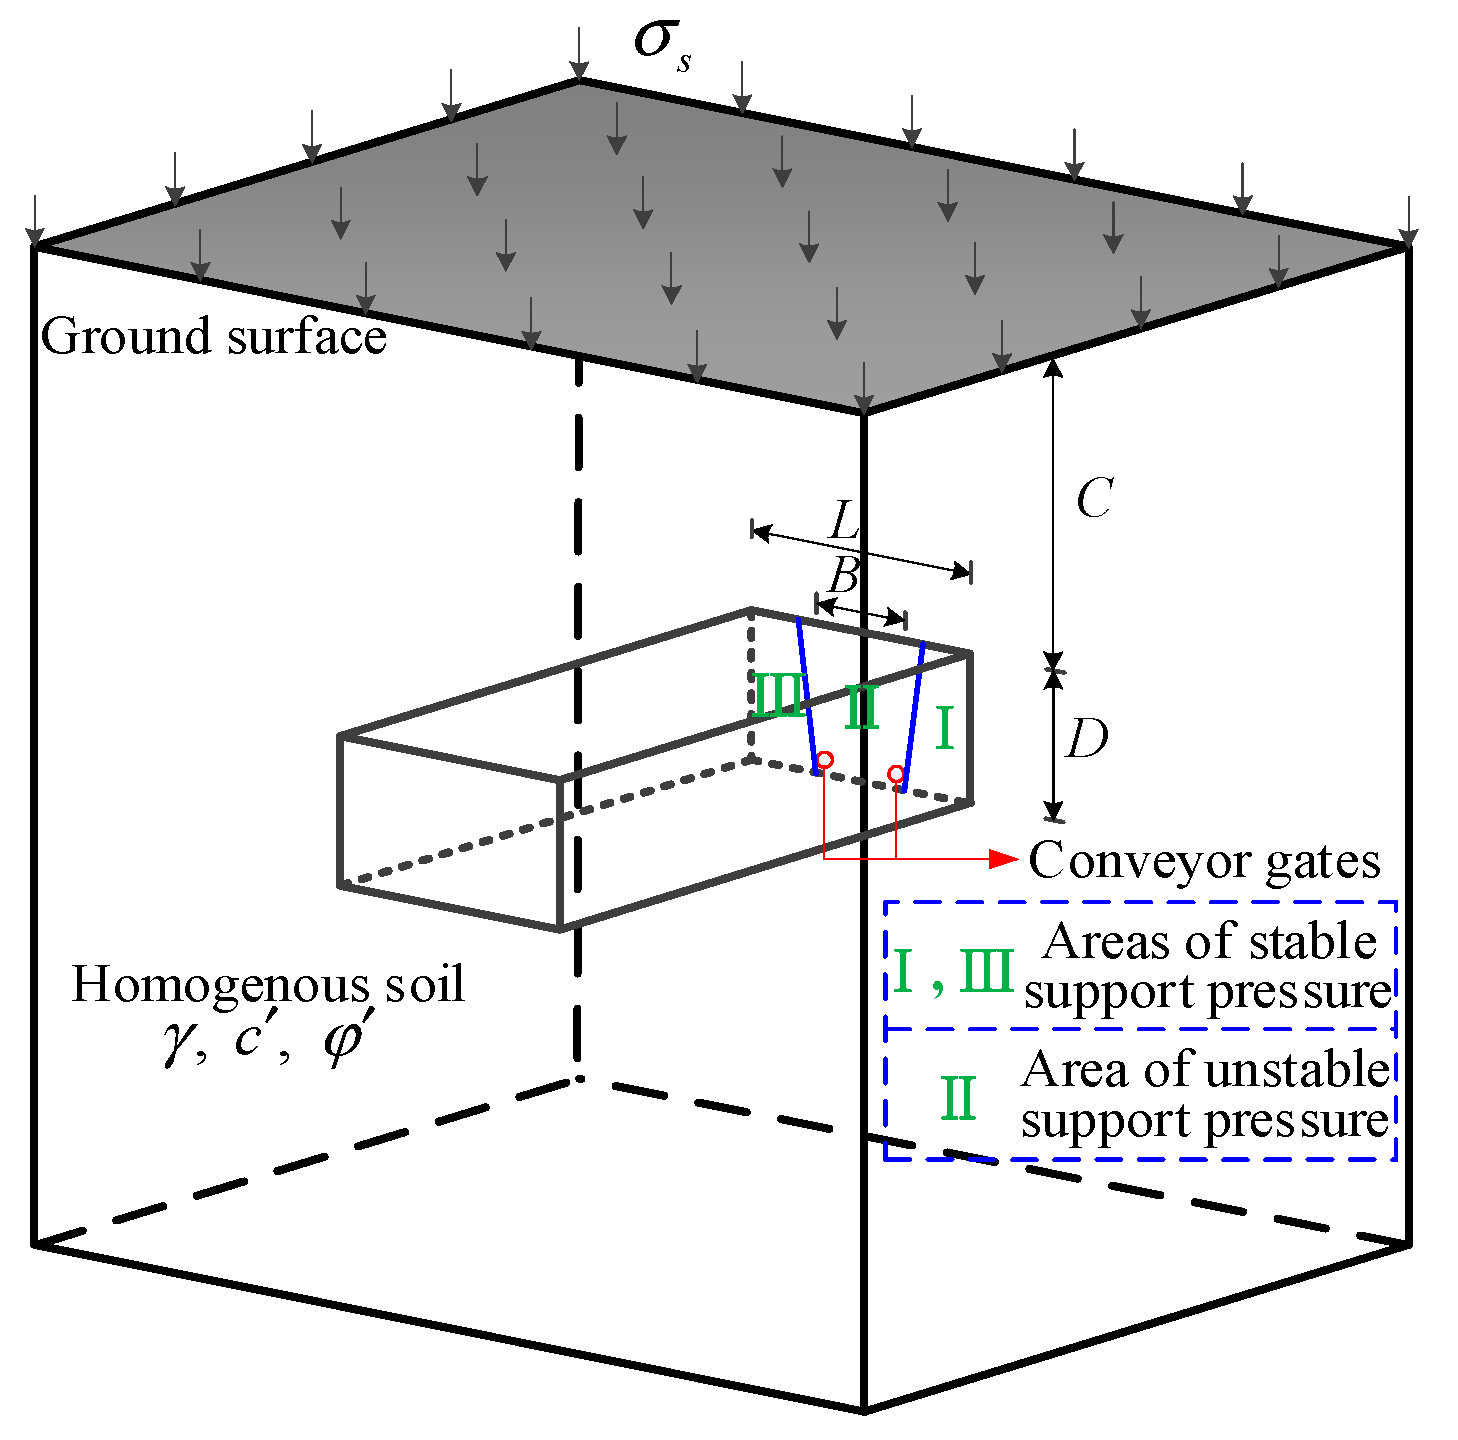
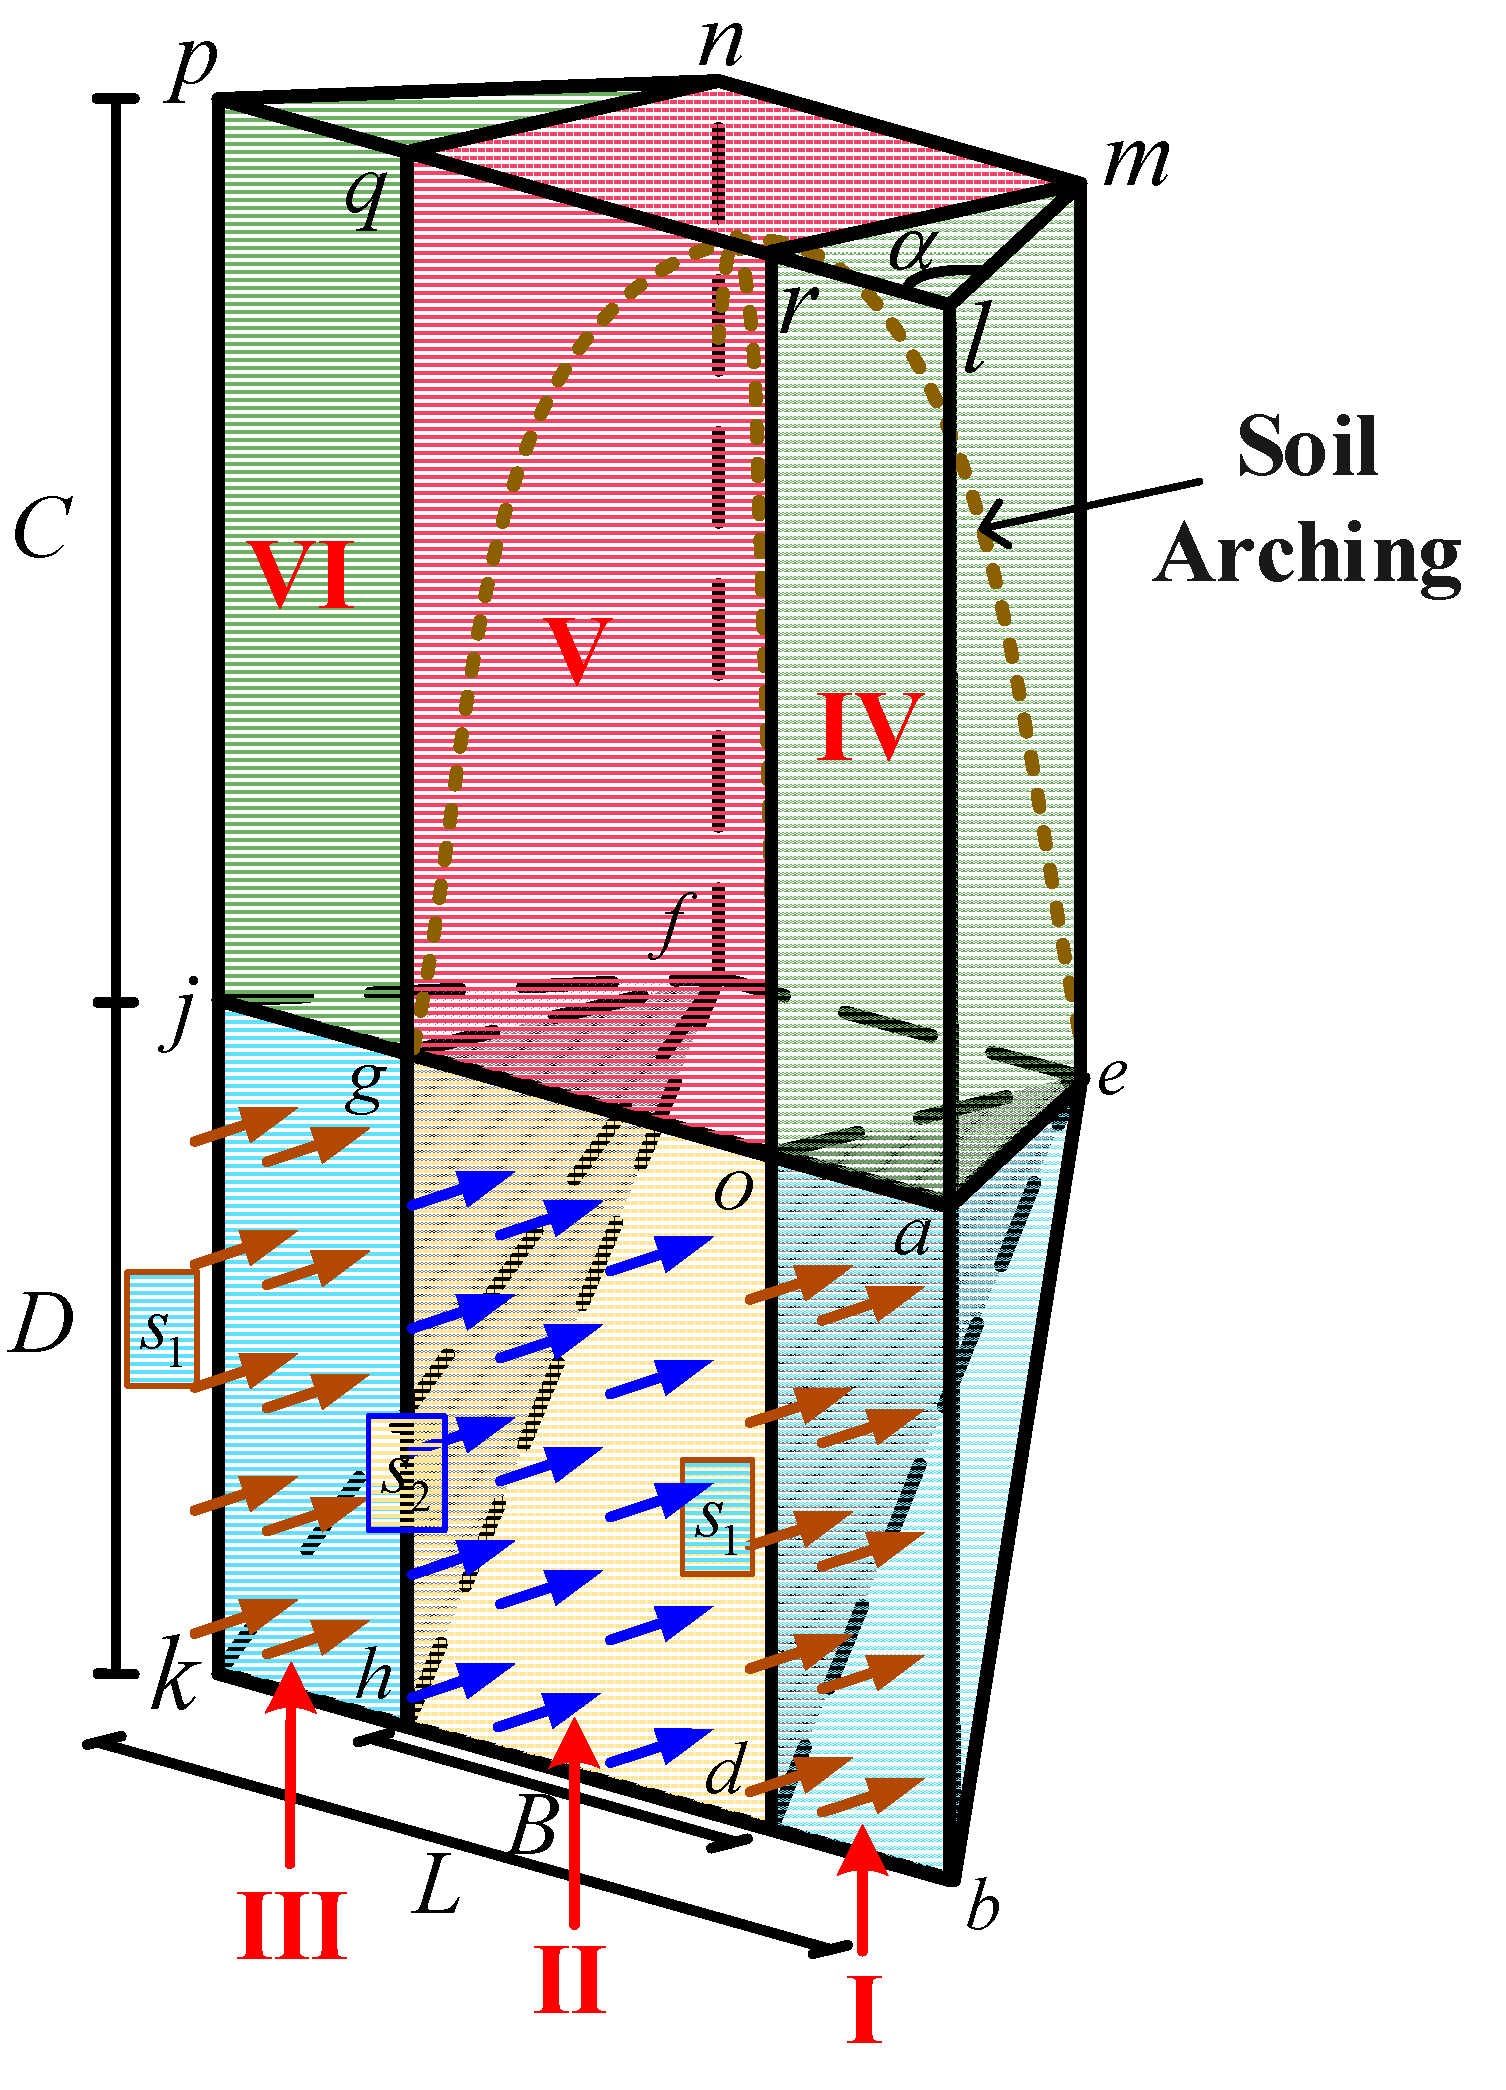
As shown in Figure 1, due to its large section, the boring machine often uses multiple cutter heads and double-screw conveyors to improve the efficiency of excavation and soil removal. The gates of the conveyor are marked with yellow circles in Figure 1a–e. When the tunnel is driven with cutter heads rotating, the cut-down soil enters the chamber through the conveyor gates. A double-screw conveyor mounted behind the bulkhead then discharges the cut soil. (Figure 1f). Since the opening rate of the cutter disc is large, earth pressure in the chamber is highly possible to be fluctuating and unevenly distributed.
Based on the characteristics of the equipment, such as cutter and screw conveyors, the cut soil is conveyed out from the screw conveyor gates, which are at the bottom of the working face. As shown in Figure 2a, with the discharge of soil in the area near the outlet of the double-screw conveyors, the soil in the upper parts and the surrounding areas collapses. The discharge of the screw conveyors makes the air pressure in the central area small and unstable. Therefore, the central area is significantly impacted, while the neighboring two parts are almost unaffected. The residual soil on both sides serves as a stable support for the working face, and the support force is defined as S 1 . The air pressure in the middle area is low and unstable, forming a pressure fluctuation zone. The support force is defined as S 2 , which is smaller than S 1 .
Therefore, the working face is non-uniformly supported, and the support pressure is large on both sides and small in the middle. As shown in Figure 2b, divide the working face into three parts, and simplify the central irregular area of the unstable support pressure into a rectangle (the width of which is B , and the support force is denoted as S 2 ). The two adjacent areas of stable support pressure are also simplified to rectangles with support force S 1 .
In Figure 3, a tunnel excavation of height D and width L under a cover depth C in homogenous soil is considered. The soil obeys the Mohr–Coulomb failure condition, defined by its effective cohesion ( c ), effective angle of internal friction ( φ ), and the total unit weight ( γ ). At the working face, the middle part with a width of B is the area of unstable support pressure. In other words, this part (II) is not subject to the full support force. However, the two parts of the working face on both sides (I and III) are entirely supported. The ground surcharge σ s is not taken into account; thus, σ s is assumed to be 0 kPa.

2.2. Modified Model

Face stability in homogeneous ground can be assessed by considering the mechanism which consists of a wedge and a prism that extends from the tunnel crown to the surface. Figure 4 shows the profile of the proposed model. The width, height, and depth of the tunnel, respectively, are L , D , and C . In the proposed model, the width of the partially supported area is B . Due to symmetry, only block I, block II, and their interaction are necessary to analyze. There are interaction frictions, T 12 and T 21 , and normal forces, N 12 and N 21 , on the contact surface of block I and block II. When block II has a downward trend due to the reduction in the support force, it will produce downward friction T 12 on block I which will cause the risk of instability. Therefore, the analysis of the limit equilibrium state of the two blocks and the interaction forces are used so that the minimum support force S 2 to keep block I stable can be deduced when support force S 1 is known.
As shown in Figure 5, block I is acted upon by (a) the resultant vertical force of the prism on the top surface o a e ; (b) the resultant normal forces and shear forces along the failure surfaces o d e , a b e , and b d e ; (c) the support force S 1 acting on surface o a b d ; and (d) its weight.
The resultant vertical force of the prism P 1 on the top surface o a e is given by:
P 1 = γ C ( L B ) D c o t θ 4
where θ denotes the wedge angle between slanted failure plane and the horizontal.
The resultant normal force N 1 and the shear force T 1 along the failure surface b d e are given by:
T 1 = c ( L B ) D 4 sin θ + N 1 tan φ
The resultant normal force N 3 and the shear force T 3 along the failure surface a b e are given by:
N 3 = 0 D K 0 σ z cot θ sin α ( D z ) d z
T 3 = c D 2 cot θ 2 sin α + N 3 tan φ
where α denotes the bottom corner of isosceles trapezoid on the top of the wedge and can be solved as α = arctan 2 D cot θ L B ; K 0 is a lateral stress coefficient and can be solved as K 0 = 1 sin φ ; and the vertical stress σ z along abe changes linearly with depth and can be solved as σ z = γ ( C + z ) .
The support force S 1 is defined as:
S 1 = s 1 ( L B ) D 2
where s 1 denotes the support pressure acting on surface o a b d .
s 1 = K a γ ( C + D 2 )
where K a is the active earth pressure coefficient and can be solved as K a = tan 2 ( π 4 φ 2 ) .
The weight of block I is:
G 1 = γ V 1 = γ 6 ( L B ) D 2 cot θ
where V 1 represents the volume of block I.
The equilibrium conditions in the y and z directions lead to:
{ S 1 + T 1 cos θ + T 3 sin α cos θ = N 3 cos α + N 1 sin θ + T 12 cos θ P 1 + G 1 + T 12 sin θ = N 1 cos θ + T 3 sin α sin θ + T 1 sin θ  
Its solution reads as follows:
T 12 = P 1 sin θ G 1 sin θ N 3 cos α cos θ + T 3 sin α + T 1 + S 1 cos θ
N 1 = ( P 1 + G 1 ) cos θ + S 1 sin θ N 3 cos α sin θ
As is shown in Figure 6, block II is analyzed by the same method. Compared with block I, block II is acted upon by the support force S 2 acting on surface o g h d .
The vertical force at the wedge–prism interface o e f g reads as follows:
P 2 = σ v B D cot θ
where σ v denotes the vertical stress. Considering the contribution of arching, σ v can be calculated as:
σ v = max { 0 , R γ c K 0 tan φ ( 1 e K 0 tan φ C R ) + σ s   e K 0 tan φ C R }
where σ s   denotes the surface load and is set equal to zero; R equals the ratio of the volume of the prism to its side area: R = B D cot θ 2 ( B + D cot θ ) .
The resultant normal force N 2 and the shear force T 2 along the failure surface d e f h are given by:
T 2 = c B D sin θ + N 2 tan φ
The support force S 2 is defined as:
S 2 = s 2 B D
where s 2 denotes the support pressure acting on surface o g h d .
The self-weight of block II is:
G 2 = γ V 2 = γ 2 B D 2 cot θ
where V 2 represents the volume of block II.
The resultant normal force and the shear force of the two lateral slip surfaces, o e d and g f h , are equal:
{ T 23 = T 21 N 23 = N 21
Taking into account Equation (14) and the equilibrium conditions in the y and z directions leads to:
{ N 2 sin θ = ( T 2 + 2 T 21 ) cos θ + S 2 P 2 + G 2 = ( T 2 + 2 T 21 ) sin θ + N 2 cos θ
Its solution reads as follows:
T 21 = ( P 2 + G 2 ) sin θ T 2 S 2 cos θ 2
N 2 = ( P 1 + G 1 ) cos θ + S 2 sin θ
Due to interaction frictions T 12 = T 21 , combining Equation (9) and Equation (18) makes it possible to eliminate T 12 and T 21 ; the required support force S 2 can now be found from:
( 2 S 1 + S 2 ) cos θ = [ 2 ( P 1 + G 1 ) + P 2 + G 2 ] sin θ + 2 N 3 cos α cos θ 2 T 1 T 2 2 T 3 sin α
Due to Equations (1)–(7) and (10)–(15), we obtain from Equation (20):
s 2 = γ D { [ C ( L B ) 2 B D + 2 L + B 6 B + R ( 1 e K 0 tan φ C R ) D K 0 tan φ ] 1 cot θ tan φ 1 + tan θ tan φ + K 0 3 C + D 3 B ( cot θ cot α tan φ sin θ ( 1 + tan θ tan φ ) ) K 0 ( C D + 1 2 ) ( L B 1 ) } c [ 1 e K 0 tan φ C R K 0 tan φ 1 cot θ tan φ 1 + tan θ tan φ + 2 D cos θ + L + B B sin 2 θ ( 1 + tan θ tan φ ) ]
This simplifies to:
s 2 = γ D N γ c N c
where
N γ = ε ε + [ C ( L B ) 2 B D + L 3 B + R κ D + 1 6 ] + K 0 3 C + D 3 B ( cot θ cot α tan φ ε + sin θ ) K 0 ( C D + 1 2 ) ( L B 1 )
N c = ε ε + κ + 2 D cos θ + L + B B ε + sin 2 θ
Here, the shorthand notation is introduced:
κ = 1 e K 0 tan φ C R K 0 tan φ
ε = 1 cot θ tan φ
ε + = 1 + tan θ tan φ
As is shown in Equation (22), the formula consists of two elements. The first element is related to the weight of the soil. N γ is a coefficient related to γ . The second element is related to the cohesion of the soil. N c is a coefficient related to c . These influencing factors are selected for discussion in the following parametric analysis.

3. Results

3.1. Comparisons of the Support Pressure

In this section, the finite element limit analysis code OptumG3 is used for numerical validation. OptumG3 is favorable for 3D analysis and has the advantage of automatically searching for optimal faults through mathematical optimization [43]. The failure mechanisms of tunnels with different strength parameters and geometric parameters have been investigated. The results of the proposed model—the value of the collapse pressure and the failure geometry—are compared to those of a numerical simulation.
Due to symmetry, half of the tunnel is selected for computation. Figure 7 illustrates the numerical model constructed to validate the analytical solution. The dimensions of the model are 30 m × 24 m × 40 m. The tunnel is excavated to half of its length (20 m). The number of grids is 3000. Standard boundary conditions are used. The support pressure s 1 acting on block I is calculated by Equation (6). Accordingly, the support pressure s 2 acting on block II is calculated.
The cover depth of the tunnel is 6.0 m, i.e., D = 6.0   m . In addition, the surface surcharge is zero. The partially supported ratio B / L varies from 0.4 to 0.7. For shallowly buried tunnels, the depth ratio C / D varies from 1 to 2. For box tunnels, the width–height ratio L / D varies from 1.5 to 2.0. The soil is set as an elastic–plastic material following the Mohr–Coulomb failure criterion and associated flow rule. Typical non-cohesive soil is considered. The mechanical parameters of the soil are listed in Table 1.
Figure 8 indicates the variation in the normalized support pressure with increasing φ . Both the proposed model and the numerical model predict that s 2 / γ D decreases nonlinearly as φ increases. At constant φ , s 2 / γ D associated with a higher B / L has a larger result. This is because the increase in B / L makes the fully supported area on the working face smaller and the partially supported area larger, thus leading to an increase in the risk of instability. At constant φ and B / L , the proposed model predicts a higher s 2 / γ D than the numerical model does. The results of the proposed model are more secure for the engineering design. Figure 8a,b shows that s 2 / γ D with different depth ratios decreases in a similar pattern with an increasing φ . A higher C / D makes a higher s 2 / γ D , which can be observed by comparison.
Table 2 shows the variation in the ratio of the two support pressures s 2 / s 1 with an increasing φ . It can be seen that s 2 / s 1 decreases in a similar pattern as φ changes with s 2 / γ D in Figure 8. However, the changes in s 2 / γ D in Figure 8 are more pronounced than the corresponding changes in s 2 / s 1 in Table 2. It is known that s 1 is related to φ by Equation (6). s 1 decreases with the increase in φ , while γ D is constant. Under the same conditions, s 2 / s 1 is larger than s 2 / γ D , especially when φ is greater. Table 2 shows that s 2 / s 1 with different depth ratios decreases in a similar pattern with an increasing φ . A higher C / D makes a lower s 2 / s 1 , as can be seen by comparison. This is because s 1 is related to C by Equation (6). A higher C / D makes a higher s 1 . The results of the proposed model are greater than the results of the numerical model. The reliability of the proposed model can be verified.
Figure 9 shows the variation in S 2 depending on B / L for a typical φ = 25 ° and L / D = 2 . S 2 grows rapidly with an increasing B / L ; the change curve is steep, and the range of change is large. Figure 10 shows the variation in s 2 / γ D depending on B / L for a typical φ = 25 ° . In Figure 10a ( C / D = 1 ), both models predict that s 2 / γ D increases with an increasing B / L . The curves are relatively flat with less variation. Comparing Figure 9 and Figure 10, it can be found that under the same conditions, S 2 increases by almost 100%, while s 2 / γ D increases by approximately 10%. Due to s 2 = S 2 / B D (Equation (15)), the change in s 2 / γ D is related to B when γ D is constant. When the increase in S 2 is apportioned to the increase in B , the change in s 2 / γ D will be relatively small. This is the reason why s 2 / γ D is less sensitive to B / L compared to S 2 .
In Figure 10 and Figure 11, both s 2 / γ D and s 2 / s 1 increase in a similar pattern with an increasing B / L . The curves indicating the results of the proposed model are mostly above the curves of the numerical model results. The comparison indicates that the proposed model agrees well with the numerical model and predicts higher and safer pressures. The error mainly comes from the assumption that the support pressure acting on block I is known and can be obtained by the active earth pressure coefficient K a , which is shown in Equation (6). This assumption makes s 1 smaller and s 2 larger. The findings from the proposed model are larger than those from the numerical model. It can also be found that at an identical B / L , the results increase with a higher ratio of L / D . This probably occurs because the increase in the width of the working surface weakens the soil arching effect, making the overlying soil pressure increase, and the area partially supported increases accordingly, and it will be more difficult to maintain soil stability.

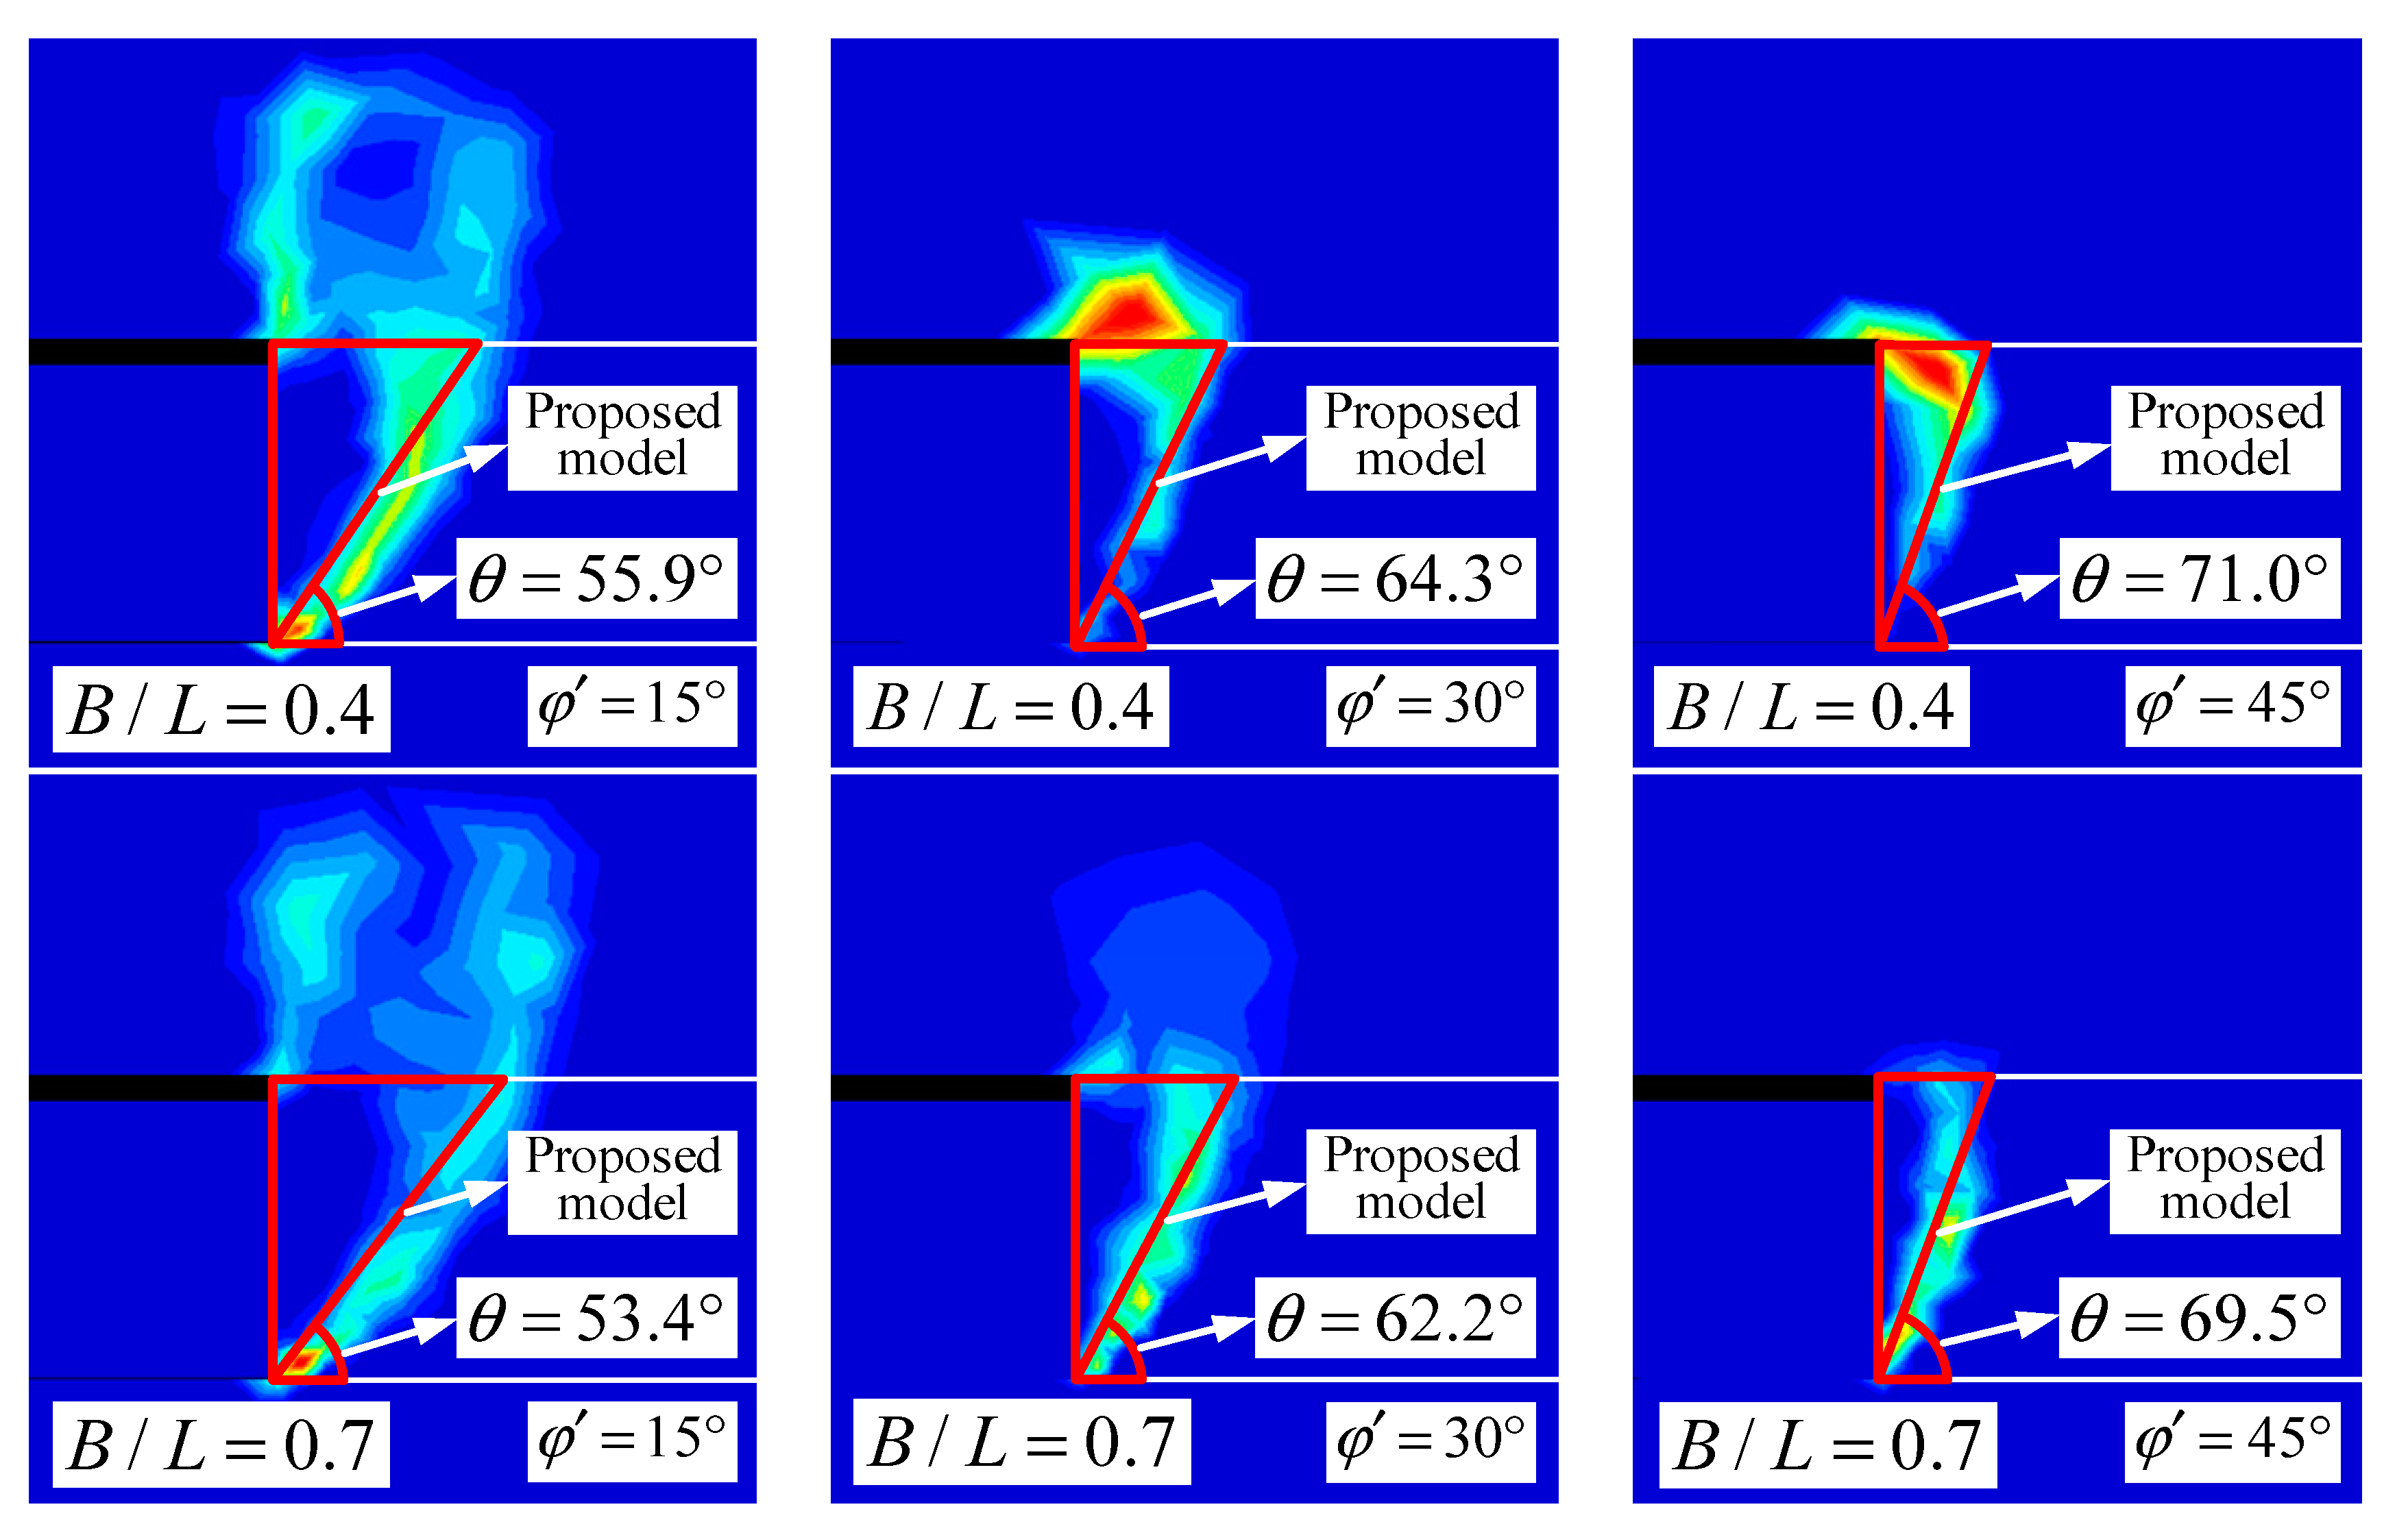
3.2. Comparisons of the Failure Geometry

Figure 12 compares the collapse geometries obtained with the analytical solution and with the numerical model. It can be seen that θ increases with an increasing φ at a constant B / L , while it decreases with an increasing B / L at a constant φ . As shown in Figure 12, in the case of a small φ value ( φ = 15 ° ), the results of the proposed model deviate slightly from numerical results. When φ is beyond this range, the proposed model gives almost the same value as the numerical simulation. The results of the numerical method show that the failure mechanism in front of the tunnel face is wedge-shaped. The shape of the collapse zone obtained from the proposed model agrees well with the result of the numerical model. Therefore, the proposed model is capable of predicting a reasonable collapse zone.

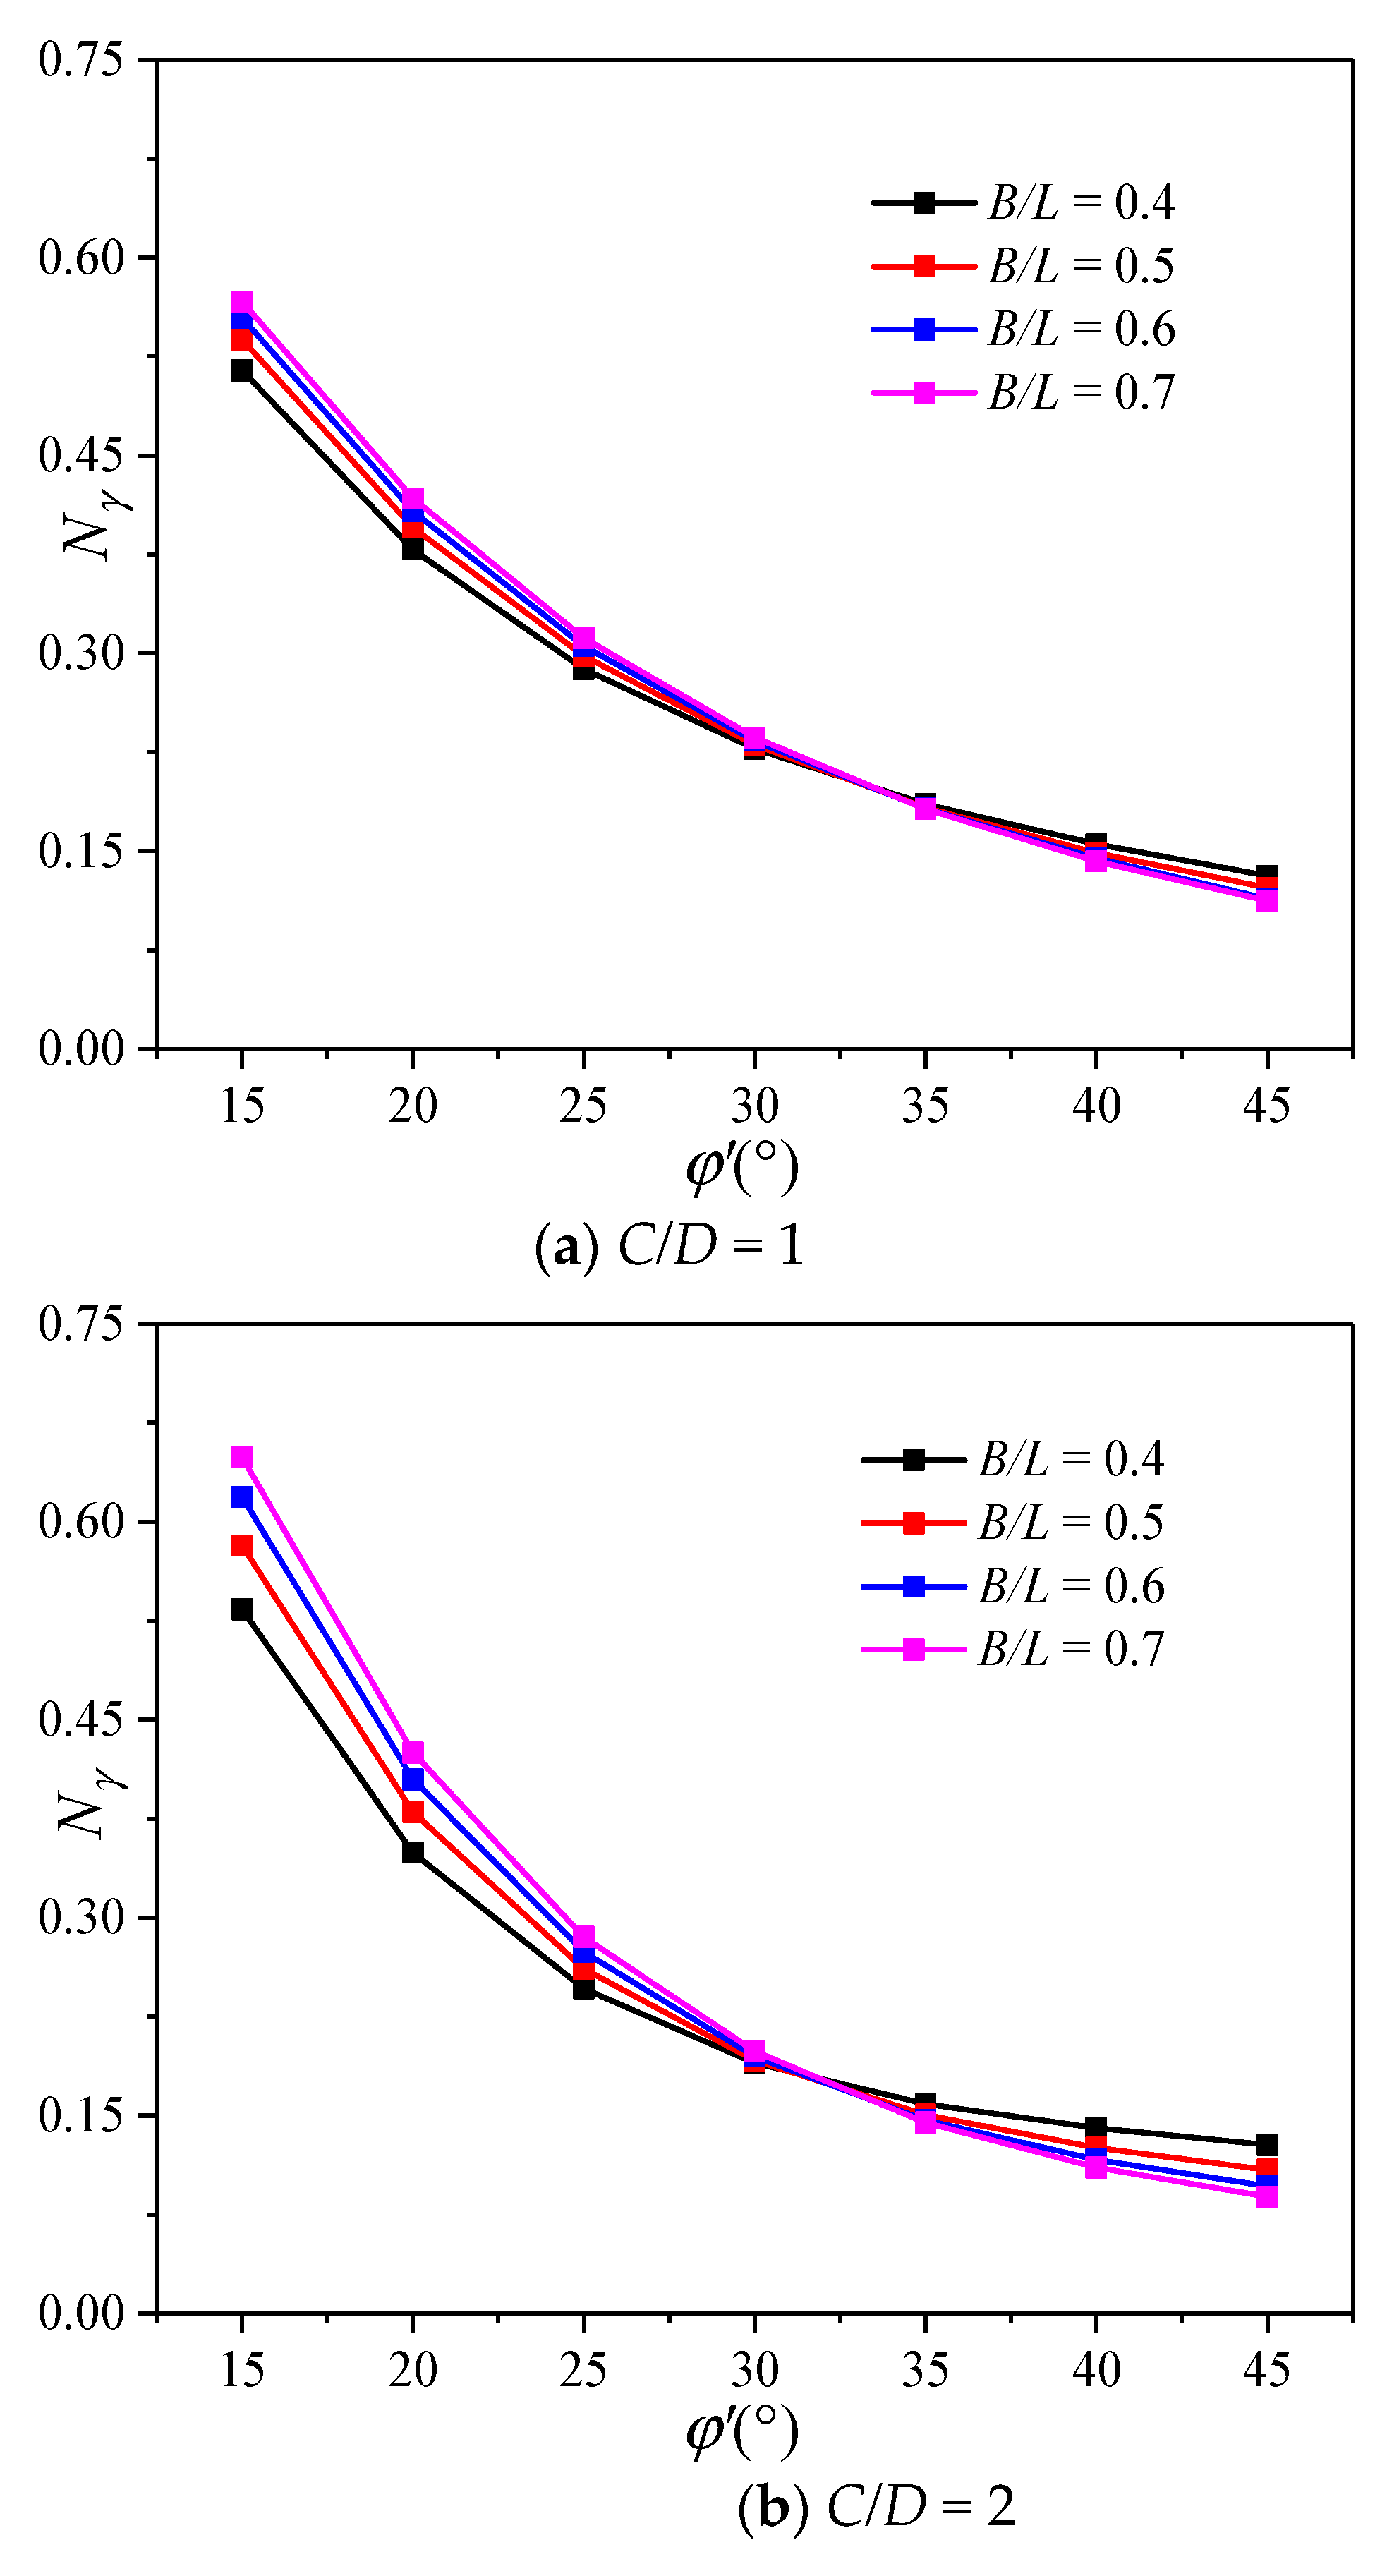
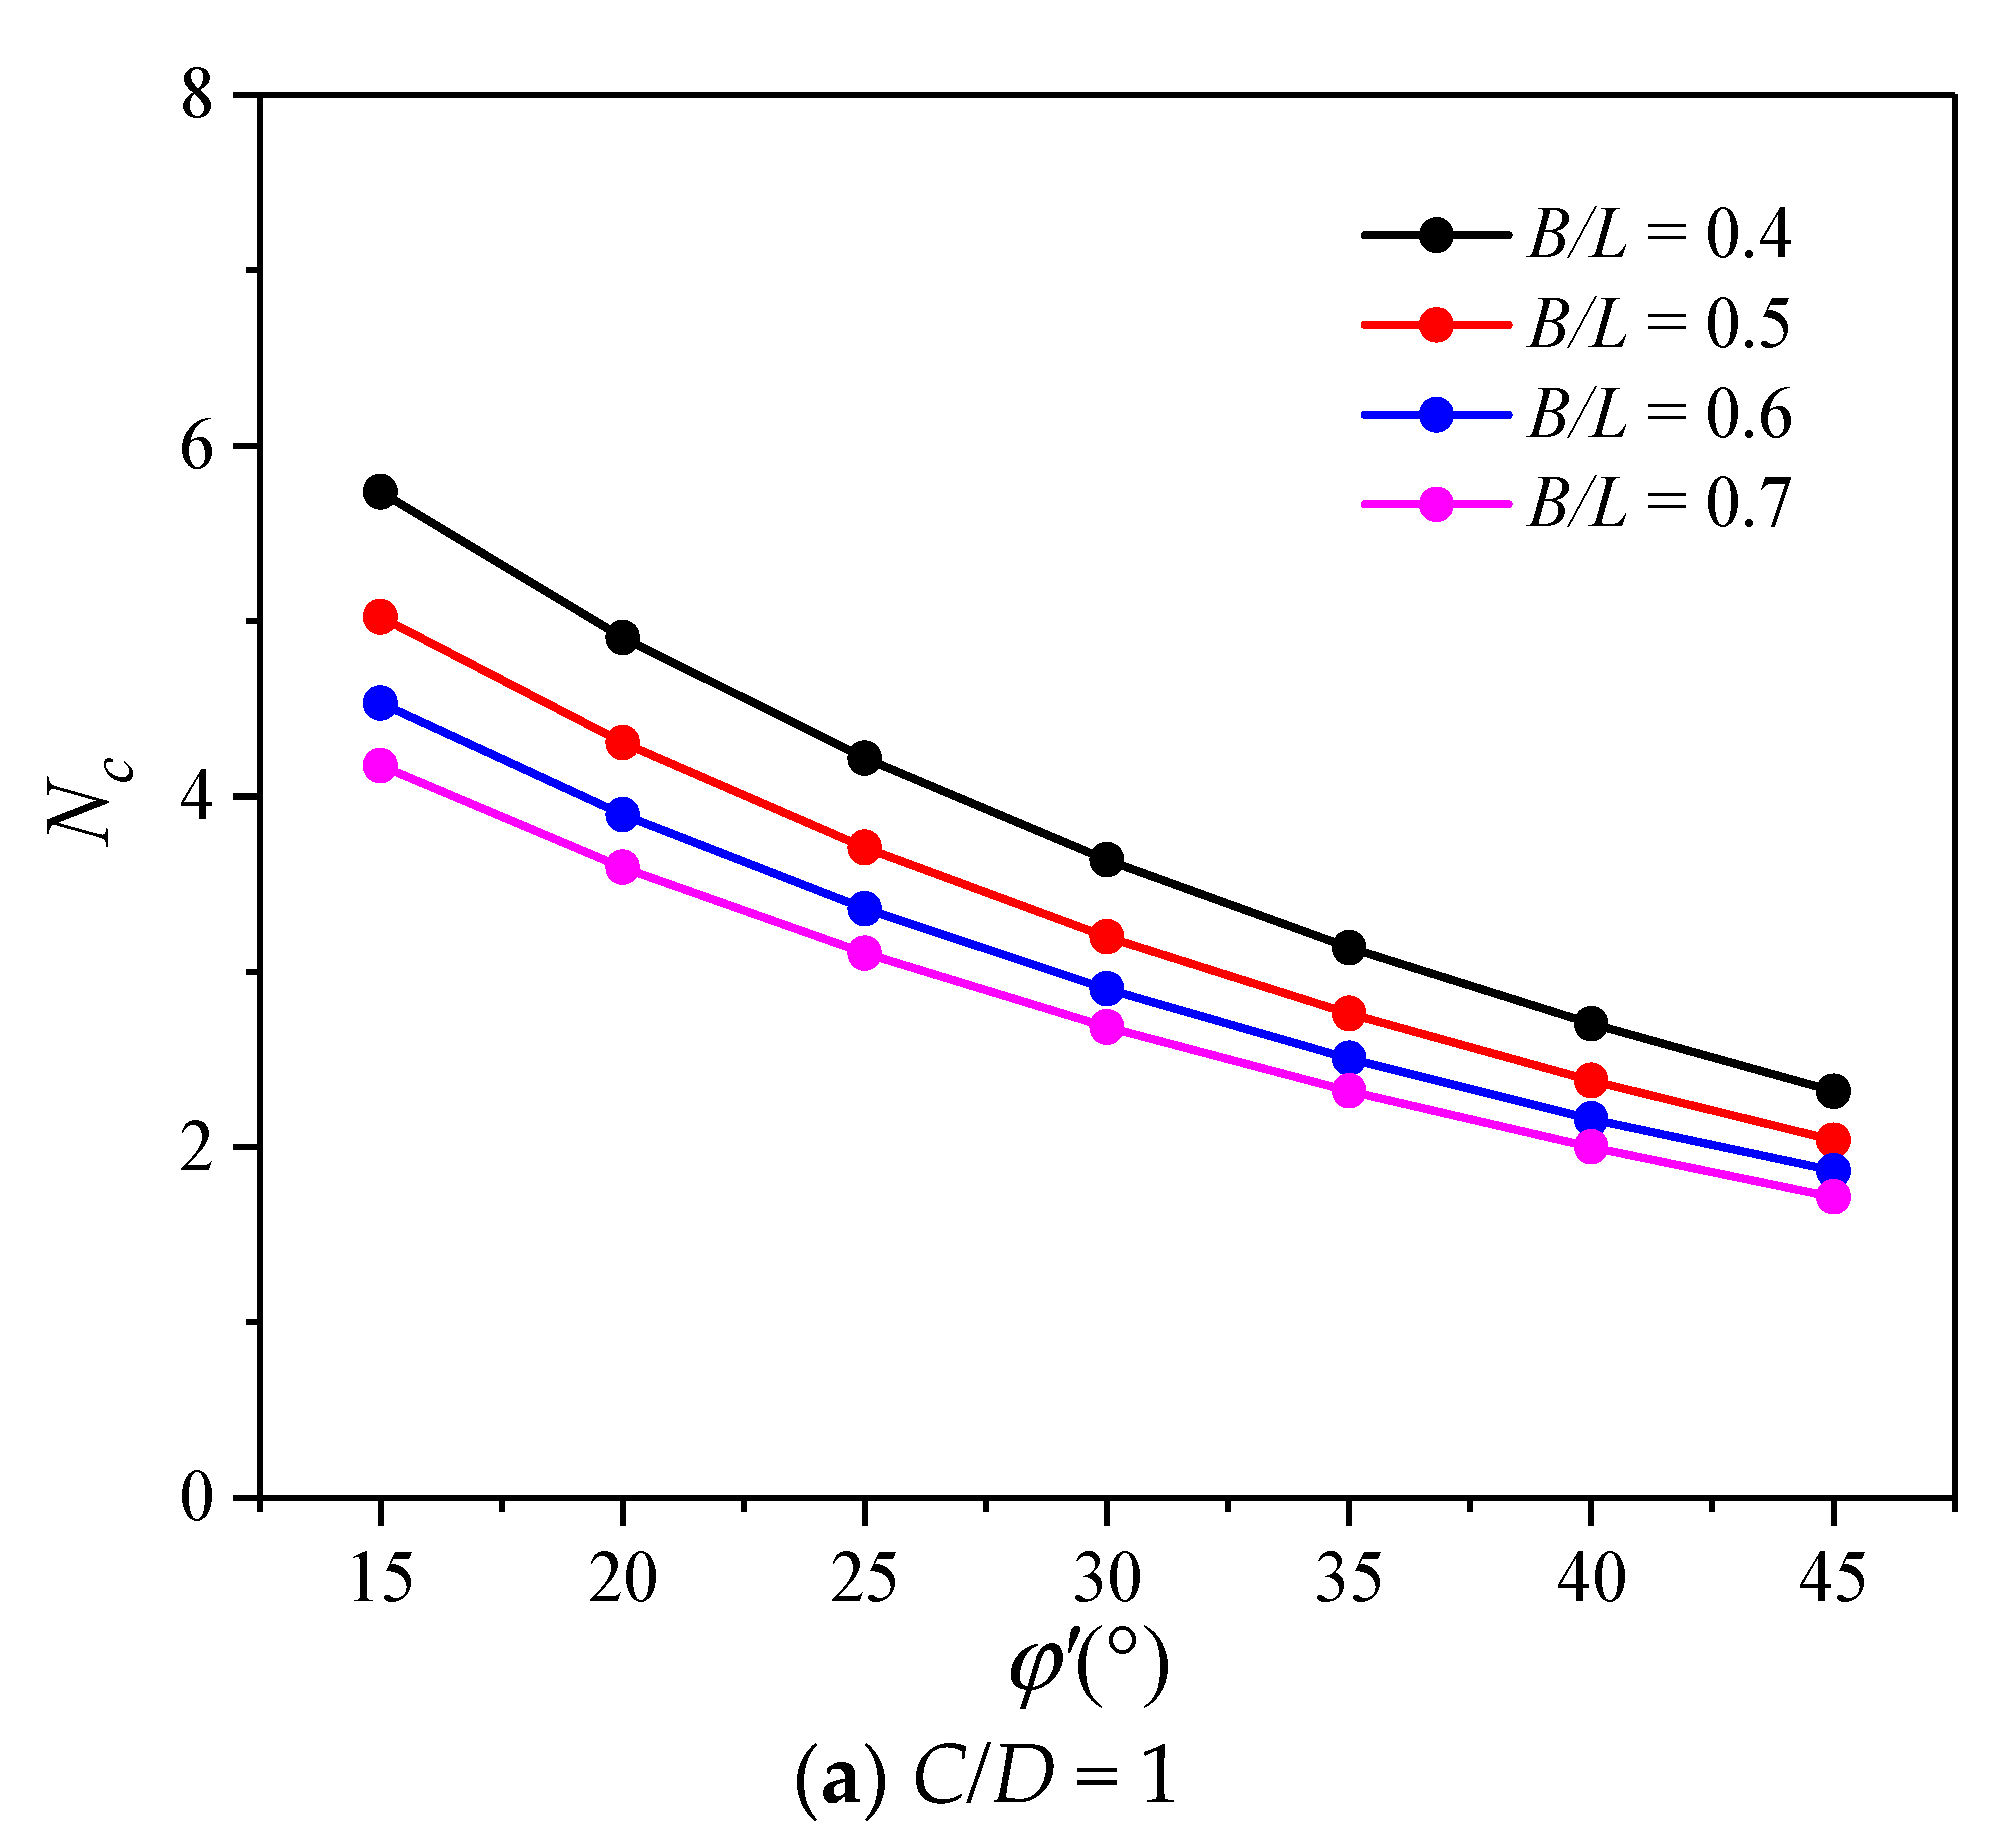
3.3. Parametric Analysis

In this part, a typical situation of D = 6 m and L / D = 2 is considered. The partially supported ratio B / L varies from 0.4 to 0.7. For shallowly buried tunnels, the depth ratio C / D varies from 1 to 2, and the total stress concept is accepted for calculating the soil stress. The soil weight was chosen as γ = 19.8   kN / m 3 . The frictional angle φ varies from 15° to 45°.
Figure 13 shows the variation in N γ depending on φ . For C / D = 1 (in Figure 13a), N γ decreases nonlinearly with an increasing φ . When φ < 30 ° , N γ increases with an increasing B / L at a constant φ , and they become close to each other when φ is between 30° and 35°. N γ decreases with an increasing B / L at a constant φ , which is less than 30°. In Figure 13b, similar variations in N γ at C / D = 2 can be observed. A comparison between Figure 13a and Figure 13b shows the influence of C / D on N γ . A higher C / D makes a higher coefficient N γ . Figure 14 shows the variations in N c depending on φ . For C / D = 1 (in Figure 14a), N c decreases nonlinearly with an increasing φ . As B / L becomes smaller, the change in N c becomes more pronounced. When φ is relatively small, the discrepancy between N c values associated with different B / L values becomes more significant. Figure 14b demonstrates a similar tendency of change in N c . A comparison between Figure 14a and Figure 14b shows that a higher C / D makes a higher a coefficient N c .
In this part, typical non-cohesive soil ( c / ( γ D ) = 0 ) is considered for the most adverse scenario. As a result, Equation (22) is simplified as s 2 = γ D N γ . Table 3 shows the variation in θ , α , and V depending on φ . V denotes the total volume of the wedge model, that is, the failure zone. V can be calculated by adding up the volumes of block I, II, and III, that is, V = 2 V 1 + V 2 . It can be seen that with an increasing φ , θ increases, while α and V decrease. In particular ( C / D = 1 , B / L = 0.4 ), as φ increases from 15° to 45°, θ increases from 55.9° to 71.0°, while α decreases from 48.5° to 29.8°, and V decreases from 117.1 m3 to 59.4 m3. The increase in θ indicates that the wedge slope becomes larger. The decrease in α indicates that the failure zone becomes smaller. Changes in θ and α both cause the volume of the failure zone to decrease. The decrease in V directly confirms the volume of failure zone decreases with an increasing φ . The reason is that the increase in φ means that the soil has a greater shear strength, and the greater the self-stabilizing capacity of the soil, the better it is for the tunnel face to sustain stability by itself. At a constant φ and C / D , the increasing B / L makes θ decrease, but α and V increase. In particular ( φ = 25 ° ), as B / L increases from 0.4 to 0.7, θ decreases from 61.7° to 59.4°, while α increases from 41.9° to 63.1°, and V increases from 92.9 m3 to 114.9 m3. In addition, at a constant φ and B / L , θ , α , and V remain virtually constant when C / D increases from 1 to 2. The failure zone is hardly affected by C / D .
In this part, typical non-cohesive soil ( c / ( γ D ) = 0 ) is considered. Figure 15 shows the variation in support pressure s 2 depending on the angle of internal friction φ . In Figure 15a ( C / D = 1 ), the proposed model predicts that s 2 decreases nonlinearly as φ increases, and changes gradually flatten out. The change in s 2 becomes more apparent with a higher B / L . The discrepancy between s 2 values associated with different B / L values becomes more significant at a lower φ . In Figure 15b ( C / D = 2 ), a similar variation in s 2 depending on φ can be seen. A comparison between Figure 15a and Figure 15b shows that a higher C / D makes a higher s 2 . This is because the higher the C / D , the greater the pressure of the overburden, and therefore, the more likely it is to slide unstably.
In Figure 16a ( C / D = 2 ), the proposed model predicts that s 2 / γ D decreases nonlinearly with an increasing φ . s 2 / γ D associated with a higher B / L has a larger variation. Compared to Figure 15b ( C / D = 2 ), due to s 2 = S 2 / B D (Equation (15)), the change in s 2 / γ D is related to B / L when γ D and L are constant. Thus, the variation in s 2 / γ D is different from that of S 2 depending on φ . Assuming that the S 2 associated with a lower B / L (assumed to be B 1 / L ) is named as S 2 | B 1 / L , the S 2 associated with B 2 / L ( B 2 > B 1 ) is named as S 2 | B 2 / L , named in the same way as s 2 / γ D | B 1 / L and s 2 / γ D | B 2 / L . A simple calculation ( s 2 = S 2 / B D ) leads to the conclusion that at a constant φ , when S 2 | B 2 / L > B 2 B 1 S 2 | B 1 / L , s 2 / γ D | B 2 / L > s 2 / γ D | B 1 / L . For example, two scenarios are shown in Figure 16b. The calculation about S 2 shows that when φ < 35 ° and S 2 | B 2 / L = 0.7 > 7 4 S 2 | B 1 / L = 0.4 (condition 1), s 2 / γ D | B 2 / L = 0.7 > s 2 / γ D | B 1 / L = 0.4 . The opposite (condition 2) happens when φ > 30 ° .

4. Conclusions

The large cross-section of the tunnel and the features of soil cutting and discharging caused by multiple cutter heads and screw conveyors tend to cause an uneven distribution of support pressure, which has the risk of instability. This study develops a theoretical model based on the limit equilibrium method for the stability analysis of a box tunnel face in non-cohesive soil. A parametric analysis for the proposed solution is performed. The proposed model is verified by the numerical model. The main conclusions can be summarized as follows:
(1) The obtained support pressure distribution on the working face was uneven, with a large support pressure on both sides and small one in the middle. Accordingly, the failure mechanism was composed of a prism (upper part) and a wedge (lower part), which were both divided into three blocks. The relatively small support force acting on the middle block (II) led to its tendency to slide and the risk of destabilization. The interaction forces between the blocks were obtained by force analysis. Assuming that the tunnel face was in the active failure limit state, the support pressure acting on block I was obtained using the active earth pressure coefficient; then, the support pressure acting on block II could be calculated by limit equilibrium analysis;
(2) The formula of the limit support pressure was obtained. The influences of the strength parameters and geometric parameters on the tunnel face stability were investigated in the parametric analysis. The limit support pressure rose with the increase in the partially supported ratio and the width–height ratio, and the pressure dropped greatly with the increasing internal friction angle;
(3) The applicability of the proposed model was verified by comparing it with the numerical model built in OptumG3. The results of the proposed model have a similar pattern of variation with that of the numerical model, showing that the proposed model agrees well with the numerical model. For projects using similar tunnel machines, the theoretical solution presented in this paper can predict the collapse geometry and provide valuable guidance for risk control.

Author Contributions

Conceptualization, M.Y. and W.L.; methodology, M.Y. and W.L.; software, B.W.; validation, M.Y. and B.W.; investigation, P.G.; writing—original draft preparation, M.Y.; writing—review and editing, W.L. and J.Y.; supervision, W.L. All authors have read and agreed to the published version of the manuscript.

Funding

This research was funded by the National Natural Science Foundation of China under grant number 51978430, Powerchina Huadong Engineering Corporation Limited (KY2019-ZD-02), the Key R&D Program of Zhejiang Province (2019C03111).

Institutional Review Board Statement

Not applicable.

Informed Consent Statement

Not applicable.

Data Availability Statement

The data presented in this study are available upon request from the corresponding authors.

Conflicts of Interest

The authors declare no conflict of interest.

Abbreviations

The following symbols are used in this paper:
D height of tunnel
L width of tunnel
C cover depth
B width of partially supported area
c effective cohesion
φ effective angle of internal friction
γ the total unit weight
σ s ground surcharge
S 1 support force acting on block I
S 2 support force acting on block II
θ wedge angle between slanted failure plane and the horizontal
K 0 lateral stress coefficient
K a active earth pressure coefficient
R ratio of the volume of the prism to its side area
N γ coefficient related to γ
N c coefficient related to c
κ dimensionless coefficient
ε dimensionless coefficient
ε + dimensionless coefficient

References

  1. Davis, E.H.; Gunn, M.J.; Mair, R.J.; Seneviratne, H.N. The stability of shallow tunnels and underground openings in cohesive material. Géotechnique 1980, 30, 397–416. [Google Scholar] [CrossRef]
  2. Leca, E.; Dormieux, L. Upper and lower bound solutions for the face stability of shallow circular tunnels in frictional material. Géotechnique 1990, 40, 581–606. [Google Scholar] [CrossRef] [Green Version]
  3. Soubra, A.H.; Regenass, P. Three-dimensional passive earth pressures by kinematical approach. J. Geotech. Geoenviron. 2000, 126, 969–978. [Google Scholar] [CrossRef] [Green Version]
  4. Mollon, G.; Dias, D.; Soubra, A.H. Face Stability Analysis of Circular Tunnels Driven by a Pressurized Shield. J. Geotech. Geoenviron. 2010, 136, 215–229. [Google Scholar] [CrossRef] [Green Version]
  5. Mollon, G.; Dias, D.; Soubra, A.H. Rotational failure mechanisms for the face stability analysis of tunnels driven by a pressurized shield. Int. J. Numer. Anal. Methods 2011, 35, 1363–1388. [Google Scholar] [CrossRef] [Green Version]
  6. Mollon, G.; Dias, D.; Soubra, A.H. Continuous velocity fields for collapse and blow-out of a pressurized tunnel face in purely cohesive soil. Int. J. Numer. Anal. Methods 2013, 37, 2061–2083. [Google Scholar] [CrossRef] [Green Version]
  7. Pan, Q.J.; Dias, D. Face Stability Analysis for a Shield-Driven Tunnel in Anisotropic and Nonhomogeneous Soils by the Kinematical Approach. Int. J. Geomech. 2015, 16, 04015076. [Google Scholar] [CrossRef]
  8. Pan, Q.J.; Dias, D. Upper-bound analysis on the face stability of a non-circular tunnel. Tunn. Undergr. Space Technol. 2017, 62, 96–102. [Google Scholar] [CrossRef]
  9. Pan, Q.J.; Dias, D. Three dimensional face stability of a tunnel in weak rock masses subjected to seepage forces. Tunn. Undergr. Space Technol. 2018, 71, 555–566. [Google Scholar] [CrossRef]
  10. Senent, S.; Yi, C.K.; Jimenez, R. An upper bound solution for tunnel face stability analysis considering the free span. Tunn. Undergr. Space Technol. 2020, 103, 103515. [Google Scholar] [CrossRef]
  11. Chen, G.H.; Zou, J.F.; Chen, J.Q. Shallow tunnel face stability considering pore water pressure in non-homogeneous and anisotropic soils. Comput. Geotech. 2019, 116, 103205. [Google Scholar] [CrossRef]
  12. Liu, W.; Shi, P.X.; Chen, L.J.; Tang, Q. Analytical analysis of working face passive stability during shield tunneling in frictional soils. Acta Geotech. 2020, 15, 781–794. [Google Scholar] [CrossRef]
  13. Liu, W.; Wu, B.; Shi, P.X.; Cai, G.Q. Upper bound analysis of working face passive failure in large-diameter shield tunneling based on a composite mechanism. Comput. Geotech. 2021, 138, 104362. [Google Scholar] [CrossRef]
  14. Liu, W.; Wu, B.; Shi, P.X.; Xu, X.Y. Analysis on face stability of rectangular cross-sectional shield tunneling based on an improved two-dimensional rotational mechanism. Acta Geotech. 2021, 16, 3725–3738. [Google Scholar] [CrossRef]
  15. Di, Q.G.; Li, P.F.; Zhang, M.J.; Wu, J. Influence of permeability anisotropy of seepage flow on the tunnel face stability. Undergr. Space 2022, 8, 1–14. [Google Scholar] [CrossRef]
  16. Jancsecz, S.; Steiner, W. Face support for a large mix-shield in heterogeneous ground conditions. In Proceedings of the Tunnelling 1994, London, UK, 5–7 July 1994; Springer: Boston, MA, USA, 1994; pp. 531–550. [Google Scholar]
  17. Broere, W. Tunnel Face Stability and New CPT Applications. Ph. D. Thesis, Delft University, Delft, The Netherlands, 2001. [Google Scholar]
  18. Anagnostou, G. The contribution of horizontal arching to tunnel face stability. Geotechnik 2012, 35, 34–44. [Google Scholar] [CrossRef]
  19. Xu, Y.J.; Liang, W.Z.; Liu, X.M.; Cui, G.Q.; Bai, X.G. Soil Mass Stability at the Working Face of a Rectangular Pipe-Jacking Tunnel with a Large Section. Mod. Tunn. Technol. 2017, 54, 70–85. (In Chinese) [Google Scholar]
  20. Cheng, C.; Zhao, W.; Cheng, C.N.; Li, F. Calculation on Active Limit Support Pressure of Shield Tunnel Excavation Face in Dry Cohesionless Soil. J. Northeast. Univ. (Nat. Sci.) 2018, 39, 1348–1352. (In Chinese) [Google Scholar]
  21. Yu, L.; Zhang, D.L.; Fang, Q.; Cao, L.Q.; Zhang, Y.; Xu, T. Face stability of shallow tunnelling in sandy soil considering unsupported length. Tunn. Undergr. Space Technol. 2020, 102, 103445. [Google Scholar] [CrossRef]
  22. Vu, M.N.; Broere, W.; Bosch, J. The impact of shallow cover on stability when tunnelling in soft soils. Tunn. Undergr. Space Technol. 2015, 50, 507–515. [Google Scholar] [CrossRef]
  23. Wei, G. Theoretical Study on Properties of Soil and Structure during Pipe Jacking Construction. Ph. D. Thesis, Zhejiang University, Hangzhou, China, 2005. [Google Scholar]
  24. Wei, G.; He, F. Calculation of minimal support pressure acting on shield face during pipe jacking in sandy soil. Chin. J. Undergr. Space Eng. 2007, 3, 903–908. (In Chinese) [Google Scholar]
  25. Sun, Z.Y.; Zhang, D.L.; Fang, Q.; Dui, G.S.; Tai, Q.M.; Sun, F.W. Analysis of the interaction between tunnel support and surrounding rock considering pre-reinforcement. Tunn. Undergr. Space Technol. 2021, 115, 104074. [Google Scholar] [CrossRef]
  26. Sun, Z.Y.; Zhang, D.L.; Fang, Q.; Dui, G.S.; Chu, Z.F. Analytical solutions for deep tunnels in strain-softening rocks modeled by different elastic strain definitions with the unified strength theory. Sci. China Technol. Sci. 2022, 65, 2503–2519. [Google Scholar] [CrossRef]
  27. Zhang, D.L.; Sun, Z.Y.; Fang, Q. Scientific problems and research proposals for Sichuan-Tibet railway tunnel construction. Tunn. Undergr. Space 2022, 7, 419–439. [Google Scholar] [CrossRef]
  28. Liu, W.; Shi, P.X.; Yu, M.; Jia, P.J. Analysis of working face stability during obstruction removal from a box tunnel machine. Acta Geotech. 2022, 17, 4627–4639. [Google Scholar] [CrossRef]
  29. Li, C.D.; Zhang, W.; Wang, X.M.; Pan, B.; Zhu, H.H.; Spencer, B.F. Modeling dynamic responses of a cross-river road shield tunnel under stochastic vehicle loads. Tunn. Undergr. Space Technol. 2020, 102, 103432. [Google Scholar] [CrossRef]
  30. Pang, R.; Xu, B.; Zhou, Y.; Song, L.F. Seismic time-history response and system reliability analysis of slopes considering uncertainty of multi-parameters and earthquake excitations. Comput. Geotech. 2021, 136, 104245. [Google Scholar] [CrossRef]
  31. Chambon, P.; Corte, J. Shallow Tunnels in Cohesionless Soil: Stability of Tunnel face. Int. J. Geotech. Eng. 1994, 120, 1148–1165. [Google Scholar] [CrossRef]
  32. Chen, R.P.; Li, J.; Kong, L.G.; Tang, L.J. Experimental study on face instability of shield tunnel in sand. Tunn. Undergr. Space Technol. 2013, 33, 12–21. [Google Scholar] [CrossRef]
  33. Chen, R.P.; Li, J.; Chen, Y.M.; Kong, L.G. Large-scale tests on face stability of shield tunnelling in dry cohesionless soil. Chin. J. Geotech. Eng. 2011, 33, 117–122. (In Chinese) [Google Scholar]
  34. Chen, R.P.; Qi, L.Z.; Tang, L.J.; Zhou, B.S. Study of limit supporting force of excavation face’s passive failure of shield tunnels in sand strata. Chin. J. Rock Mech. Eng. 2013, 32, 2877–2882. (In Chinese) [Google Scholar]
  35. Chen, R.P.; Tang, L.J.; Yin, X.S.; Chen, Y.M.; Bian, X.C. An improved 3D wedge-prism model for the face stability analysis of the shield tunnel in cohesionless soils. Acta Geotech. 2015, 10, 683–692. [Google Scholar] [CrossRef]
  36. Wong, K.S.; Ng, C.W.W.; Chen, Y.M.; Bian, X.C. Centrifuge and numerical investigation of passive failure of tunnel face in sand. Tunn. Undergr. Space Technol. 2012, 28, 297–303. [Google Scholar] [CrossRef]
  37. Ng, C.W.W.; Wong, K.S. Investigation of passive failure and deformation mechanisms due to tunnelling in clay. Can. Geotech. J. 2013, 50, 359–372. [Google Scholar] [CrossRef]
  38. Pan, Q.J.; Dias, D. The effect of pore water pressure on tunnel face stability. Int. J. Numer. Anal. Methods 2016, 40, 2123–2136. [Google Scholar] [CrossRef]
  39. Liu, W.; Zhao, Y.; Shi, P.X.; Li, J.Y.; Gan, P.L. Face stability analysis of shield driven tunnels shallowly buried in dry sand using 1 g large-scale model tests. Acta Geotech. 2018, 13, 693–705. [Google Scholar] [CrossRef]
  40. Lu, X.L.; Zeng, S.; Zhao, Y.C.; Huang, M.S.; Ma, S.K.; Zhang, Z.G. Physical model tests and discrete element simulation of shield tunnel face stability in anisotropic granular media. Acta Geotech. 2020, 15, 3017–3026. [Google Scholar] [CrossRef]
  41. Lin, Q.T.; Lu, D.C.; Lei, C.M.; Tian, Y.; Gong, Q.M.; Du, X.L. Model test study on the stability of cobble strata during shield under-crossing. Tunn. Undergr. Space Technol. 2021, 110, 103807. [Google Scholar] [CrossRef]
  42. Zheng, H.B.; Li, P.F.; Ma, G.W.; Zhang, Q.B. Experimental investigation of mechanical characteristics for linings of twins tunnels with asymmetric cross-section. Tunn. Undergr. Space Technol. 2021, 119, 104209. [Google Scholar] [CrossRef]
  43. Sun, Z.Y.; Zhang, D.L.; Li, A.; Lu, .S.; Tai, Q.M.; Chu, Z.F. Model test and numerical analysis for the face failure mechanism of large cross-section tunnels under different ground conditions. Tunn. Undergr. Space Technol. 2022, 130, 104735. [Google Scholar] [CrossRef]
Figure 1. Typical box tunneling machine with multiple cutter heads and double-screw conveyors.
Applsci 12 12360 g001aApplsci 12 12360 g001b
Figure 2. Distribution characteristics of support pressure.
Applsci 12 12360 g002
Figure 3. Profile of box tunneling.
Applsci 12 12360 g003
Figure 4. Modified model.
Applsci 12 12360 g004
Figure 5. The forces applied on block I.
Applsci 12 12360 g005
Figure 6. Forces applied on block II.
Applsci 12 12360 g006
Figure 7. Geometry of the numerical model built in OptumG3.
Applsci 12 12360 g007
Figure 8. Variations in s 2 / γ D depending on φ .
Applsci 12 12360 g008
Figure 9. Variation in S 2 depending on B / L at typical φ = 25 °   ,   L / D = 2 .
Applsci 12 12360 g009
Figure 10. Variations in s 2 / γ D depending on φ at typical φ = 25 ° .
Applsci 12 12360 g010
Figure 11. Variations in s 2 / s 1 depending on B / L at typical φ = 25 ° .
Applsci 12 12360 g011
Figure 12. Comparison of failure geometries obtained with the proposed mechanism and with the numerical model for different strength parameters.
Applsci 12 12360 g012
Figure 13. Variations in N γ depending on φ .
Applsci 12 12360 g013
Figure 14. Variations in N c depending on φ .
Applsci 12 12360 g014aApplsci 12 12360 g014b
Figure 15. Variations in S 2 depending on φ .
Applsci 12 12360 g015aApplsci 12 12360 g015b
Figure 16. Variations in s 2 / γ D depending on φ .
Applsci 12 12360 g016
Table 1. Parameters for numerical modeling.
γ /kN/m3E/MPavc’/kPa φ
19.8300.25015~45
Table 2. Variations in s 2 / s 1 depending on φ .
C/D = 1, L/D = 2
φ s 2 / s 1 ( Proposed   Model ) s 2 / s 1 ( Numerical   Model )
B/L = 0.5B/L = 0.6B/L = 0.7B/L = 0.5B/L = 0.6B/L = 0.7
150.6090.6270.6420.5040.5390.563
250.4890.5020.5120.3420.3690.387
350.4510.4480.4480.2720.2910.305
450.4750.4520.4370.2350.2510.263
C/D = 2, L/D = 2
φ s 2 / s 1 (Proposed Model) s 2 / s 1 (Numerical Model)
B/L = 0.5B/L = 0.6B/L = 0.7B/L = 0.5B/L = 0.6B/L = 0.7
150.3950.4200.4410.3220.3500.372
250.2570.2700.2810.2040.2200.234
350.2230.2160.2140.1640.1760.184
450.2540.2250.2060.1380.1520.159
Table 3. Variations in the optimal θ , α , and V depending on φ .
φ B/L = 0.4B/L = 0.7
θ α V /m3 θ α V /m3
1555.948.5117.153.468.0144.5
2058.9945.1104.256.565.6128. 8
2561.741.992.959.463.1114.9
3064.338. 783.062.260.4102.5
3566.735.674.364.857.591.5
4069.032.766.567.254.581.6
4571.029.859.469.551.272.6
C/D = 2, L/D = 2
φ B/L= 0.4B/L= 0.7
θ α V /m3 θ α V /m3
1555.748.6117.751.669.3154.2
2059.544.5101.855.666.3132.9
2562.840.688.859.463.1115.0
3065.737.078.162.859.799.9
3568.233.769.165.856.287.3
4070.430.761.468.552.776.6
4572.427.954.870.849.267.6
Publisher’s Note: MDPI stays neutral with regard to jurisdictional claims in published maps and institutional affiliations.

