Article

Natural Radioactivity in Soil and Radiological Risk Assessment in Lișava Uranium Mining Sector, Banat Mountains, Romania

1
Radiometry Laboratory, Geological Institute of Romania, 1 Caransebes st., RO 012271 Bucharest, Romania
2
Institute of Geodynamics “Sabba S. Ștefănescu”, Romanian Academy, RO 020032 Bucharest, Romania
*
Author to whom correspondence should be addressed.
Appl. Sci. 2022, 12(23), 12363; https://doi.org/10.3390/app122312363
Submission received: 15 November 2022 / Revised: 26 November 2022 / Accepted: 29 November 2022 / Published: 2 December 2022
(This article belongs to the Section Environmental Sciences)

Abstract

:
The specific activity and spatial distribution of 238U, 232Th and 40K were determined in the surface soil from the Lișava uranium mining sector. This sector belongs to the Banat district, an historically important uranium mining area in Romania (an area with closed uranium mines and a radioactive waste dump). Gamma-ray spectrometry using a high-purity germanium (HPGe) detector was used to measure the activity of naturally occurring radionuclides in the soil. The average specific activities of 238U, 232Th and 40K in the soil were 197.21 Bq/kg for 238U, 16.21 Bq/kg for 232Th and 543.21 Bq/kg for 40K. The mineral contents of selected waste rock samples (sandstones) were examined using a scanning electron microscope (SEM), which revealed that brannerite, pitchblende and coffinite were the most important uranium-bearing minerals. The means of the radiological hazard parameters were calculated to be 262.22 Bq/kg radium equivalent activity (Raeq), 123.72 nGy/h absorbed gamma dose rates (DR), 0.7 external hazard index (Hex) and 1.8 representative level index (RLI). The spatial distribution of the risk assessment indices associated with the investigated soils exceeded the median values provided by UNSCEAR and reflected the geological settings and influences of anthropic activities such as uranium mining practices and the tipping of radioactive mining waste.

1. Introduction

Uranium mining practices usually result in an increase in radionuclide concentrations in the environment, which can lead to increased radiation exposure for the population [1]. Compared to radioactive waste from nuclear power plants, waste from uranium mining activities is characterized by a significantly lower level of radioactivity, but in the case of large volumes of naturally radioactive waste, an increase in the risk of radiation exposure for the local population can occur [2]. This type of waste is generally described as a mixture of host rocks and mineralized rocks that are uneconomic [2,3].
The occurring radionuclides present in all types of rocks, soils, waters and air in uranium mining perimeters consist mainly of the natural radioactive decay series of 238U, 232Th and 40K [4,5,6]. The distribution of and variation in radionuclides in surface soil depend on the composition and distribution of radioelements in the bedrock and their physical and mechanical properties (porosity, permeability) [7]. Likewise, the concentrations of natural radioactive elements in soils depend on additional factors such as the stability of the primary radioactive-material-bearing minerals to weathering, the presence of a clay phase, the organic matter content and the physico-chemical characteristics of the soils, as well as the specific geochemical characteristics of uranium, thorium and potassium [4,5,8].
Uranium is a lithophilic metallic element with an average abundance of about 2.7 ppm in the upper continental crust [9]. Like uranium, thorium is a rare element and is the most abundant heavy element, with a continental crustal abundance of 10.5 ppm [9]. In igneous rocks, uranium appears as U4+ with crystallochemical properties similar to Th4+ and the light rare earth elements. Under endogenic conditions, both parental radioactive elements (U4+ and Th4+) crystallize together as late products of magmatic differentiation and are always concentrated in acidic rocks as accessory minerals. Under exogenic conditions, the chemical properties of uranium and thorium are markedly different. Uranium has a high geochemical mobility; it is oxidized easily from its tetravalent state to its hexavalent state [9,10,11]. Under these circumstances, uranium can be oxidized to uranyl, which is very soluble and easily transportable in groundwater and surface waters. Compared to uranium, thorium cannot be oxidized up to the hexavalent state and therefore has no analogue of the uranyl ion; any amount of thorium dissolved is adsorbed and precipitated as a hydrolyzed ion due to the potential of the tetravalent ions of thorium [10,11].
Uranium is a substantial component of several minerals, the most notable of which are uraninite, brannerite and carnotite. Thorium may be found in a variety of minerals, including thorite and thorianite [12]. Both elements (thorium and uranium) coexist in accessory minerals such as zircon, monazite, apatite, allanite and titanite, which are found in igneous and metamorphic rocks, with zircon and monazite being the most resistant to weathering. Uranium may also combine in complex ways with organic materials and phosphate materials [13].
Potassium-40 is a naturally occurring radioactive potassium isotope that is found in trace amounts in all potassium-bearing minerals. Under normal conditions, potassium is a volatile lithophilic metal that is monovalent and has an average concentration of 2.8% in the upper continental crust [9]. Potassium is found in metamorphic and magmatic rocks as a major element of the feldspar mineral series, feldspathoids and micas. In sedimentary rocks, potassium can usually be found in sedimentary rocks due to their content in alkali and plagioclase feldspars [10].
Several natural occurrences and deposits of radioactive mineral ores with a high uranium content are known in Romania. Uranium deposits have been reported in: (i) the Eastern Carpathians as vein-type U deposits hosted in metamorphic rocks [14]; (ii) the Apuseni Mountains (western Romania) as sandstone deposits (such as the Băița Bihor deposit) hosted in Permian sandstone and as a vein-type deposit (such as the Avram Iancu deposit) found in the carbonatic horizon of metamorphic sequences (crystalline schists) belonging to the Biharia unit [14]; and (iii) the Banat mountains with, predominantly, sandstone U-type deposits (Ciudanovița, Natra and Dobrei South) hosted in Permian sedimentary rocks (sandstones, conglomerates and shales) [14].
In Romania, uranium ore has been exploited since the 1950s. In the Banat Mountains, the mining activity started in the Ciudanovița sector (Ciudanovița and Natra deposits) in 1952–1953. The Ciudanovița uranium ore was mined by Sovrom and exported to the USSR for ore processing until 1964. Mining activity at Natra started in 1962 and was suspended in 1988 due to the depletion of the ore deposit. In the Lișava sector (Dobrei North, Dobrei East and Dobrei South ore deposits), mining opened in 1962 at Dobrei South and Natra and in 1978 at the Dobrei North deposit. Mining activity ceased in 1999, followed by a partial process of reconstruction and rehabilitation [15,16].
More than 40 years of prospecting and mining have generated heavily contaminated soil surfaces and numerous waste dumps that include sterile rocks and low-grade ore dumps (economically unprofitable) resulting from radiometric separation [16,17]. However, even though these represent an environmental problem, there is a lack of data regarding the potential impact of radioactivity and the host of radioactive elements. This study was the first to determine the specific activity of 238U, 232Th and 40K in the surface soil sampled from the Lișava uranium mining sector and was the first to identify the source of these radionuclides in areas of increased radioactivity. Furthermore, radiological risk parameters such as radium equivalent activity (Raeq), external hazard index (Hex), gamma absorbed dose rates (DR) and gamma representative level index (RLI) were calculated to assess the external exposure. Thus, this study will be a reference point for future environmental studies dealing with radiologic risk assessments and background radiation in the region.

2. Materials and Methods

2.1. Study Area and Sampling

The Lișava uranium mining sector is located about 5 km south Ciudanovița, in the western margin of the Anina Mountain part of the Banat Mountains (southwestern Romania). In the area of interest (45°06′20″ N; 21°03′33″ E), the exploration and mining of uranium ore was undertaken using galleries from the Dobrei North, Dobrei South and Dobrei East deposits. Mining activities were stopped in 1999, and the area has been partly rehabilitated [17]. The perimeter included the Lișava tailing dump, formed from the tailings deposited from the mines mentioned above, and the zone where ore was picked up and transported to the processing plant (Figure 1).
From a geological perspective, the Lișava sector belongs to the west Banat region in the southern Carpathians and is part of the Alpine orogenic belt. The regional lithostratigraphic formations are, from the oldest to the newest: a Proterozoic layer, represented by crystalline schists, followed by Carboniferous formations consisting of grey conglomerate layers, sandy layers and organic-rich black shales, sandstone and siltstone [19]. Overlying the Carboniferous layer are Permian formations made up of the Lower Permian (sandstone, siltstone and shale) and Upper Permian (Ciudanovița Series) that hosts uranium deposits, comprising conglomerate, bituminous sandstone, sandstone, siltstone and carbonaceous shale deposited in five cycles. The uppermost formations are Jurassic layers composed of grey limestones and marls lying over conglomerates, as shown in Figure 1A.
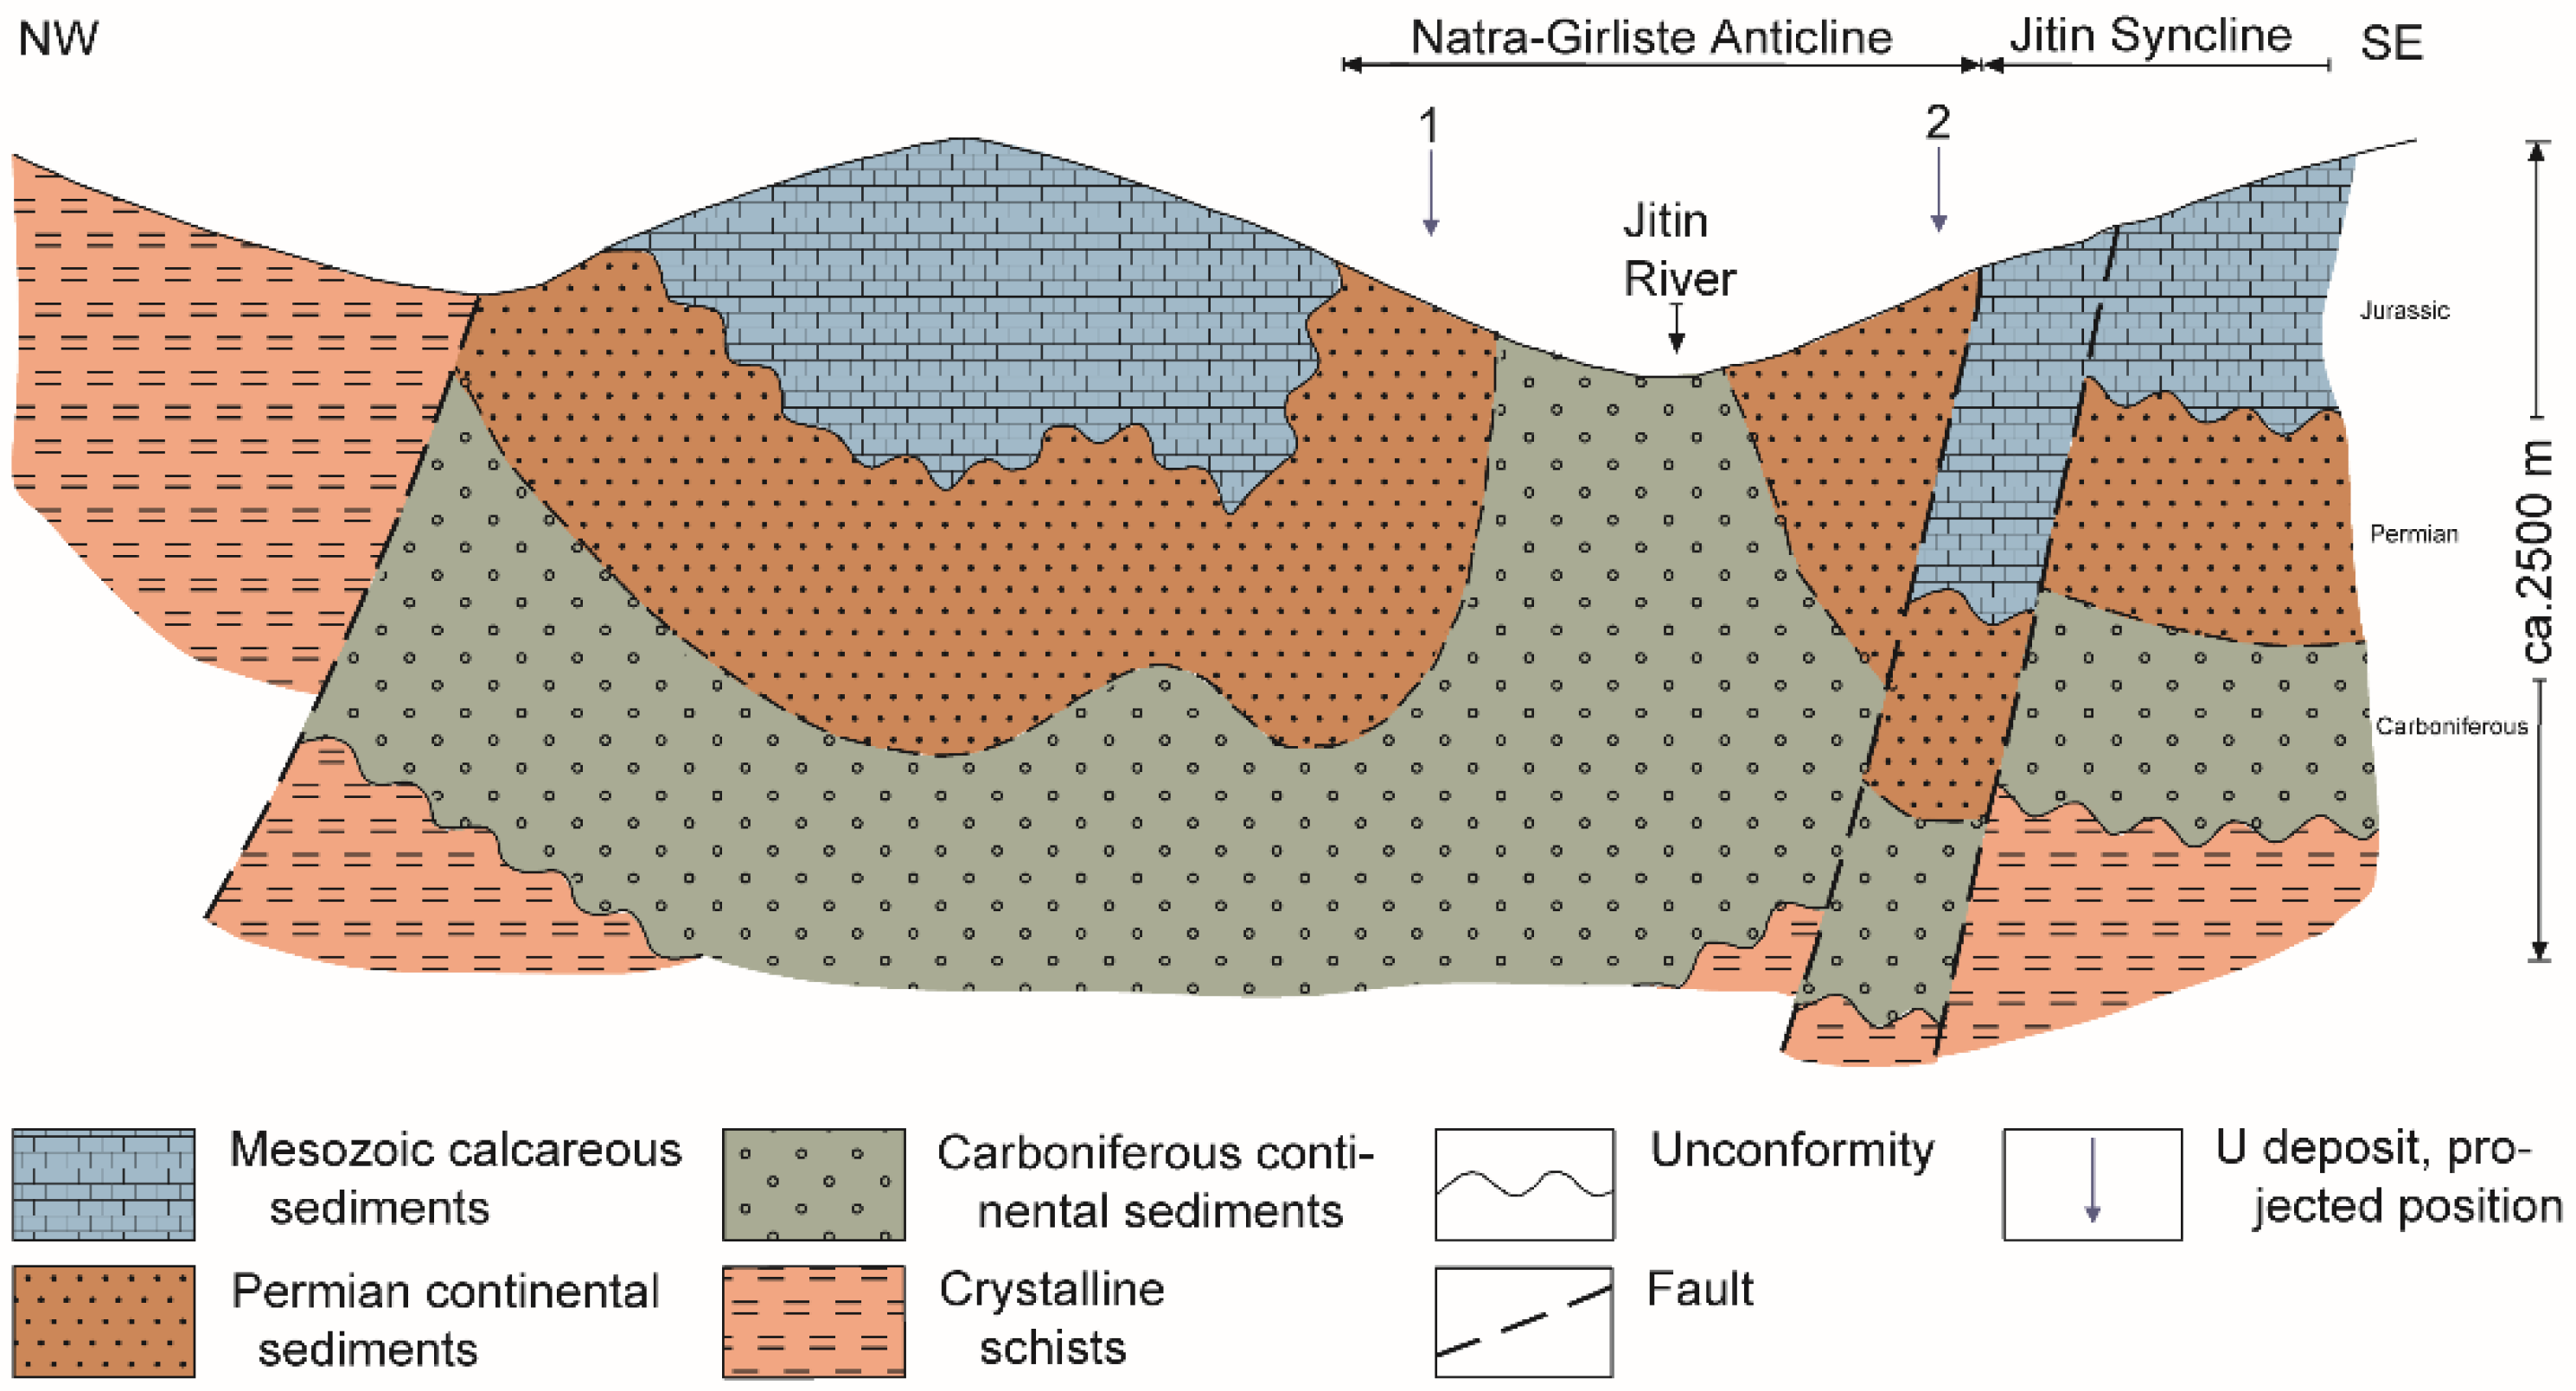
The Ciudanovița sedimentation cycle has 30–40 m thick hosted uranium deposits in the western and eastern flank of the Natra-Gîrliște Anticline (Figure 2). The Ciudanovița Series have five sequences in the eastern part of the Natra-Gîrliște Anticline. Each rhythm is between 20 and 200 m thick and begins from the bottom to the top with conglomerate, ending with fine-grained facies, which are predominantly siltstone. Three out of the five cycles contain uranium, and every cycle comprises cross-bedded microconglomerates, gritstone, sandstone and bituminous siltstone of an alluvial and lacustrine–alluvial origin. Intercalated with uraniferous-bearing cycles, barren rocks represented by well-sorted conglomerate and sandstone derived from extrusive igneous rock occur [19,20,21].
The dump material is a mixture of sterile rock and fragments of mineralized rock represented by red sandstones and reddish or grey microconglomerates that incorporate uneconomic small amounts of uranium. The waste deposit is compacted and covered by a layer of surface soil overgrown with vegetation that has grown spontaneously on the entire surface of the waste dump, which is more developed in the western part of the dump.
The soil samples were collected from 47 sampling points that were uniformly distributed over the whole surface of the Lișava uranium mining sector. The sampling point locations are presented in Figure 1B. Soil sampling was conducted by manually boring holes with a diameter of 55 mm drilling at a depth range of 0–15 cm. At each point, five samples were collected from the corners and center of a square with ten-meter sides. The permanent grass cover was excluded. After collection, the samples were mixed, resulting in one composite sample weighing about 1.5 kg, and placed into a plastic bag.
Together with the soil samples, three mineralized rock samples from the dump material were collected. The rock samples were selected based on dose rate measurements in air using a radiation survey meter (Berthold 137 UMO 137). The samples collected were red sandstones (Figure 3).

2.2. Sample Preparation

Samples were dried at 105 °C and sieved using a Teflon sieve with a 0.63 mm mesh [22]. The 0.63 mm fraction was quartered and homogenized in a mill to a grain size below 0.15 mm. Each dry soil sample weighing 300 g was stored in a plastic container with a threaded cap fitting (Marinelli type) for 30 days, i.e., the period required to reach a perfect equilibrium between parent and daughter in the 238U and 232Th series. [23].
In order to evaluate the morphology and structure and to identify the uranium minerals, eight polished sections were prepared from the collected waste rocks.

2.3. Analytical Techniques

The soil samples were analyzed non-destructively using a gamma-ray spectrometry methodology with a high-purity germanium (HPGe) detector connected to digital multichannel analyzer (MCA) with 16,684 channels (ORTEC) [24,25]. The relative efficiency of the HPGe detector was 26%, and the energy resolution for 60Co was 1.80 keV and was 0.800 keV for 57Co. A cylindrical lead shield with a wall thickness of 10 cm protected the detector from background radiation. Each soil sample was counted for 70,000 s. The detection energy of the HPGe detector was calibrated using certified sources of 152Eu, 137Cs and 60Co. The IAEA reference materials RGU_1, RGTh_1 and RGK_1 were used to calibrate the efficiency of the HPGe detector. The size and geometry of the reference samples were identical to those of the analyzed samples. Gamma energy lines used in the activity calculations in the 238U series were 352 and 295 keV for 214Pb, 609 and 1120 keV for 214Bi and 186 keV for 226Ra. The γ-lines of 338.4 and 911.2 keV for 228Ac, 727 keV for 212Bi and 860 keV for 208Tl were used to calculate the activity for 232Th. 40K activity was calculated based on its emission at 1460 keV [24,25].
Mineralogical analyses of the polished sections were performed using a tabletop Hitachi TM 3030SEM scanning electron microscope with energy dispersive spectroscopy (SEM-EDS) operating at an acceleration voltage of 15 kV. Elemental analysis (identification and quantification of elemental composition) was conducted using a QUANTAX 70 EDS system from Bruker [26].

2.4. Radiogical Parameters

In order to assess the radiological risk in the study area, the following radiological parameters were calculated: radium equivalent activity (Raeq), absorbed gamma dose rate (DR), external hazard index (Hex) and representative level index (RLI). The calculation of hazard indexes was based on the specific activities of uranium, thorium and potassium measured in the soil samples, and the equations used are presented in Table 1.

2.5. Statistical Analysis and Mapping

Statistical analyses were performed using the SPSS software, version 17. All individual variables were estimated in terms of minimum, maximum, standard deviation (SD), skewness and kurtosis. The correlation analysis was based on Pearson’s coefficients and the spatial distribution maps for the natural radionuclides and radiological hazard indexes were built using the inverse-distance weighting (IDW) interpolation method, generated in ArcGIS software, version 10.2.

3. Results and Discussion

3.1. The Activity Concentrations of Naturally Occurring Radionuclides (238U, 232Th and 40K) in Soil

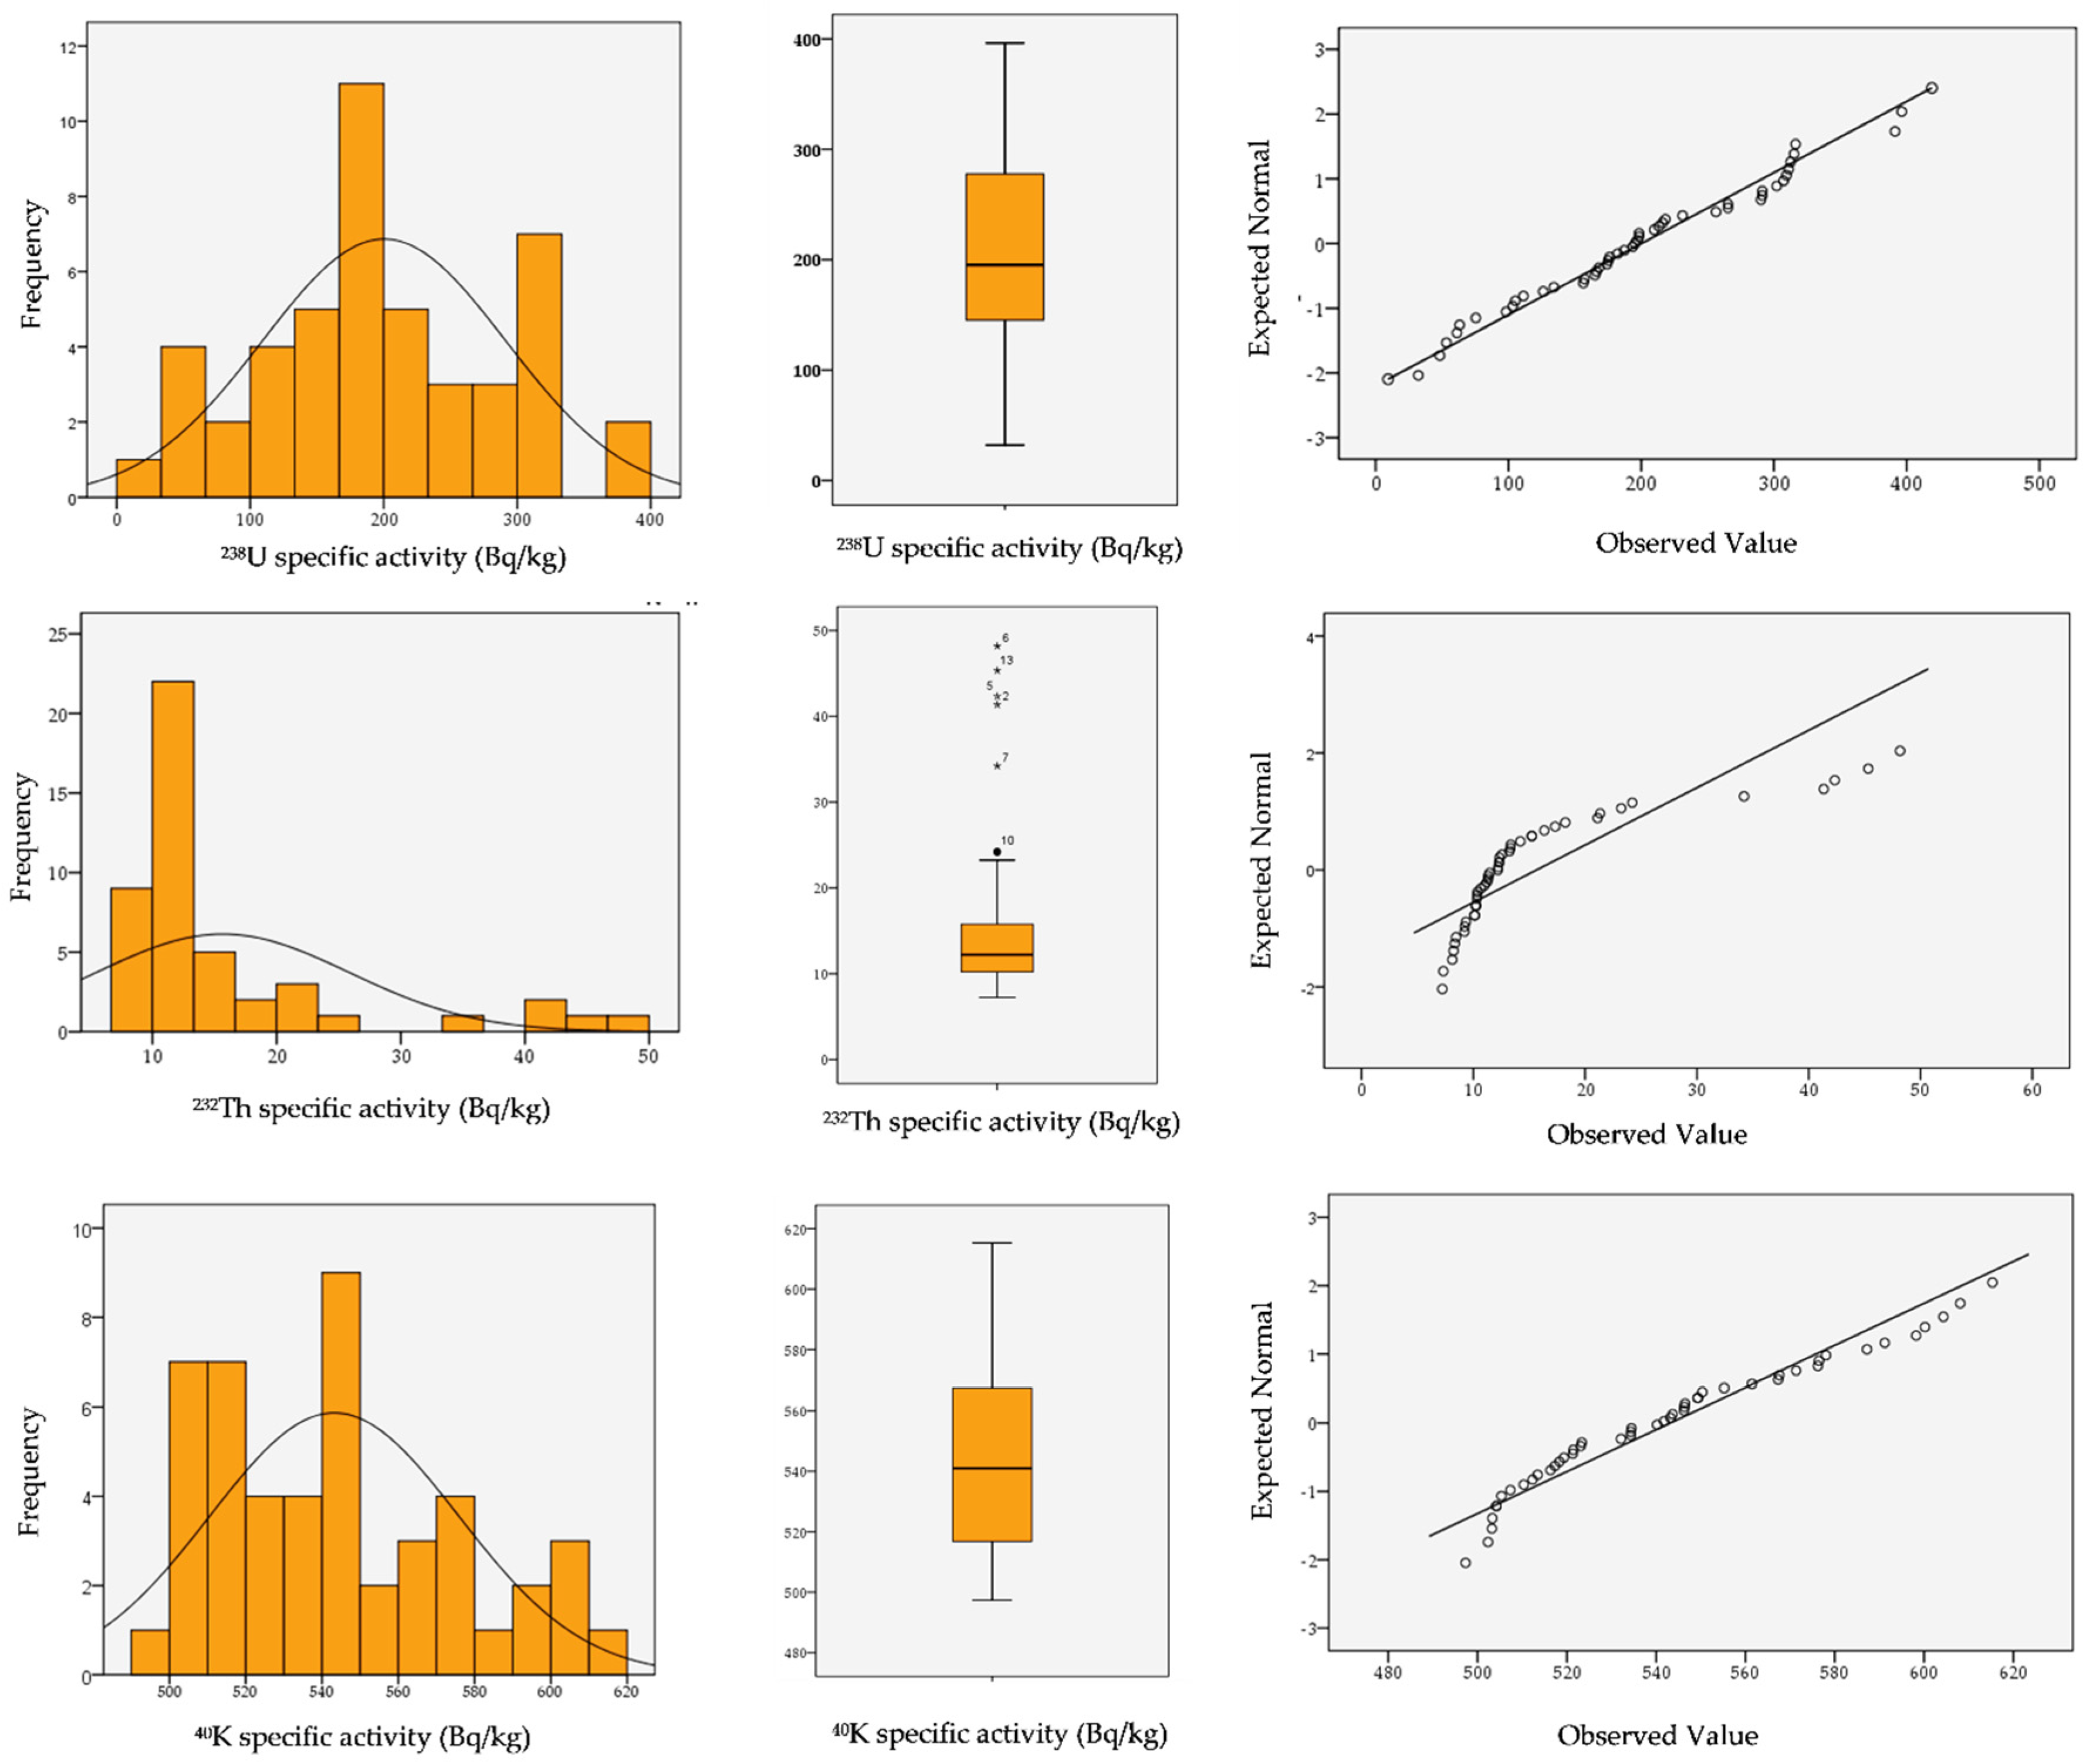
The statistical parameters for the specific activity of 238U, 232Th and 40K in the collected samples from the Lișava uranium mining sector are presented in Table 2. Appendix A shows the individual results of the gamma spectroscopy of the analyzed soil samples from the study area. The specific activity or activity concentration (activity per unit mass) is expressed in Bq/kg of radionuclides in soil, and the conversions recommended between Bq/kg and ppm are: 1 ppm U = 12.35 Bq/kg, 1 ppm Th = 4.06 Bq/kg and 1% K = 313 Bq/kg [10]. The histograms, Q–Q plots and box plots for these elements are presented in Figure 4. The frequency distribution charts were used to assess the normality distribution of the 238U, 232Th and 40K data sets, and the patterns displayed were multimodal for 234U and 40K and unimodal for 232Th. The fitting curves in the histograms show that the distribution was asymmetrical; they were skewed towards the right for all three elements, but the skewness was more significant for thorium compared to uranium and potassium (the distribution’s peak is off center toward the limit, and a tail stretches away from it to the right). The Q–Q plots confirmed the asymmetric distribution for 238U, 232Th and 40K, with the actual data shown on the x-axis and the predicted values for a normal distribution shown on the y-axis. The concavity in the plots denote the lognormal distribution, with low and high values placed below the regression line. The box plots depict the average, minimum and maximum values of the data sets for 238U, 232Th and 40K.
The specific activity of naturally occurring radionuclides varied significantly in the studied area due to the geological features and human activity (uranium mining practices). In all the soil samples, the specific activities were in the following order: 40K > 238U > 232Th.
The activity concentration of 238U in all the soil samples showed the biggest variation, ranging from 32.12 to 396.23 Bq/kg with a mean concentration of 197.21 Bq/kg. The calculated statistical parameters (Table 2) and graphic representations for 238U (Figure 4) indicated a large variation in uranium in the soil and suggested a spatially inhomogeneous distribution. The standard deviation (SD) value for 238U was relatively high (92.49 Bq/kg) and indicated an asymmetric distribution of the 238U in the investigated surface soils.
The skewness had a positive value, which revealed a positive asymmetry to the right for uranium, whereas the kurtosis parameter had a negative value. The 238U histogram pointed to a frequency of the activity concentration class between 170 and 200 Bq/kg followed by those with concentrations slightly above 300 Bq/kg. The elevated 238U concentration and high variation in the soil reflected the long history of uranium mining practices in the area, such as the exploitation and exploration of uranium ore in the galleries, the dumping of mine tailings and the temporary storage of uranium ore before transport to a processing plant.
The activity concentration of 232Th in all the soil samples from the Lișava area ranged within relatively narrow limits from 7.23 to 48.16 Bq/kg with a mean concentration of 16.21 Bq/kg. The 232Th analyses displayed an asymmetric distribution, although the variations in the specific activities of 232Th were relatively low. The statistical parameters calculated for 232Th showed moderate variation. The box plot and normal Q–Q plot diagrams highlighted outlier values in the soil samples with 2, 5, 6 and 13 IDs. These sampling points were located at the extremities of the study area, where the anthropic influence of uranium mining was decreased and reflected the natural background of thorium content in the soil. The samples with higher 238U specific activities exhibited low 232Th specific activities, sometimes being below the average reported for the crustal abundance of 10.5 ppm [9].
The potassium specific activities varied from 497.32 to 615.32 Bq/kg as a result of the lithological features in the investigated perimeter with a mean specific activity of 543.21 Bq/kg. Like 238U, the descriptive statistics for 40K (Table 2 and Figure 4) showed wide variations in terms of specific activity and an asymmetric distribution of content values.
The average specific activities of 238U, 232Th and 40K found in the analyzed soils are presented in Table 3 alongside the data reported in similar studies. This data showed that thorium and potassium presented lower or comparable averages of specific activity compared with the reference data, while uranium showed a specific activity average that was much higher (197.21 Bq/kg). All the average values of 238U calculated in the present study were comparable to the values reported for soils around uranium waste deposits from the Crucea ore deposit in Romania (559.7 Bq/kg) and the averages found in the soils around a former uranium mine in Gabrovnica, Serbia (249 Bq/kg) [32,33]. This comparison showed that the natural radioactivity in the surface soil from the Lisava uranium mining sector was higher as a result of uranium mining.

3.2. Spatial Distribution of 238U, 232Th and 40K in Soil from Lișava Uranium Mining Sector

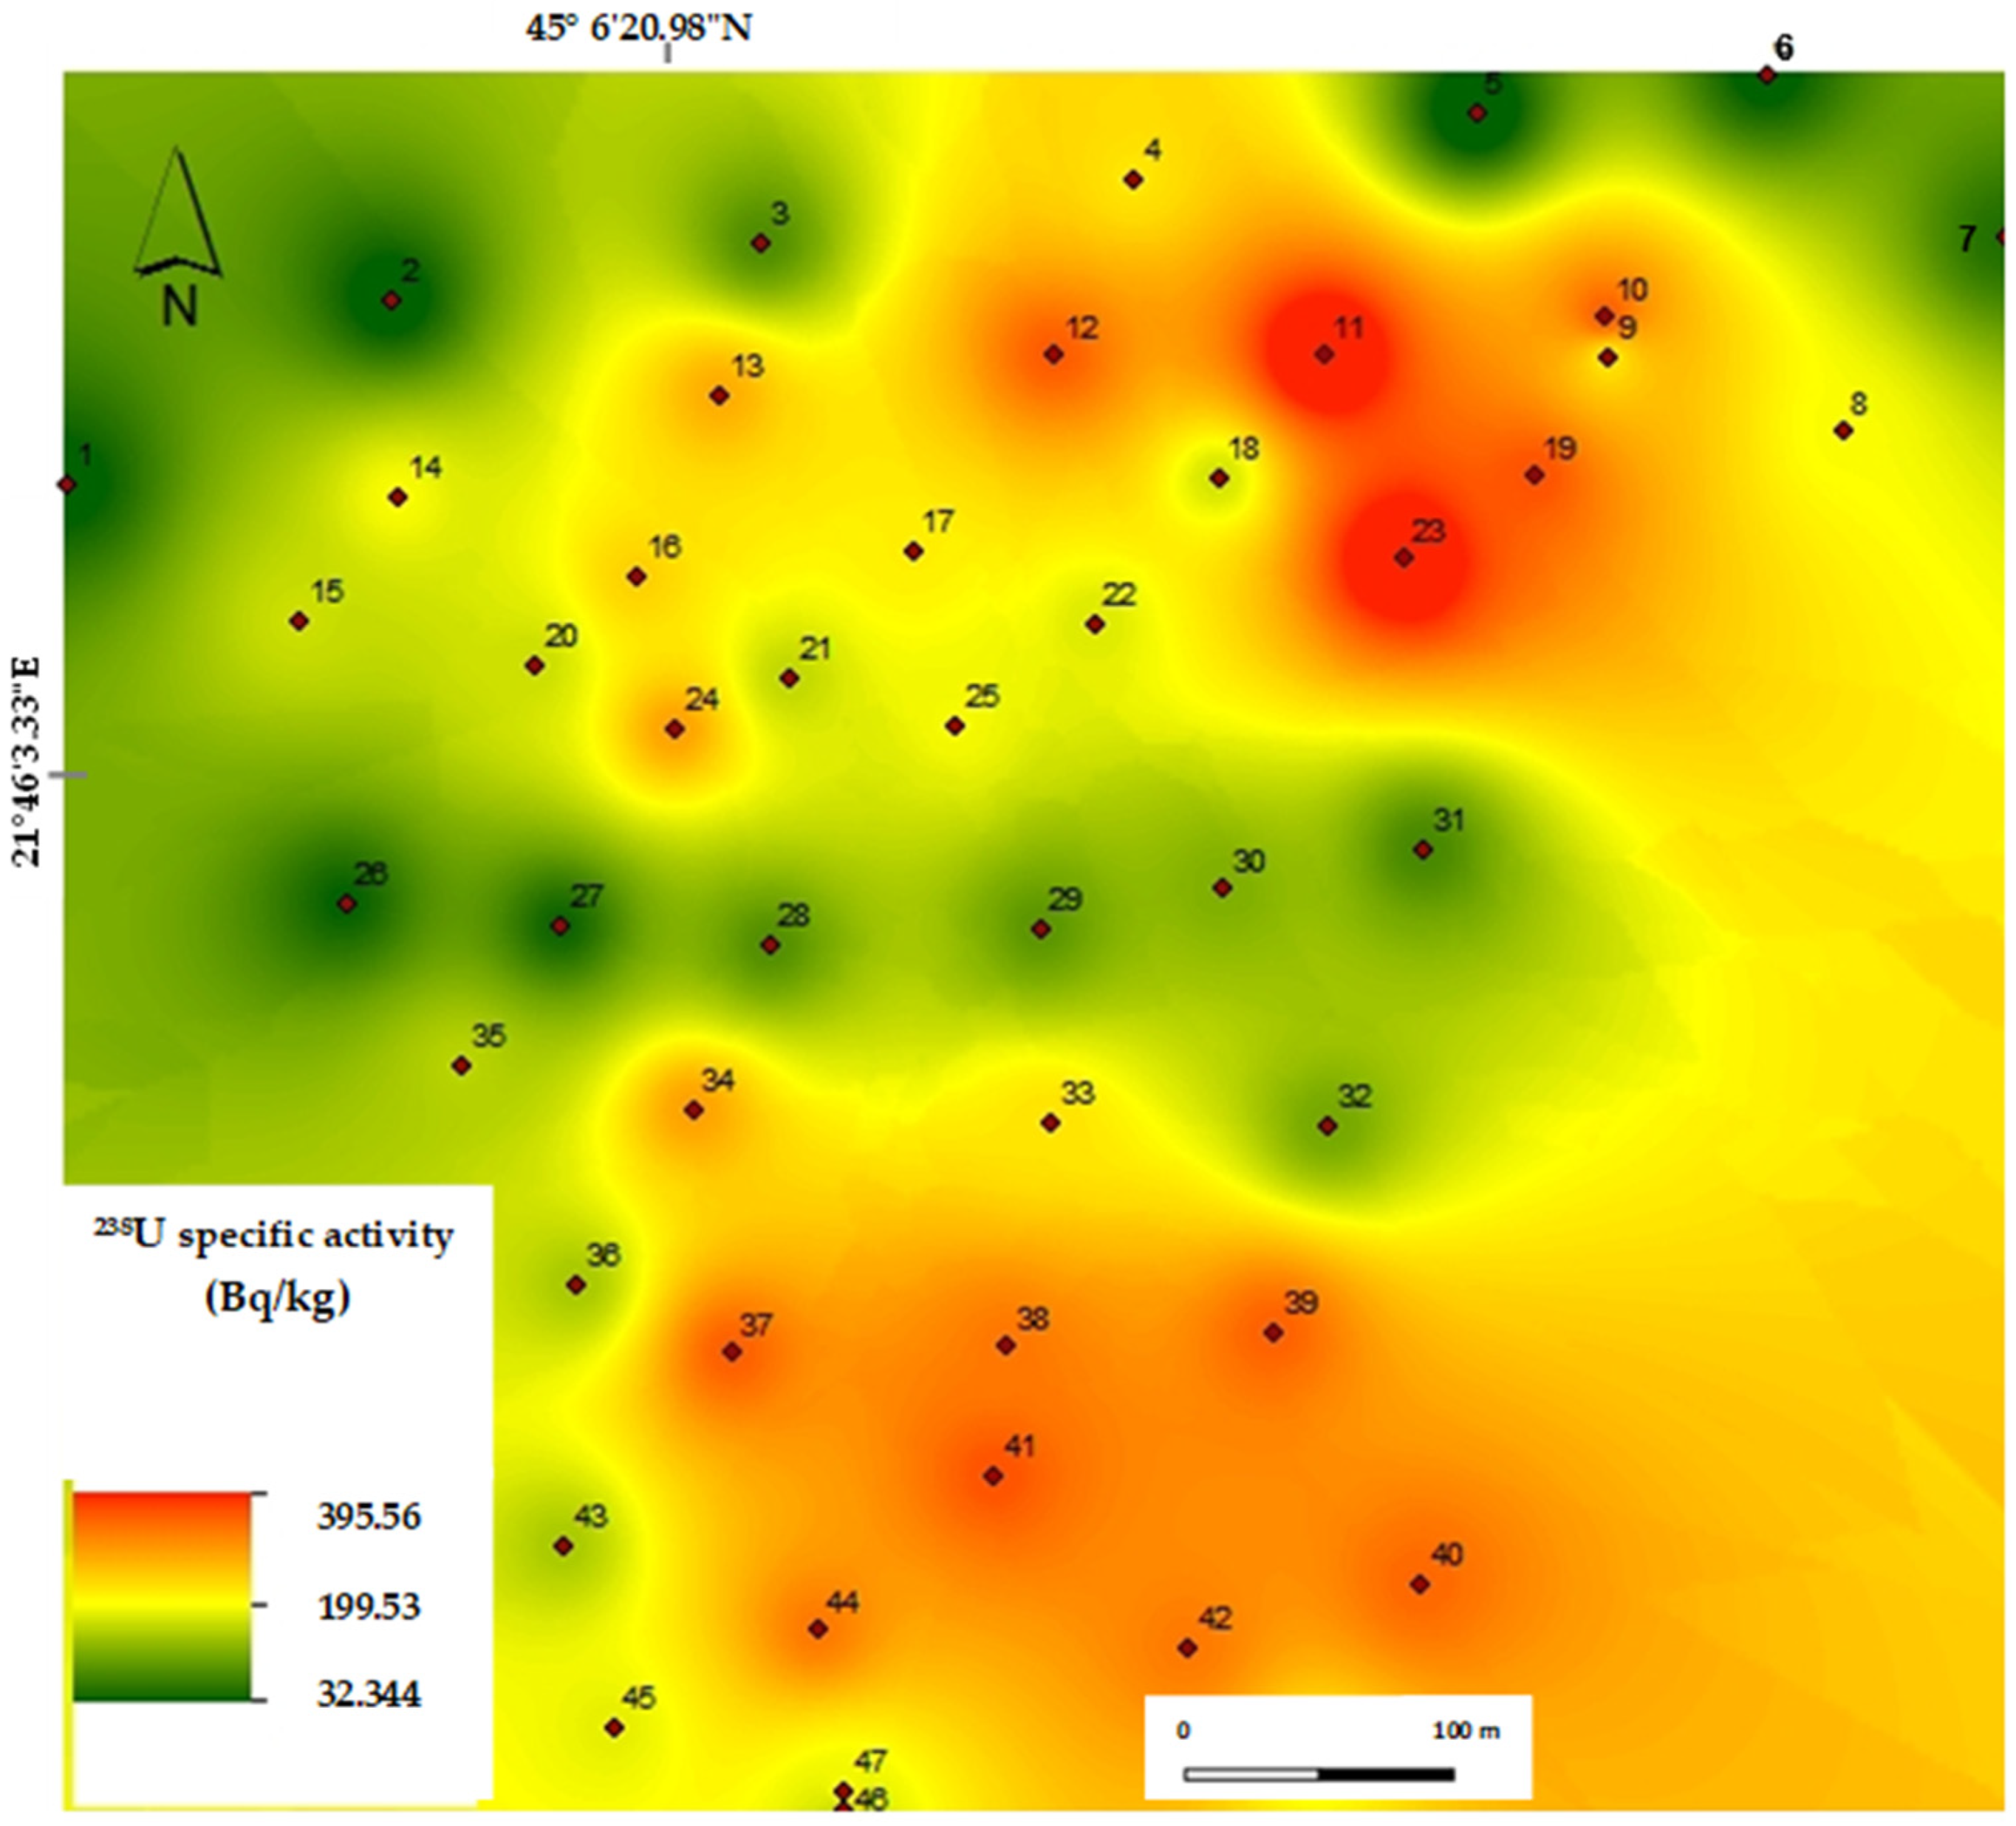
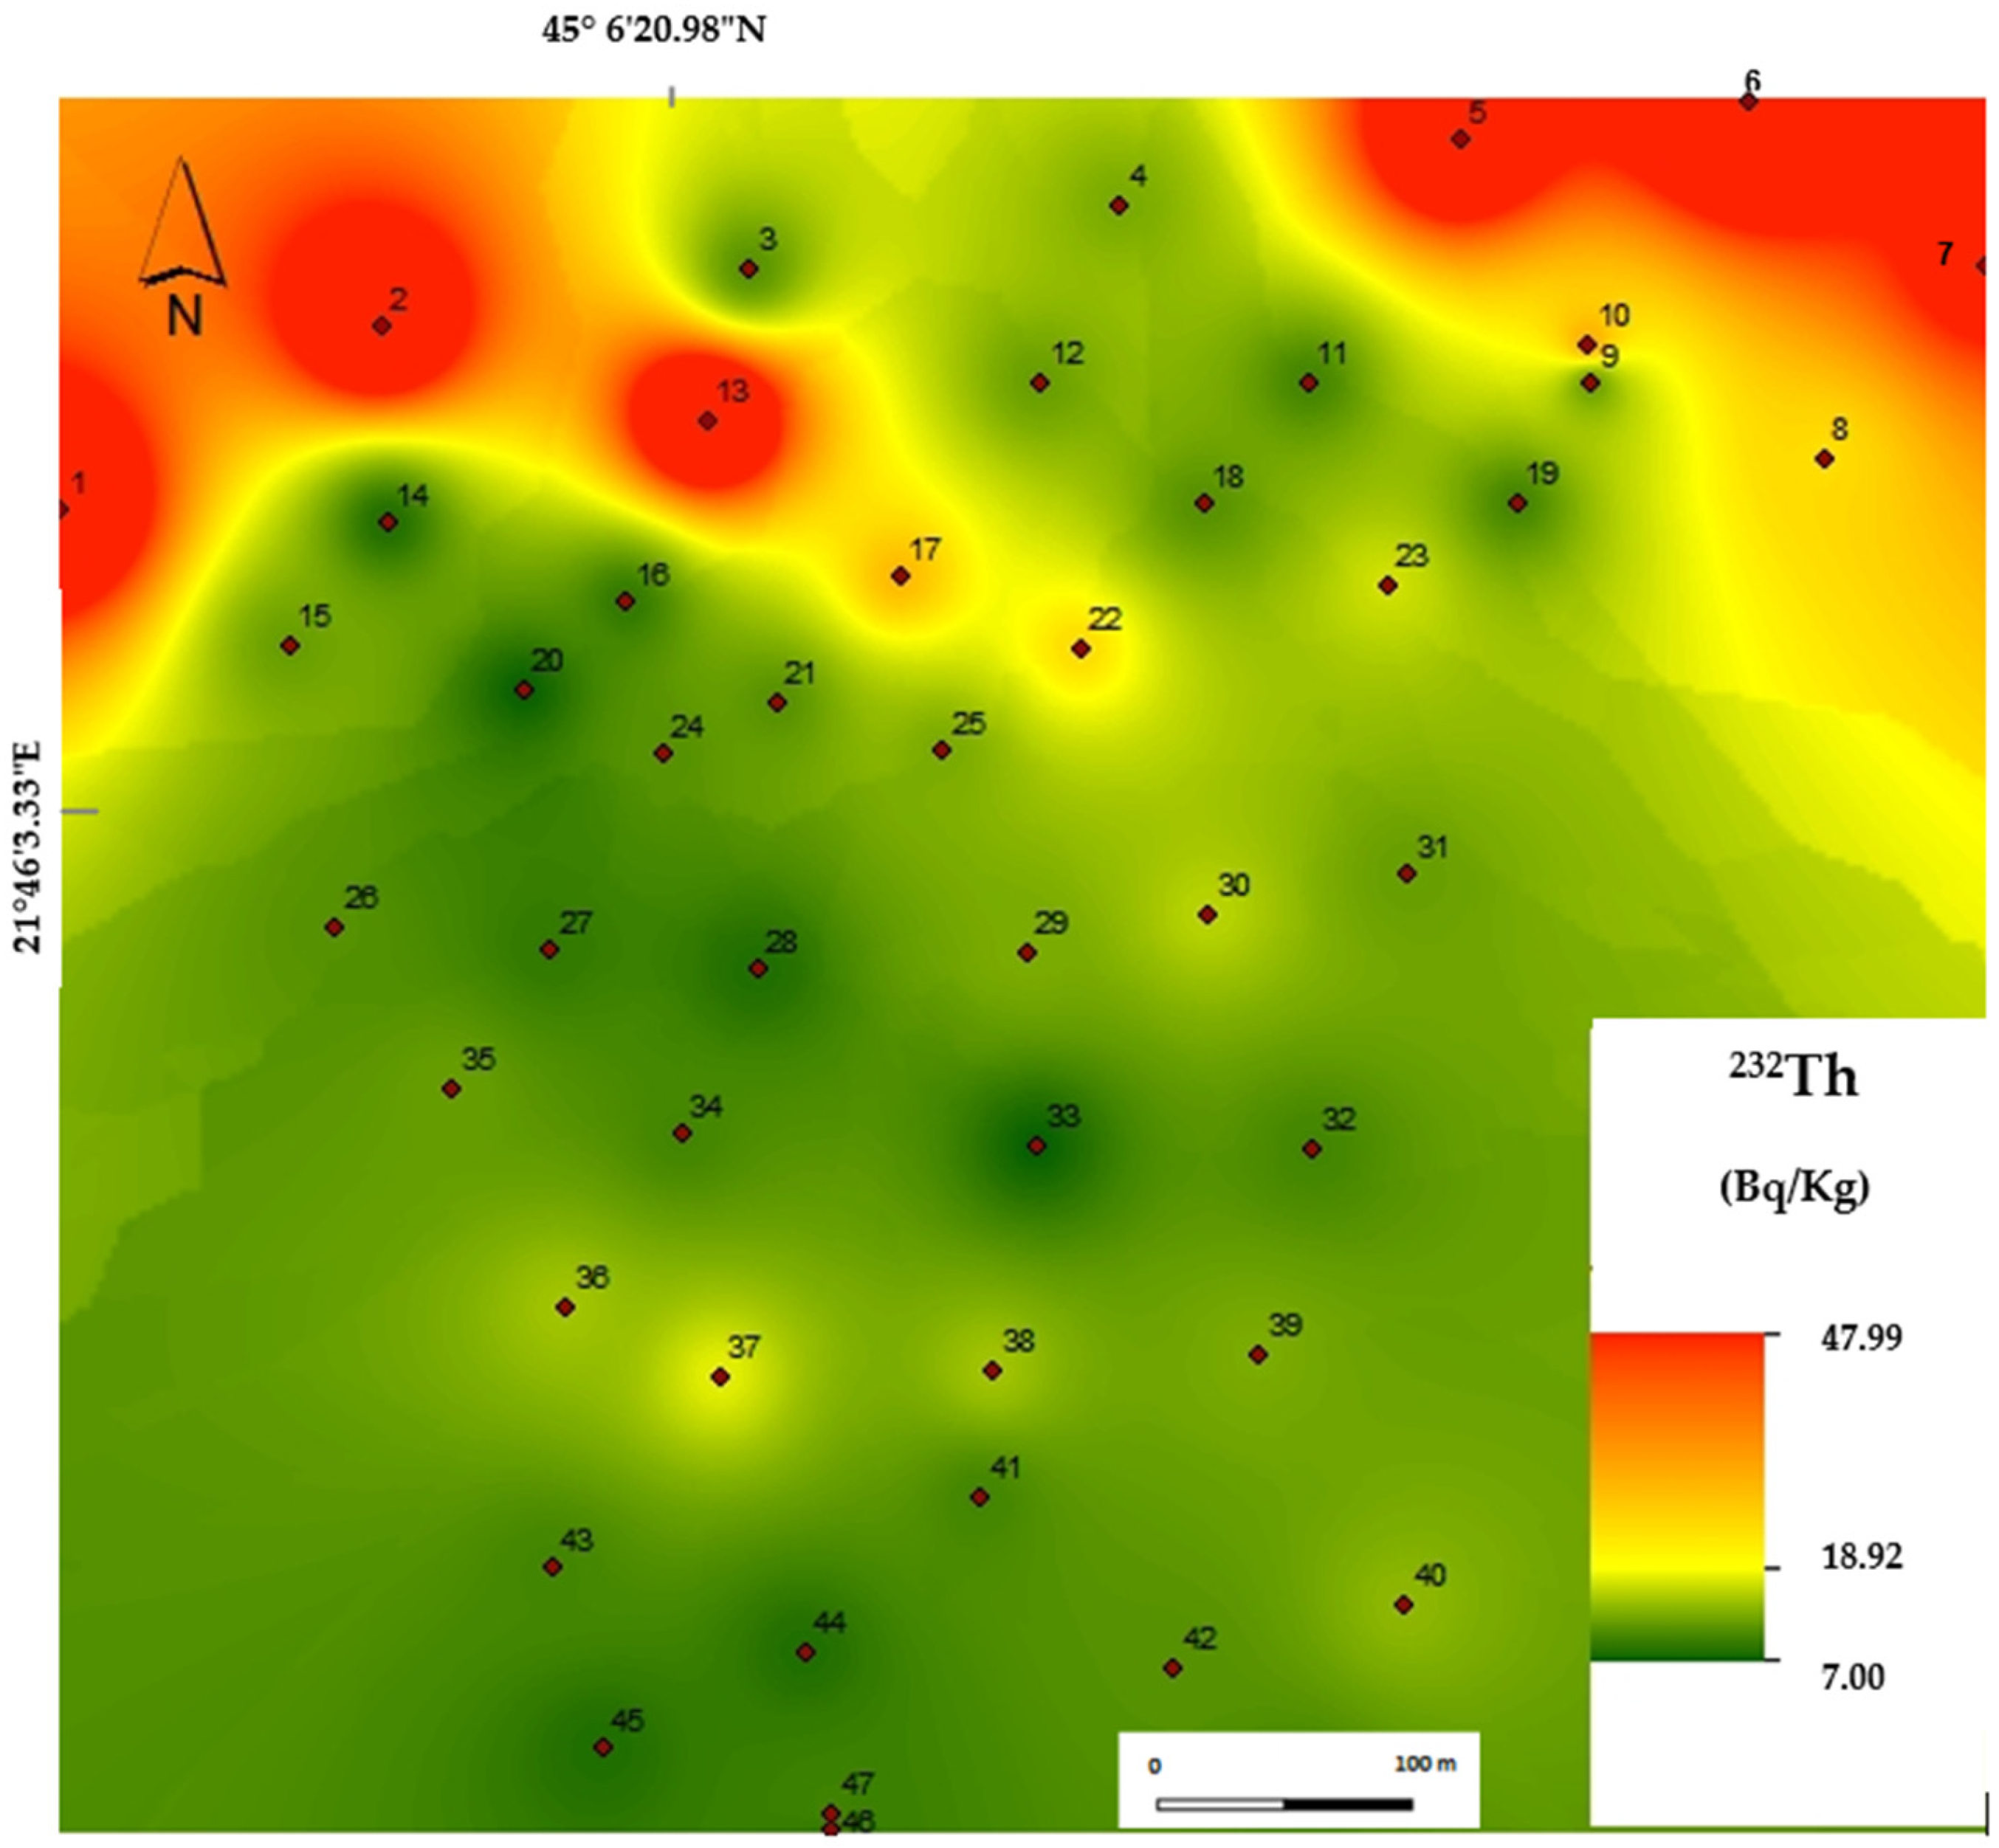
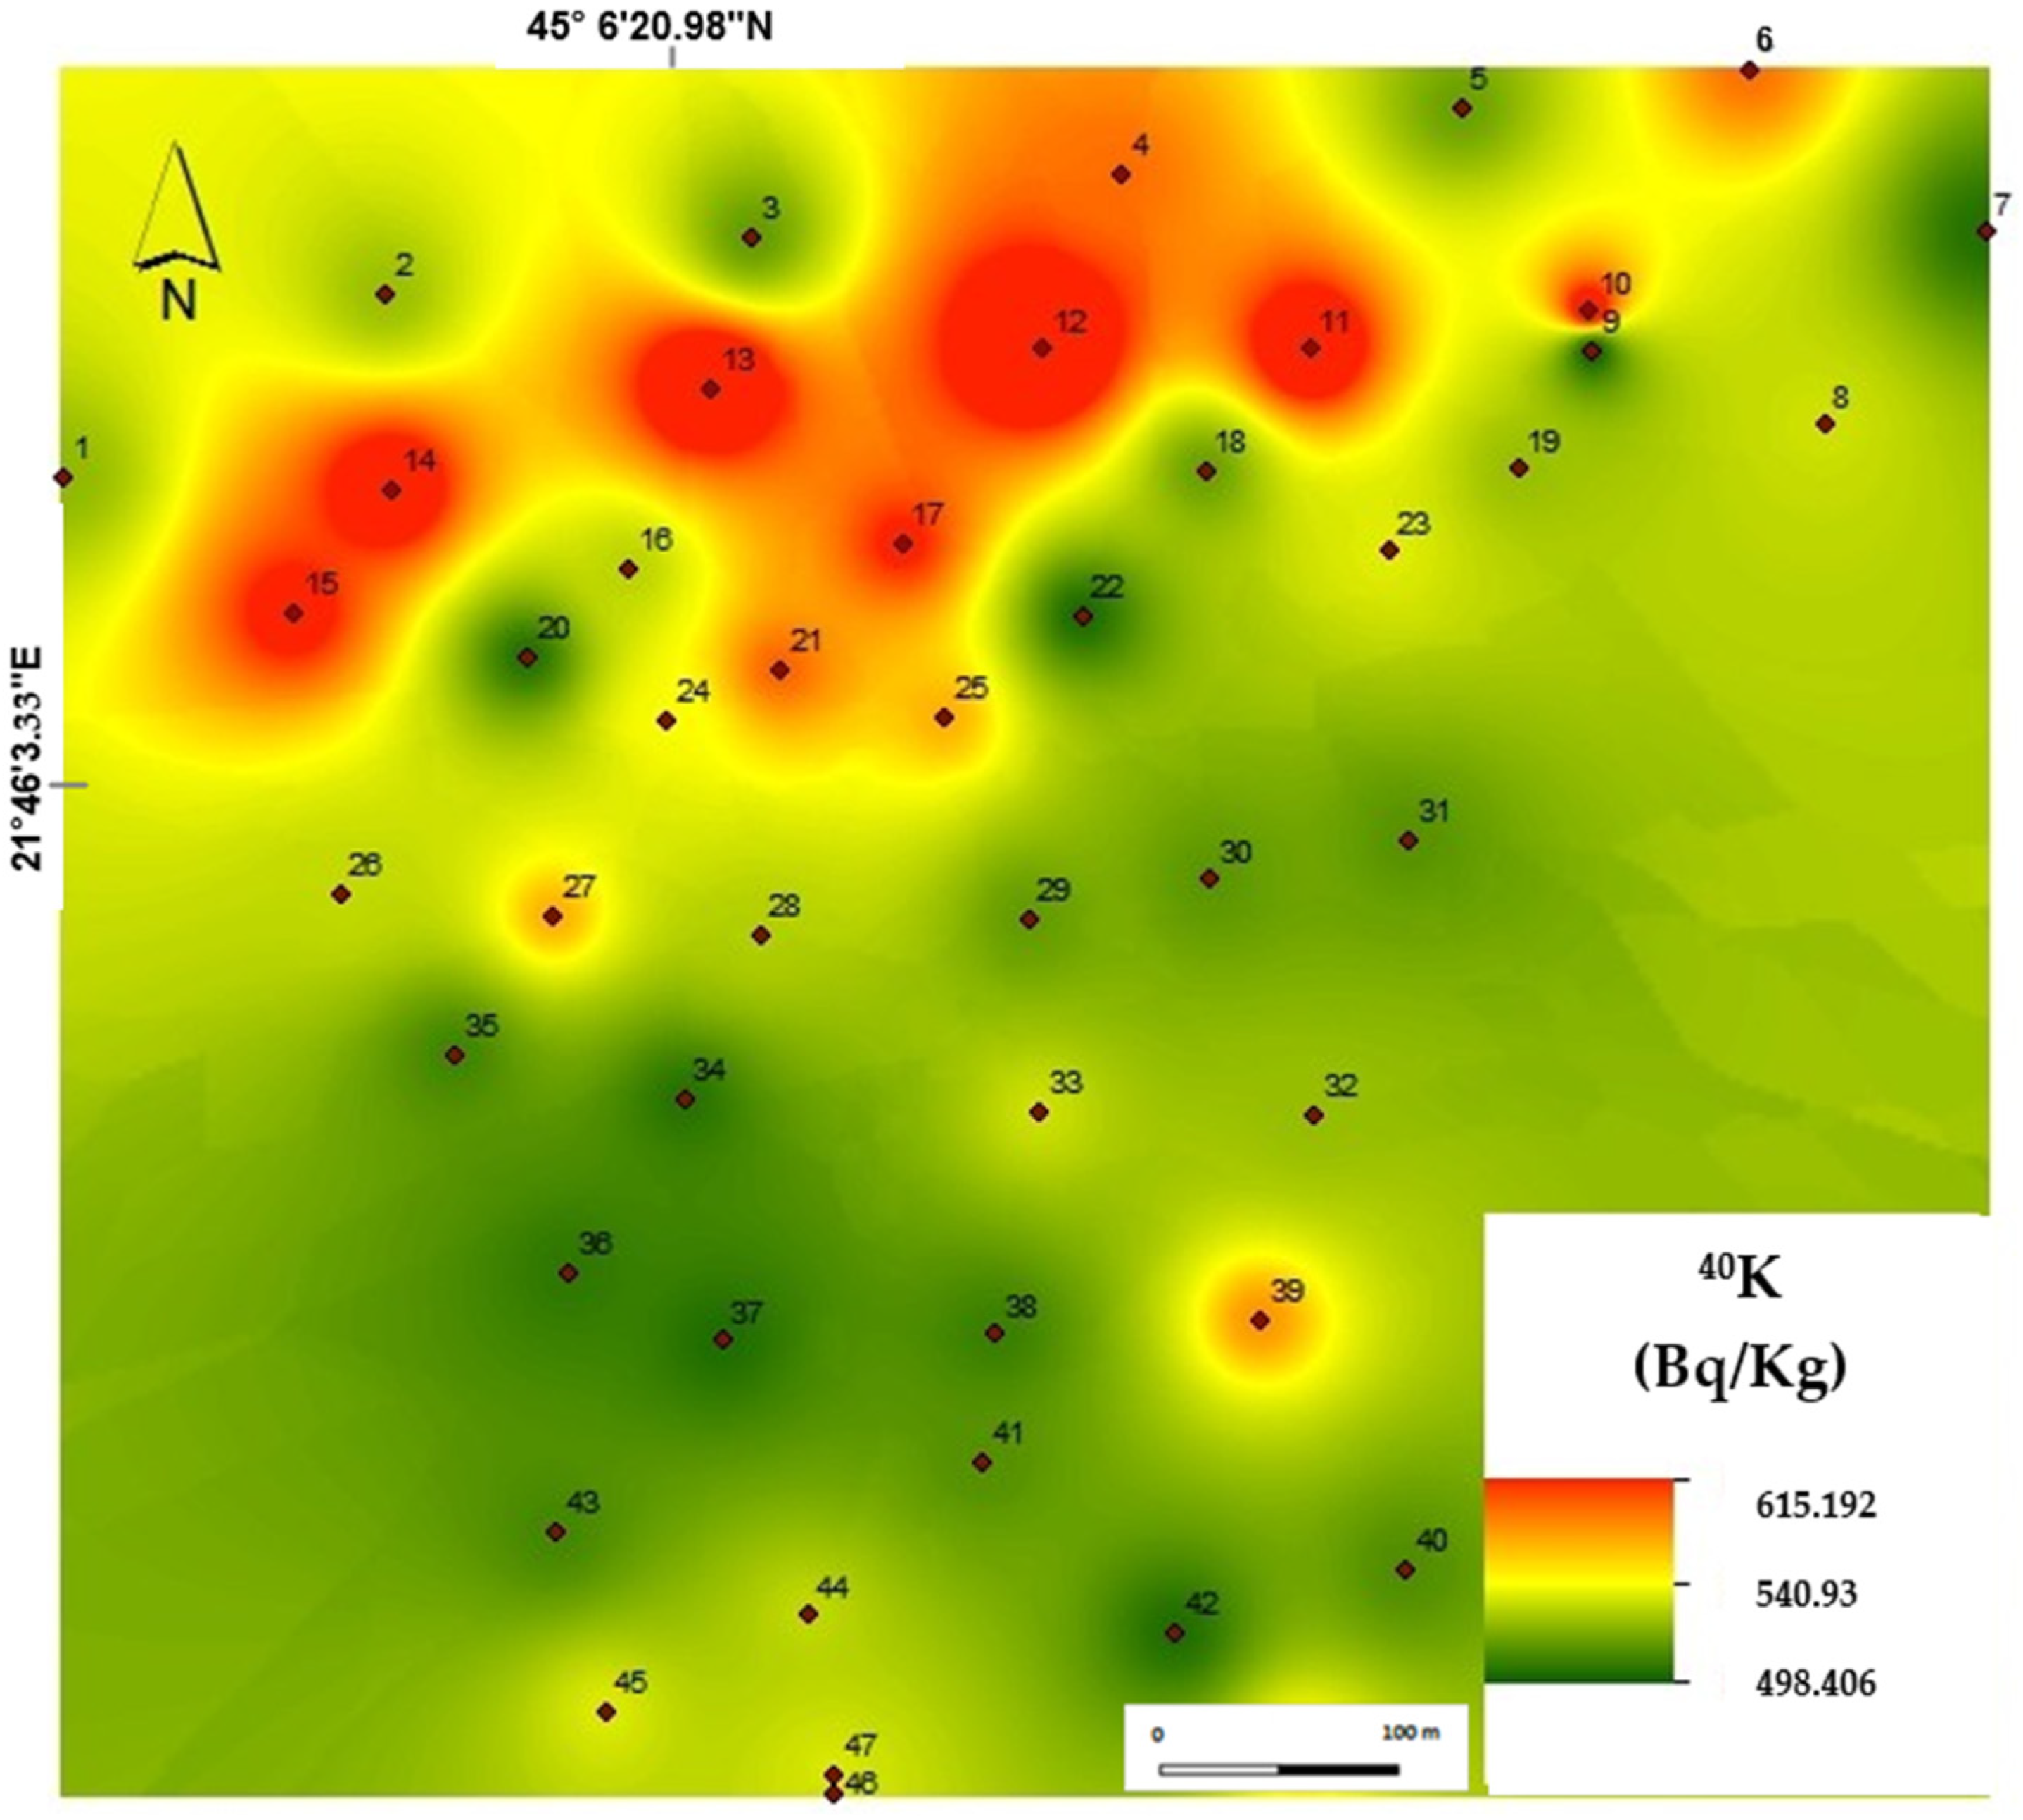
A spatial distribution map of natural radionuclides is useful for identifying areas with high radionuclide concentrations and the possible sources of these elements. The spatial distribution maps for 238U, 232Th and 40K are presented in Figure 5, Figure 6 and Figure 7.
Uranium was the radioactive element with the widest spatial variation in terms of concentration in the study area (Figure 5). The 238U map shows an apex of uranium specific activity (red areas on the map) in the northeastern part of the perimeter, in the soils developed on waste rocks and at the bottom of the waste dump slope. Furthermore, it shows that the area where uranium enrichment at the soil surface was higher than recommended values [28] was large. The spatial distribution analysis of 238U activity concentration noted an association between the high values of uranium content and the site of mining activities of uranium deposits (exploitation, transportation and temporary deposition). The increases in uranium concentration resulted from the leaching pf metal from the waste material. The observed lower values in the western part of the study area were spatially correlated with regions outside the uranium mining perimeter, where anthropic influences were decreased.
The spatial distribution of 232Th (Figure 6) in the soils from the Lișava mining sector indicated very low values (green zone on the map) in most of the study area, even/especially where many soils exhibited high uranium concentrations. Here, the specific activities of 232Th were under the recommended values [28]. Two zones with moderate activity concentrations (up to approximately 48 Bq/kg) were observed in the northeastern and northwestern parts of the perimeter (Figure 6), where the mining footprint was decreased and the relative thorium enrichment was correlated with uranium depletion. This correlation was closely related to the geological features of the study area.
Regarding the distribution map of 40K (Figure 7), the highest values were reported in the northern part of the study area, with these displaying specific activity values up to 650 Bq/kg. The area with a high level of 40K had approximately the same shape as the waste dump. The lower concentration zone (center and south of the perimeter) overlapped the lower content zone for thorium and was slightly higher in uranium content. Although all the values of the specific activity of 40K reported exceeded the median concentration value (400 Bq/kg) provided by UNESCEAR [28], they reflected the local lithological settings.

3.3. Environmental Radiological Risk

The Lișava uranium mining sector is not an inhabited area; the closest village is about 5 km north. This area is included in a larger region where uranium mining has been the most prevalent activity for more than 40 years. The present study revealed that the soils from the Lișava sector had a relatively high concentration of 238U. Therefore, the radiological risk was assessed by calculating the radium equivalent activity (Raeq), absorbed gamma dose rate (DR), external hazard index (Hex) and representative level index (RLI) using the specific activities of 238U, 232Th and 40K measured in the soil and comparing the calculated values to the median values provided by UNESCEAR. A descriptive statistic of the radiological parameters is presented in Table 1, and the individual values for each parameter are accessible in Appendix A.
The radium equivalent (Raeq) is a commonly used risk index and is calculated using the specific activities of 23U, 232Th and 40K. The radium equivalent (Raeq) ranged between 118.331 (Bq/kg) and 450.314 (Bq/kg) with a mean value of 262.228 (Bq/kg). Although the mean value was lower than the median value, in about 50% of the sampling points the calculated values exceeded 370 Bq/kg (Figure 8). The standard deviation (SD) of 88.91 Bq/kg indicated wide variations, suggesting a log distribution for Raeq.
The absorbed gamma dose rate (DR) had a minimum value of 57.55 (nGy/h) and a maximum value of 214. 552 (nGy/h). The mean of the absorbed gamma dose rate (DR) was 123.721 (nGy/h). Furthermore, at almost all the sampling points, the DR was assessed to be above the median value of 84 nGy/h provided by UNESCEAR
In Figure 9, the external hazard index (Hex) values calculated for all the sampling locations are presented. The values of Hex varied from 0.32 to 1.39 and had a mean value of 0.708. Except for the values calculated for sampling points 11 and 23, in all the other sampled points, the values were below 1.
The representative level index (RLI) of gamma radiation hazard associated with 238U, 232Th and 40K from the soil varied from 0.877 to 3.148 with a mean value of 1.839. Almost all the calculated values were higher than the median value of one (Figure 9).

3.4. Pearson’s Correlation Analysis

We used Pearson’s correlation analysis to assess the similarity of the 238U, 232Th and 40K specific activity concentrations and their related radiological parameters (Raeq, DR, Hex and RLI) in the soils from the Lișava uranium mining area. Pearson’s correlation coefficients classify the linear relationship between all variables by the confidence intervals of the coefficients as follows: weak (0.00–0.19), moderate (0.2–0.39), strong (0.4–0.79) and very strong (0.8–1.00) [35,36]. The Pearson’s correlation coefficients from this study are displayed in Table 4.
238U showed a very strong correlation with Raeq and Hex, a strong correlation with RLI and a moderate correlation with 40K and DR. 232Th exhibited negative correlations with almost all the variables with the exception of 40K. 40K presented a weak to moderate correlation with all the detected variables. The very strong correlation between 238U and the radiological hazard indices suggested that uranium was the dominant contributor to the radiological hazard and risks assigned to gamma rays emitted from the 238U decay series in the soil. In addition, the negative correlation between 238U and 232Th and the weak correlation with 40K reflected the impact of uranium mining on the increased radiation levels and radiological risk in the study area.
The negative correlation between uranium and thorium implied a different origin of the two elements. Thus, the main sources of uranium were accessory minerals enriched in U but not Th. Part of the observed U values were due to the leaching of U-bearing phases that incorporated large amount of uranium, whereas the rest was attributed to contamination resulting from uranium mining activities [37]. The positive correlation between potassium, uranium and thorium, although moderate and weak, revealed that both the radionuclides were derived from natural sources. Potassium is a common element in sedimentary rocks with an increased content in K-felspar, mica and clay minerals.

3.5. Mineralogical Futures

In the Lișava sector, the uranium deposits are of a tabular sandstone type, and the mineralization is described as consisting of two generations of pitchblende, sooty pitchblende and uraniferous anthraxolite associated with minor, galena, chalcopyrite, pyrite and sphalerite, which are frequently related with bitumen [19,20].
In the oxidized zone, torbernite, autunite and uranium black products appear [19]. The organic carbon content in this zone can be up to seven percent. Pitchblende occurs as finely dispersed inclusions mainly in solid bitumen and carbonaceous matter, in fine- and medium-grained sandstones, siltstones and carbonaceous and bituminous shales. Locally, pitchblende is found in the gritstone and sandstone matrix. Rarely, uranium black products and pitchblende, which are located near bitumen, form bands or small layers and strings that fill cracks along fissures [19,20].
The mineralogical analysis of the rock samples (uraniferous red sandstone) collected from the dump in the vicinity of soil sampling points 11 and 23, where the uranium concentration was highest, reflected some of the mineralogical characteristics of the uranium ore (Figure 10). Uranium-bearing minerals were found to be less associated with coaly matter than expected. Instead, the carbonaceous matter contained frequent sulfide grains, sometimes displaying biogenic structures such as framboidal aggregates or mineralized vegetal cell structures. The most frequent sulfides were sphalerite, galena, pyrite, and subordinate chalcopyrite, which is sometimes associated with barite, which also appears in pore-filling aggregates. Uranium minerals were mostly observed in discontinuous pore-filling aggregates associated with rutile and possibly anatase. The mineral phases identified in the available samples were brannerite, coffinite and pitchblende, usually forming crusts on rutile or cementing it. As a rule, the U-minerals found were fine-grained and involved in intergrowth with other phases, typically with rutile.

4. Conclusions

The specific activities of the naturally radioactive elements 238U, 232Th and 40K were measured in 47 soil samples collected from the Lișava uranium mining sector. According to the data obtained, these varied significantly from 32.12 to 396.23 Bq/kg for 238U and from 497.32 Bq/kg to 615.32 Bq/kg for 40K, whereas the specific activity of 232Th varied insignificantly from 7.23 to 48.16 Bq/kg. In this study, 232Th and 40K presented averages lower than or comparable with the worldwide average, while the 232U average was higher than the median value (35 Bq/kg). The radiological hazard indexes ranged considerably for Raeq (from 118.33 to 450.31 (Bq/kg)), DR (from 57.55 to 214.55 (nGy/h)), Hex (from 0.32 to 1.239) and RIL (from 0.877 to 3.148). The distribution of the risk assessment indices associated with the investigated soils exceeded the median values given by UNSCEAR. The investigated area had a moderate to elevated level of natural radioactivity. The very strong correlation between 238U and the radiological hazard indices suggested that uranium was the dominant contributor to the radiological hazards and risks assigned to the gamma rays emitted from the 238U decay series in the soil. The uranium mineral phases identified in the waste rock samples were brannerite, coffinite and pitchblende, usually forming crusts on rutile or cementing it.
All the data indicated that the investigated area had a moderate to high level of natural radioactivity, and the high concentration of uranium in the soils reflected the richness of uranium in the parent rocks from which the soil was derived as well as uranium enrichment due to previous uranium mining activities.
A possible solution to the high level of radioactivity observed is the rehabilitation of the waste dump and the surrounding land that is exhibiting signs of degradation. Any work that will be undertaken needs to stabilize the uranium waste and reduce the contamination of surrounding areas. Furthermore, further investigations should be carried out to establish the level of contamination in the surface and ground waters in order to clarify any issues related to uranium mobility.

Author Contributions

Conceptualization, A.I.; methodology, A.I., A.C. and V.V.E.; software, A.I. and A.C; validation, A.I., A.C. and V.V.E.; formal analysis, A.C.; investigation, A.I., V.V.E. and A.C.; resources, A.I.; writing—original draft preparation, A.I.; writing—review and editing, A.I.; visualization, A.C. and V.V.E.; supervision, A.I.; project administration, A.I.; funding acquisition, A.I. All authors have read and agreed to the published version of the manuscript.

Funding

This research was funded by the Romanian Ministry of Research, Innovation and Digitalization under the projects PN-19.45.02.03/28N/2019.

Institutional Review Board Statement

Not applicable.

Informed Consent Statement

Not applicable.

Data Availability Statement

Not applicable.

Acknowledgments

The authors would like to thank Gavril Săbău for discussions and suggestions about the geology and mineralogy of radioactive elements.

Conflicts of Interest

The authors declare no conflict of interest.

Appendix A

Sample ID238U232Th40KRaeqDRHexRLI
154.12 ± 2.742.23 ± 3,9532.12 ± 51.3155.4872.86109.910.42
248.32 ± 2.341.34 ± 3.1534.45 ± 51.7148.5969.74105.200.40
3103.26 ± 5.711.32 ± 1.3521.43 ± 50.7159.6076.44115.310.43
4216.18 ± 10.113.32 ± 1.5576.45 ± 52.3279.61132.13199.320.76
532.12 ± 1.742.32 ± 4.1523.34 ± 52.1132.9362.3894.100.36
653.21 ± 2.448.16 ± 4.4576.23 ± 52.3166.4577.87117.470.45
775.43 ± 4.634.21 ± 1.7504.21 ± 51.2163.1776.69115.680.44
8197.12 ± 8.121.11 ± 1.7546.32 ± 52.2269.37126.77191.220.73
9213.23 ± 9.812.32 ± 1.7497.32 ± 50.4269.14126.84191.340.73
10312.45 ± 16.124.21 ± 2.3598.23 ± 54.1393.13184.10277.711.06
11396.23 ± 20.310.12 ± 0.9604.32 ± 50.3457.23214.55323.651.24
12311.17 ± 15.612.34 ± 1.4615.32 ± 52.3376.20177.06267.091.02
13256.36 ± 12.845.32 ± 4.1608.11 ± 50367.99171.35258.480.99
14198.34 ± 9.98.34 ± 0.7600.21 ± 50.1256.48121.88183.850.69
15175.13 ± 8.612.21± 1.5591.21 ± 51.3238.11113.12170.630.64
16231.13 ± 11.59.21 ± 0.9541.78 ± 48.12286.02135.10203.790.77
17209.78 ± 10.823.23 ± 2.4587.21 ± 52.4288.21135.61204.570.78
18176.23 ± 8.911 ± 1.3523.11 ± 50232.24110.03165.980.63
19316.32 ± 16.910.32 ± 1.1534.34 ± 50.5372.22174.82263.701.01
20174.32 ± 8.87.32 ± 0.6504.21± 49.3223.61106.13160.100.60
21168.23 ± 8.611.21 ± 1.3578.03 ±53.3228.77108.77164.080.62
22182.29 ± 9.121.34 ± 2. 1502.34 ± 51.2251.49118.21178.310.68
23391.17 ± 19.817.32 ± 1.7550.34 ± 50.1458.31214.30323.261.24
24265.3 ± 13.211.34 ± 1.5555.23 ± 53.1324.27152.74230.400.88
25195.26 ± 9.612.56 ± 1.9567.32 ± 54.2256.90121.62183.470.69
2661.21 ± 310.67 ± 1.1543.67 ± 51.3118.3357.5686.820.32
2763.21 ± 3.29.34 ± 1.1567.56 ± 54.1120.2758.6888.520.32
28105.12 ± 3.98.45 ± 0.9540.21 ± 51.1158.8076.36115.180.43
30111.23 ± 5.613.23 ± 1.4521.34 ± 50.1170.2981.28122.600.46
31134.23 ± 6.816.34 ± 1.9519.32 ± 52.6197.5893.70141.340.53
3298.23 ± 4.912.32 ± 1.3518.34 ± 50.1155.7674.59112.520.42
33126.12 ± 6.4310.23 ± 1.1534.32 ± 48.3181.8986.89131.070.49
34218.23 ± 10.17.23 ± 0.6546.21 ± 51.6270.63128.13193.280.73
35265.34 ± 14.210.34 ± 1.1505.34 ± 50.3319.04150.06226.360.86
36165.21 ± 8.312.23 ± 1.3512.34 ± 52.21222.15105.23158.740.60
37156.34 ± 8.115.23 ± 1.5507.34 ± 50.4217.18102.74154.970.59
38309.43 ± 16.318.23 ± 1.5503.21 ± 51.12374.25175.10264.141.01
39291.17 ± 15.115.23 ± 1.5510.34 ± 51.2352.25165.15249.130.95
40307.23 ± 16.213.34 ± 1.2571.34 ± 54.2370.30173.99262.461.00
41302.12 ± 14.914.21 ± 1.4516.32 ± 51.3362.20169.85256.210.98
42315.13 ± 15.910.37 ± 1.517.34 ± 51.2369.79173.58261.841.00
43290.23 ± 1511.45 ± 1.5503.32 ± 50.1345.36162.14244.590.93
44157.23 ± 7.910.23 ± 0.9513.45 ± 51.3211.39100.38151.430.57
45291.21 ± 15.28.23 ± 0.7543.21 ± 52.3344.81162.32244.860.93
46187.23 ± 9.38.12 ± 0.7549.32 ± 51.2241.14114.48172.680.65
47166.21 ± 8.49.23 ± 0.8546.45 ± 52.3221.49105.31158.860.60

References

  1. Belyaeva, O.; Movsisyan, N.; Pyuskyulyan, K.; Sahakyan, L.; Tepanosyan, G.; Saghatelyan, A. Yerevan soil radioactivity: Radiological and geochemical assessment. Chemosphere 2021, 265, 129173. [Google Scholar] [CrossRef] [PubMed]
  2. Florea, N.; Duliu, O.G. Reahabilitation of the Barzava Uranium Mine Tailings. J. Hazard. Toxic Radioact. Waste 2013, 17, 230–236. [Google Scholar] [CrossRef]
  3. International Atomic Energy Agency. Evaluating the Reliability of Predictions Made Using Environmental Transfer Models; IAEA: Vienna, Austria, 1989. [Google Scholar]
  4. Durusoy, A.; Yildirim, M. Determination of radioactivity concentrations in soil samples and dose assessment for Rize Province, Turkey. J. Radiat. Res. Appl. 2013, 10, 348–352. [Google Scholar] [CrossRef] [Green Version]
  5. Carvalho, F.P.; Oliveira, J.M.; Malta, M. Radioactivity in Soils and Vegetables from Uranium Mining Regions. Procedia Earth Planet. Sci. 2014, 8, 38–42. [Google Scholar] [CrossRef] [Green Version]
  6. Tye, A.M.; Milodowski, A.E.; Smedley, P.L. Distribution of Natural Radioactivity in the Environment; British Geological Survey Internal Report; British Geological Survey: Nottingham, UK, 2017; p. 45. [Google Scholar]
  7. Ntsohi, L.; Usman, I.; Mavunda, R.; Kureba, O. Characterization of uranium in soil samples from a prospective uranium mining in Serule, Botswana for nuclear forensic application. J. Radiat. Res. Appl. Sci. 2021, 14, 23–33. [Google Scholar] [CrossRef]
  8. Ratnikov, A.N.; Sviridenko, D.G.; Popova, G.I.; Sanzharova, N.I.; Mikailova, R.A. The Behaviour of Uranium in Soils and the Mechanisms of Its Accumulation by Agricultural Plants. In Uranium in Plants and the Environment. Radionuclides and Heavy Metals in the Environment; Gupta, D., Walther, C., Eds.; Springer: Cham, Switzerland, 2020. [Google Scholar]
  9. Rudnick, R.L.; Gao, S. The Composition of the Continental Crust. In The Crust: Treatise on Geochemistry; Holland, H.D., Turekian, K.K., Eds.; Elsevier-Pergamon: Oxford, UK, 2003; Volume 3, pp. 1–64. [Google Scholar]
  10. International Atomic Energy Agency. Guidelines for Radioelement Mapping Using Gamma Ray Spectrometry Data; IAEA-TECDOC-1363; International Atomic Energy Agency: Vienna, Austria, 2003; p. 173. [Google Scholar]
  11. Dongarra, G. Geochemical behaviour of uranium in the supergene environment. In Uranium Geochemistry, Mineralogy, Geology, Exploration and Resources; De Vito, B., Ippolito, F., Capaldi, G., Eds.; The Institution of Mining and Metallurgy: London, UK, 1984; p. 18. [Google Scholar]
  12. Ali, M.A.; Abdel Gawad, A.E.; Ghoneim, M.M. Geology and Mineral Chemistry of Uranium and Thorium-bearing Minerals in Rare-Metal (NYF) Pegmatites of Um Solimate, South Eastern Desert, Egypt. Acta Geol. Sin. 2021, 95, 1568–1582. [Google Scholar] [CrossRef]
  13. Lasheen, E.S.R.; Zakaly, H.M.H.; Alotaibi, B.M.; Saadawi, D.A.; Ene, A.; Fathy, D.; Awad, H.A.; El Attar, R.M. Radiological Risk Parameters of the Phosphorite Deposits, Gebel Qulu El Sabaya: Natural Radioactivity and Geochemical Characteristics. Minerals 2022, 12, 1385. [Google Scholar] [CrossRef]
  14. International Atomic Energy Agency. Planning for environmental restoration of uranium mining and milling sites in central and eastern Europe. In Proceedings of the Workshop Held under the Technical Co-Operation Project RER/9/022 on Environmental Restoration in Central and Eastern Europe, Felix, Romania, 4–8 November 1996; No. IAEA-TECDOC-982. International Atomic Energy Agency: Vienna, Austria, 1997. [Google Scholar]
  15. European Commission, Directorate-General for Energy. Verification under the terms of Article 35 of the Euratom Treaty. Technical Report; In Uranium Mining, Processing, Fuel Fabrication and National Monitoring Networks, Romania; Ro-12/05; European Commission, Directorate-General for Energy (ENER): Brussels, Belgium, 2012; p. 64. [Google Scholar]
  16. Brandula, O.; Lazăr, M.; Faur, F. Ecological Reconstruction of Radioactive Mining Waste Dumps—Case Study of Natra Waste Dump. Res. J. Agric. Sci. 2015, 47, 19–29. [Google Scholar]
  17. National Uranium Company. Review of the Technical Project Regarding the Execution of Closure and Rehabilitation Works of Lişava Mine; National Uranium Company (NUC): Caraș Severin, Romania, 2010. (In Romanian) [Google Scholar]
  18. Gheuca, I.; Ilinca, V. Geological Map of Romania, 1:200,000 Scale; Geological Institute of Romania: Bucharest, Romania, 2022. [Google Scholar]
  19. Dahlkamp, F.J. Uranium Deposits of the World: Europe; Springer: Berlin/Heidelberg, Germany, 2016; p. 792. [Google Scholar]
  20. Bejenaru, C.; Cioloboc, D. Uranium Exploration and Production in Romania: Case Histories and Prospects. Recent Developments in Uranium Resources and Supply; No. IAEA-TECDOC-823; IAEA: Vienna, Austria, 1993; pp. 193–205. [Google Scholar]
  21. Nitu, G. Les conditions tectonomagmatiques de la formation des agistments d’uranium de Roumanie. In Formation of Uranium Ore Deposits; International Atomic Energy Agency (IAEA): Vienna, Austria, 1974; pp. 679–692. [Google Scholar]
  22. Salminen, R.; Batista, M.J.; Bidovec, M.; Demetriades, A.; De Vivo, B.; De Vos, W.; Duris, M.; Gilucis, A.; Gregorauskiene, V.; Halamić, J.; et al. Geochemical Atlas of Europe, Part 1, Background Information, Methodology and Maps; Geological Survey of Finland: Espoo, Filand, 2005; p. 526. [Google Scholar]
  23. Yang, J.; Sun, Y. Natural radioactivity, and dose assessment in surface soil from Guangdong, a high background radiation province in China. J. Radiat. Res. Appl. Sci. 2022, 15, 145–151. [Google Scholar] [CrossRef]
  24. Sandu, M.C.; Iancu, O.G.; Chelariu, C.; Ion, A.; Balaban, S.I.; Scarlat, A.A. Radiological risk assessment and spatial distribution of naturally occurring radionuclides within riverbed sediments near uranium deposits: Tulgheș-Grințieș, Eastern Carpathians (Romania). J. Radiat. Res. Appl. 2020, 13, 730–746. [Google Scholar] [CrossRef]
  25. Ion, A. Assessment of natural radioactivity level in rocks of Ditrau Alkaline Massif area, Eastern Carpathians, Romania. In Proceedings of the 12th International Multidisciplinary Scientific GeoConference SGEM 2012, Albena, Bulgaria, 17–23 June 2012; Volume 5, pp. 87–94. [Google Scholar]
  26. Dincă, G.; Apopei, A.I.; Szabo, R.; Maftei, A.E. The Effect of Mn Substitution on Natural Sphalerites by Means of Raman Spectroscopy: A Case Study of the Săcărâmb Au-Ag-Te Ore Deposit, Apuseni Mountains, Romania. Minerals 2022, 12, 885. [Google Scholar] [CrossRef]
  27. Beretka, J.; Mathew, P.J. Natural radioactivity of Australian building materials, industrial wastes and by-products. Health Phys. 1985, 48, 87–95. [Google Scholar] [CrossRef] [PubMed]
  28. United Nations Scientific Committee on the Effects of Atomic Radiation. Sources and Effect of Ionizing Radiation; Report to the General Assembly, with Scientific Annexes; United Nations Scientific Committee on the Effects of Atomic Radiation (UNSCEAR): New York, NY, USA, 2000. [Google Scholar]
  29. Ramasamy, V.; Suresh, G.; Meenakshisundaram, V.; Gajendran, V. Evaluation of Natural Radionuclide Content in River Sediments and Excess Lifetime Cancer Risk Due to Gamma Radioactivity. Res. J. Environ. Earth Sci. 2009, 1, 6–10. [Google Scholar]
  30. Ravisankar, R.; Chandramohan, J.; Chandrasekaran, A.; Jebakumar, J.P.P.; Vijayalakshmi, I.; Vijayagopal, P.; Venkatraman, B. Assessments of radioactivity concentration of natural radionuclides and radiological hazard indices in sediment samples from the East coast of Tamilnadu, India with statistical approach. Mar. Pollut. Bull. 2015, 97, 419–430. [Google Scholar] [CrossRef] [PubMed]
  31. Amin, R.M. Gamma radiation measurements of naturally occurring radioactive sample from commercial Egyptian granites. Environ. Earth Sci. 2012, 67, 771–775. [Google Scholar] [CrossRef]
  32. Petrescu, L.; Bilal, E.; Iatan, L.E. The impact of a uranium mining site on the stream sediments (Crucea mine, Romania). Sci. Ann. Sch. Geol. 2011, 100, 121–126. [Google Scholar]
  33. Nikolov, J.; Forkapić, S.; Hansman, J.; Bikit, I.; Vesković, M.; Todorović, N.; Mrđa, D.; Bikit, K. Natural radioactivity around former uranium mine, Gabrovnica in Eastern Serbia. J. Radioanal. Nucl. Chem. 2014, 302, 477–482. [Google Scholar] [CrossRef]
  34. Akpanowo, M.; Umaru, I.; Iyakwari, S.; Joshua, E.O.; Yusuf, S.; Ekong, G.B. Determination of natural radioactivity levels and radiological hazards in environmental samples from artisanal mining sites of Anka, North-West Nigeria. Sci. Afr. 2020, 10, e05561. [Google Scholar] [CrossRef]
  35. Abedin, M.; Karim, M.; Khandaker, M.U.; Kamal, M.; Hossain, S.; Miah, M.; Bradley, D.; Faruque, M.; Sayyed, M. Dispersion of radionuclides from coal-fired brick kilns and concomitant impact on human health and the environment. Radiat. Phys. Chem. 2020, 177, 109165. [Google Scholar] [CrossRef]
  36. Caridi, F.; Di Bella, M.; Sabatino, G.; Belmusto, G.; Fede, M.R.; Romano, D.; Italiano, F.; Mottese, A.F. Assessment of Natural Radioactivity and Radiological Risks in River Sediments from Calabria (Southern Italy). Appl. Sci. 2021, 11, 1729. [Google Scholar] [CrossRef]
  37. Antunes, M.; Santos, A.; Valente, T.; Albuquerque, T. Spatial Mobility of U and Th in a U-enriched Area (Central Portugal). Appl. Sci. 2020, 10, 7866. [Google Scholar] [CrossRef]
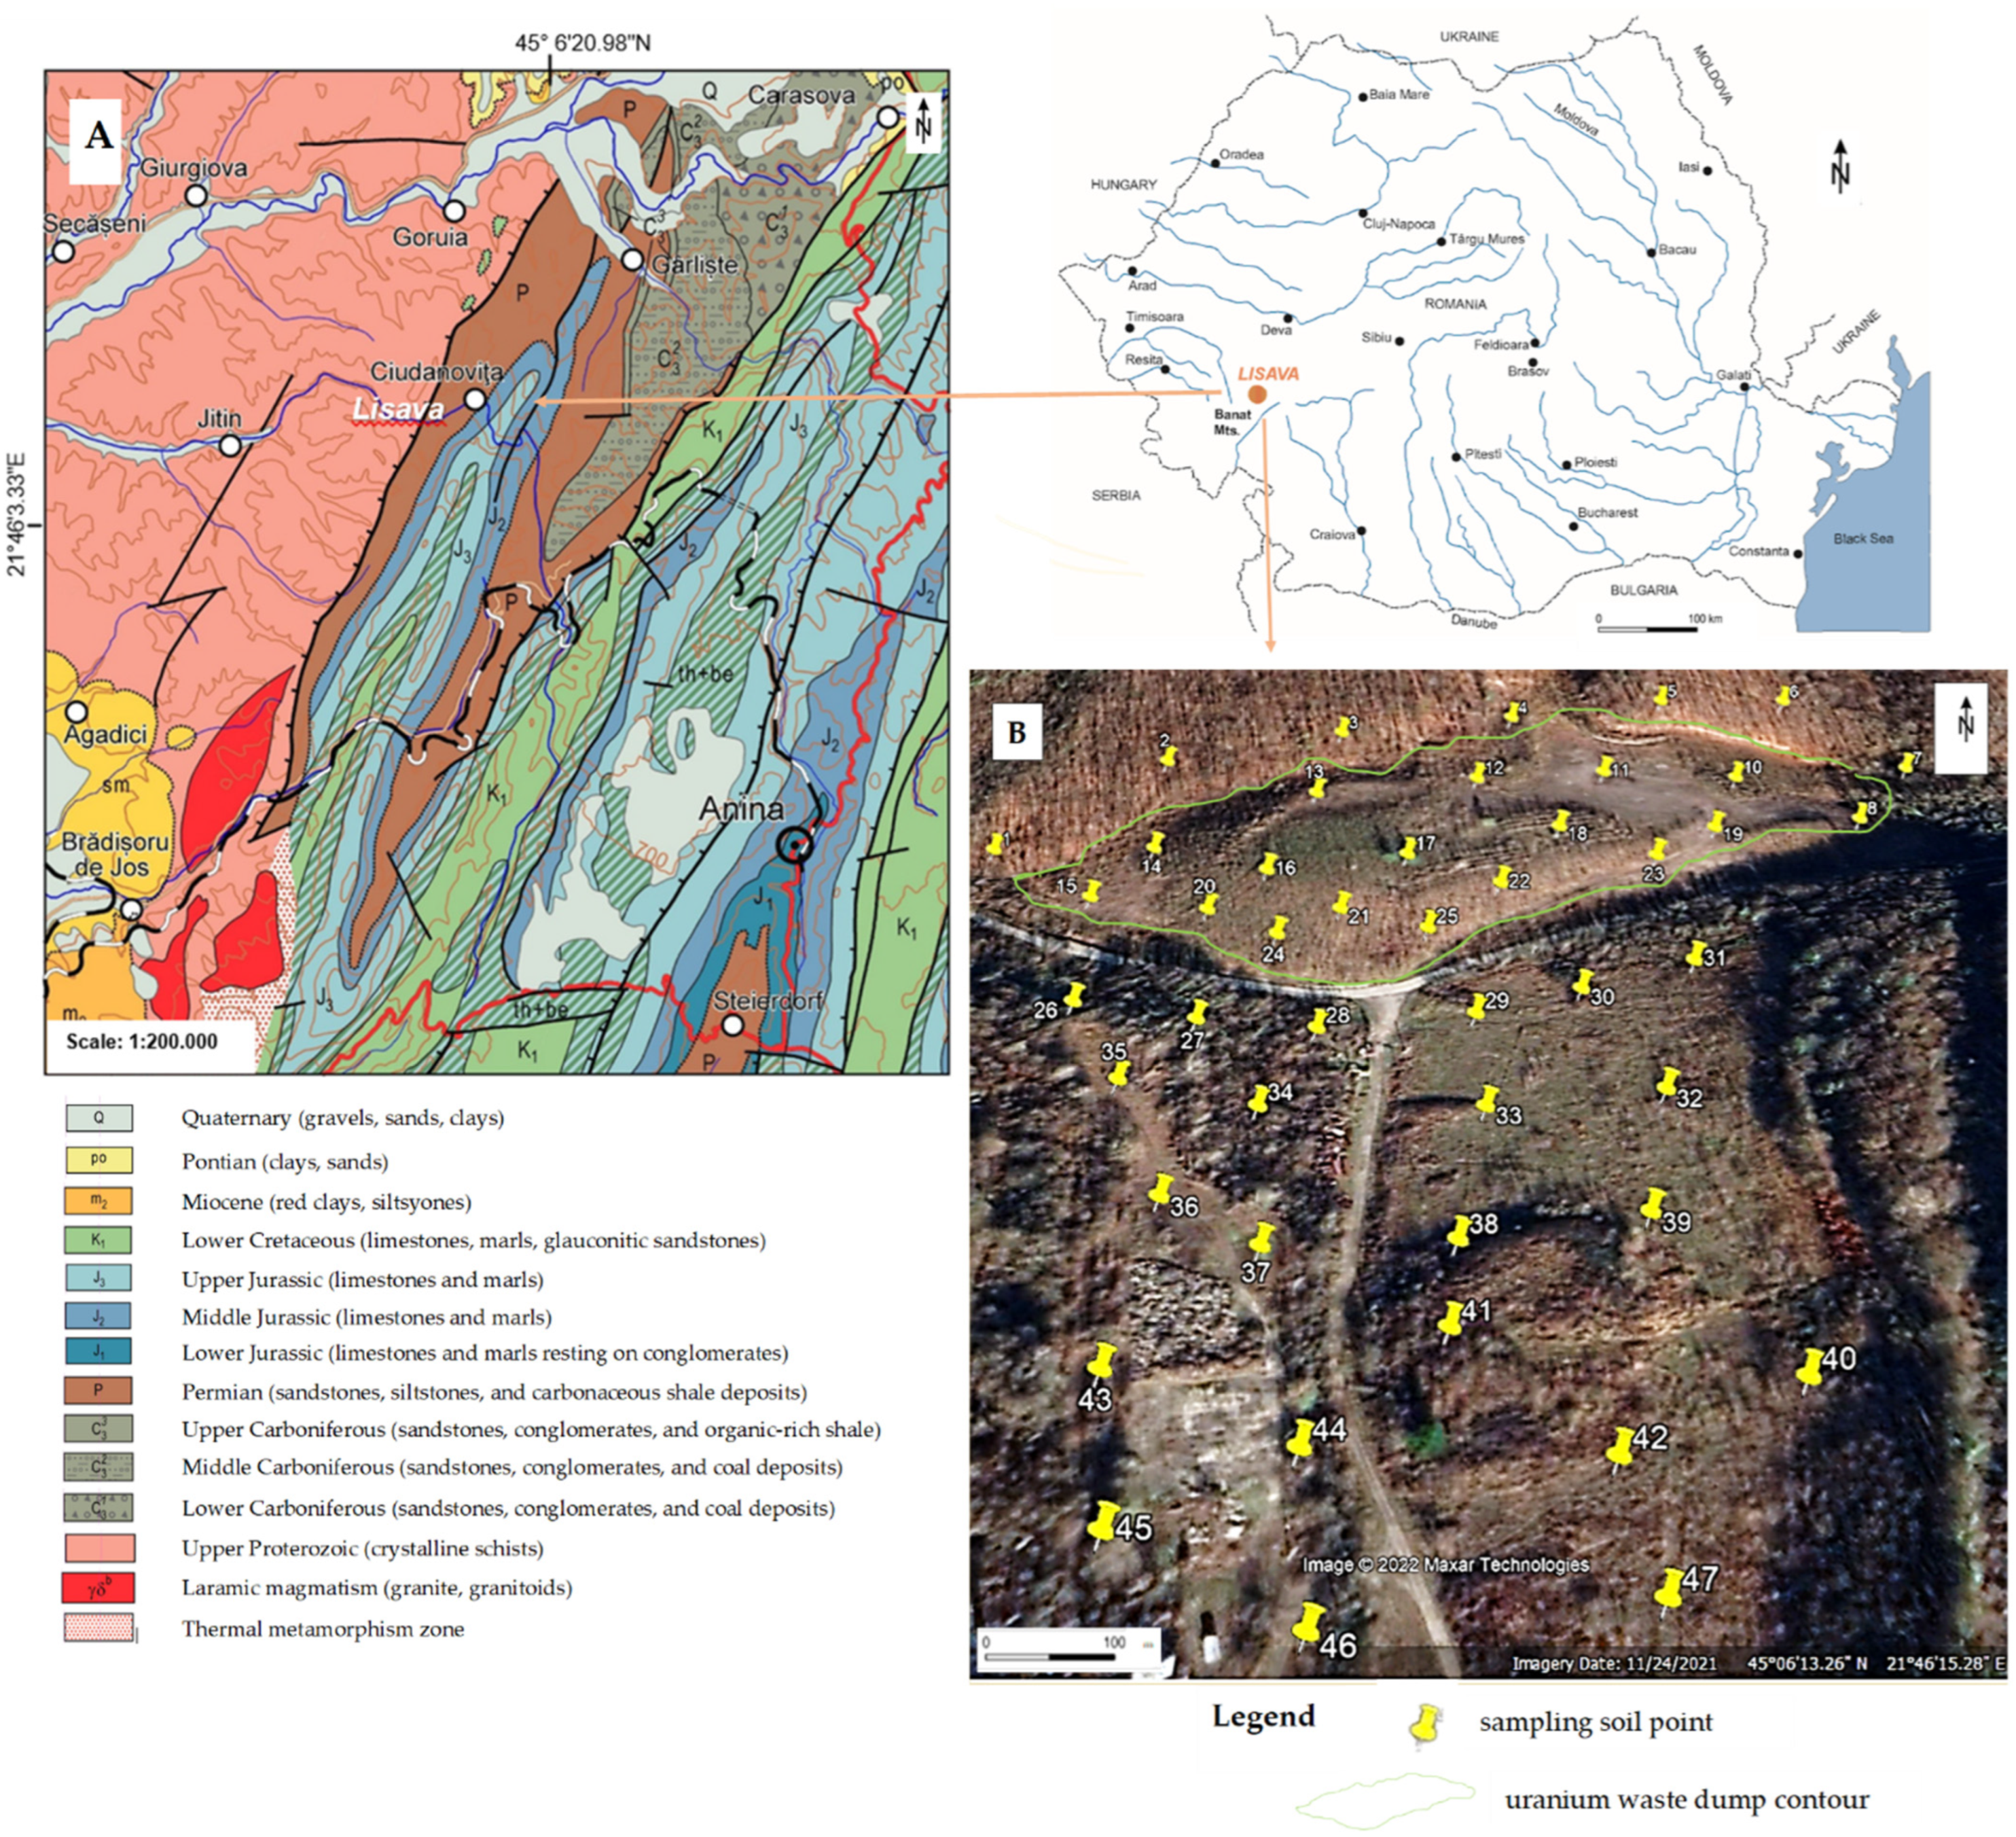
Figure 1. (A) Geological map of the study area (extracted from a geological map of Romania at a 1:200,000 scale [18]; (B) sampling area of the Lișava uranium mining sector.
Applsci 12 12363 g001
Figure 2. Geological section across the Natra-Gîrliste Anticline and location of uranium deposits in the Ciudanovița Series (1) and Dobrei North, Natra (2) (modified after [19]).
Applsci 12 12363 g002
Figure 3. Typical macroscopic aspects of the (Upper Permian sandstone) samples selected for microscopic study on grounds of their radioactivity.
Applsci 12 12363 g003
Figure 4. Histogram, boxplot and normal Q–Q plot of 238U, 232Th and 40K in soils from Lișava sector.
Applsci 12 12363 g004
Figure 5. Spatial distribution of 238U in soils from Lișava uranium mining sector.
Applsci 12 12363 g005
Figure 6. Spatial distribution of 232Th in soils from Lișava uranium mining sector.
Applsci 12 12363 g006
Figure 7. Spatial distribution of 40K in soils from Lișava uranium mining sector.
Applsci 12 12363 g007
Figure 8. Raeq and DR calculated for all soil samples from Lișava uranium mining sector.
Applsci 12 12363 g008
Figure 9. Raeq and DR (Hex) values calculated for all soil samples from Lișava uranium mining sector.
Applsci 12 12363 g009
Figure 10. SEM images of uranium red sandstone mineral assemblages. (A) Coffinite (lighter) crust on pore-filling authigenic rutile (dark grey) associated with iron-rich chlorite. (B) Detritic zircon and pore-filling aggregates with chlorite and rutile. Brannerite overgrowing rutile needles. (C) Detail with idiomorphic brannerite on rutile. (D) Pore-filling structures composed of Ti-U oxides (left) and Fe-rich chlorite (right). (E) Detail with concentric structure with a rutile and carbonaceous matter core and a mantle formed by rutile intergrown with brannerite. (F) Brannerite aggregate, probably replacing rutile (present as lower-scattering ribbons in the upper-right part of the grain). (G) Pore-filling with equant TiO2 crystals (rutile or anatase) forming crusts overgrown or cemented by brannerite. (H) Mineralized vegetal cell structures with pyrite and subordinate galena preserved in the carbonaceous matter. (I) Aggregates of framboidal pyrite composed of octahedral crystals set in carbonaceous matter. (J) Galena grains included in carbonaceous matter. (K) Barite deposited on pore-filling chlorite books. (L) Sphalerite associated with carbonaceous matter and clay minerals.
Applsci 12 12363 g010
Table 1. The calculation equations for radiological parameters.
Radiological ParameterEquationReferences
RRadium equivalent activity (Raeq)Raeq = AU + 1.43ATh + 0.077AK (Bq/kg)[27,28]
Absorbed gamma dose rate (DR)DR = 0.462AU + 0.604ATh + 0.042AK (nGy/h)[28,29]
External hazard index (Hex)Hex = (AU/370) + (ATh/259) + (AK/4810)[27,30]
Representative level index (RLI)RLI = (1/150AU) + (1/100ATh) + (1/1500AK)[30,31]
AU, ATh and AK: specific activity of 238U, 232Th and 40K (Bq/kg); recommended values: Raeq = 370 Bq/kg; DR = 84 nGy/h; Hex > 1; and RLI > 1 [27].
Table 2. Descriptive statistics for 238U, 232Th, 40K, Raeq, DR, Hex and RLI in soil samples; Raeq stands for radium equivalent activity, DR for absorbed gamma dose rate, Hex for external hazard index and RLI for representative level index.
N238U
(Bq/kg)
232Th
(Bq/kg)
40K
(Bq/kg)
Raeq
(Bq/kg)
DR
(nGy/h)
HexRLI
Minimum4732.1207.230497.320118.33157.5580.3200.877
Maximum47396.23048.160615.320458.314214.5521.2393.148
Mean47197.21316.215543.213262.228123.7210.7081.839
Std. Deviation4792.49110.78532.62288.91541.2540.2400.586
Skewness470.1191.9130.5690.3290.3180.3290.343
Kurtosis47−0.6392.595−0.665−0.700−0.700−0.700−0.641
N—no. of samples.
Table 3. Average values of 238U, 232Th and 40K in investigated area compared with data reported by similar studies.
Country238U
(Bq/kg)
232Th
(Bq/kg)
40K
(Bq/kg)
References
This study197.2116.21543.21-
Romania (Crucea)559.791.52-[32]
Serbia (Gabrovnica)24969960[33]
China79.3101.0535.8[23]
Armenia45.6937.25294.35[1]
Nigeria63.29226.67832.59[34]
Egypt137821082[31]
Median concentration values3530400[28]
Table 4. Pearson’s correlation coefficients matrix between 238U, 232Th and 40K and Raeq, DR, Hex and RLI.
238U232Th40KRaeqDRHexRLI
238U1
232Th−0.3501
40K0.2150.0911
Raeq0.986−0.1890.2681
DR0.119−0.2020.2701.0001
Hex0.986−0.1890.2671.0001.0001
RLI0.567−0.1570.1930.5630.5640.5631
Publisher’s Note: MDPI stays neutral with regard to jurisdictional claims in published maps and institutional affiliations.