1. Introduction
The refrigeration and air-conditioning industry is calling for new pure fluids or mixtures to be used in the coming generation of HVAC equipment to tackle the Kigali Amendment to the Montreal Protocol, which states the gradually phase-out of the consumption and production of hydrofluorocarbons (HFCs). Whilst in the past years, just a few refrigerants were enough to cover different applications of the HVAC industry, a huge number of alternative refrigerants, both natural and synthetic, having lower values of global warming potentials (GWPs), are emerging nowadays.
Hydrofluoroolefins (HFOs) are a promising category of working fluids having low values of the GWP, but they are generally classified as mildly flammable (A2L flammability class). To decrease the flammability class to A1, viz., not flammable, HFOs can be properly blended with a non-flammable HFC.
R450A is a zeotropic blend made of R1234ze(E) and R134a (0.58 and 0.42 by mass, respectively), and it has been proposed as a replacement for R134a for medium- and high-temperature refrigeration applications. The presence of R134a in the mixture makes it not flammable, viz., it belongs to the A1 flammability class. On the contrary, R1234ze(E) is an HFO, thus belonging to the A2L flammability class, but it has a GWP lower than 1, so R1234ze(E) lowers the GWP of the mixture. Most of the works available in the literature considering R450A as a working fluid are related to its performance assessment in vapor cycle systems. Mota-Babiloni et al. [
1] experimentally tested R450A in a vapor compression system equipped with a variable speed compressor. The performance of R450A as a direct drop-in substitute of R134a was investigated: the cooling capacity of R450A was 6% lower on average, the COP was 1% higher, and the discharge temperature was 2 K lower. The lower cooling capacity of R450A compared to R134a in a vapor compression system was later confirmed by Makhnatch et al. [
2], but a small refrigeration unit showed CO
2 equivalent emission saving when using R450A. Other works related to the experimental analysis of R450A vapor compression systems can be found in Mendoza-Miranda et al. [
3], Gill et al. [
4], Gataric and Lorbek [
5], and Molinaroli et al. [
6], whereas the mathematical modeling of refrigeration systems implementing R450A as a working fluid can be found in Belman-Flores et al. [
7], Zendehboudi et al. [
8], and Wen et al. [
9].
The two-phase heat transfer behavior of R450A, either during condensation or during vaporization, is still not widely studied, and just a few papers can be found in the literature. Among those, Kedzierski et al. [
10] quantified the performance of four fluids, included R450A, during pool boiling on a re-entrant cavity surface. At the same wall-to-saturation temperature difference, the heat flux of R450A was, on average, 57% less than that of R134a, at heat fluxes between 30 and 110 kW m
−2. The flow boiling of R450A within a 9.5 mm OD microfin tube was studied by the same research group (Kedzierski and Kang [
11]); the results revealed that under the same working conditions, R450A had a 15% lower heat transfer performance compared to R134a. Jacob et al. [
12] conducted experiments during the condensation of R450A inside a smooth tube with an inner diameter of 4.7 mm, obtaining heat transfer coefficients and pressure drops that were successfully compared against values predicted by correlations available in the literature. A numerical analysis of R450A, as well as of R134a and R1234ze(E), condensing inside smooth tubes was performed by Liu et al. [
13], and they computed the heat transfer coefficient, liquid film distribution, local film thickness, and axial velocity.
R515B is an azeotropic mixture made of R1234ze(E) and R227ea (0.911 and 0.089 by mass, respectively). Like R450A, R515B has been proposed as a substitute of R134a, and it is classified as non-flammable (A1 flammability class) due to the presence of R227ea. Its thermal and hydraulic performance during two-phase heat transfer is almost unexplored in the literature. Just a few studies can be found regarding R515B. El-Sayyab et al. [
14] presented an energy, exergy, and environmental study of a compound ejector-heat pump system for simultaneous data center cooling and district heating; the analysis included 12 refrigerants; among those, R515B showed the most pronounced cooling coefficient of performance and the lowest exergy destruction, viz., the highest exergy efficiency. Yang et al. [
15] presented an overall comparison of different refrigerants, including R515B, for low-temperature organic Rankine cycle (ORC) systems, considering both the thermodynamic performance and the economic cost; the proposed evaluation method provided a reference for preliminary evaluation of working fluids for ORC applications. Azzolin et al. [
16] measured the heat transfer coefficients and pressure drops of R1234ze(E), R450A, and R515B during condensation inside two smooth channels with an inner diameter of 3.38 mm and 0.96 mm. Furthermore, flow pattern visualizations were recorded.
In addition to the use of new lower-GWP working fluids, more efficient heat exchangers are to be developed in order to reduce the energy consumption of air-conditioning and refrigeration equipment. In this context, microfin tubes can play a role in the enhancement of the heat transfer process: compared to a smooth tube with the same inner diameter, the heat transfer augmentation led by microfins can be higher than the pressure drop penalization, as reported in Allymehr et al. [
17] and in Diani et al. [
18]. However, while some studies are available in the literature regarding flow boiling of HFCs inside microfin tubes [
19,
20,
21,
22], more data are needed for the validation of empirical correlations able to estimate the thermal and hydraulic behavior of the new low-GWP refrigerants during two-phase heat transfer inside microfin tubes.
In this scenario, this paper presents experimental results obtained during flow boiling of R515B and R450A, as well as R1234ze(E), inside a microfin tube with an inner diameter at the fin tip of 6.14 mm. During the experimental flow boiling campaign, the mass velocity was varied between 50 and 400 kg m−2 s−1; the heat flux was set at 10, 30, and 50 kW m−2; and the vapor quality was investigated from 0.1 to 0.99, with a fixed inlet saturation temperature of 30 °C. The flow boiling of refrigerants at this high saturation temperature is used, for instance, in heat pump systems for clothes dryers, in industrial equipment that produces hot water by using waste heat as a source for the evaporator, in organic Rankine cycle systems, and in the cooling management of electronic equipment. The low tested mass velocities, which are not much investigated in the open literature, are useful to predict the flow boiling behavior of evaporators when the heat pump system, having the compressor connected to an inverter, works under reduced loads. The comparison among the three fluids is given in terms of the heat transfer coefficient and the frictional pressure gradient. The experimental values of the heat transfer coefficient and the pressure drop are then compared against the values predicted by some empirical models available in the literature in order to verify their suitability for the tested new mixtures evaporating inside the microfin tube.
2. Experimental Test Rig and Test Section
The experimental facility, which is located in the Heat Transfer in MicroGeometries Lab of the University of Padua, is a liquid pumped circuit, which allows setting the desired conditions at the inlet of the test section by adjusting the heat flow rate exchanged in a pre-condenser, which is fed by superheated vapor coming from an evaporator/superheater. The pre-condenser is a tube-in-tube heat exchanger: the refrigerant flows in the inner tube, whilst cold water, supplied by a water-cooled chiller, flows in the annulus. By controlling both the water flow rate and the temperature, it is possible to set the vapor quality at the inlet of the test section. The refrigerant mass flow rate is measured using a Coriolis effect mass flow meter, with an accuracy of ±0.1% of the reading. More details concerning the experimental facility can be found in Mancin et al. [
23]. A schematic of the experimental test rig is represented in
Figure 1.
A water-heated test section, made by the microfin tube under investigation and a smooth tube where hot water flows, was developed and created. Hot water was supplied by a thermostatic bath. A schematic of the test section is reported in
Figure 2. The microfin tube had an outer diameter of 7.0 mm and an inner diameter (
Di) at the fin tip of 6.14 mm, it had 50 fins, and the helix angle was 18°. Each fin was 0.18 mm high. A smooth tube, with an inner diameter of 1.9 mm, was wrapped around the microfin tube. Hot water, supplied by a thermostatic bath and whose volumetric flow rate was measured using a magnetic flowmeter having an accuracy of ±0.50% of the reading, flowed inside the wrapped smooth tube. An aluminum housing contained the test section, and an alloy of tin and lead was melted inside; once solidified, it filled the gap between the microfin tube and the wrapped tube. The heated length (
LHT) of the test section was 236 mm. The top side of two curves, one at the inlet and one at the outlet, hosted T-type thermocouples (denoted as
Twater,IN and
Twater,OUT in
Figure 2) for the measurements of the water inlet and outlet temperatures. Six T-type thermocouples (denoted as
Tr1,top,
Tr1,bottom,
Tr2,top,
Tr2,bottom,
Tr3,top, and
Tr3,bottom in
Figure 2) were attached on the external wall of the microfin tube to measure the wall temperature. All the implemented thermocouples presented an accuracy of ±0.05 K, and they were previously calibrated using a Pt100 thermo-resistance as the reference temperature (accuracy of ±0.03 K).
Pressure ports were soldered to the microfin tube, down- and upstream of the thermal section. The distance between the two pressure ports was 0.8 m. The upstream pressure port was connected to an absolute pressure transducer (accuracy ±1950 Pa), whereas both up- and downstream pressure ports were connected to a differential pressure transducer to measure the total pressure drop across the test section (accuracy of ±25 Pa). The entire test section was insulated with Armaflex® in order to minimize the heat losses through the ambient. This means that the two segments between the pressure ports and the part of the test section where the flow boiling occurs, i.e., where the wrapped tube is located, were considered adiabatic.
Table 1 shows the accuracy of the implemented sensors for the measurements of the physical quantities.
3. Experimental Results
3.1. Preliminary Considerations
The experimental results are shown in terms of the heat transfer coefficient and the frictional pressure gradient at the corresponding mean vapor quality.
The heat transfer coefficient is calculated as:
where
AD is the internal surface area of a smooth tube having an inner diameter equal to the diameter at the fin tip of the studied microfin tube (
AD =
Di × π ×
LHT),
is the mean wall temperature, and
is the mean saturation temperature calculated using the knowledge of inlet and outlet pressures with the software REFPROP10 [
24]. In the case of R450A, whose temperature glide is 0.64 K at 6.77 bar, the saturation temperature was calculated using REFPROP10 [
24] with the knowledge of the pressure and specific enthalpy, as already reported, for instance, by Azzolin and Bortolin [
25]. It is worth highlighting that even if the outer wall temperature is measured by the thermocouples, since the wall thickness is about 0.25 mm and the tube is made of copper, the temperature difference across the outer and inner surface is well below the experimental accuracy of the thermocouples.
qTS is the heat flow rate, exchanged in the test section, calculated on the water side using the knowledge of the water flow rate (
) and of its inlet and outlet temperatures (
tw,TS,in and
tw,TS,out), as:
where
cw is the water specific heat capacity.
The uncertainty (
iy) on a general physical quantity
y, which is a function of
n independent parameters
xi, can be calculated, as suggested by Kline and McKlintock [
26] as:
where
ii is the uncertainty on the
i-th parameter. Following this procedure, the mean uncertainty of the heat transfer coefficient was ±4.1%, with a minimum and maximum value of ±1.5% and ±10.1%, respectively.
The mean vapor quality is the arithmetic average between inlet and outlet vapor qualities. The difference between outlet and inlet vapor qualities depends on the working conditions (mass velocity and heat flux): it varies from 0.486 at the lowest mass velocity and the highest heat flux to 0.023 at the highest mass velocity and the lowest heat flux. The inlet and outlet vapor qualities can be derived from energy balances at the pre-condenser and test section, respectively:
where
href,TS,in is the refrigerant specific enthalpy at the inlet of the test section,
href,PC,in is the refrigerant specific enthalpy at the inlet of the pre-condenser, and ∆
Tw,pc is the water temperature difference at the pre-condenser, which is measured with a T-type thermopile.
is the refrigerant mass flow rate.
hL and
hV are the saturated liquid and vapor specific enthalpies, respectively, which are calculated using the knowledge of the inlet pressure (in the case of
xin) or outlet pressure (in the case of
xout). Following the procedure suggested by Kline and McKlintock [
26], the mean uncertainty on the mean vapor quality was ±0.028, whereas the minimum and maximum values were ±0.021 and ±0.039, respectively.
Experimental tests were carried out at different mass velocities and heat fluxes by varying the inlet vapor quality. Only data in saturated conditions were considered, that is, the maximum tested outlet vapor quality was around 0.99. The mass velocity is defined as the refrigerant mass flow rate divided by the cross-sectional area calculated with the fin tip diameter:
It is worth remembering that the accuracy of the Coriolis flowmeter, which measures the mass flow rate, is ±0.1% of the reading.
The heat flux is the heat flow rate exchanged in the test section divided by AD, previously defined:
The mass velocity
G was varied from 50 to 400 kg m
−2 s
−1. The heat flux
HF was set at 10, 30, and 50 kW m
−2. Following the procedure suggested by Kline and McKlintock [
26], the mean uncertainty of the heat flux was ±2.2%, whereas the minimum and maximum values were ±1.3% and ±4.1%, respectively.
About 480 data points were obtained during the experimental campaign. Every single data point derived from calculations over 100 readings taken at a frequency of 1 Hz in steady-state conditions. This means that every single datum was obtained by averaging 100 readings for each working parameter under steady-state conditions, that is, when the standard deviation of each working parameter was below the experimental uncertainty. Only some data during dryout conditions presented a standard deviation on the wall temperatures and outlet water temperature higher than the experimental uncertainty of the calibrated thermocouples, due to the intrinsic unsteady behavior of the dryout itself. Furthermore, the data set at G = 100 kg m−2 s−1 and HF = 30 kW m−2 with the refrigerant R1234ze(E) was carried out twice as a repeatability test, and the relative experimental results among the two sets were within the experimental uncertainties.
The differential pressure transducer allows measuring the total pressure drop ∆pTOT, which is equal to the sum of three contributions: friction (∆pf), momentum (∆pm), and gravity (∆pg):
The tube is horizontally located, so the gravity contribution is null (∆
pg = 0). Applying the separated flow model, the momentum contribution, which considers the acceleration effects due to the variation of the vapor quality along the thermal part of the test section, can be calculated as follows:
where
ε is the void fraction.
ρV and
ρL are the saturated vapor and liquid densities, respectively, and
x is the vapor quality. The model of Rouhani and Axelsson [
27] was implemented to evaluate the void fraction, needed in Equation (9). The frictional contribution was thus calculated as the difference between the total measured pressure drop and the calculated momentum pressure drop. Therefore, the frictional pressure drops, which will be reported later at the corresponding mean vapor quality in the test section, were not affected by the heat transfer occurring inside the microfin tube, as also shown in [
28], where frictional pressure gradients during adiabatic flow (i.e., with a negligible momentum contribution) overlapped the values carried out during two-phase heat transfer.
The percentage of the momentum pressure drop on the total pressure drop depends on the mass velocity, on the vapor quality, and on the applied heat flux: this percentage is higher at low mass velocity and high heat flux (because the vapor quality difference between inlet and outlet is higher), whereas it is lower at high mass velocity and low heat flux (because the vapor quality difference between inlet and outlet is lower). At mass velocity
G = 400 kg m
−2 s
−1, with an imposed heat flux
HF = 10 kW m
−2, the momentum pressure drops accounted for 1.6–3.7% of the total pressure drops, whereas at mass velocity
G = 100 kg m
−2 s
−1, with an imposed heat flux
HF = 50 kW m
−2, they accounted for 21.3–24.8%. Following the procedure suggested by Kline and McKlintock [
26], neglecting the accuracy of the correlation implemented for the evaluation of the void fraction, the mean uncertainty on the frictional pressure drop was ±0.5%, with a minimum and maximum value of ±0.1% and ±1.9%, respectively. Following the procedure suggested by Kline and McKlintock [
26], considering an accuracy on the calculated void fraction equal to ±0.05, the mean uncertainty on the frictional pressure drop was ±5.2%, with a minimum and maximum value of ±0.5% and ±8.4%, respectively.
Preliminary tests were run during R1234ze(E) liquid forced convection in order to verify the accuracy of the new test section. The aim of these tests was to evaluate the heat flow rate on the water side and compare it against that on the refrigerant side. The two calculated heat flow rates were within ±3 W. Furthermore, experimental heat transfer coefficients were obtained by applying Equation (1) with the mean saturation temperature replaced by the mean refrigerant temperature. The obtained experimental heat transfer coefficients were compared against the values predicted by the correlation of Gnielinski [
29] multiplied by the area enhancement ratio, and with the procedure suggested by Li et al. [
30]. The area enhancement ratio for the present microfin tube was 1.63, which is the ratio between the total inner surface area of the microfin tube and the inner area of a smooth tube having an inner diameter equal to the fin tip diameter. The mean relative deviation of Gnielinski’s model [
29] was 9.1%, whereas the mean deviation of Li et al.’s model [
30] was −1.0%. Further details about the validation of the tested tube can be found in Diani et al. [
31].
3.2. Heat Transfer Coefficients
The effects of mass velocity and vapor quality on the flow boiling heat transfer coefficient are depicted in
Figure 3 for the three tested fluids.
Figure 3a reports the case for R450A with an imposed heat flux of 10 kW m
−2. The heat transfer coefficients at
G = 50 kg m
−2 s
−1 were almost not affected by the mean vapor quality, showing a value of around 3500 W m
−2 K
−1. As the mean vapor quality increased, the vapor velocity increased, but at this low value of mass velocity, the convective mechanisms, which depend on the vapor velocity and are typical of annular flow regimes, are not involved in the phase change mechanism. As suggested by Jige et al.’s flow patterns map [
32], most of the data points at mass velocities of 50, 75, 100 kg m
−2 s
−1 were in the wavy-stratified flow. This was confirmed by the flow pattern map developed by Barbieri et al. [
33] suggested for microfin tubes by Liu et al. [
34]. However, for higher mass velocities, the heat transfer coefficients increased as vapor quality increased, highlighting an increasingly stronger contribution of convective boiling as mass velocity increased. At
HF = 10 kW m
−2, the heat transfer coefficient increased as mass velocity increased from 50 to 300 kg m
−2 s
−1, but a further increase in mass velocity does not imply anymore a higher heat transfer coefficient in the high mean vapor quality region. The flattening of the heat transfer coefficient’s curve at
G = 400 kg m
−2 s
−1 can be attributed to presence of the fins, which, due to the combined effect of heat flux and high shear stress at high vapor qualities, may be partly dried, deteriorating the heat transfer performance.
The effects of vapor quality and mass velocity were different when the applied heat flux was set at 50 kW m
−2 (
Figure 3b). First, the heat transfer coefficients in the low vapor quality region were higher than those at
HF = 10 kW m
−2. For instance, at
G = 400 kg m
−2 s
−1 and
xmean = 0.2, the heat transfer coefficient was approximately 50% higher than the correspondent value at
HF = 10 kW m
−2. This is attributed to the higher contribution of nucleate boiling because of the higher heat flux. The stronger effect of nucleate boiling seems to mitigate the effect of convective boiling; indeed, the heat transfer coefficient is almost not affected by vapor quality, and a weak effect of mass velocity can be appreciated when it increases from 150 to 400 kg m
−2 s
−1. On the contrary, the effect of mass velocity was highlighted when mass velocity increased from 100 to 150 kg m
−2 s
−1, mainly due to an early fully dryout at
G = 100 kg m
−2 s
−1. The fact that the heat transfer coefficient does not dramatically decrease at high vapor quality does not imply that dryout does not occur: the reported heat transfer coefficients are an average value along the test section, and only the last part of the test section may experience dryout conditions. Furthermore, it is proven from the open literature [
35,
36,
37,
38] and from our results that microfin tubes tend to make the onset of dryout happen at higher vapor qualities compared to a smooth tube under the same working conditions.
Figure 3c–f report the experimental heat transfer coefficients for R515B and R1234ze(E). The trend was similar at
HF = 50 kW m
−2, i.e., the heat transfer coefficients were weakly affected by vapor quality, since it is a condition where nucleate boiling plays an important role; the effect of mass velocity was weak in the mass velocity range 150–400 kg m
−2 s
−1, whereas the heat transfer coefficients were lower at
G = 100 kg m
−2 s
−1. The main difference among the three tested fluids is related to the effect of vapor quality on the heat transfer coefficients at low heat flux and high vapor quality, where convective boiling is the main heat transfer mechanism. R515B and R1234ze(E) seem to be fluids with better convective features, compared to R450A, i.e., they presented a higher value of vapor velocity at the same mass velocity, compared to R450A, due to their lower vapor densities. As a result, they presented higher values of the heat transfer coefficient at high vapor quality and high mass flux.
Furthermore, it is interesting to highlight that even though the three tested fluids had slightly different thermophysical properties, as shown later, the vapor quality differences between the inlet and the outlet of the test section were quite similar for the three refrigerants. This is due to the similar latent heats of vaporization, which were about 166 kJ kg
−1, 158 kJ kg
−1, and 163 kJ kg
−1, at a saturation temperature of 30 °C, for R450A, R515B, and R1234ze(E), respectively.
Table 2 shows the vapor quality variations for the data reported in
Figure 3.
A more detailed comparison between R450A, R515B, and R1234ze(E) can start from the analysis of
Table 3, which reports the main thermophysical properties of the three refrigerants at a saturation temperature of 30 °C. Being an azeotropic mixture made of 91.1% of R1234ze(E) by mass, R515B has properties close to those of R1234ze(E), and this was later reflected also in the experimental results of the heat transfer coefficient and the frictional pressure drop. R450A is a refrigerant that, among the three fluids tested here, has the most diverse properties. R450A has a higher vapor density, with a consequent lower vapor velocity at the same mass velocity, which is reflected in the convective behavior. R450A has a higher reduced pressure, which implies a higher nucleate boiling contribution to the phase change mechanism.
The different effects of the heat flux and mean vapor quality of R450A and R1234ze(E) on the heat transfer coefficient are shown in
Figure 4, which reports the heat transfer coefficient plotted versus the mean vapor quality for a mass flux of 150 kg m
−2 s
−1 at three different heat fluxes for R450A (
Figure 4a) and R1234ze(E) (
Figure 4b). As already stated in the analysis of the thermophysical properties reported in
Table 3, R450A has properties that enhance the nucleate boiling effects compared to R1234ze(E) and R515B, whereas R1234ze(E) and R515B have properties that enhance the convective boiling contribution. Indeed, there is a strong effect of the heat flux on the heat transfer coefficients collected for R450A until a mean vapor quality of about 0.8: the higher the heat flux, the higher the heat transfer coefficient. At a mean vapor quality of 0.3, the heat transfer coefficients at
HF = 30 and 50 kW m
−2 were approximately 37% and 59% higher, respectively, than those at
HF = 10 kW m
−2. At a heat flux of 10 kW m
−2, the heat transfer coefficient at
xmean = 0.8 was approximately 63% higher than that at
xmean = 0.3.
The behavior is different for R1234ze(E). The experimental results showed a weaker effect of the heat flux for R1234ze(E) compared to R450A: at a mean vapor quality of 0.3, the heat transfer coefficients at HF = 30 and 50 kW m−2 were approximately 5% and 20% higher, respectively, than those at HF = 10 kW m−2. The higher convective boiling contribution could be particularly seen from the trend of the heat transfer coefficient at HF = 10 kW m−2: the heat transfer coefficient at xmean = 0.8 was approximately 75% higher than that at xmean = 0.3. The trend of R515B has not been reported in the figure because it is similar to that of R1234ze(E). Furthermore, the higher surface tension of R1234ze(E), compared to R450A, facilitates the retention of liquid in the throat between two adjacent microfins, enhancing the heat transfer mechanism, especially at HF = 10 kW m−2, i.e., when dryout effects are small.
A direct comparison between R450A, R515B, and R1234ze(E) is shown in
Figure 5, which reports data at
HF = 10 kW m
−2 (
Figure 5a) and at
HF = 50 kW m
−2 (
Figure 5b), considering the lowest and highest mass velocities tested for each heat flux. R515B and R1234ze(E) showed similar values of the heat transfer coefficient at both
HF = 10 and 50 kW m
−2; indeed, these two fluids have similar thermophysical properties. At
HF = 10 kW m
−2 and
G = 400 kg m
−2 s
−1, which is a condition where convective boiling highly affects the phase change process, R515B and R1234ze(E) had considerable higher heat transfer coefficients compared to R450A, due to its weaker convective properties. The situation changed at
HF = 50 kW m
−2, in particular at
G = 100 kg m
−2 s
−1, which is a condition where nucleate boiling plays a strong role in the flow boiling process: The properties more favorable to nucleate boiling of R450A seem to mitigate its properties less favorable to convective boiling, and as a result, the heat transfer coefficients of R450A are close to those of R515B and R1234ze(E).
3.3. Frictional Pressure Gradients
This section presents the results regarding frictional pressure drops. The following figures present the frictional pressure gradients, obtained by subtracting the momentum term from the total measured pressure drop, dividing the result for the distance between the pressure ports, which is equal to 0.8 m.
Figure 6 shows the frictional pressure gradient as a function of the mean vapor quality. It reports data for R450A, and the trend was similar for R515B and R12345ze(E) anyway. The results are reported for a heat flux of 50 kW m
−2 at
G = 100, 150, 200, and 300 kg m
−2 s
−1, whereas all the three heat fluxes are reported for a mass velocity of 400 kg m
−2 s
−1. The frictional pressure gradients at
G = 100 kg m
−2 s
−1 were those that were less affected by the mean vapor quality; indeed, as previously reported, most of the data at this mass velocity were in the stratified flow regime. The classical two-phase pressure drop behavior was confirmed: at constant vapor quality, the frictional pressure gradient increased as mass velocity increased. At constant mass velocity, the frictional pressure gradient increased as vapor quality increased, reaching a maximum value at high vapor quality, after which it decreased as vapor quality further increased. The decrease after the peak is due to liquid entrainment: some liquid droplets were entrained in the liquid phase at high vapor quality during shear-stress-dominated flow regimes, and this is similar to the effect of higher reduced pressure. Moreover, the liquid interface roughness decreased at high vapor qualities. The figure also shows the effect of heat flux. Only the case at
G = 400 kg m
−2 s
−1 is reported in the figure, but it was similar for the other mass velocities. The heat flux had no effect when the frictional pressure gradient linearly increased with vapor quality. It slightly affected the frictional pressure gradient in the high-vapor-quality region, near the peak of the curve, mainly due to the different vapor quality difference in the test section, at the three heat fluxes, associated with the reported mean vapor quality.
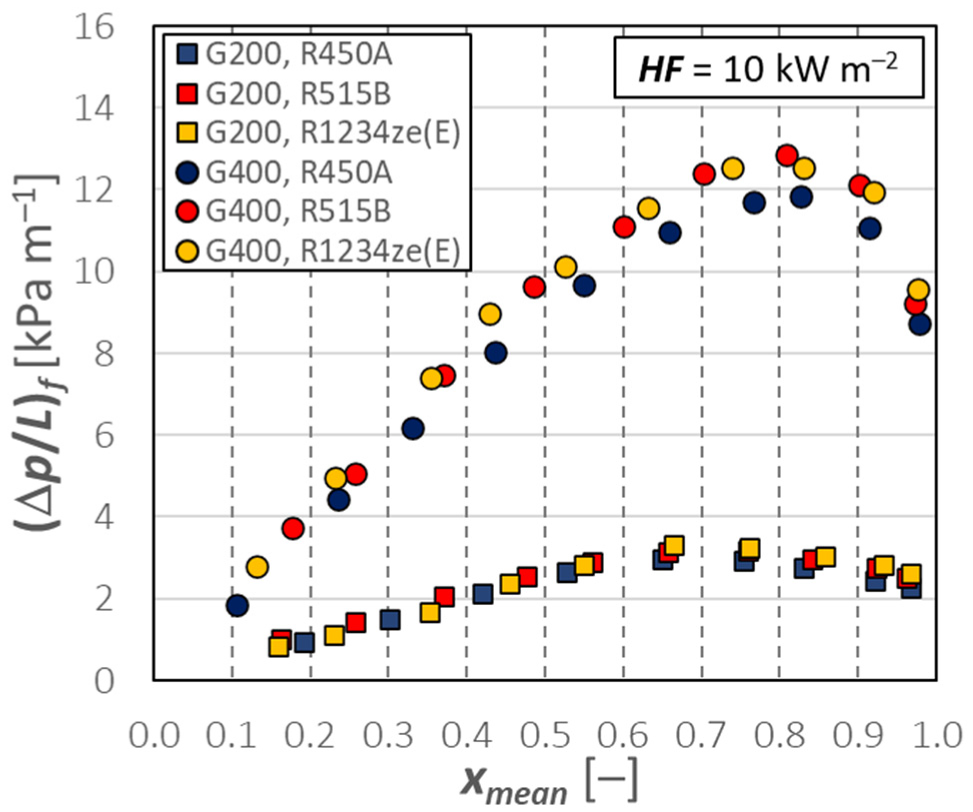
The two-phase trend was similar among the three tested refrigerants but with different values. A comparison among the hydraulic behaviors of R450A, R515B, and R1234ze(E) is proposed in
Figure 7. The figure shows data with mass velocities of 200 and 400 kg m
−2 s
−1, with an imposed heat flux of 10 kW m
−2. First, the flow regimes were almost the same for the three refrigerants under the same working conditions, so the majority of the data at
G = 200 kg m
−2 s
−1, and even more at
G = 400 kg m
−2 s
−1, were in annular flow regime. R515B and R1234ze(E) showed similar values of the frictional pressure gradient, whereas the values of R450A were approximately 7% lower at
G = 400 kg m
−2 s
−1. Indeed, the vapor density of R450A was the highest among the three tested fluids (see
Table 3): it was about 10% and 13% higher than that of R515B and R1234ze(E), respectively. Thus, at constant mass velocity, R450A has a lower vapor velocity, which leads to lower frictional pressure gradients.
4. Empirical Modeling
The experimental values of the heat transfer coefficient and frictional pressure drop were used to verify some empirical models available in the literature. In particular, for R450A and R515B, since their experimental data during flow boiling inside microfin tubes are new in the literature, there is a need to verify empirical correlations to be confidently used for the design of enhanced evaporators implementing these new refrigerants as working fluids.
To evaluate the accuracy of the implemented correlations, the relative deviation (devrel) and the absolute deviation (devabs) were used and defined in the following:
ycalc and yexp are the calculated and experimental generic quantities (heat transfer coefficient or frictional pressure drop), respectively.
The experimental data of the heat transfer coefficient were compared against the values estimated by the following empirical models taken from the open literature: Diani et al. [
39] and Rollmann and Spindler [
40]. Only data prior to a fully dryout condition were considered for the comparison, as well as only data having a wall-to-saturation temperature difference higher than 0.8 K, in order to exclude experimental values with higher uncertainty. Considering all the three fluids, the model of Diani et al. [
39] was able to estimate the experimental values with a relative and absolute deviation of −5.5% and 8.9%, respectively, and the model of Rollmann and Spindler [
40] with a relative and absolute deviation of 0.7% and 20.4%.
Table 4 summarizes the relative and absolute deviations of the implemented models split for each tested refrigerant. Data at
G = 50 and 75 kg m
−2 s
−1 were omitted in the comparison, since they were in the wavy-stratified flow regime and they were outside from the range of working conditions of the implemented correlations.
Among the tested empirical models, the model developed by Diani et al. [
39] is the one that better predicts the experimental values of the heat transfer coefficients. The model was developed from an experimental database comprising data during flow boiling of R1234ze(E) inside a microfin tube with an inner diameter at the fin tip of 3.4 mm, and the authors proposed a correlation for the prediction of the heat transfer coefficient in the pre-dryout region. The model was validated with data covering mass velocities from 190 to 940 kg m
−2 s
−1 and heat fluxes from 10 to 50 kW m
−2. The model considers the contribution of nucleate boiling and convective boiling, as well as the geometrical parameters of the microfin tube. A general overview of the accuracy of the model is given in
Figure 8.
It is worth noting that experimental data with low mass velocities below 100 kg m
−2 s
−1 are scarce in the literature. Therefore, a specific model developed by Cavallini et al. [
41] was chosen to analyze these data. Data at
G = 50 and 75 kg m
−2 s
−1, prior to the onset of dryout, were compared against the values estimated with the correlation developed by Cavallini et al. [
41], which was later reported by Padovan et al. [
38]. For mass velocities lower than 100 kg m
−2 s
−1, this correlation considered the contribution of capillarity for the evaluation of the heat transfer coefficient. Considering only the experimental data at
G = 50 and 75 kg m
−2 s
−1, the correlation was able to estimate the experimental data of R450A, R515B, and R1234ze(E), with a relative and absolute deviation of 4.3% and 29.3%, respectively.
Since R450A is a zeotropic mixture, the concentration of the components in the liquid and vapor phases changes during the flow boiling process, and the local saturation temperature increases as the phase change mechanism proceeds. However, since the temperature glide is small (approximately 0.6 K), the increase in the bubble temperature due to temperature glide is somehow mitigated by the saturation temperature drop caused by the pressure drop, so the added heat flow rate needed to heat the liquid and vapor phases toward the dew temperature can be neglected.
According to Thome [
42], the flow boiling heat transfer coefficient can be estimated by correcting the nucleate boiling contribution for mass diffusion effects with a correction factor (
FC):
where
FC can be estimated as [
42]:
with:
The mass transfer coefficient
βL was set by Thome [
42] as equal to 0.0003 m s
−1.
HTCfb,id is the flow boiling heat transfer coefficient calculated as if the mixture were a pure fluid. According to Thome [
42], the local nucleate boiling heat flux,
qnb, can be approximated with the total heat flux. ∆
T is the temperature glide of the mixture, and ∆
hm is the enthalpy of isobaric vaporization. Considering the effect of the temperature glide of R450A on the prediction of the model developed by Diani et al. [
39], the relative and absolute deviations were −0.3% and 7.2%, respectively, whereas they were −0.8% and 5.5%, respectively, by neglecting
FC. Due to the small temperature glide, the correction factor
FC, which multiplies the nucleate boiling contribution, presented a mean value of 0.95, and as a result, it could be neglected in the case of R450A.
The flow boiling heat transfer coefficient can be seen as the sum of a term due to nucleate boiling and a term due to convective boiling, but it is not possible to distinguish the two contributions from the experimental tests. Since the model of Diani et al. [
39] is the one that better predicts the experimental heat transfer coefficients, it was implemented here to estimate the effects of both nucleate boiling and convective boiling.
Figure 9a,b show the effect of heat flux on the two contributions for a mass flux of 100 kg m
−2 s
−1 (
Figure 9a) and 400 kg m
−2 s
−1 (
Figure 9b) for R515B and R450A. The two contributions had an opposite trend with respect to vapor quality. Convective boiling was highly affected by the vapor quality, and it increased as vapor quality increased: the estimated heat transfer coefficient due to convective boiling at a mean vapor quality of 0.8 was about 2.2 times the value at a mean vapor quality of 0.2. On the contrary, the effect of nucleate boiling decreased as the vapor quality increased. The comparison between the fluids confirmed what highlighted from the analysis of the experimental data, i.e., R515B has a stronger convective boiling contribution compared to R450A: the convective boiling heat transfer coefficient of R515B was about 18% higher than that of R450A. The analysis of
Figure 9a,b revealed that the heat flux has no effect on the estimated convective boiling contribution, whereas it highly affects the nucleate boiling contribution: considering a mean vapor quality of 0.4, the nucleate boiling heat transfer coefficient at
HF = 50 kW m
−2 was 3.1 times the value at
HF = 10 kW m
−2 in the case of R450A, whereas it was 2.8 times in the case of R515B. Moreover, it appears that R450A had a stronger contribution of nucleate boiling compared to R515B.
Figure 9c,d show the effect of mass velocity on the two contributions at
HF = 10 kW m
−2 (
Figure 9c) and at
HF = 50 kW m
−2 (
Figure 9d) for R450A and R515B. The heat transfer coefficient due to convective boiling at
G = 400 kg m
−2 s
−1 was, on average, 19% higher than that at
G = 100 kg m
−2 s
−1, and R515B showed a convective boiling contribution that was 20% higher compared to R450A.
In addition to models for the estimation of the heat transfer coefficients, models for the evaluation of frictional pressure drops are needed for a complete design of evaporators. The following models were selected for the comparison against the experimental data: Kedzierski and Goncalves [
43], Diani et al. [
39], and Rollmann and Spindler [
40]. Only data characterized by an experimental pressure gradient higher than 0.5 kPa m
−1 were considered in the following comparisons in order to omit data with high experimental uncertainty. The model of Kedzierski and Goncalves [
43] considers the homogeneous model for the momentum term and a friction factor that considers the presence of fins for the frictional contribution; considering the three fluids, the model was able to predict the experimental pressure drop with a relative and absolute deviation of −12.1% and 20.5%, respectively. The models of Diani et al. [
39] and of Rollmann and Spindler [
40] estimate the frictional pressure drop; considering the three fluids, the model of Diani et al. [
39] presented a relative and absolute deviation of −4.6% and 11.1%, respectively, whereas the model of Rollmann and Spindler [
40] presented a relative and absolute deviation of −8.2% and 20.4%, respectively.
Table 5 summarizes the relative and absolute deviations of the implemented models split for each tested refrigerant.
Figure 10 reports the calculated frictional pressure gradient plotted against the experimental counterpart for the model developed by Diani et al. [
39], which presents the lowest deviations.


