1. Introduction
With the rapid development of wireless communication technology, the 5G era has arrived. Operator services are gradually transforming from traditional services for the general public to customized services for business customers. Compared with existing traditional networks, private 5G networks have the characteristics of diversification, refinement, and certainty. The business scenarios in 5G involve various industrial firms with more complex and diverse terminal modes, which results in a significant increase in the business requirements for network performance indicators. According to the relevant survey report, the custom network for vehicle networking requires the latency of the vehicle-to-vehicle (V2V) service to be less than 200 ms. A minimum latency of 30 ms is required for automated guided vehicles (AGVs) in a smart factory, whereas the latency of a smart grid application scenario is the most sensitive, having a threshold of less than 15 ms. The impacts of not meeting these thresholds include large-scale production downtime, business interruptions, serious economic losses, and even personnel safety risks.
Also in the actual production of the existing network, such a massive system of customized communication systems faces many challenges. The existing network operations and maintenance (O&M) methods mainly rely on manual experience accumulation, which cannot realize the early warning of faults or proactively defend against fault occurrence. At the same time, the difficulty of O&M through manual experience alone has increased significantly because of the existence of multiple alarms behind the single-alarm phenomenon caused by the virtualization of 5G technology deployment, as well as the explosive growth of monitoring data in the O&M system due to refined management. The long anomaly location cycle and difficulty of root cause tracing seriously affect productivity and customer experience. In the face of these factors, there is an urgent need for efficient, rapid, accurate, and low-cost approaches to meet the growing demand for digital O&M.
The concept of data-driven artificial intelligence for IT operations, intelligent operations, and maintenance (AIOps) [
1] was presented in 2016 and has become a trending research direction, aiming to solve the low efficiency of O&M caused by inexperience. It combines traditional O&M with artificial intelligence algorithms, big data and artificial intelligence, and other methods to improve the network’s O&M capabilities and reduce human interference in the O&M, with the ultimate goal of achieving unmanned and fully automated O&M. In 2018, the white paper “Enterprise AIOps Implementation Recommendations” was jointly initiated and developed by the Efficient Operations and Maintenance community and the AIOps Standard Working Group [
2].
Based on the research work in [
3], most existing intelligent O&M frameworks are based on machine learning methods, which mainly include the following three aspects: anomaly detection, anomaly localization, and abnormal early warning. Specific research is presented in the related work in
Section 2. Most research in the field of anomaly monitoring determines whether an abnormal state exists at the current moment by calculating the error between the current and normal intervals. Based on association rule mining or decision trees, which are mature algorithms in anomaly localization, data of the top-ranked dimension can be returned by ranking the channel anomalous factors (or errors) within the anomaly duration or by reducing the search space complexity through algorithm design. However, existing anomaly localization studies mainly focus on research from the perspective of supervised classification, which is contrary to the background of most unlabeled data in the actual production environment. Abnormal early warning studies focus on regression prediction for time variable series or by matching the real-time data distribution with failure rules to obtain the probability of failure occurrence. After thorough research, it was unfortunately found that the progress of intelligent O&M research lies only in the field of scientific research, and there are still some difficulties in combining the algorithms of academia with the domain knowledge of the industry and applying them to actual industrial production scenarios.
In the early stage of this study, we completed the construction of the data monitoring platform for private 5G networks and found that the abnormal phenomenon of AGVs driving is strongly related to high latency, but the current O&M is based on manual experience or simple data analysis, but the latency-sensitive scenario requires strong timeliness. Therefore, based on the China Telecom network data platform, this study proposes an anomaly detection and abnormal early warning models for AGV’s abnormal driving scenarios in private 5G networks, which efficiently detects high latency using the proposed model (the ConvAE-Latency model). Based on this, the LstmAE-TL model is proposed to realize abnormal early warning with a 15 min interval using the characteristics of long short-term memory (LSTM). Simultaneously, transfer learning was used to solve the problem in which loss cannot converge in the training process of abnormal early warning detection owing to the small sample size. However, during data analysis, it was found that the percentage of abnormal samples was few, owing to private 5G networks running smoothly. Considering that the clustering of few samples cannot prove the correlation in the same class, we only studied anomaly detection and abnormal early warning, and anomaly location was not considered.
The main contributions of this study are as follows:
Instead of simulation data [
4], the training data of proposed models are from the China Telecom network data platform, and the practicability of the ConvAE-Latency and LstmAE-TL models is verified.
Considering latency fluctuation as the important indicator for anomaly detection, compared to other methods [
5,
6], the ConvAE-Latency model uses the latency fitting module to enhance the correlation between target indicators and hidden features.
Transfer learning is applied to solve the problem of fewer abnormal data samples; because of the smooth running of private 5G networks, compared to related works [
7,
8], the LstmAE-TL model works better.
The remainder of this paper is organized as follows:
Section 2 introduces state-of-the-art background information and studies,
Section 3 introduces the method used in this study, and
Section 4 shows the dataset and experimental results. Finally,
Section 5 concludes the paper and discusses future research directions.
3. Proposed Methods
3.1. Framework
As private 5G networks are the key development direction of operators for business customers, compared with public users, private networks have more demanding requirements for various types of performance. Once faults occur, industrial production will be significantly affected; therefore, timely and efficient troubleshooting is particularly important. This poses a challenge to O&M of private 5G networks. It is needed to quickly diagnose or predict faults based on high-dimensional data of networks and services to reduce the impact of network faults on services.
Based on this research direction, we investigate the limitations of private 5G networks O&M and find that most business scenarios focus on latency-sensitive AGVs and band-width-sensitive video transmission. According to the feedback of O&M staff, AGVs demonstrating abnormal driving behavior occurred several times. Considering that this is highly correlated with the high latency, the O&M staff deployed a probe to private 5G network parks to obtain monitor data. The result shows that, when the AGVs work abnormally, the latency of private 5G network is higher than the specified threshold.
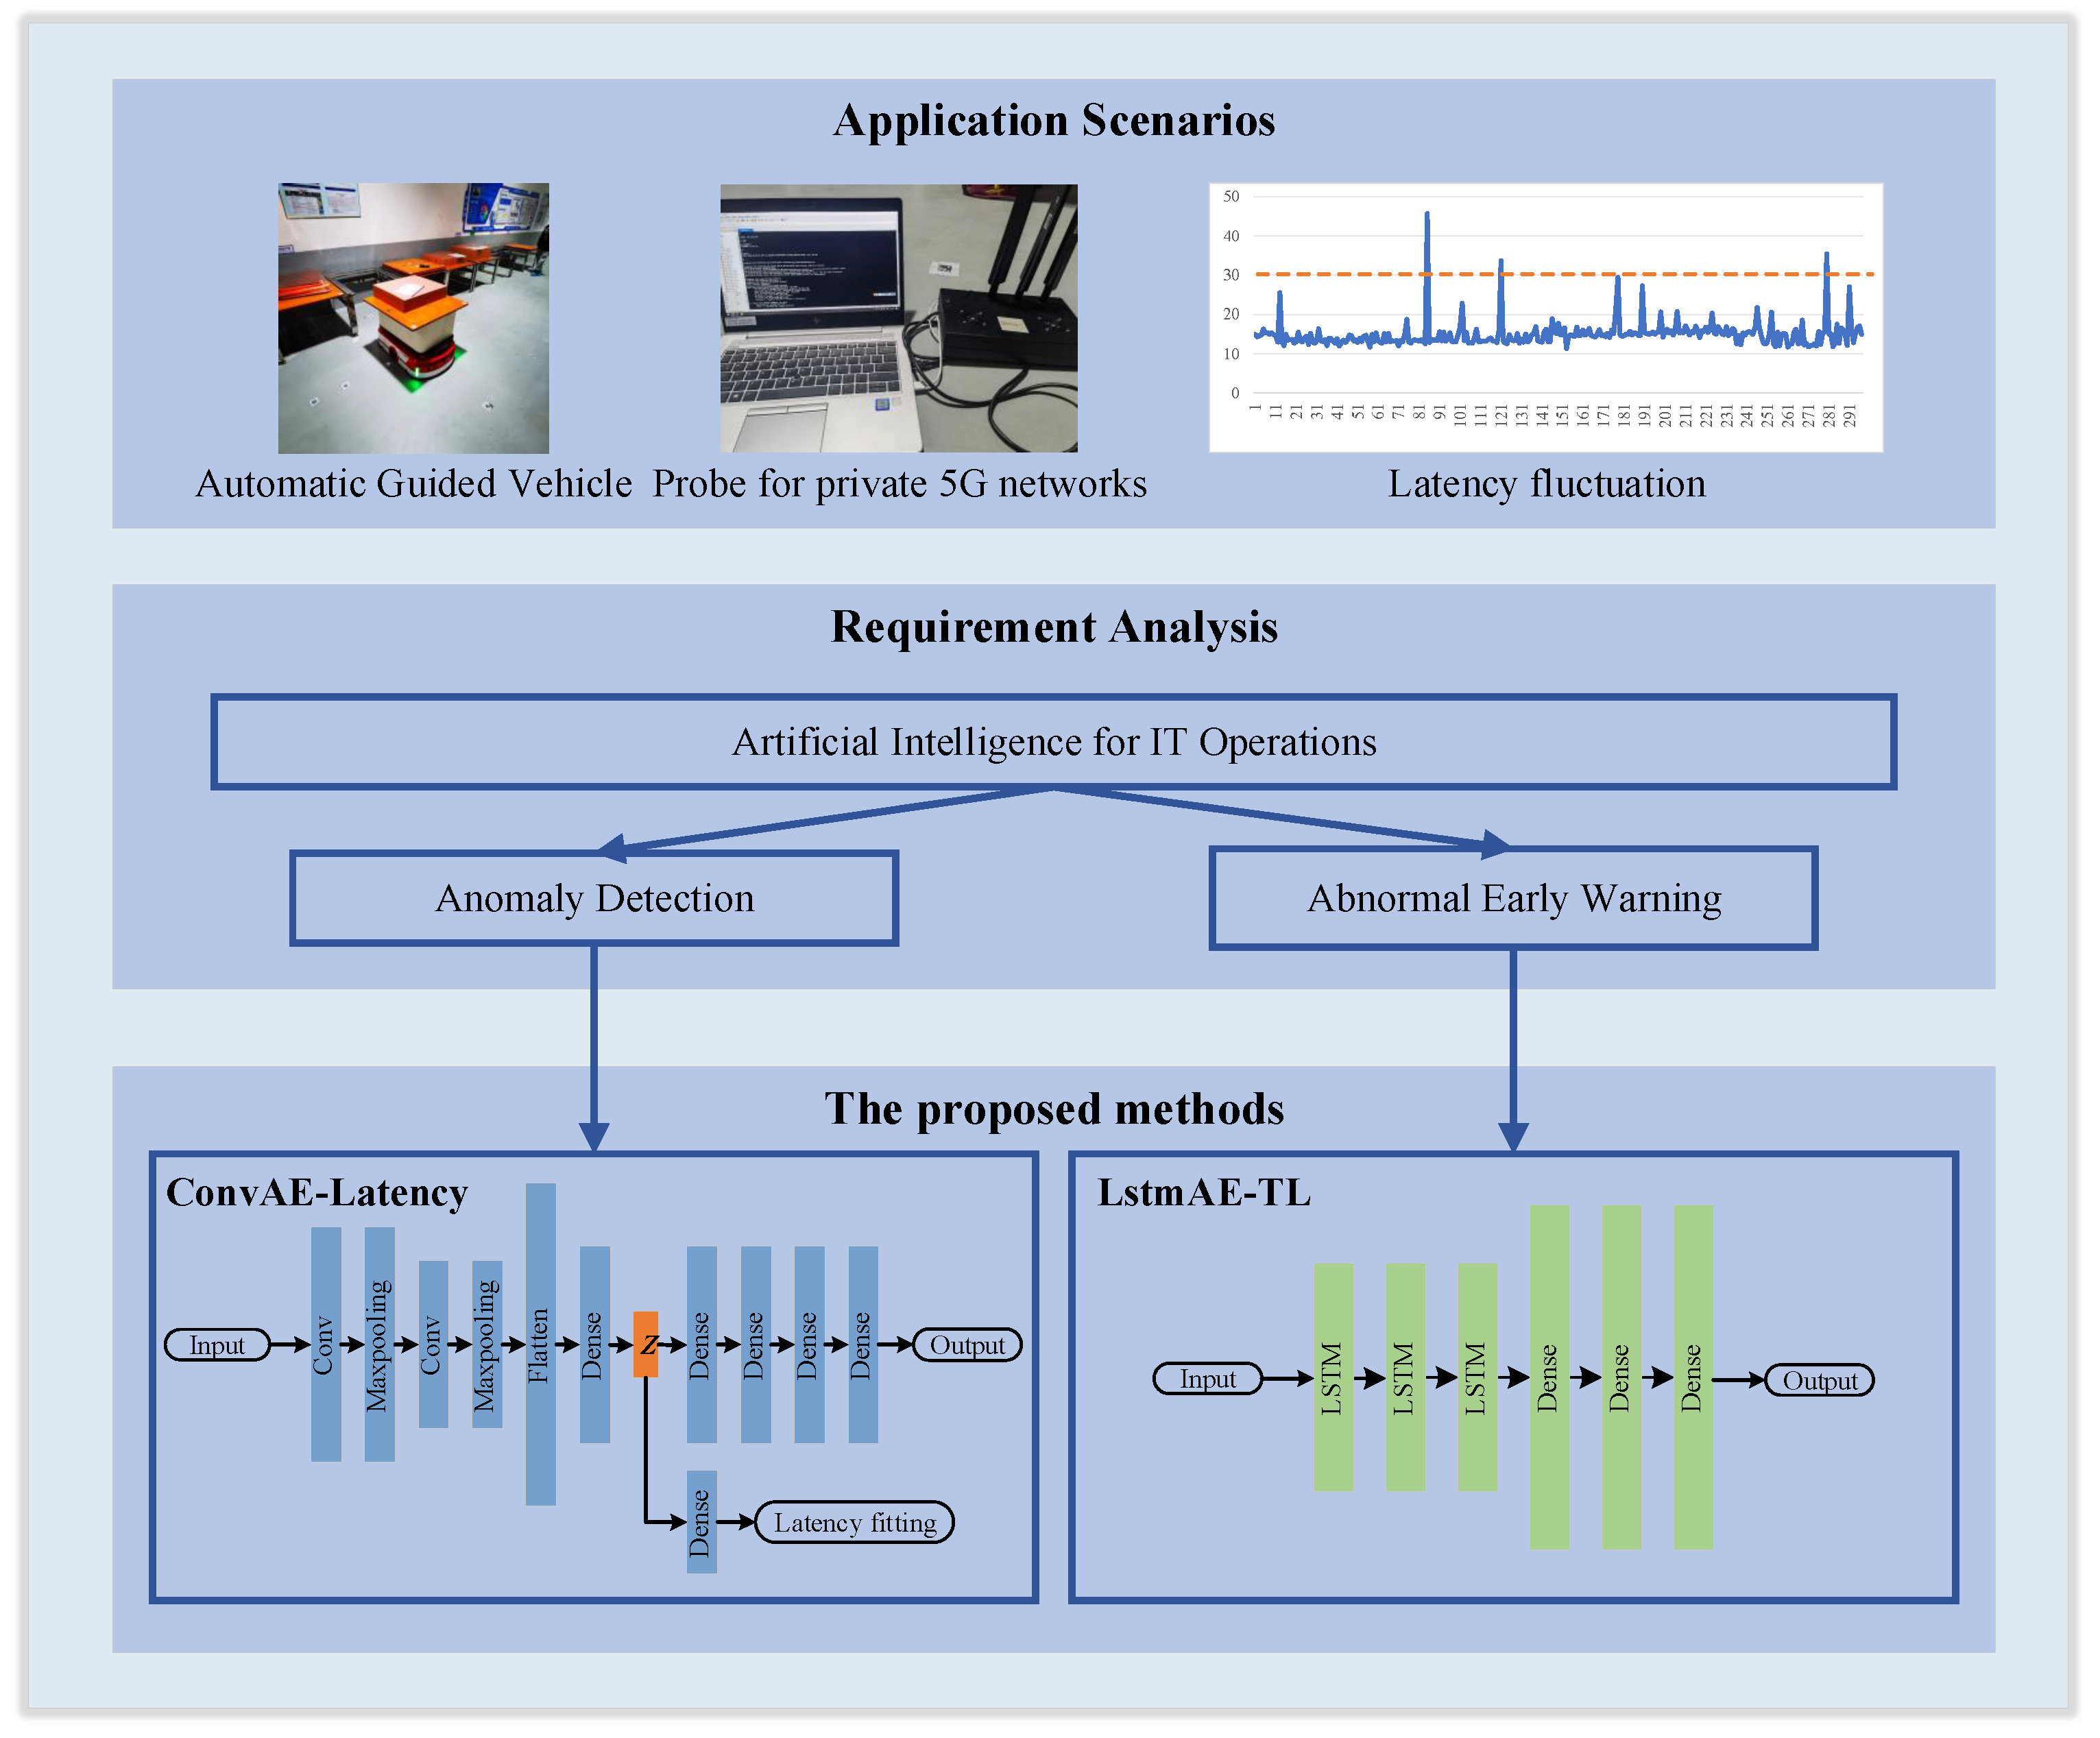
Regarding the latency-sensitive scenario in private 5G networks, this study proposes an intelligent O&M framework, as shown in
Figure 1, including anomaly detection and early warning models. First, based on the wireless data of private 5G networks, an anomaly detection model (ConvAE-Latency) based on an autoencoder network is proposed to detect whether the latency of network is high by calculating reconstruction error. Moreover, based on the ConvAE-Latency model, the LstmAE-TL model based on LSTM is proposed, which can predict abnormal behavior after 15 min. In addition, transfer learning was used in the training process of LstmAE-TL to solve the problem of low learning speed and difficult convergence because of a limited number of samples.
3.2. Anomaly Detection
Traditional O&M methods is based on periodic inspection, assign work. Problems exist such as low efficiency and lack of timeliness of resource placement; thus, non-preventive O&M fails to meet the needs of private 5G network. The use of artificial intelligence and big data and other new technologies to achieve active, rapid, and accurate detection is a new trend in the development of O&M.
As the autoencoder is trained as a neural network with unsupervised learning, it can reconstruct the original data by hidden features, and the reconstructed data are made closer to the original data by iterative training. If input data are anomaly, the distribution of reconstruction error is different. Based on this, we propose an autoencoder-based anomaly detection model (ConvAE-Latency) for anomaly detection of latency-sensitive scenarios in private 5G networks. The wireless data of base station are used for training, while probed latency is used for labeling to distinguish normal and abnormal samples. Significantly, only normal samples are used to train, and the results show the ConvAE-Latency model can reconstruct normal data well, while the abnormal samples are detected.
The network architecture of the ConvAE-Latency model is shown in
Figure 2. It consists of three parts: an encoder, decoder and latency classification network. For the encoder, two convolutional layers are used for dimensionality reduction because of the large dimensionality of the wireless parameters on the base station side, and the training algorithm for the ConvAE-Latency model is shown in Algorithm 1. The encoder maps an input vector
to a hidden representation
by a an affine mapping following a nonlinearity, as shown in Equation (
1). Subsequently, the decoding process shown in Equation (2) also maps the potential spatial representation of the hidden layer back to the original input space as the reconstructed output through the nonlinear transformation. The reconstruction goal is given by Equation (3), the difference between the original input vector
and the reconstruction output vector
. Notably, the reconstruction–error distribution of abnormal samples should be as far away from the normal samples as possible:
where
,
,
m represents the wireless parameter dimension, and
n represents the number of samples.
and
are the weight matrix and bias vector of the neural network, respectively, and
k denotes the nonlinear activation function.
Considering latency as target indicators in this scenario, the correlation with the hidden features
z needs to be enhanced. In addition to reconstructing input, dense networks are used to construct the latency classification network, which ensures that
z is strongly correlated with the latency, using the binary cross-entropy loss function with the function set, as shown in Equation (
4):
where
denotes the label of sample
, that is, the positive class is 1, the negative class is 0, and 30 ms is used as the classification threshold.
denotes the probability that sample
i is judged to positive class.
| Algorithm 1 The ConvAE-Latency model training algorithm |
| Input: Dataset , label y |
| Output: Encoder , decoder , classification |
- 1:
Initialization parameters; - 2:
repeat - 3:
; - 4:
; - 5:
; - 6:
; - 7:
Update parameters according to combination of and L; - 8:
until Convergence of parameters
|
As shown in Algorithm 2 and
Figure 3, the ConvAE-Latency model is implemented as follows:
| Algorithm 2 The ConvAE-Latency model based anomaly detection algorithm |
| Input: Dataset , threshold k |
| Output: The results of anomaly detection |
- 1:
Pre-training ConvAE-Latency model obtained from Algorithm 1; - 2:
Calculate reconstruct result; - 3:
Calculate reconstruction error; - 4:
if > k then - 5:
is an anomaly; - 6:
else - 7:
is not an anomaly; - 8:
end if
|
3.3. Abnormal Early Warning
3.3.1. Network Architecture
In the previous section, we proposed the ConvAE-Latency model, which can effectively shorten the O&M troubleshooting time, compared with manual experience-based O&M methods. However, it only detects the current network status. To further enhance the intelligence of O&M in private 5G networks, abnormal early warning is expected. The possible abnormality is predicted before the network faults occur, so staff can prepare preventive measures as well as maintenance in advance to avoid or reduce the loss caused by the network faults.
LSTM has a memory function in the time dimension, which is often used in prediction schemes based on historical messages. Therefore, based on the ConvAE-Latency model, this study proposes a transfer-learning-based abnormal early warning model (LstmAE-TL), as shown in
Figure 4. The model is divided into two parts: the LSTM-based prediction network and ConvAE-Latency model. The specific structure is described as follows.
The first part of the proposed model consists of a three-layer LSTM network and dense networks; input data are the same as that for the ConvAE-Latency model. It is noteworthy that the input data need to be obtained by a sliding window algorithm. The output of the first part is the prediction of the wireless data
for the next period. The reconstructed function is given by Equation (
5). Subsequently,
is fed into the previously trained ConvAE-Latency model to predict whether there is high latency, which is the final output. However, the ConvAE-Latency model is frozen and not trained here in order to fit the real situation better because inaccurate prediction will affect its judgment. It is worth noting that the latency fitting module of ConvAE-Latency is not used. The training algorithm for the LstmAE-TL is shown in Algorithm 3:
where
,
m represents the wireless parameter dimension, and
n represents the number of samples.
| Algorithm 3 The LstmAE-TL model training algorithm |
| Input: Normal dataset , anomaly dataset |
| Output: Prediction network |
- 1:
Pre-training ConvAE-Latency model obtained from Algorithm 1; - 2:
Initialization parameters; - 3:
repeat - 4:
Calculate predict error by only ; - 5:
Calculate reconstruction error of the predict result of by ConvAE-Latency model; - 6:
Update parameters according to combination of and ; - 7:
until Convergence of parameters - 8:
Freeze part of parameters in ; - 9:
repeat - 10:
Calculate predict error by mix and part of ; - 11:
Update parameters according to combination of ; - 12:
until Convergence of parameters
|
As shown in Algorithm 4 and
Figure 5, the implementation process of the LstmAE-TL model is as follows:
| Algorithm 4 The LstmAE-TL model based abnormal early warning algorithm |
| Input: Dataset , threshold k |
| Output: The results of abnormal early warning |
- 1:
Pre-training ConvAE-Latency model obtained from Algorithm 1; - 2:
Prediction network ; - 3:
Calculate reconstruction error; - 4:
if > k then - 5:
is an anomaly; - 6:
else - 7:
is not an anomaly; - 8:
end if
|
3.3.2. Transfer Learning
For any system, the abnormal state has a small probability compared with normal functionality, and the application scenarios of private 5G networks require high-reliability services, which determines that it is a highly reliable system itself, and its abnormal state is highly improbable. Therefore, the number of anomalous samples is too small in proportion to the samples of normal cases, leading to difficult training of the network and difficulty in fitting the anomalous part of the samples, which is usually referred to as few-shot learning.
For the few-shot learning of anomalous samples, this study used transfer learning to solve this problem. The idea of transfer learning comes from human analogy learning, which aims to apply features learned from a high-quality dataset to other datasets under similar domains. In the environment of this study, although there is a gap between abnormal sample features and normal sample features, both occur in the same network environment and their feature extraction processes are similar; therefore, transfer learning can be used to apply the feature extraction framework learned from normal samples to abnormal samples to improve the accuracy of abnormal sample prediction.
In the previous section, a three-layer dense network was proposed as the temporal feature extraction of wireless base station data and is the shared network part of normal and anomalous samples, which was trained using transfer learning which is not consistent with the training method of anomaly detection. First, the proposed model is trained with normal samples to obtain a prediction network with good performance. Then, the LSTM of LstmAE-TL is frozen and trained again with a small number of normal samples mixed with anomalous samples to achieve accurate prediction of the anomalous part.
3.3.3. Data Sensitivity Analysis
In essence, the proposed abnormal early warning model can be considered a joint composition of two independent networks, and both are trained using the same dataset. Due to the poor quality of the few data present in the dataset, both networks produce large errors, and the errors of both will further superimpose on each other, leading to serious degradation of the model performance.
However, because the two networks are trained separately, the information between them is not interoperable, which leads to the fact that, although the final result error of both networks is small, the locations where the errors are generated are different, which significantly magnifies the small errors in the process of cross-network transfer, thus affecting the performance.
To solve the above two problems, in this study, the loss function of the autoencoder with fixed weights is added as the judgment basis during the training of the LSTM network, that is, it is not only required that the prediction results obtained by the LSTM conform to the true distribution but also that the prediction results can be correctly coded and decoded by the autoencoder.
4. Analysis of Results
4.1. Data Set Description
The dataset was selected from the downlink network status data of a single DU under the exclusive base station of private 5G networks, totaling 16 days, one data point every 15 min, and a total of 1536 data points. The dataset includes PRB, CQI, MCS, etc., the entries of which are listed in
Table 1. According to the different pre-processing methods, all the data can be divided into two categories: normalized data, including the total number of PRBs and the total number of CQI reports, which are normalized to the 0–1 range using the maximum and minimum normalization methods, and percentage data, including PRB utilization and retransmission rate. The percentage data were not normalized. The final dataset contained 179 dimensions.
It is worth noting that, to save resources, the base station sleeps for a period of time every day at regular intervals, and the data collected during the sleep period are blank.
4.2. Anomaly Detection Results
For the input of the autoencoder-based anomaly detection model, all the data were randomly divided into training and test sets in a ratio of 2:1, and zeros were added after the existing 179-dimensional KPIs, thus forming a 12 × 15 matrix, which was fed into the convolutional network and decoded again to 179 dimensions after being compressed and coded to 32 dimensions. Owing to the high dimensionality of the data, MSE was used for the loss function to avoid large local errors. The learning rate was reduced by half every 50 epochs during the training process.
Figure 6 and
Figure 7 show the distribution curves and the cumulative distribution function (CDF) of reconstruction error after the autoencoder for abnormal and normal samples, respectively, where red and blue lines represent the abnormal and normal samples, respectively.
Figure 8 and
Figure 9 show the distribution curves and the CDF of reconstruction error without the latency fitting module; compared with that, the ConvAE-Latency model works better.
The results show that there is a significant difference between the error distribution of normal and abnormal samples, and the decoding error of abnormal samples is significantly higher than that of most the normal samples; however, there are also some normal samples with larger errors. This is due to the fact that, when the autoencoder is trained, all the data used in this study are expected to be normal samples, but in fact, only one criterion of latency is used as the screening basis in the data screening process and the actual screened normal samples are obtained, but there may be some abnormal samples that cannot be characterized by latency, and the performance in the training results is attributed to some “fake samples” having a large error.
4.3. Abnormal Early Warning Results
For abnormal early warning, the LstmAE-TL model is proposed, and the training process was divided into two parts: normal training and transfer learning.
4.3.1. Normal Sample Training
The purpose of normal sample training is to achieve an accurate prediction of the network for normal samples; therefore, the dataset of normal samples is selected and randomly divided into training and test sets according to the ratio of 2:1. The input data were the data of the five time periods before the period to be predicted, and the output data were the 179-dimensional network state data of the current time period. The loss function of the proposed model consists of two parts: LSTM-based abnormal early warning and autoencoder-based abnormal detection. The training first requires the prediction results to match the real situation such that the mean square error (MSE) between the prediction results and the real data are as small as possible. Second, the prediction results must be correctly reconstructed using the autoencoder. Therefore, the prediction results are fed into the abnormal detection network, and the MSE between the reconstructed data and predicted data are calculated again. The learning rate was reduced by half every 100 epochs during training.
Figure 10 shows the MSE of the prediction data based on the normal dataset, and the results indicate that the error of the network appears to increase periodically over time. It is observed that most of the error spikes occur at the beginning of the day, presumably because the base stations are beginning to work during these hours and their performance and service are unstable. Because the base stations are intermittently dormant to save energy, the dormant time data will be set to zero. As mentioned in
Section 4.1, these dormant time period data are removed during data pre-processing, which results in discontinuous data timing around the dormant time period and cannot be accurately predicted.
4.3.2. Effectiveness of Transfer Learning
The purpose of migration learning is to improve the prediction accuracy of the abnormal samples. Based on the early warning network obtained above, this study freezes the three-layer LSTM network and subsequently only trains the three-layer dense network. Similarly, the data were randomly divided into a training and test set at a ratio of 2:1 for all abnormal samples. To enhance the weight of the abnormal samples, each of the samples in the training set was repeated twice and then mixed with an equal number of randomly selected normal samples to form the complete training and test sets. Because the prediction results of anomalous samples are expected to produce large errors when input into the autoencoder (while the opposite is true for normal samples), the process of transfer learning does not use reconstruction error as a loss function and only considers the accuracy of the fitted prediction. The learning rate was chosen to be one-tenth of the initial learning rate in normal learning, and the same learning rate was halved every 100 epochs.
The distribution curves and the CDF of the autoencoder reconstruction errors for abnormal and normal samples are shown in
Figure 11 and
Figure 12, where red and blue line represent abnormal and normal samples, respectively. Meanwhile,
Figure 13 and
Figure 14 show the results of abnormal early warning without transfer learning.
The results show that there are differences in the distribution of abnormal and normal samples, and the LstmAE-TL works better than training without transfer learning. However, there is an overlap in the distribution of some samples, and the error of normal samples has improved. In transfer learning, to meet the prediction performance of abnormal samples, the prediction of some normal samples is inevitably sacrificed. In addition, the sampling density of the data selected in this study was 15 min, and for some of the abnormal samples, the abnormality may occur within 15 min of the current time period, resulting in it not yet being reflected in the previous time period, which means that these abnormal points do not have temporal characteristics, and the prediction accuracy is poor.


