Article

Error Model and Frequency Modulation Characteristics Analysis of Laser Processing Platform for Micro Crystal Resonator

1
School of Mechanical and Electronic Engineering, Wuhan University of Technology, 122 Luoshi Road, Wuhan 430070, China
2
Key Laboratory of Hubei Province for MicroNano Crystal Processing Technology, Zengdu Economic Development Zone, Suizhou 441300, China
*
Author to whom correspondence should be addressed.
Appl. Sci. 2022, 12(3), 1340; https://doi.org/10.3390/app12031340
Submission received: 14 December 2021 / Revised: 21 January 2022 / Accepted: 24 January 2022 / Published: 27 January 2022
(This article belongs to the Special Issue Laser Micro/Nano Machining Technology)

Abstract

:
Laser processing platform for micro crystal resonator (MCR) frequency modulation is an important piece of equipment to apply laser etching technology to the MCR frequency modulation process. The positioning accuracy of the laser processing platform has an important influence on frequency modulation characteristics. In order to improve the precision and efficiency of the laser processing platform for MCR frequency modulation, the error model of the laser processing platform for MCR frequency modulation is established based on the multi-body system theory. According to the Monte Carlo simulation method, the influence of laser processing platform error for MCR on frequency modulation characteristics is analyzed. Considering the requirements of the MCR frequency modulation process, the laser processing platform for MCR frequency modulation is built, and the frequency deviation and frequency modulation performance are verified to meet the engineering requirements.

1. Introduction

A micro crystal resonator (MCR) is a kind of micro electronic component that can provide stable clock frequency. It has the advantages of high frequency performance, small package size, high stability, and low power consumption. MCR is widely used in small electronic products to generate stable clock signals and provide reference signals for communication systems. The working frequency of MCR studied in this paper is 32.768 KHz. As 32,768 is equal to the 15th power of 2, the 32.768 KHz MCR can easily divide the frequency to produce a 1 s clock frequency, so 32.768 KHz MCR is widely used in various industrial control instruments. As a key process of MCR manufacturing, frequency modulation directly determines the performance and life of the product. The laser processing platform is the main equipment for the MCR frequency modulation. It mainly completes the preliminary frequency modulation process of the resonator to make its frequency reach the target. The positioning error and frequency modulation characteristics of laser processing platform directly affect the quality and efficiency of frequency modulation processing.
At present, the research on laser processing for MCR frequency modulation mainly focuses on microstructure error modeling, microstructure error analysis, and laser micromachining technology. The research on the modeling method of microstructure error mostly focuses on machine tools. Leete et al. [1] used the triangular geometry method for geometric error modeling of mechanical systems with a simple structure. Love et al. [2] utilized the space vector method to establish the error model of a machine tool to analyze the influence of geometric error. V. Kiridena et al. [3] established the machining center model based on the homogeneous coordinate transformation matrix of multi-body system theory and analyzed the error variables. Zhong [4] established the geometric error model of a large five-axis machining center based on the virtual rigid body method, used least square theory to calculate the error value of any position, and used the recursive software compensation method to compensate. Chen [5] combined differential motion with the D-H model and proposed a new method to analyze the error transfer motion of each axis. Hao Tang [6] proposed a new modeling method that introduced a stream of variation into multi-axis system theory of the geometric error model. Xiang S [7] established a machine tool error compensation model based on spinor theory to perform geometric error identification and structure analysis of the rotating shaft.
Microstructure error analysis methods mainly include the experimental simulation method, statistical tolerance method, Monte Carlo simulation method, and range analysis method. Liang et al. [8] analyzed the machining error of orthogonal three-axis machine tool with Monte Carlo simulation, and obtained the probability distribution characteristics of arbitrary spatial points and motion paths for error compensation and machining process optimization. Considering the influence of tolerance on the error of the statically indeterminate mechanism, Qureshi et al. [9] analyzed the error distribution by the Monte Carlo method and statistical tolerance method. Goka Edoh et al. [10] used the kernel density estimation method to improve the Monte Carlo simulation method, which effectively reduced the number of random samples while improving reliability. Wu et al. [11] explored the relationship between minimizing tolerance and cost by combining the Monte Carlo method and discrete optimization method for the problem of tolerance allocation of nonlinear constraints. In order to evaluate the influence of tolerance on gear quality, Bruyère [12] performed Monte Carlo simulation based on tooth contact analysis and tolerance model. Dantan [13] studied the mathematical formulation of tolerance analysis. To compute this mathematical formulation, two approaches based on quantified constraint satisfaction problem solvers and Monte Carlo simulation are proposed and tested.
Laser micromachining technology is widely used in laser welding and laser cutting. Aiming at the welding process of aluminum alloy parts, Tsirkasd et al. [14] analyzed the change of temperature field in laser welding process by establishing three-dimensional finite element simulation model, and predicted the temperature of T-type laser welding plate during processing. Brügmann et al. [15] analyzed the temperature change in the process of continuous laser metal cutting by establishing a simulation model, and the metal plate processing efficiency of laser with different wavelengths was compared through process test. Weng et al. [16] found that the increase in laser power would increase the porosity and interface cracking sensitivity of the cladding layer. M. Harničárová et al. [17] studied the mechanisms of laser cutting of material from the point of view of thermodynamics, and created an analytical expression of the thermo-dynamic parameters of the cut, which can be used both for predictions concerning the technology process, as well as for control of the process. Ovisk et al. [18] studied the thermal energy influence on various types of construction steels during laser beam cutting, and verified how the thermal energy influences the surface layer of material during laser cutting. Long et al. [19] studied the morphology change in fiber laser during cutting. The fluid dynamics during laser cutting was observed by high-speed imaging, and the influence of the morphology and flow characteristics of the molten film in the cutting area on the cutting quality were studied. Nyon et al. [20] simulated the laser inert gas cutting of Inconel by finite element analysis software ANSYS, and predicted the thermal stress and kerf width formation during the laser cutting process.
In order to control the positioning error of the laser processing platform and improve the frequency modulation quality of MCR, the remaining contents are arranged as follows. In Section 2, by analyzing the laser processing method of MCR frequency modulation and the influence of positioning error of the laser processing platform on frequency modulation characteristics, the functional requirements and precision requirements of laser processing platform of MCR frequency modulation are obtained. In Section 3, based on multi-body topology structure and multi-body topology theory, the error model of the laser processing platform for MCR frequency modulation is established. In Section 4, the positioning error of the laser processing platform for MCR frequency modulation is analyzed based on the Monte Carlo method. In Section 5, the prototype of the laser processing platform is built. The positioning accuracy and frequency modulation characteristics of the laser processing platform are verified by experiments.

2. MCR Frequency Modulation Method and Laser Processing Platform

2.1. MCR Frequency Modulation Method

The frequency modulation processing of MCR is the key processing technology to determine the product quality, and its frequency is almost only related to the physical properties of the wafer itself. The Sauerbrey equation [21] describes the relationship between the frequency of the MCR and its surface attachment:
Δ f = 2 Δ m f 0 2 A ρ q μ q
where Δ f is the frequency variation of MCR, f 0 is the original resonant frequency of MCR, Δ m is the mass change of MCR, A is the electrode area of MCR, ρ q is the density of MCR, and μ q is the shear elastic modulus of MCR.
In the frequency modulation process of MCR, A , ρ q , μ q , and f 0 in Equation (1) are all constant values. Frequency can only be changed by changing the mass of silver layer on the surface of MCR with the laser processing method. In the process, the electrode film on the surface of the MCR is processed by laser, then the mass of the silver layer is reduced by gasification to improve the frequency of the MCR until it reaches the target frequency. The MCRs before and after laser processing are depicted in Figure 1.

2.2. Laser Processing Platform for MCR Frequency Modulation

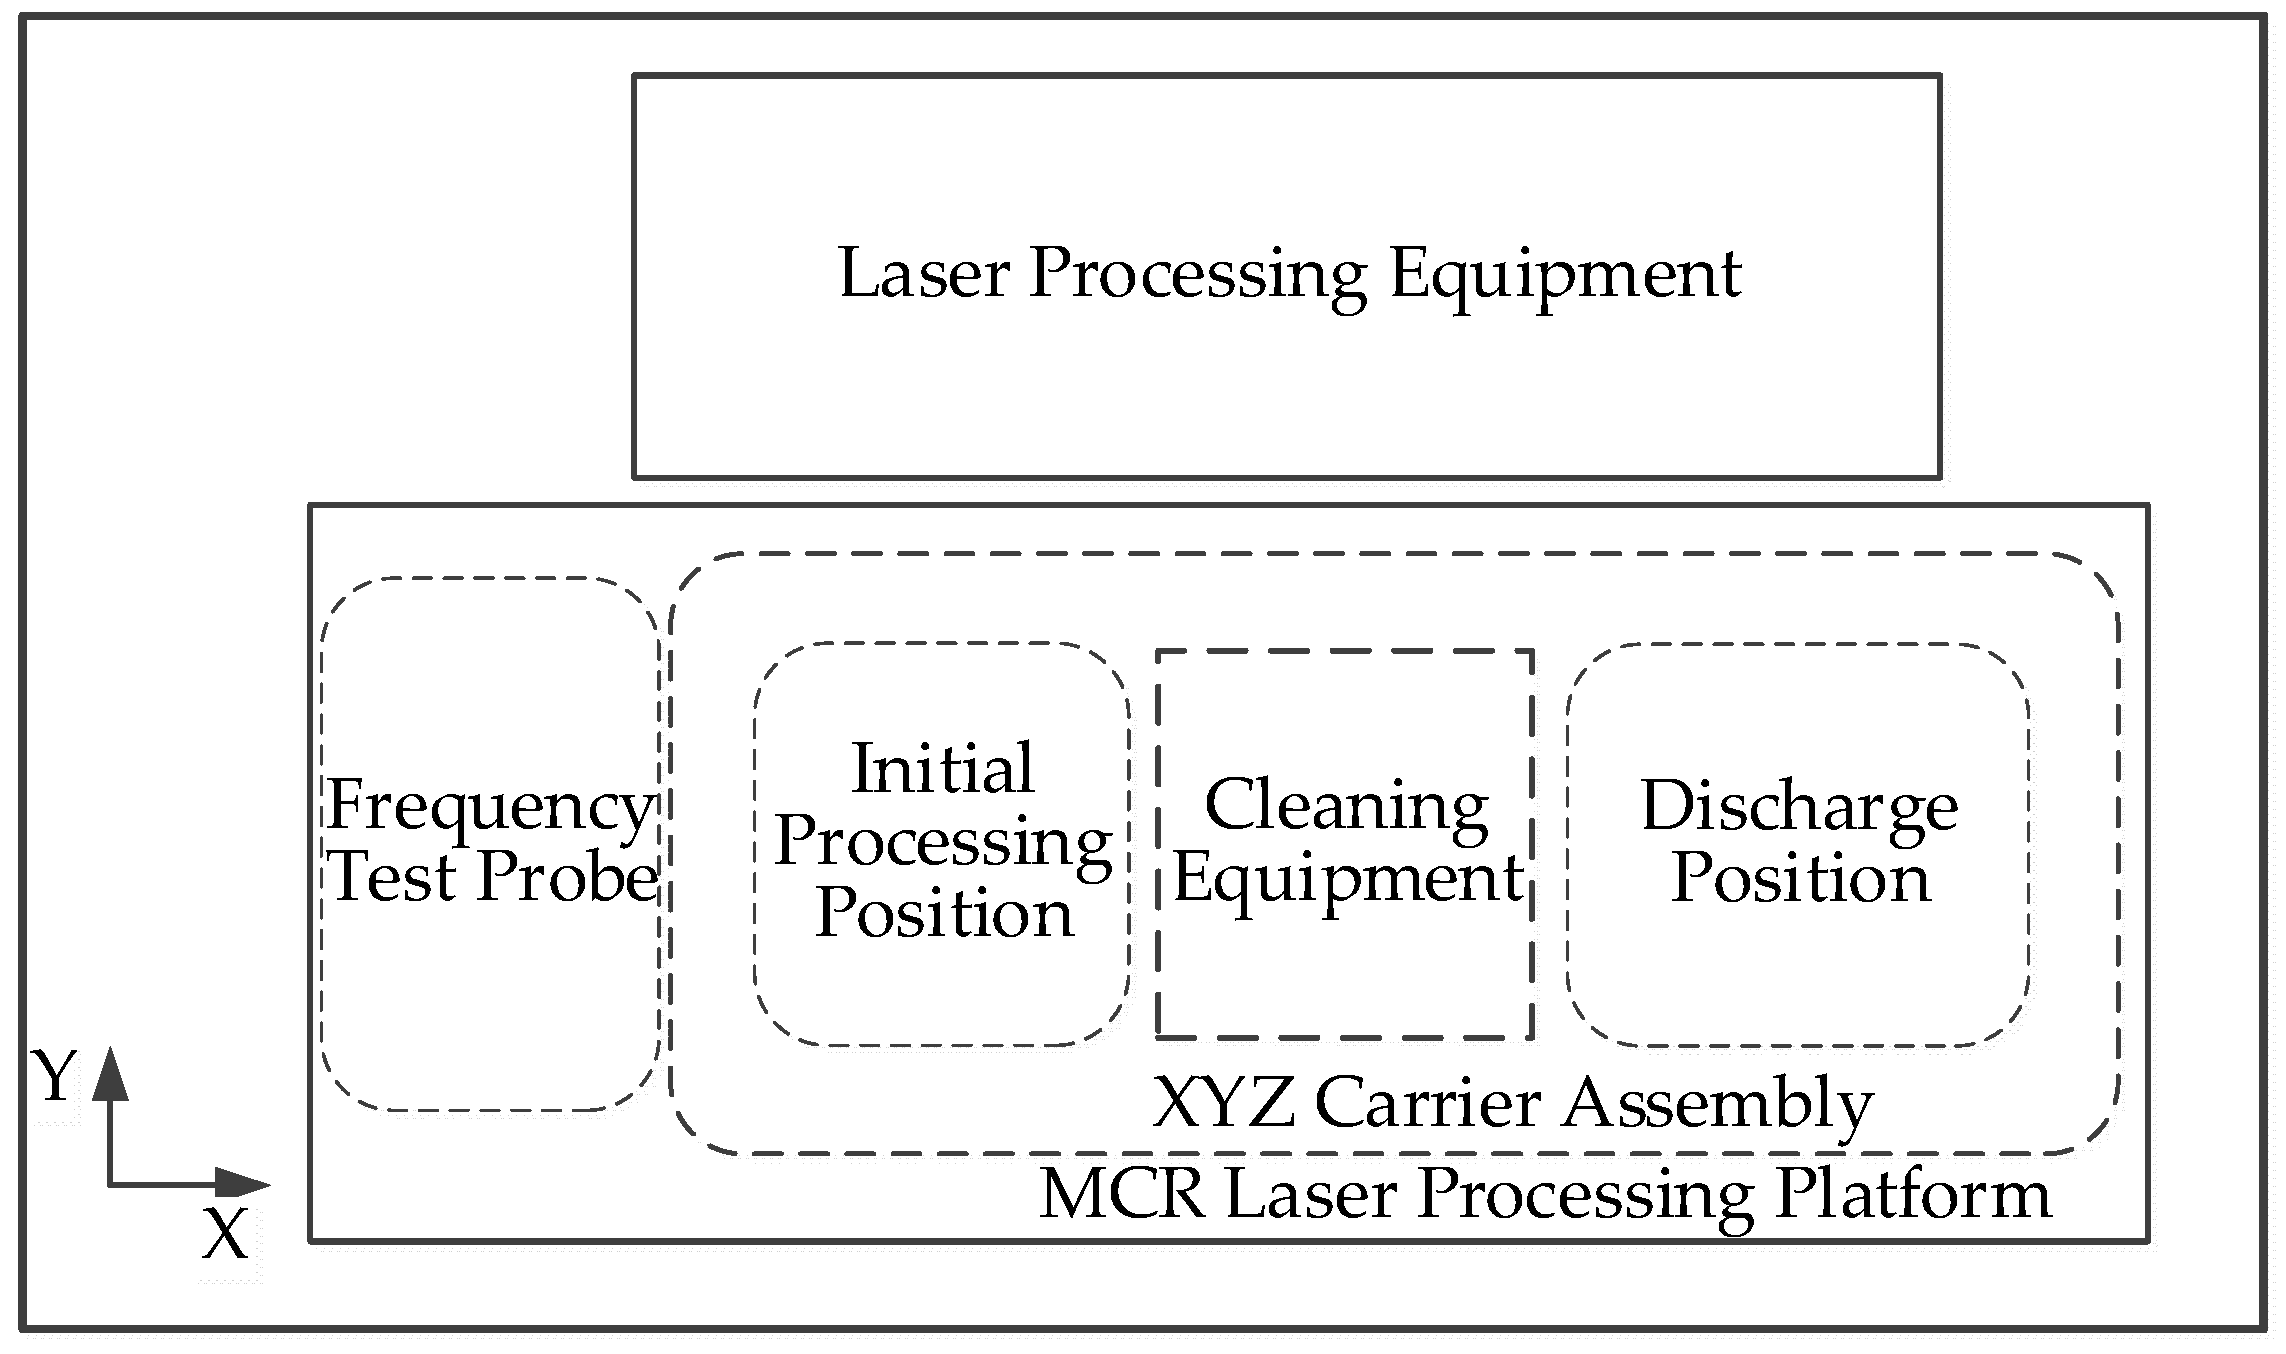
The layout of the laser processing platform for MCR frequency modulation is shown in Figure 2. The wafer is fixed on the stage of XYZ carrier assembly, then the wafer is moved to the preset processing position to wait for processing. The cleaning equipment is used to clean and recycle the gasified silver waste. After each piece of equipment of the laser processing platform for MCR frequency modulation reaches the preset position, the laser processing equipment etches the MCR.
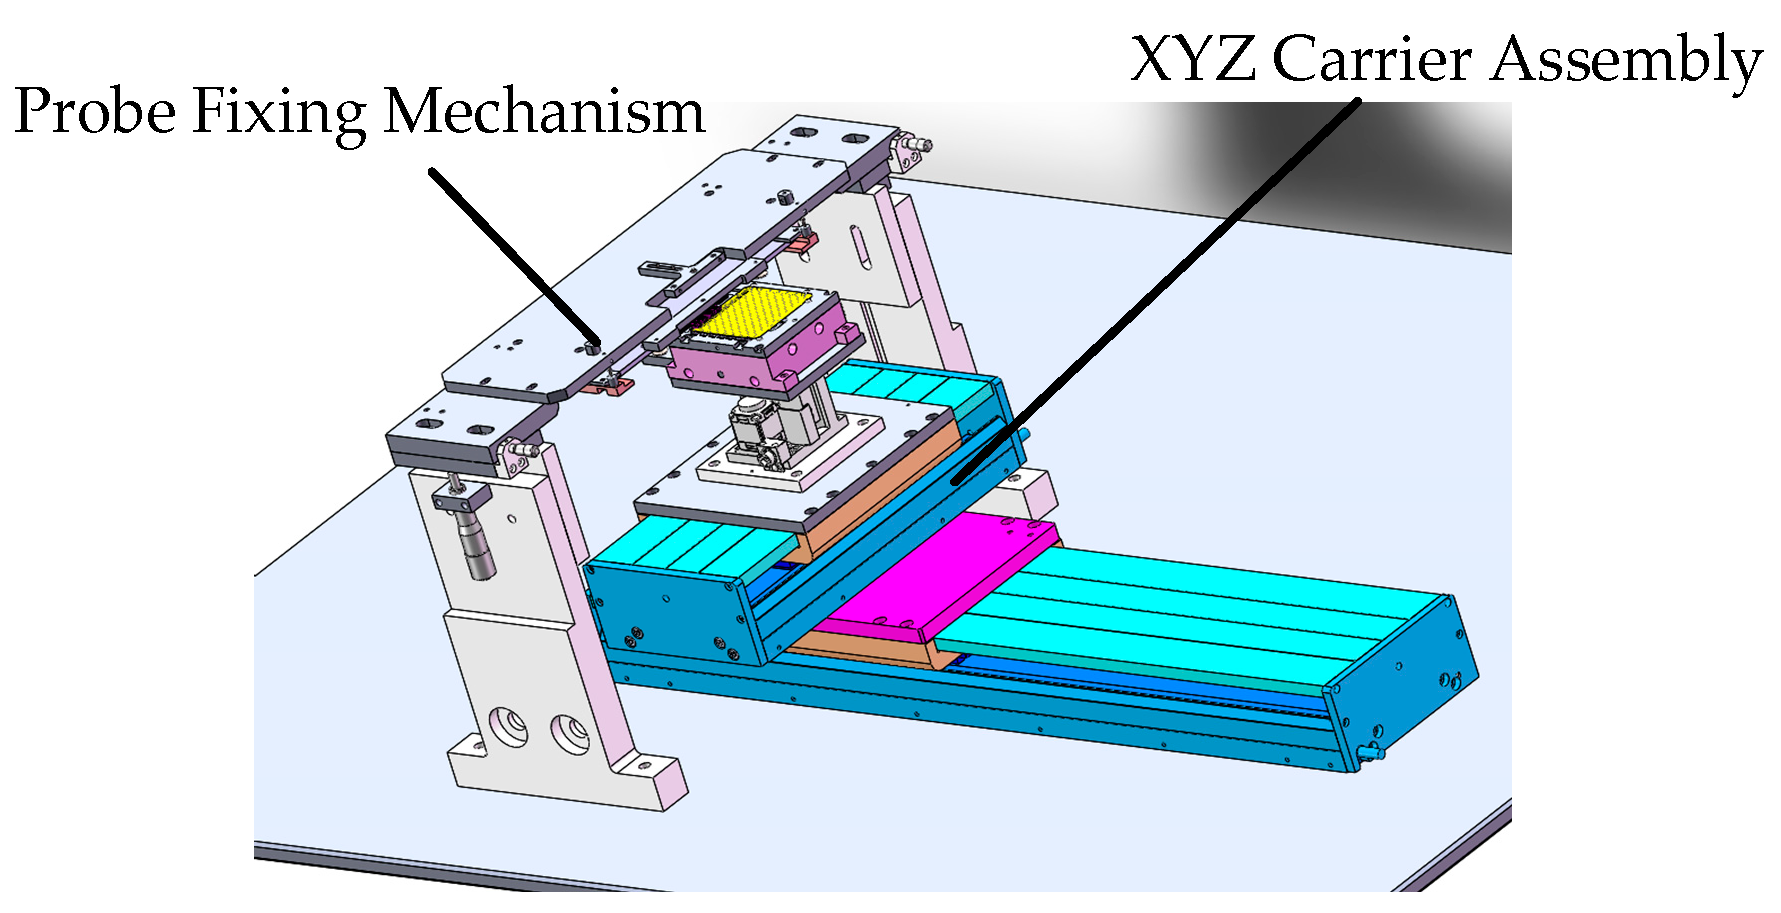
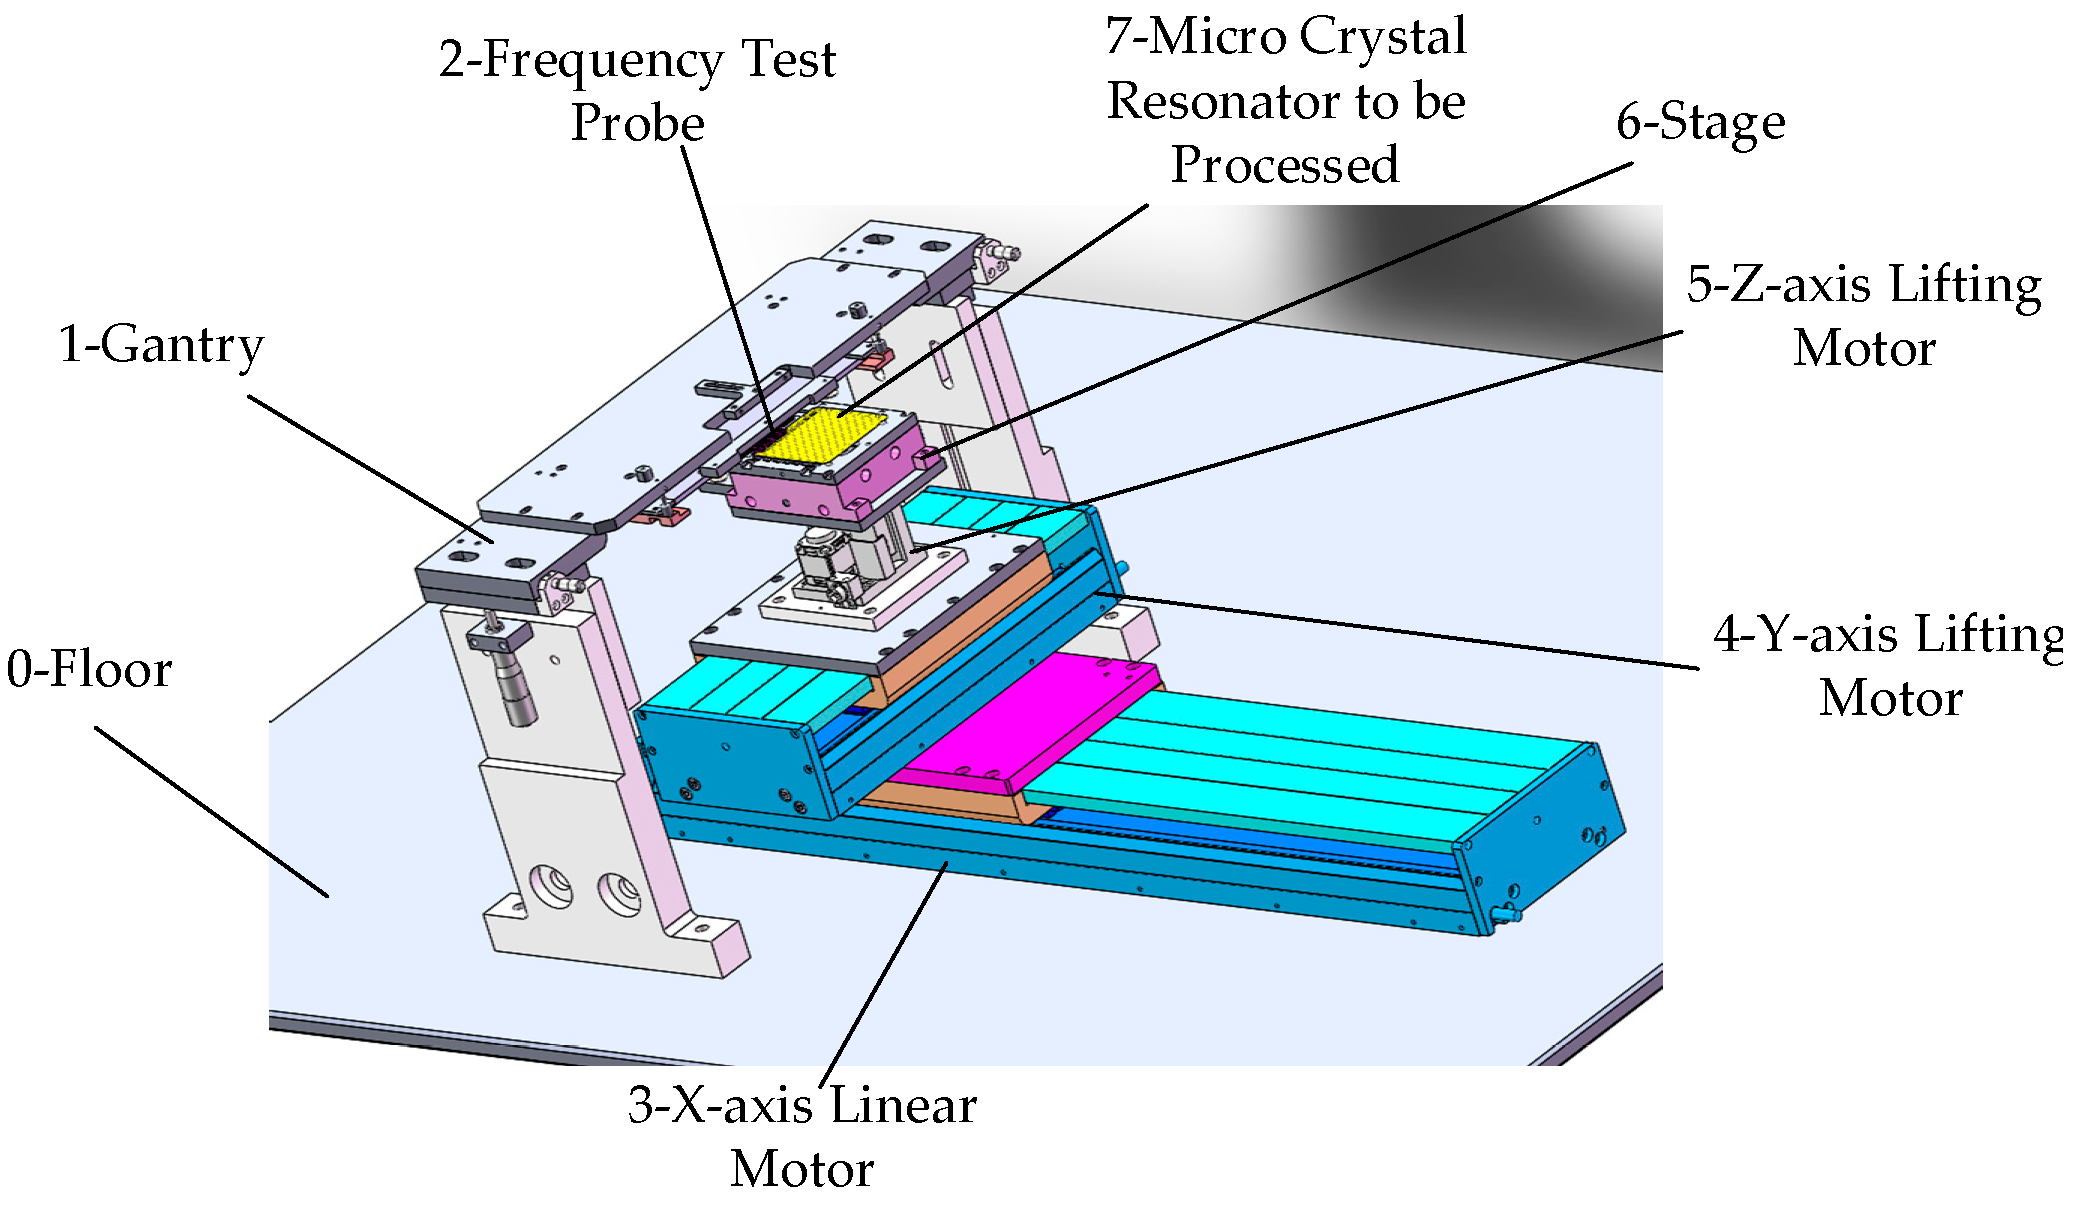
The laser processing platform for MCR frequency modulation is mainly composed of the frequency test probe fixing mechanism and XYZ carrier assembly, as shown in Figure 3. In the design process, the laser processing platform for MCR frequency modulation needs to meet the delivery function in XYZ directions and the accuracy requirements.
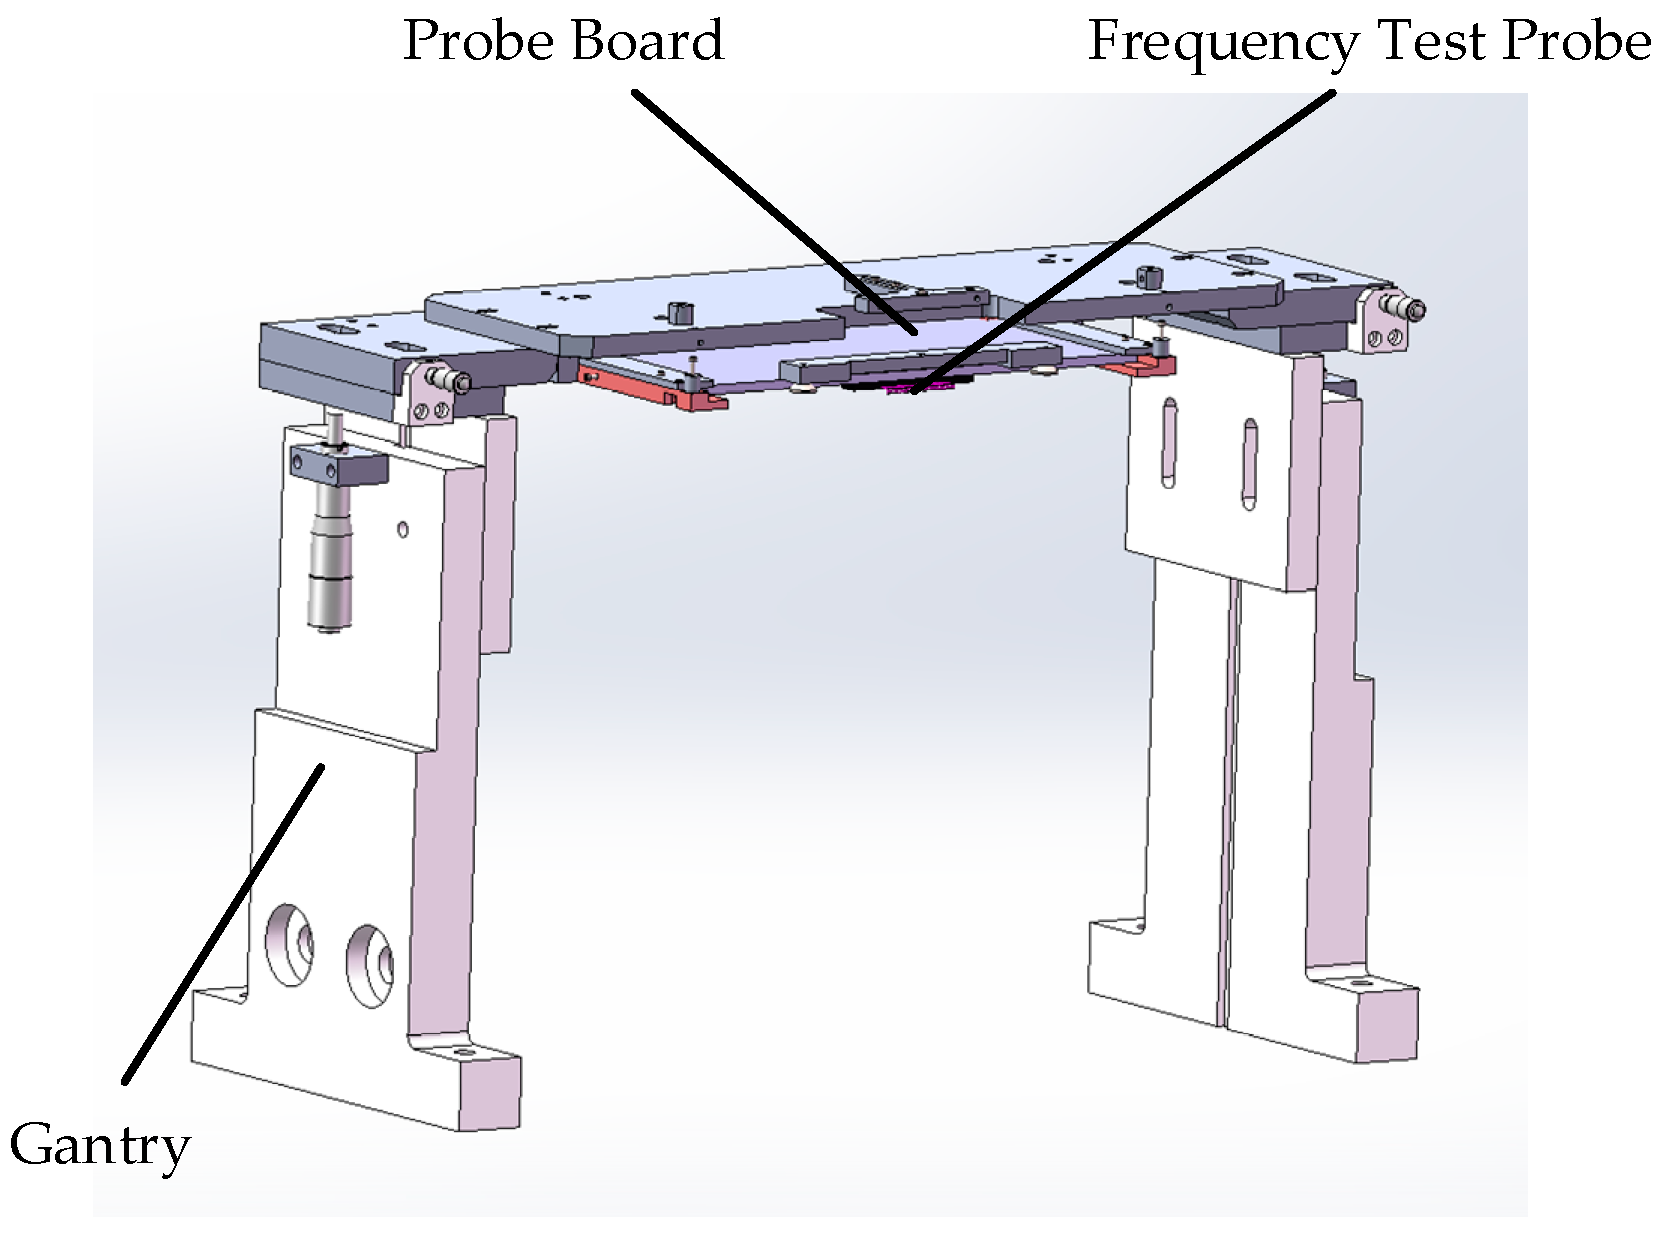
In the laser processing for MCR frequency modulation, it is necessary to detect MCR frequency and modify the laser processing amount. During the processing, the frequency test probe and the MCR circuit accurately cooperate to form a loop, and the current MCR frequency can be obtained through the frequency test equipment. The frequency test probe fixing mechanism is shown in Figure 4. The frequency test probe is fixed on the probe board. The probe board is fixed on the frame through the gantry. The frequency of multiple MCRs can be tested at the same time.

2.3. The Influence of Laser Processing Platform Error on MCR Frequency Modulation Characteristics

The error of the laser processing platform for MCR frequency modulation will affect the position of the MCR to be processed, so that the laser processing position deviates from the preset position, resulting in unstable frequency drift and affecting the effective processing rate of the laser processing platform. In addition, the positioning error between the frequency test probe and the MCR circuit will also result in inaccurate frequency measurement, affecting the amount of laser processing, resulting in a variety of unquantified products with different defects, such as unclean processing, insufficient processing, and silver layer damage. Figure 5 depicts qualified and unqualified MCR products.

2.4. Functional and Precision Requirements of Laser Processing Platform for MCR Frequency Modulation

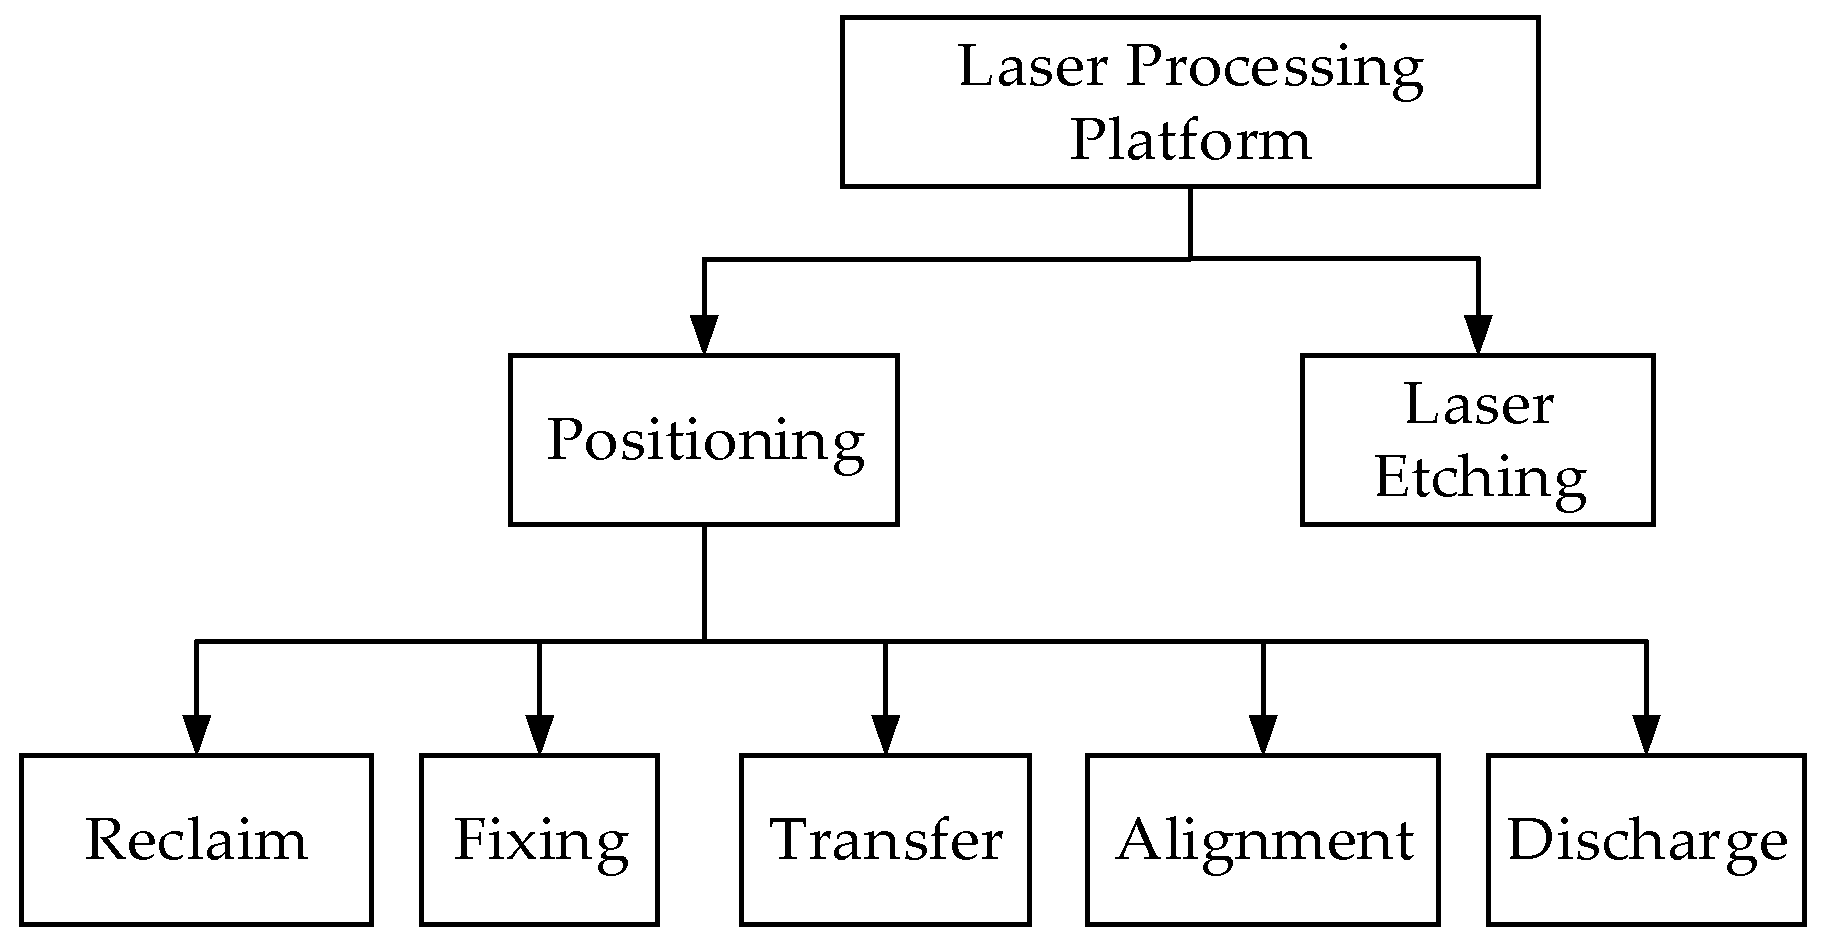
The laser processing platform for MCR frequency modulation mainly completes two functions: positioning and laser etching. The positioning function is divided into reclaim, fixing, transfer, alignment, and discharge. The overall function of the laser processing platform for MCR frequency modulation is shown in Figure 6.
In the manufacturing and assembly processes of the laser processing platform for MCR frequency modulation, the machining error and assembly error of the parts will cause the error between the actual and ideal position of the platform components, affecting the position of the MCR to be processed. The error diagram is shown in Figure 7.
According to the process requirements, the positioning accuracy of the laser processing platform for MCR frequency modulation in the X, Y, and Z axis is 300 μm, 100 μm, and 100 μm, respectively.

3. Error Model of Laser Processing Platform for MCR Frequency Modulation

3.1. Error Source Analysis of Laser Processing Platform for MCR Frequency Modulation

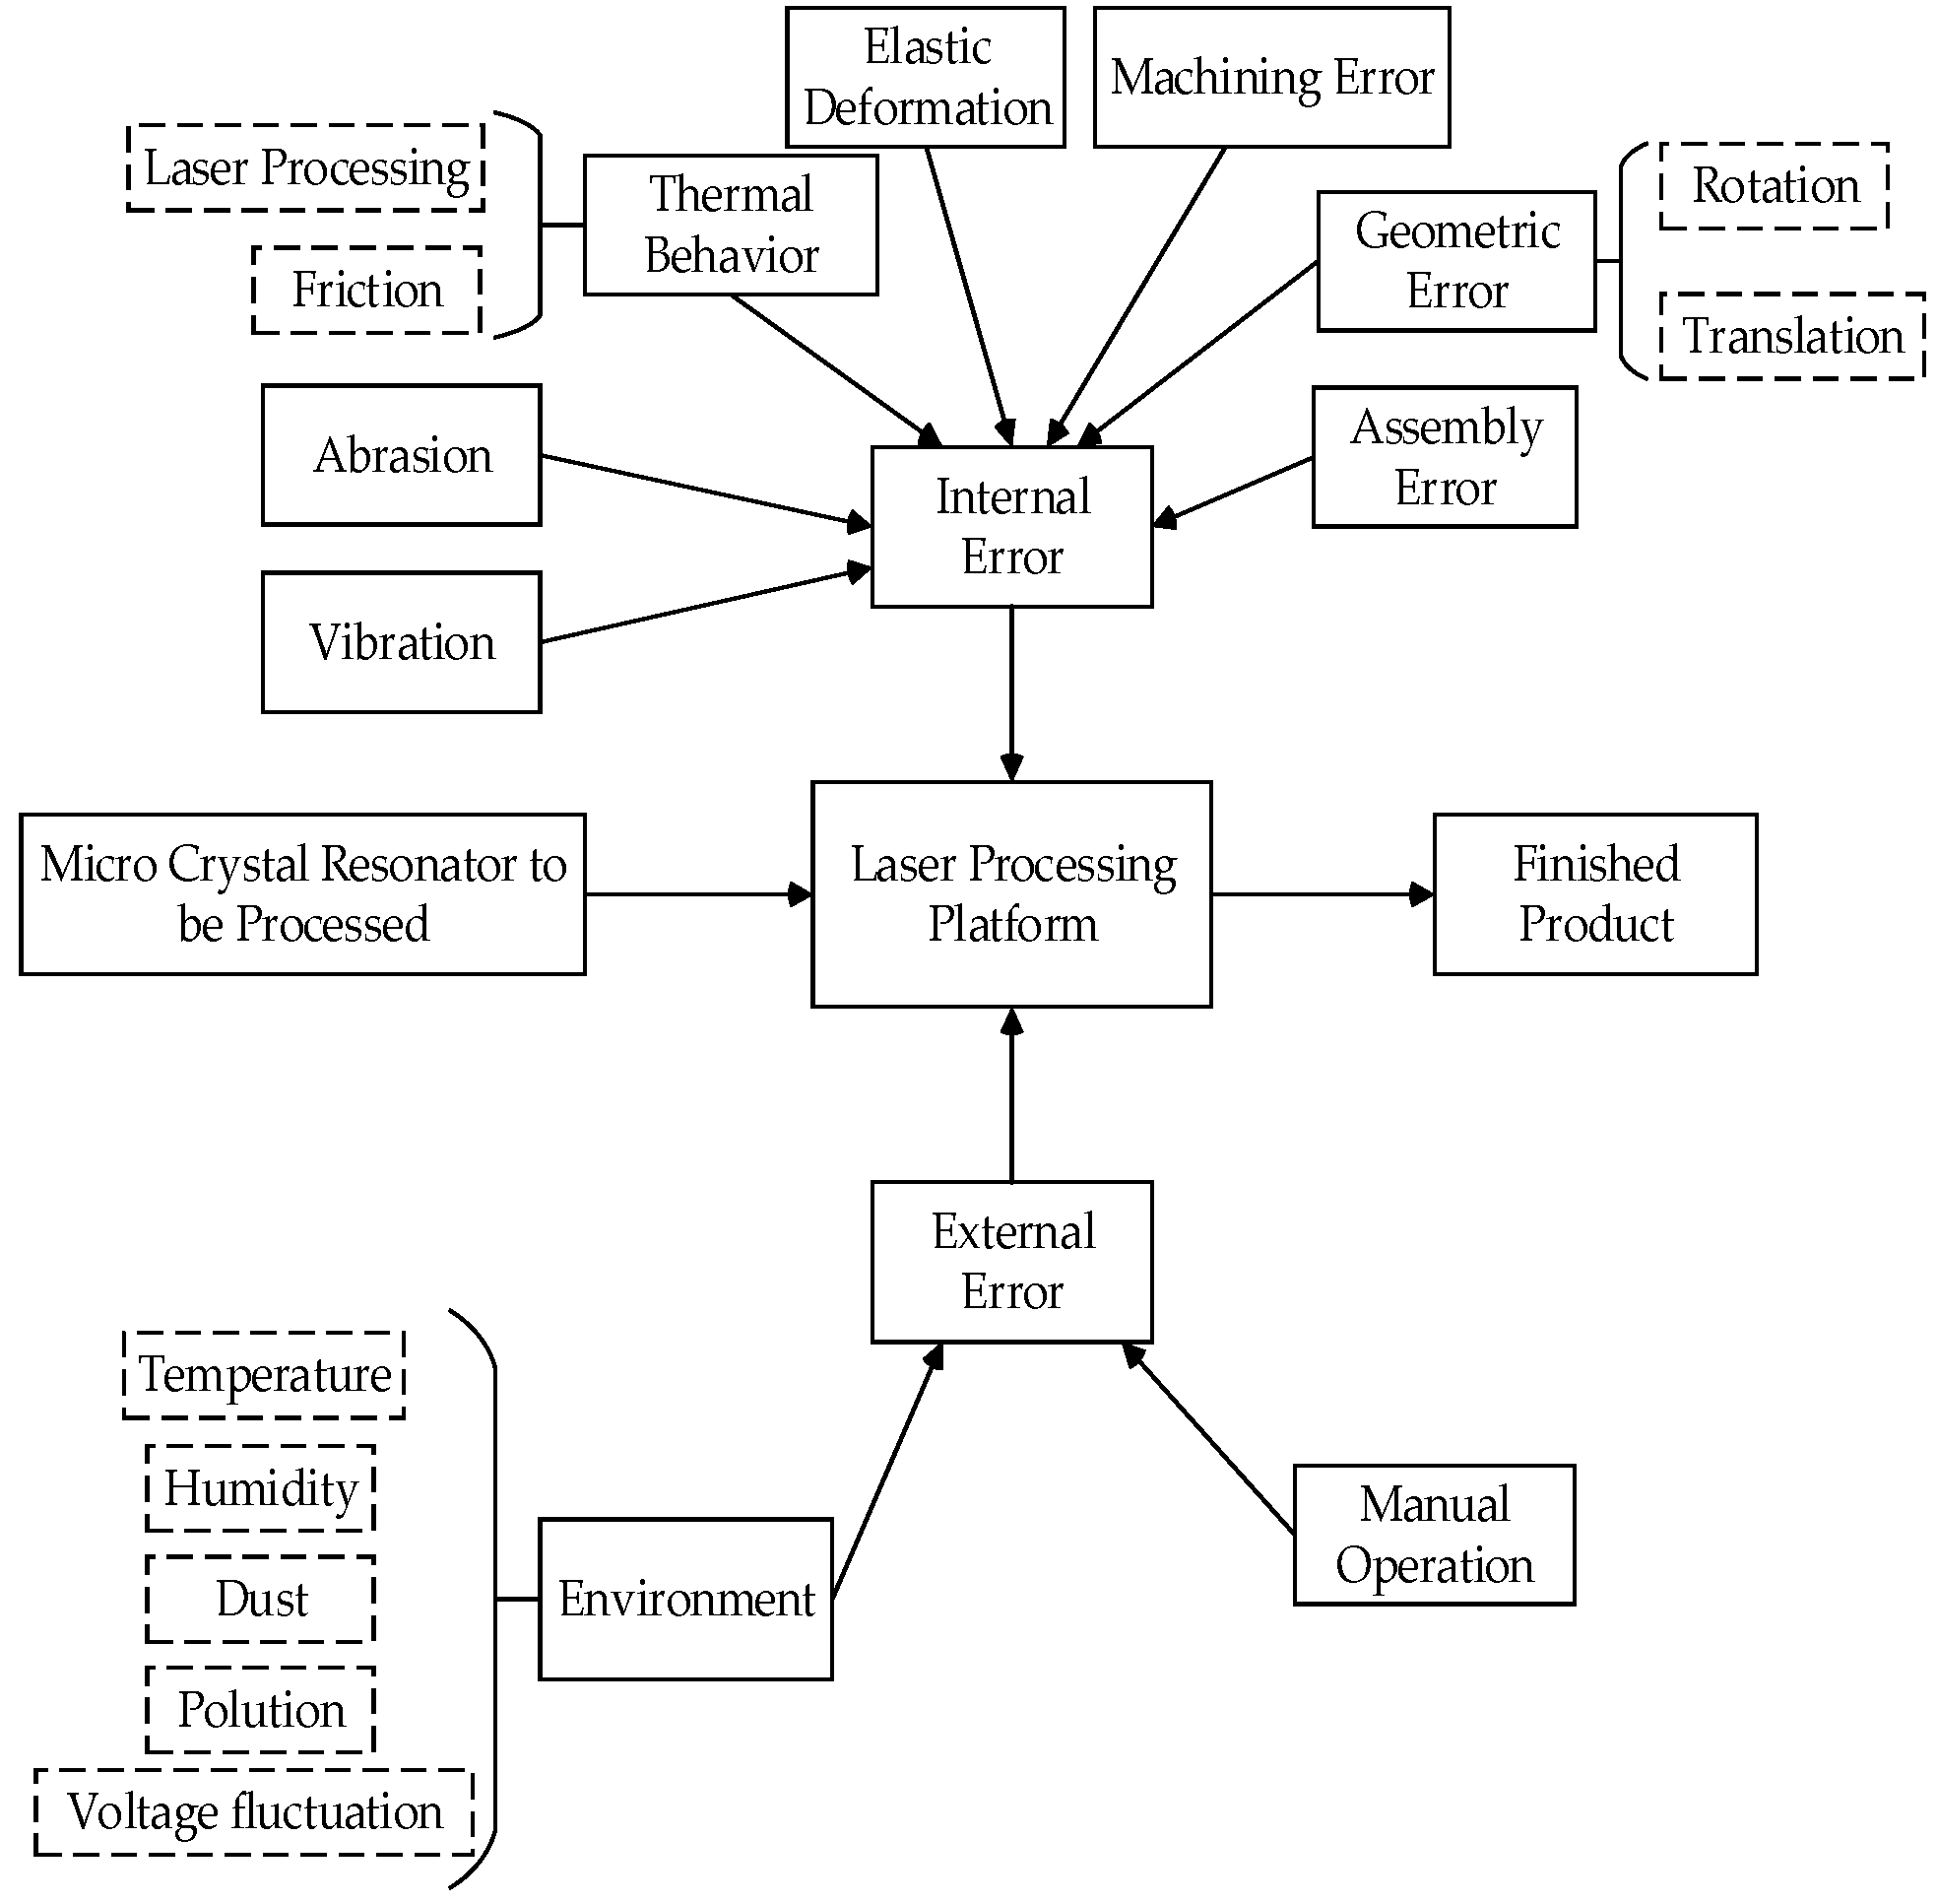
The error of laser processing platform for MCR frequency modulation is mainly divided into external error and internal error. Figure 8 lists the common error sources. When the laser processing platform runs in the dust-free workshop, the influence of external error can be reduced by controlling environmental factors. The laser processing of MCR is non-contact processing and the thermal behavior has little impact on the laser processing platform. The contact area between the frequency test probe and MCR during processing is very small and the influence of elastic deformation error is very small. The part processing error, geometric error, and assembly error have a great impact on the laser processing platform, in which the geometric error is the main error source.

3.2. Error Transfer Model of Laser Processing Platform for MCR Frequency Modulation Based on Multi-Body Topology Structure

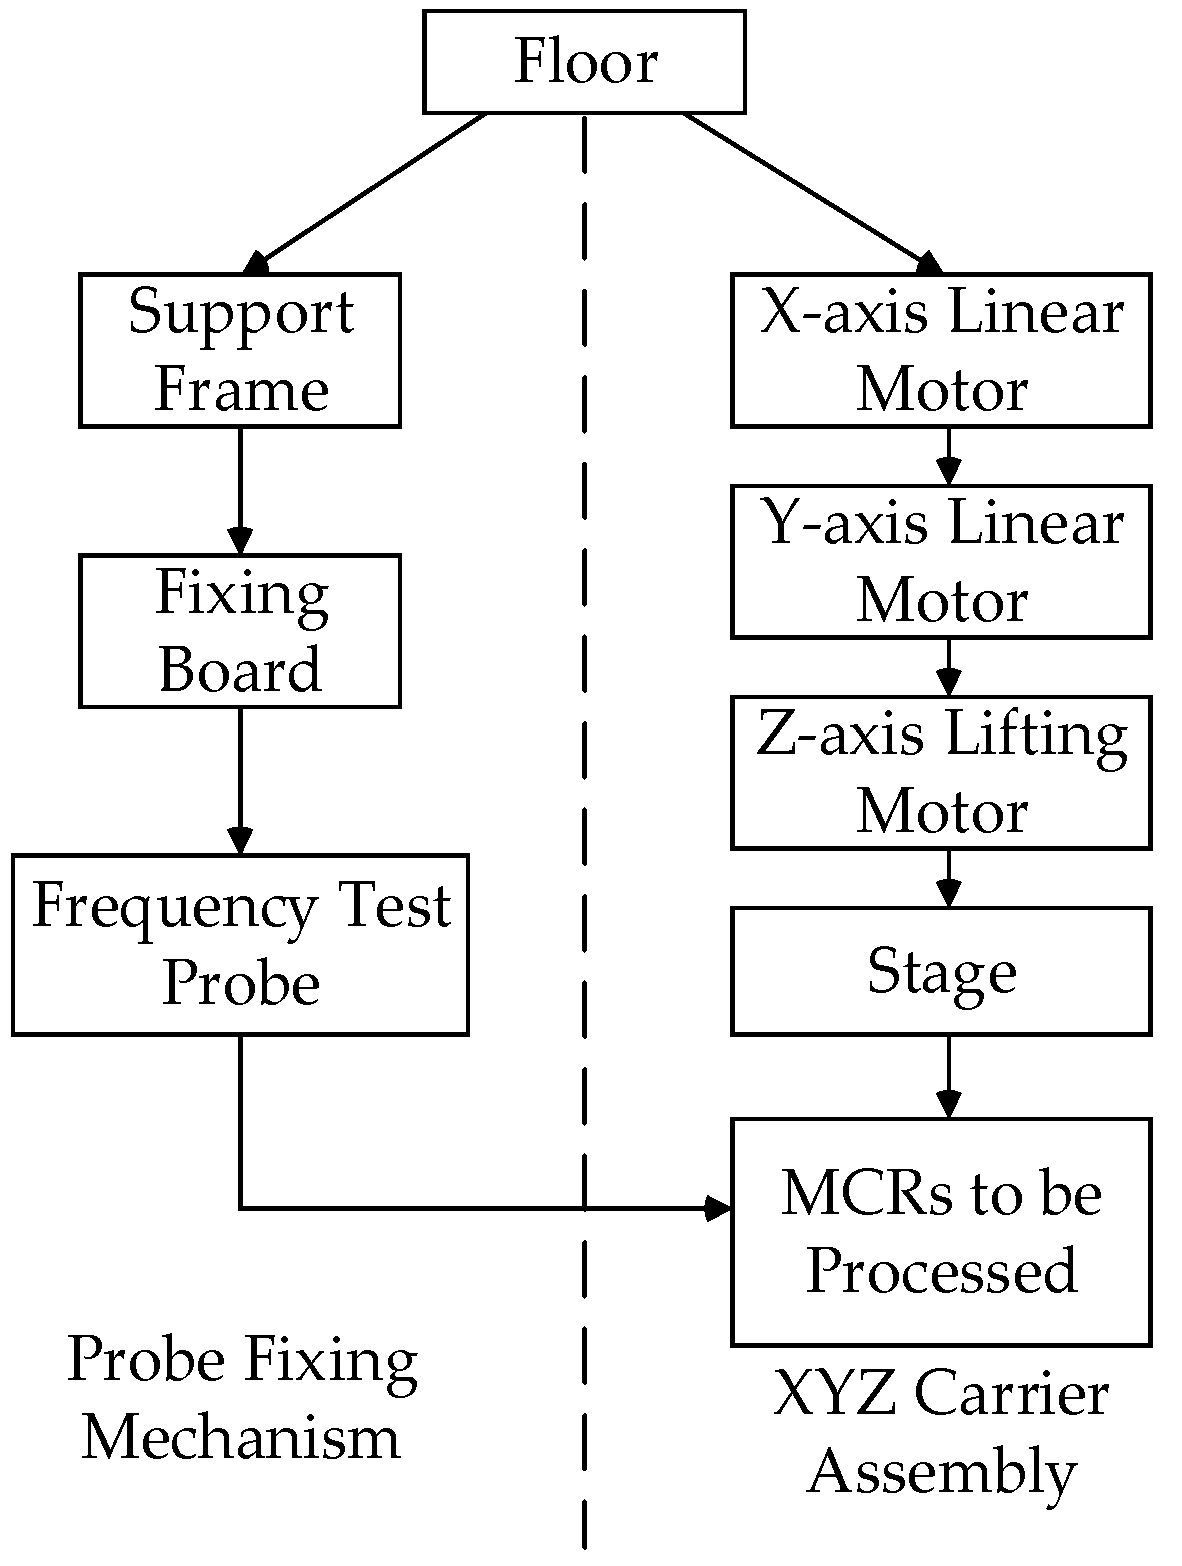
The error transfer circuit diagram of the laser processing platform for MCR frequency modulation is shown in Figure 9. The error is transmitted through the adjacent contact surface, and the error accumulation is mostly based on the main installation surface. In the error modeling, six errors on the main path of the error transfer should be mainly considered, which are the translational errors Δ x i j , Δ y i j , and Δ z i j and the rotational errors Δ α i j , Δ β i j , and Δ γ i j along the X, Y, and Z axis, respectively.
The lower-numbered body array (LBA) is used to describe the multi-body system topology structure. The typical bodies that produce direct errors in the laser processing platform for MCR frequency modulation are labeled, as shown in Figure 10.
According to the constraint relationship between parts, the multi-body system can be divided into open-loop structure and closed-loop structure. The parts in the open-loop structure are only constrained by the front-end parts, and their error transmission direction and path are determined, while the parts in the closed-loop structure may be constrained by two or more front-end parts at the same time. The fully open-loop multi-body system cannot meet the needs of laser processing platform error analysis. According to the processing characteristics of the laser processing platform studied in this paper, the frequency test probe only contacts the MCR circuit during laser processing. The laser processing platform can be regarded as an open-loop multi-body system with specific constraints, and the LBA of the platform can be constructed.
It is assumed that the bottom plate is the inertial body B 0 , and the typical body 1 is selected as body B 1 . Then, along the direction away from B 1 , according to the natural growth sequence, each typical body is numbered in turn.
B j is an arbitrary typical body in the system. The serial number of the n-th lower-numbered body of typical body B j is defined as follows:
L n ( j ) = i
where L is a lower-numbered operator, i and j are symbols of a typical body, and B j is called an n-th higher-numbered body of B i , which satisfies the following:
L n ( j ) = L ( L n 1 ( j ) )
L 0 ( j ) = j
L n ( 0 ) = 0
When B j is an adjacent lower-numbered body of B i ,
L   ( j ) = j
According to the formulas above, the serial number of each low-numbered body array of multi-body system and the lower-numbered body array of the topological structure of the whole multi-body system can be obtained, and the results are shown in Table 1.

3.3. Error Model of the Laser Processing Platform for MCR Frequency Modulation Based on Multi-Body System Theory

According to the multi-body system theory, the error matrix T i j between the typical bodies of the laser processing platform is as follows:
T i j = [ 1 Δ γ i j Δ β i j Δ x i j Δ γ i j 1 Δ α i j Δ y i j Δ β i j Δ α i j 1 Δ z i j 0 0 0 1 ]
where Δ α i j is the error between typical body i and j around the X-axis, Δ x i j is the error between typical body i and j along the X-axis, Δ β i j is the error between typical body i and j around the Y-axis, Δ y i j is the error between typical body i and j along the Y-axis, Δ γ i j is the error between typical body i and j around the Z-axis, and Δ z i j is the error between typical body i and j along the Z-axis.
In order to express this more clearly, subscripts p and s in the matrix represent static and motion errors, respectively. The homogeneous transformation matrix of the error model of the laser processing platform for MCR frequency modulation is established as follows:
The gantry is fixed on the plate. The ideal static error T 01 p , ideal motion error T 01 s , actual static error Δ T 01 p , and actual motion error Δ T 01 s of typical body 1 and typical body 0 are relatively small, which are denoted as I 4 × 4 .
The frequency test probe is fixed on the gantry. The ideal static error T 12 p and the actual static error Δ T 12 p of typical body 2 and typical body 1 are relatively small, which are denoted as I 4 × 4 . The homogeneous transformation matrices of ideal motion and actual motion are as follows:
T 12 s = [ 1 0 0 0 0 1 0 0 0 0 1 z 12 s 0 0 0 1 ]
Δ T 12 s = [ 1 0 Δ β 12 s Δ x 12 s Δ γ 12 s 1 Δ α 12 s Δ y 12 s Δ β 12 s Δ α 12 s 1 Δ z 12 s 0 0 0 1 ]
The X-axis linear motor is fixed on the plate, and the homogeneous transformation matrices of ideal motion and actual motion between typical body 3 and typical body 0 are T 03 s and Δ T 03 s . The Y-axis linear motor is installed on the X-axis linear motor, and the homogeneous transformation matrices of ideal motion, actual static, and actual motion between typical body 4 and typical body 3 are T 34 s , Δ T 34 p , and Δ T 34 s , respectively. The Z-axis lifting motor is installed on the Y-axis linear motor, and the homogeneous transformation matrices of ideal motion, actual static, and actual motion between the typical body 5 and the typical body 4 are T 45 s , Δ T 45 p , and Δ T 45 s , respectively. The stage is installed on the Z-axis lifting motor, and the homogeneous transformation matrix of the actual static error between typical body 6 and typical body 5 is Δ T 56 p . The MCR to be processed is mounted on the stage, and the homogeneous transformation matrix of the actual static error between typical body 7 and typical body 6 is Δ T 67 p .
According to the multi-body system theory, the change between the coordinate system of each typical body is represented by a 4 × 4 order homogeneous matrix with the parameter of Euler angle, and its expression is as follows:
T i j = T i j p Δ T i j p T i j s Δ T i j s
where T i j p is the ideal static error between typical body i and j, Δ T i j p is the actual static error between typical body i and j, T i j s is the ideal motion error motion error between typical body i and j, and Δ T i j s is the actual motion error between typical body i and j.
Point P t is the homogeneous coordinate of the end of the frequency test probe in the typical body coordinate system, and point P w is the homogeneous coordinate of the preset contact point of the MCR circuit to be processed in the typical body. The homogeneous coordinate in the generalized coordinate system O x 0 y 0 z 0 is calculated by homogeneous coordinate transformation.
P t = ( x t y t z t 1 ) T
P w = ( x w y w z w 1 ) T
Through the LBA of the laser processing platform given in Table 2, it can be obtained that the homogeneous coordinate transformation matrix P t 0 of the end contact point of the frequency test probe in the generalized coordinate system O x 0 y 0 z 0 is
P t 0 = T 02 P t
T 02 = T 01 T 12
The homogeneous coordinate transformation matrix P w 0 of the preset contact point of the MCR circuit to be processed in the generalized coordinate system O x 0 y 0 z 0 is
P w 0 = T 07 P w
T 07 = T 03 T 34 T 45 T 56 T 67
Finally, the matrix E , the positioning error of laser processing platform for MCR frequency modulation, is as follows:
E = P t 0 P w 0 = [ 1 0 0 0 0 1 0 0 0 0 1 z 12 s 0 0 0 1 ] [ 1 0 Δ β 12 s Δ x 12 s Δ γ 12 s 1 Δ α 12 s Δ y 12 s Δ β 12 s Δ α 12 s 1 Δ z 12 s 0 0 0 1 ] ( x t y t z t 1 ) [ 1 0 0 x 03 s 0 1 0 0 0 0 1 0 0 0 0 1 ] [ 1 Δ γ 03 s Δ β 03 s Δ x 03 s Δ γ 03 s 1 Δ α 03 s Δ y 03 s Δ β 03 s Δ α 03 s 1 Δ z 03 s 0 0 0 1 ] [ 1 Δ γ 34 p Δ β 34 p 0 Δ γ 34 p 1 0 Δ y 34 p Δ β 34 p 0 1 Δ z 34 p 0 0 0 1 ] [ 1 0 0 0 0 1 0 y 34 s 0 0 1 0 0 0 0 1 ] [ 1 Δ γ 34 s Δ β 34 s Δ x 34 s Δ γ 34 s 1 Δ α 34 s Δ y 34 s Δ β 34 s Δ α 34 s 1 Δ z 34 s 0 0 0 1 ] [ 1 Δ γ 45 p Δ β 45 p Δ x 45 p Δ γ 45 p 1 Δ α 45 p Δ y 45 p Δ β 45 p Δ α 45 p 1 0 0 0 0 1 ] [ 1 0 0 0 0 1 0 0 0 0 1 z 45 s 0 0 0 1 ] [ 1 Δ γ 45 p Δ β 45 p Δ x 45 p Δ γ 45 p 1 Δ α 45 p Δ y 45 p Δ β 45 p Δ α 45 p 1 0 0 0 0 1 ] [ 1 Δ γ 56 p 0 0 Δ γ 56 p 1 Δ α 56 p Δ y 56 p 0 Δ α 56 p 1 0 0 0 0 1 ] [ 1 Δ γ 67 p Δ β 67 p Δ x 67 p Δ γ 67 p 1 Δ α 67 p Δ y 67 p Δ β 67 p Δ α 67 p 1 Δ z 67 p 0 0 0 1 ] ( x w y w z w 1 )

4. Error Analysis of the Laser Processing Platform for MCR Frequency Modulation

4.1. Error Simulation of the Laser Processing Platform for MCR Frequency Modulation Based on Monte Carlo Method

The Monte Carlo method is a simulation method integrating probability statistics with computer programming. After obtaining the parameters with certain value rules, the probability distribution of the target can be obtained through repeated simulation, so as to obtain the results corresponding to the parameters. The errors of laser processing platform for MCR frequency modulation are mainly geometric errors and assembly errors, which are random. In general, the positioning error at the end of the frequency test probe of the laser processing platform for MCR is difficult to measure, and its positioning accuracy directly affects the processing effect of the MCR.
With the help of the Monte Carlo method, the actual error can be simulated by random sampling within the value range of error variables, so as to obtain the approximate solution of a large number of error data, so as to simulate the random error in the actual situation. The specific simulation steps are as follows:
1
The established laser processing platform error model mainly considers the influence of geometric error and assembly error. These errors should be approximately normally distributed for the tuned equipment, and the measurement error also approximately obeys normal distribution when the same measurement tool is used for repeated measurement. Therefore, this paper takes the normal distribution as the probability distribution function of the variable.
2
Combined with the range of platform error variables measured repeatedly, random sampling is carried out according to the normal distribution with MATLAB to generate random number samples for statistical analysis.
3
The samples are analyzed to obtain the position error probability statistics of the end of the frequency test probe on the laser processing platform, and the error is analyzed accordingly.
Based on the error model of the laser processing platform for MCR frequency modulation, the Monte Carlo method is used to simulate the positioning error of the end of frequency test probe. The simulation is carried out 250,000 times. The simulation results of the end of frequency test probe are shown in Figure 11. Ex, Ey, and Ez are the positioning error of the end of frequency test probe in the X, Y, and Z directions, respectively.
The mean and standard deviation of the errors are shown in Table 2. The negative sign indicates that the error direction of the point is opposite to the generalized coordinate system.

4.2. Error Analysis of the Laser Processing Platform for MCR Frequency Modulation

The positioning errors of the end of the frequency test probe in the X, Y, and Z directions are basically subject to the normal distribution characteristics. Most of the error data fit the normal distribution curve. The average of Ex is the largest, the standard deviation of Ey is the largest, and the average error and standard deviation of Ez are the smallest.
According to the requirements in Table 1, the positioning accuracy of the frequency test probe in the X direction is required to be 300 μm, so the requirements can be relaxed in this direction during tuning. If there is an initial positioning error, it can be adjusted by changing the initial positioning value of the X-axis in the tuning program. The end positioning accuracy of the frequency test probe in the Y direction is required to be 100 μm. The simulation results show that the standard deviation of the Y-axis positioning error is large, and there is a risk of shedding. During the tuning of the laser processing platform for MCR frequency modulation, the Y-side should be adopted as the baseline, thus initial end positioning of the frequency test probe in the Y direction should be paid attention. If there is an initial positioning deviation, it can be corrected by adjusting the relative position between the stage and the Z-axis lifting motor or adjusting the Y-side positioning reference of the stage. The end positioning accuracy of the frequency test probe in the Z direction is required to be 100 μm. The simulation results show that there is a risk of losing the contact between the frequency test probe and the MCR. In order to achieve accurate frequency measurement and avoid damage to the circuit of the MCR, the frequency test probe of the laser processing platform should retract 30 μm in the Z direction.

5. Experiment on Precision and Frequency Modulation Characteristics of the Laser Processing Platform for MCR

5.1. Prototype of the Laser Processing Platform for MCR Frequency Modulation

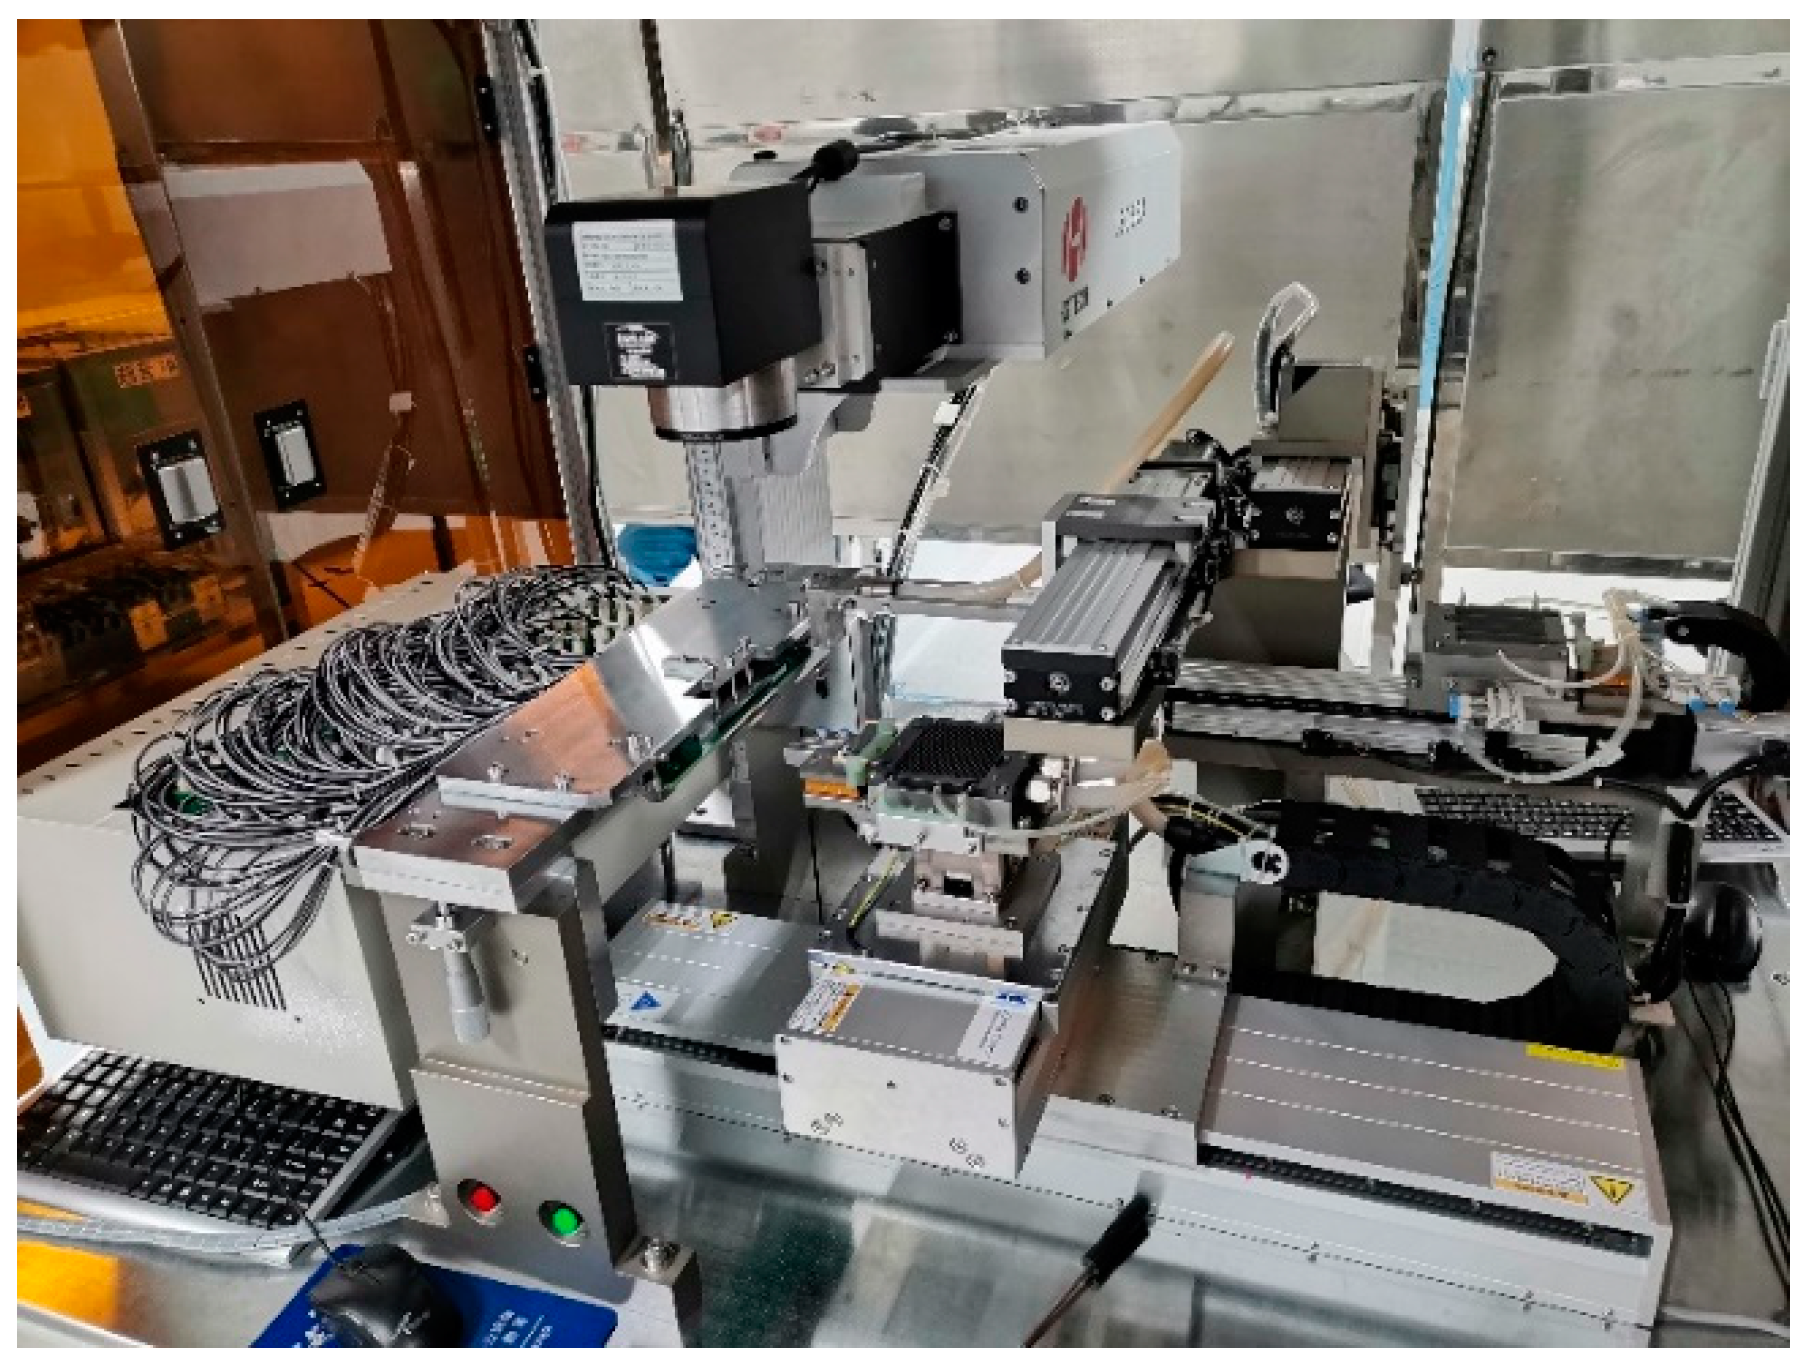
Considering the requirements of function, precision, and frequency modulation characteristics of laser processing, the components and hardware of the laser processing platform for MCR frequency modulation are selected. In the assembly process, the frequency test probe fixing mechanism should be assembled first. From the previous conclusions, the plane at the end of the frequency test probe is used as the reference, the Y and Z direction are the main tuning directions, and the Z direction should be corrected after corrections of both X and Y directions are done. The Z direction at the initial position of the frequency test probe should retract by 30 μm to ensure effective contact. After the assembly of the laser processing platform for MCR frequency modulation is completed, the pneumatic power and the electric power are connected according to the design requirements. The prototype is shown in Figure 12.

5.2. Accuracy Verification Experiment of the Laser Processing Platform for MCR Frequency Modulaiton

The measured positioning deviation of the frequency test probe is shown in Table 3. The average positioning deviation in X direction is 2.955 μm, and the average positioning deviation in Y direction is 5.816 μm, which meets the positioning accuracy requirements of the frequency test probe of the laser processing platform for MCR frequency modulation.

5.3. Experiment on Frequency Modulation Characteristics of the Laser Processing Platform for MCR

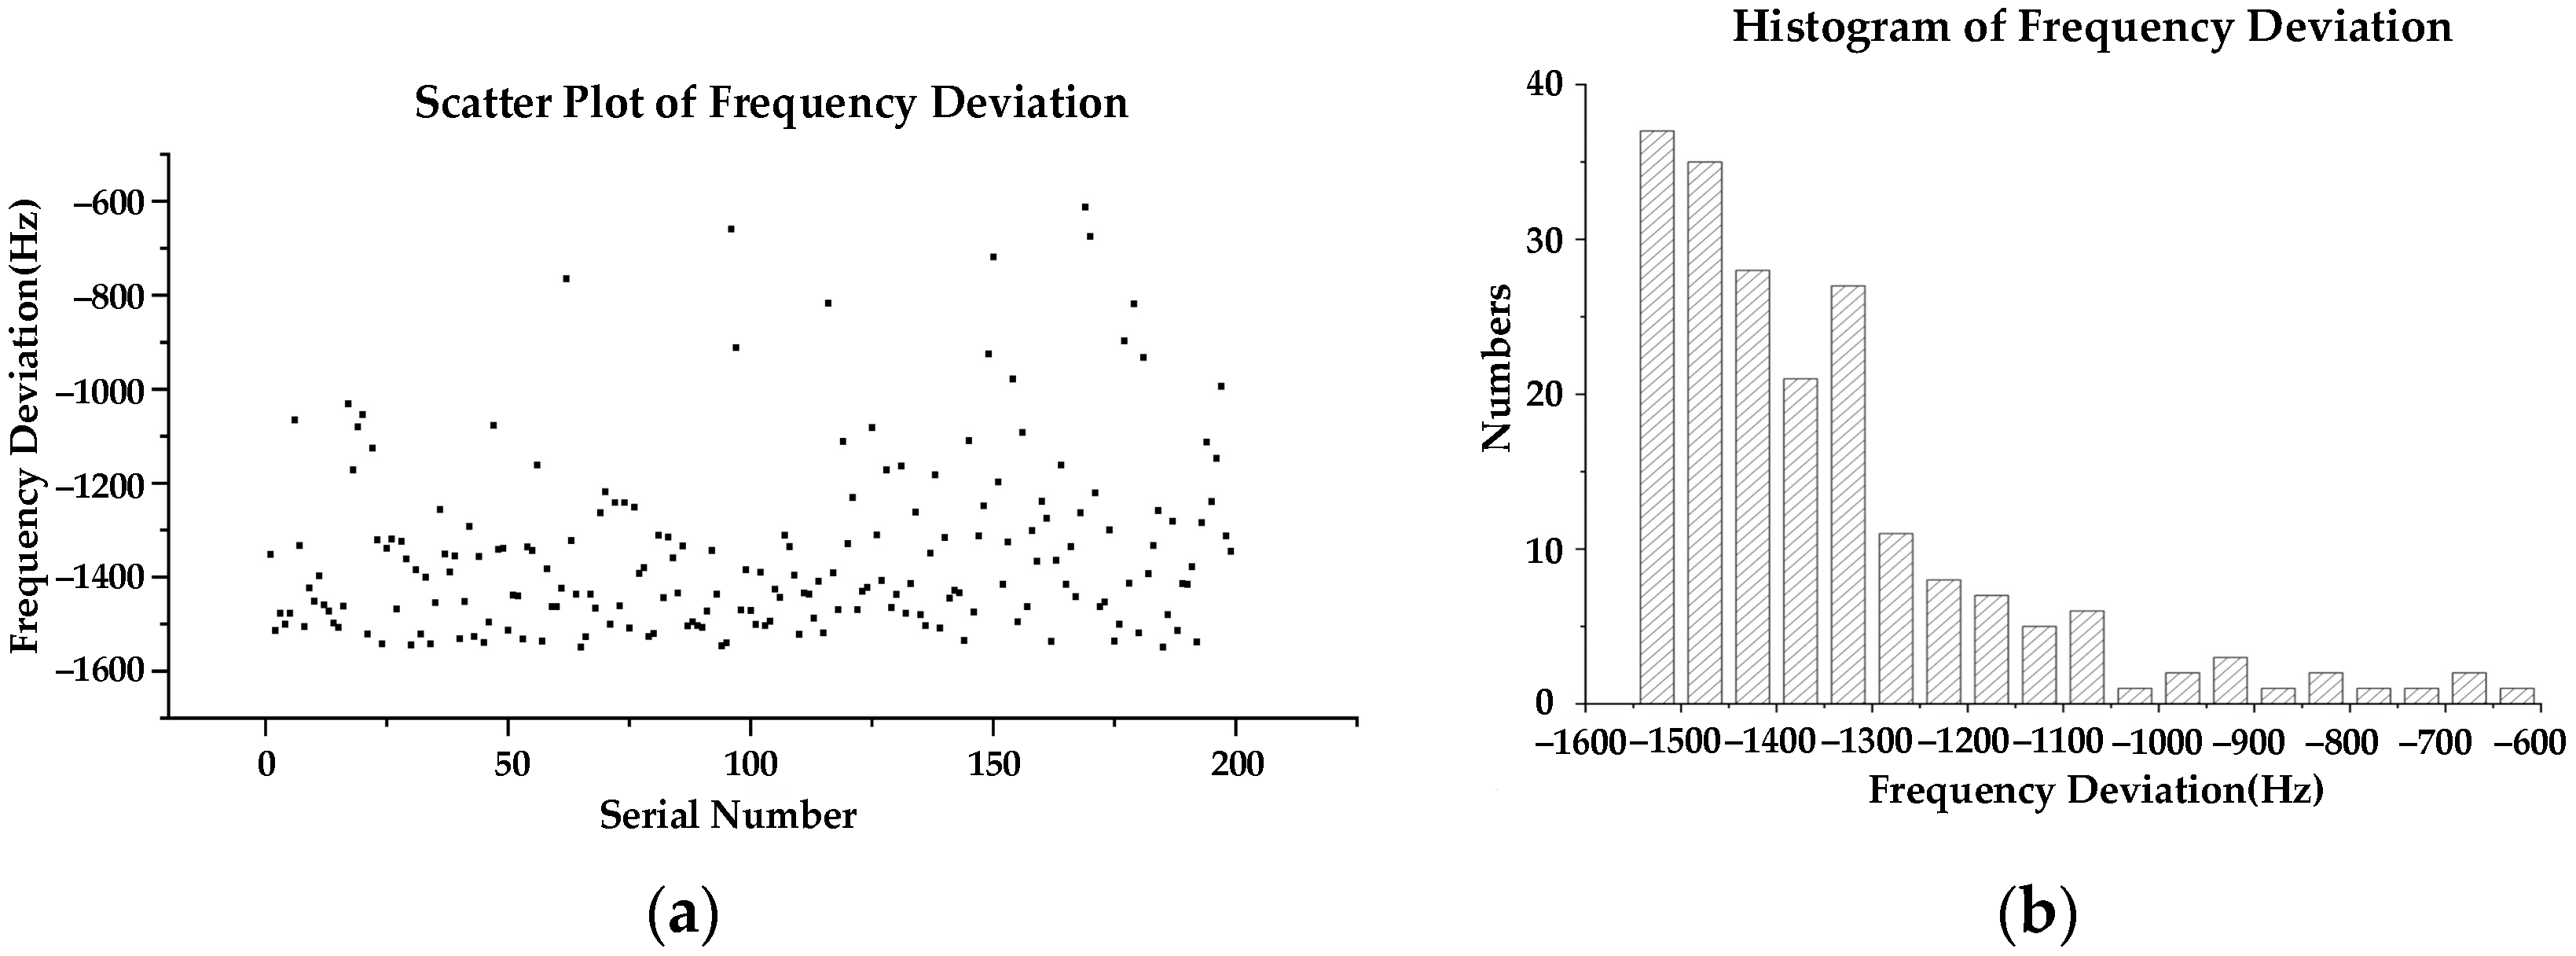
The target frequency of the MCR studied in this paper is 32.768 kHz. The difference between the processed MCR frequency and the target frequency is the frequency deviation. According to the actual process requirements, the frequency deviation of MCR after rough adjustment should be controlled between −900 Hz and −1550 Hz. In order to verify the frequency deviation range of MCR, the test wafer is fed to the laser processing platform and the laser processing test is carried out with the tuning program. The frequency deviation of the MCRs after processing is shown in Figure 13. The frequency deviation of 96% of the MCR products processed by the prototype is within the allowable range. The laser processing platform can basically meet the needs of coarse frequency adjustment of MCR.
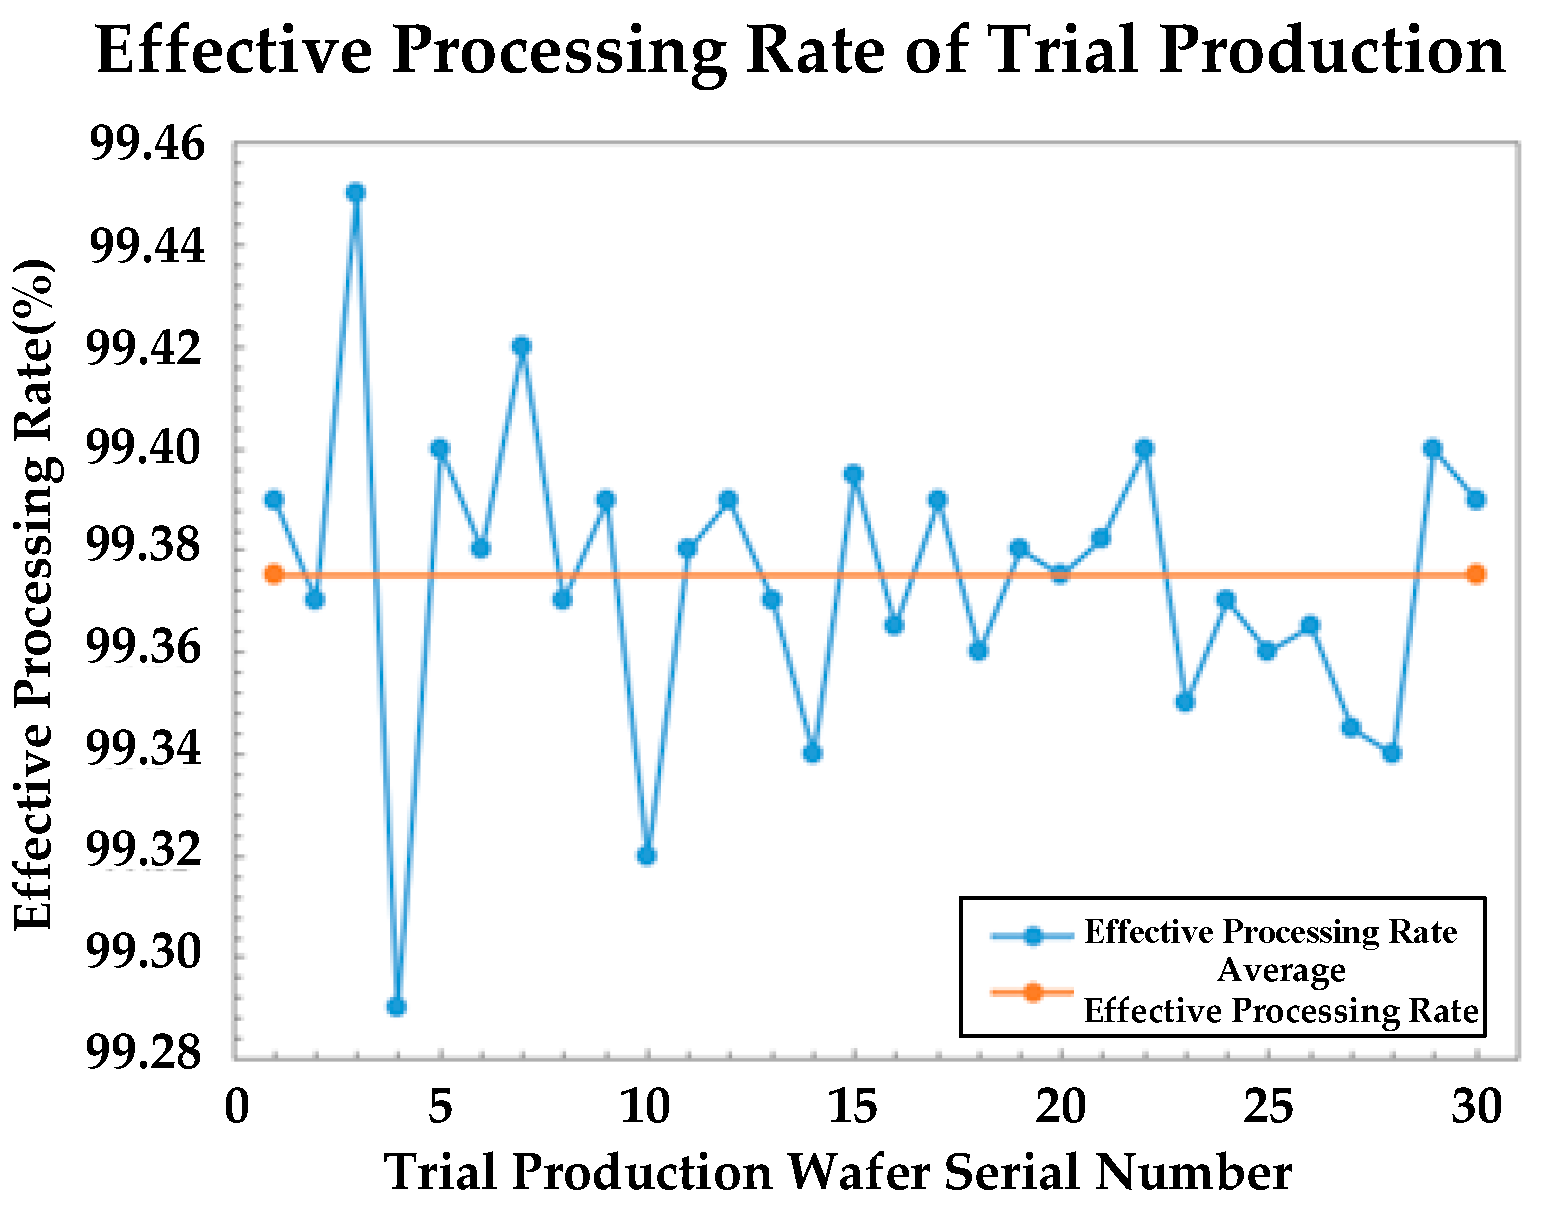
After the tuning of the prototype of the laser processing platform is completed, in order to verify the requirements of the stability and efficiency of the laser processing platform, the equipment is further tuned, and the frequency modulation performance is tested through trial production. The number of unqualified products caused by poor contact between the frequency test probe and the MCR circuit during the trial production of each wafer is counted. The effective processing rate in the trial production is shown in Figure 14. The average effective processing rate reaches 99.375%, meeting the processing requirements.

6. Conclusions

The laser processing platform for MCR frequency modulation is taken as the research object in this paper. By analyzing the error source and error transfer path, and using the multi-body system theory, the positioning error matrix of the probe end of the laser processing platform is obtained.
Based on the Monte Carlo method, the probe end positioning error of the laser processing platform is simulated by generating the normal distribution random number of error variables in the error model. Through 250,000 simulations, the mean value and standard deviation of probe end positioning error of laser processing platform are obtained. According to the simulation results, the initial positioning value of the machining platform in Z direction retracts 30 μm.
Through the prototype test, the effective productivity of the laser processing platform is 96%. After further tuning, trial production was carried out, and the effective productivity reached 99.375%, which met the actual production demand. It is proved that the laser processing platform is feasible for engineering application.
In this paper, the error model of laser processing platform is obtained, and the feasibility of laser processing platform equipment is verified. In order to optimize the accuracy of the equipment, more effective error analysis model and accuracy optimization can be researched by analyzing the characteristics of each component in a subsequent study.

Author Contributions

Methodology, Z.L.; formal analysis, Y.W.; writing—original draft preparation, Z.L.; writing—review and editing, J.H. and G.L.; funding acquisition, X.Y. All authors have read and agreed to the published version of the manuscript.

Funding

This research received no external funding.

Conflicts of Interest

The authors declare no conflict of interest.

References

  1. Leete, D.L. Automatic compensation of alignment errors in machine tools. Int. J. Mach. Tools Manuf. 1961, 1, 293–324. [Google Scholar] [CrossRef]
  2. Love, W.J.; Scarr, A.J. The determination of the volumetric accuracy of multi axis machines. In Proceedings of the Fourteenth International Machine Tool Design and Research Conference, Manchester, UK, 12–14 September 1973; Koenigsberger, F., Tobias, S.A., Eds.; Macmillan Education UK: London, UK, 1974. [Google Scholar]
  3. Kiridena, V.S.B.; Ferreira, P.M. Kinematic modeling of quasistatic errors of three-axis machining centers. Int. J. Mach. Tools Manuf. 1994, 34, 85–100. [Google Scholar] [CrossRef]
  4. Zhong, G.; Wang, C.; Yang, S. Position geometric error modeling, identification and compensation for large 5-axis machining center prototype. Int. J. Mach. Tools Manuf. 2015, 89, 142–150. [Google Scholar] [CrossRef]
  5. Chen, J.X.; Lin, S.W.; Zhou, X.L. A comprehensive error analysis method for the geometric error of multi-axis machine tool. Int. J. Mach. Tools Manuf. 2016, 106, 56–66. [Google Scholar] [CrossRef]
  6. Tang, H.; Duan, J.A.; Lan, S.; Shui, H. A new geometric error modeling approach for multi-axis system based on stream of variation theory. Int. J. Mach. Tools Manuf. 2015, 92, 41–51. [Google Scholar] [CrossRef]
  7. Xiang, S.; Altintas, Y. Modeling and compensation of volumetric errors for five-axis machine tools. Int. J. Mach. Tools Manuf. 2016, 101, 65–78. [Google Scholar] [CrossRef]
  8. Liang, Y.; Chen, G.; Chen, W.; Sun, Y.; Chen, J. Analysis of volumetric error of machine tool based on Monte Carlo method. J. Comput. Theor. Nanosci. 2013, 10, 1290–1295. [Google Scholar] [CrossRef]
  9. Qureshi, A.J.; Dantan, J.Y.; Sabri, V.; Beaucaire, P.; Gayton, N. A statistical tolerance analysis approach for over-constrained mechanism based on optimization and Monte Carlo simulation. Comput. Aided. Des. 2012, 44, 132–142. [Google Scholar] [CrossRef] [Green Version]
  10. Goka, E.; Beaurepaire, P.; Homri, L.; Dantan, J.Y. Probabilistic-based approach using Kernel Density Estimation for gap modeling in a statistical tolerance analysis. Mech. Mach. Theory. 2019, 139, 294–309. [Google Scholar] [CrossRef] [Green Version]
  11. Wu, F.; Dantan, J.Y.; Etienne, A.; Siadat, A.; Martin, P. Improved algorithm for tolerance allocation based on Monte Carlo simulation and discrete optimization. Comput. Ind. Eng. 2019, 56, 1402–1413. [Google Scholar] [CrossRef]
  12. Bruyere, J.; Dantan, J.Y.; Bigot, R.; Martin, P. Statistical tolerance analysis of bevel gear by tooth contact analysis and Monte Carlo simulation. Mech. Mach. Theory 2007, 42, 1326–1351. [Google Scholar] [CrossRef]
  13. Dantan, J.Y.; Qureshi, A.J. Worst-case and statistical tolerance analysis based on quantified constraint satisfaction problems and Monte Carlo simulation. Comput. Aided. Des. 2009, 41, 1–12. [Google Scholar] [CrossRef]
  14. Tsirkas, S.A. Numerical simulation of the laser welding process for the prediction of temperature distribution on welded aluminium aircraft components. Opt. Laser. Technol. 2018, 100, 45–56. [Google Scholar] [CrossRef]
  15. Brügmann, M.H.; Feurer, T. Comparative theoretical analysis of continuous wave laser cutting of metals at 1 and 10 μm wavelength. Appl. Phys. A 2014, 116, 1353–1364. [Google Scholar] [CrossRef] [Green Version]
  16. Weng, Z.; Wang, A.; Wang, Y.; Xiong, D.; Tang, H. Diode laser cladding of Fe-based alloy on ductile cast iron and related interfacial behavior. Surf. Coat. Technol. 2016, 286, 64–71. [Google Scholar] [CrossRef]
  17. Harničárová, M.; Valíček, J.; Kušnerová, M.; Hutyrová, Z.; Panda, A.; Temuçin, T. Method of determination of enthalpy and entropy for the technology of laser cutting: Verfahren zur Bestimmung der Enthalpie und Entropie für das Laserschneiden. Materwiss. Werksttech. 2016, 47, 452–461. [Google Scholar] [CrossRef]
  18. Ovsik, M.; Stanek, M.; Hylova, L.; Manas, M.; Stoklasek, P. The thermal energy influence on the surface layer of construction steels during laser beam cutting. Manuf. Technol. 2019, 19, 123–128. [Google Scholar] [CrossRef]
  19. Long, N.P.; Matsunaga, Y.; Hanari, T.; Yamada, T.; Muramatsu, T. Experimental investigation of transient temperature characteristic in high power fiber laser cutting of a thick steel plate. Opt. Laser. Technol. 2016, 84, 134–143. [Google Scholar] [CrossRef]
  20. Nyon, K.Y.; Nyeoh, C.Y.; Mokhtar, M.; Abdul-Rahman, R. Finite element analysis of laser inert gas cutting on Inconel 718. Int. J. Adv. Manuf. Technol. 2012, 60, 995–1007. [Google Scholar] [CrossRef]
  21. Gallais, L.; Capoulade, J.; Wagner, F.; Natoli, J.Y.; Commandre, M. Analysis of material modifications induced during laser damage in SiO2 thin films. Opt. Commun. 2017, 272, 221–226. [Google Scholar] [CrossRef]
Figure 1. The MCRs before and after laser processing. (a) MCRs before laser processing. (b) MCRs after laser processing.
Applsci 12 01340 g001
Figure 2. Layout of the laser processing platform for MCR frequency modulation.
Applsci 12 01340 g002
Figure 3. 3D model of the laser processing platform for MCR frequency modulation.
Applsci 12 01340 g003
Figure 4. Frequency test probe fixing mechanism.
Applsci 12 01340 g004
Figure 5. Qualified and unqualified products of MCRs. (a) Normal products, (b) unclean processing, (c) insufficient processing, and (d) silver layer damage.
Applsci 12 01340 g005
Figure 6. Subdivision function of the laser processing platform.
Applsci 12 01340 g006
Figure 7. Positioning error of MCR.
Applsci 12 01340 g007
Figure 8. Error source of the laser processing platform for MCR frequency modulation.
Applsci 12 01340 g008
Figure 9. Error transmission line of the laser processing platform for MCR frequency modulation.
Applsci 12 01340 g009
Figure 10. Typical bodies of the laser processing platform for MCR frequency modulation.
Applsci 12 01340 g010
Figure 11. Positioning error of probe end. (a) Ex distribution at the end of the probe, (b) Ey distribution at the end of the probe, and (c) Ez distribution at the end of the probe.
Applsci 12 01340 g011
Figure 12. Prototype of the laser processing platform for MCR frequency modulation.
Applsci 12 01340 g012
Figure 13. Scatter diagram and histogram of frequency deviation of MCRs. (a) Scatter plot of frequency deviation and (b) histogram of frequency deviation.
Applsci 12 01340 g013
Figure 14. Effective processing rate of trial production.
Applsci 12 01340 g014
Table 1. LBA of the laser processing platform for MCR frequency modulation.
Typical   Body   j 1234567
L 0 ( j ) 1234567
L 1 ( j ) 0103456
L 2 ( j ) 0000345
L 3 ( j ) 0000034
L 4 ( j ) 0000003
L 5 ( j ) 0000000
L 6 ( j ) 0000000
L 7 ( j ) 0000000
Table 2. Mean value and standard deviation of the positioning error.
Positioning Error of Probe EndMean Value (μm)Standard Deviation (μm)
Ex−0.024320.3
Ey−0.021126.8
Ez−0.011612.1
Table 3. Positioning error of the laser processing platform for MCR frequency modulation.
DirectionPositioning Error of Laser Processing Platform for MCR Frequency Modulation
(μm)
X3.0862.8452.7862.9453.102
2.6753.1123.0262.9153.056
Y5.6875.8455.8985.7695.895
5.8655.7565.9545.6755.812
Publisher’s Note: MDPI stays neutral with regard to jurisdictional claims in published maps and institutional affiliations.