Article

Scenario-Based Configuration Refinement for High-Load Cellular Networks: An Operator View

1
School of Internet of Things, Nanjing University of Posts and Telecommunications, Nanjing 210003, China
2
China Mobile Group Jiangsu Company Ltd., Nanjing 210029, China
*
Author to whom correspondence should be addressed.
Appl. Sci. 2022, 12(3), 1483; https://doi.org/10.3390/app12031483
Submission received: 6 January 2022 / Revised: 25 January 2022 / Accepted: 26 January 2022 / Published: 29 January 2022
(This article belongs to the Special Issue Applications of Mobile Computing in Wireless Networks)

Abstract

:
With the rapid growth of users and sustained network demands powered by different industries, the quality of service (QoS) of the cellular network is affected by network traffic and computing loads. The current solutions of QoS improvement in academia focus on the fundamental algorithms within the physical and medium access control (MAC) layer. However, traffic features of various scenarios extracted from field data are rarely addressed for practical network configuration refinement. In this paper, we identify significant indicators of high traffic load cells according to the field data provided by telecommunication operators. Then, we propose the analysis flow of high traffic load cells with basic principles of network configuration refinement for QoS improvement. To demonstrate the proposed analysis flow and the refinement principles, we consider three typical scenarios of high traffic load cells, including high population density, emergency, and high-speed mobility. For each scenario, we discuss traffic features with field data. The corresponding performance evaluation demonstrates that the proposed principle can significantly enhance the network performance and user experience in terms of access success rate, downlink data rate, and number of high traffic load cells.

1. Introduction

The widely deployed fifth generation (5G) and the coming sixth (6G) communication networks are believed to offer a large amount of network services for growing diverse demands, such as high-definition video playing, vehicular networks, massive Internet of Things, and telemedicine [1,2,3]. These demands are generated by traditional mobile communication applications and vertical market segments with different requirements for quality of service (QoS) and key performance indicators (KPI) [4,5,6,7]. It is challenging to achieve novel communication performance by a “one-size-fits-all” network infrastructure for various requirements of QoS and KPI. In the past several years, network slicing, supported by a software-defined network (SDN) and network function virtualization (NFV), is a promising technique in future communications [8,9,10]. By extracting communication network resources into different levels, efficient network slicing can provide customized network services according to different network QoS requirements [11,12]. Incorporated with machine learning algorithms, network slicing can significantly increase the performance of cellular networks in different scenarios and applications [13,14,15,16].
However, nearly all emerging communication techniques should be implemented on the telecommunication equipment manufactured by different vendors [17,18]. In general, vendors provide large amounts of parameter configurations to fit for different scenarios. Taking the perspective of the telecommunication operator, these parameter configurations should be carefully designed by jointly considering the specific scenario and equipment capacity [19,20,21]. Unified network parameter configuration may not always achieve novel performance when traffic loads are burst and varying in different scenarios, such as high population density areas, emergencies, and high-speed mobility [22,23]. For example, imbalanced distribution of traffic loads among cells and extremely high traffic loads in certain areas of cells tend to occur in large-scale concert. On the other hand, different scenarios exhibit different characteristics of traffic loads, which require parameter configuration tuning to satisfy the high requirement of user experience and to achieve novel network resource allocation. The majority of academic research works in communication networks focus on efficient algorithms to enable performance optimization both in physical and medium access control (MAC) layers. In [24], the authors summarized the main techniques of resource allocation in 5G heterogeneous networks, including macro-, micro-, pico-, and femto-cellular networks. More specific scenarios beyond 5G and 6G are discussed in [25,26]. The authors in [25] discussed energy consumption issues within a massive Internet of Things (IoT) system. Various dynamic network architectures and corresponding algorithms are presented in detail. For 6G spectrum utilization, the authors in [26] presented a big data processing algorithm to improve spectrum utilization for 6G cellular and IoT networks. However, there are few works related to the refinement of parameter configurations of cellular networks based on field data in practice, which becomes a practical and challenging issue that telecommunication operators have to solve.
In this paper, taking the perspective of a telecommunication operator, we propose a framework of network feature analysis and configuration refinement for cellular networks. Moreover, we analyze traffic features of different scenarios with high traffic loads by considering the field data. The significant indicators of high traffic load cells are identified and associated with performance metrics. According to these indicators, we propose different configuration refinement polices that are discussed in detail in several typical scenarios, such as high population density, emergencies, and high-speed mobility. The corresponding performance evaluation is also provided for different scenarios with the proposed refinement polices. The remainder of this paper is organized as follows. Section 2 presents the analysis framework of high traffic load cells with different configuration refinement polices. We investigate three typical scenarios to demonstrate the proposed configuration refinement in Section 3, Section 4 and Section 5. For each scenario, we analyze the traffic load feature by the proposed analysis framework and provide sets of solutions to improve the user experience and network performance. The paper is concluded in Section 6.

2. Analysis of High Traffic Load Cells

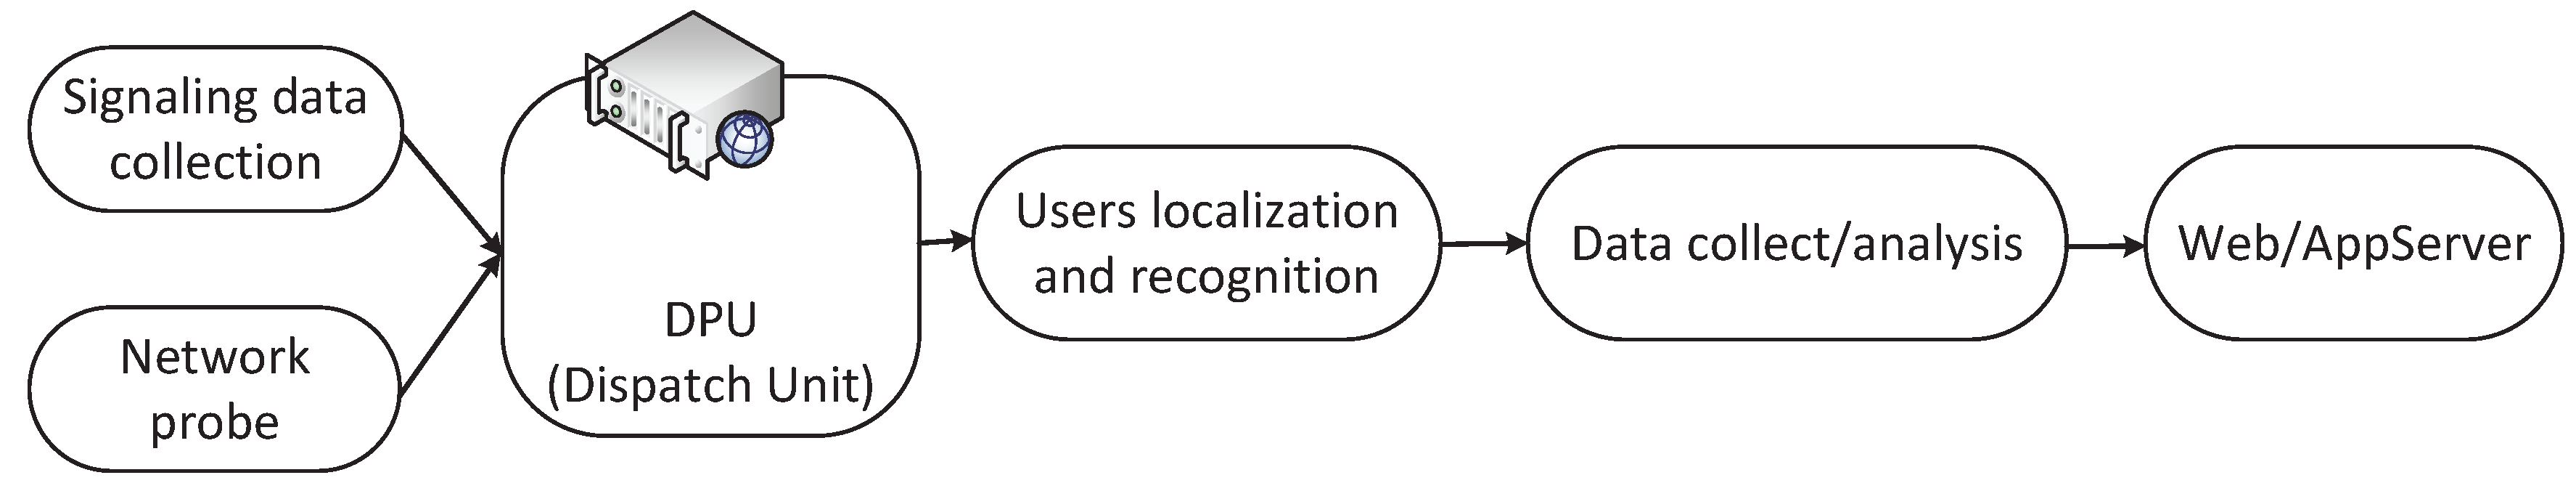
2.1. Network Traffic Analysis Framework

As shown in Figure 1, we can capture network traffic features by two approaches. One is to analyze traffic features by collecting signaling packets. This approach is a reactive method with less overhead. Another approach is to send network probes to proactively obtain network traffic features in real time. According to these two approaches, we can distinguish users in terms of basic business data, location, current status, and preference. For different users, we can identify different network performance metrics by analyzing collected field data, which is discussed in the following subsections. In addition, the web and the application service are offered to display and to configure the network parameters.

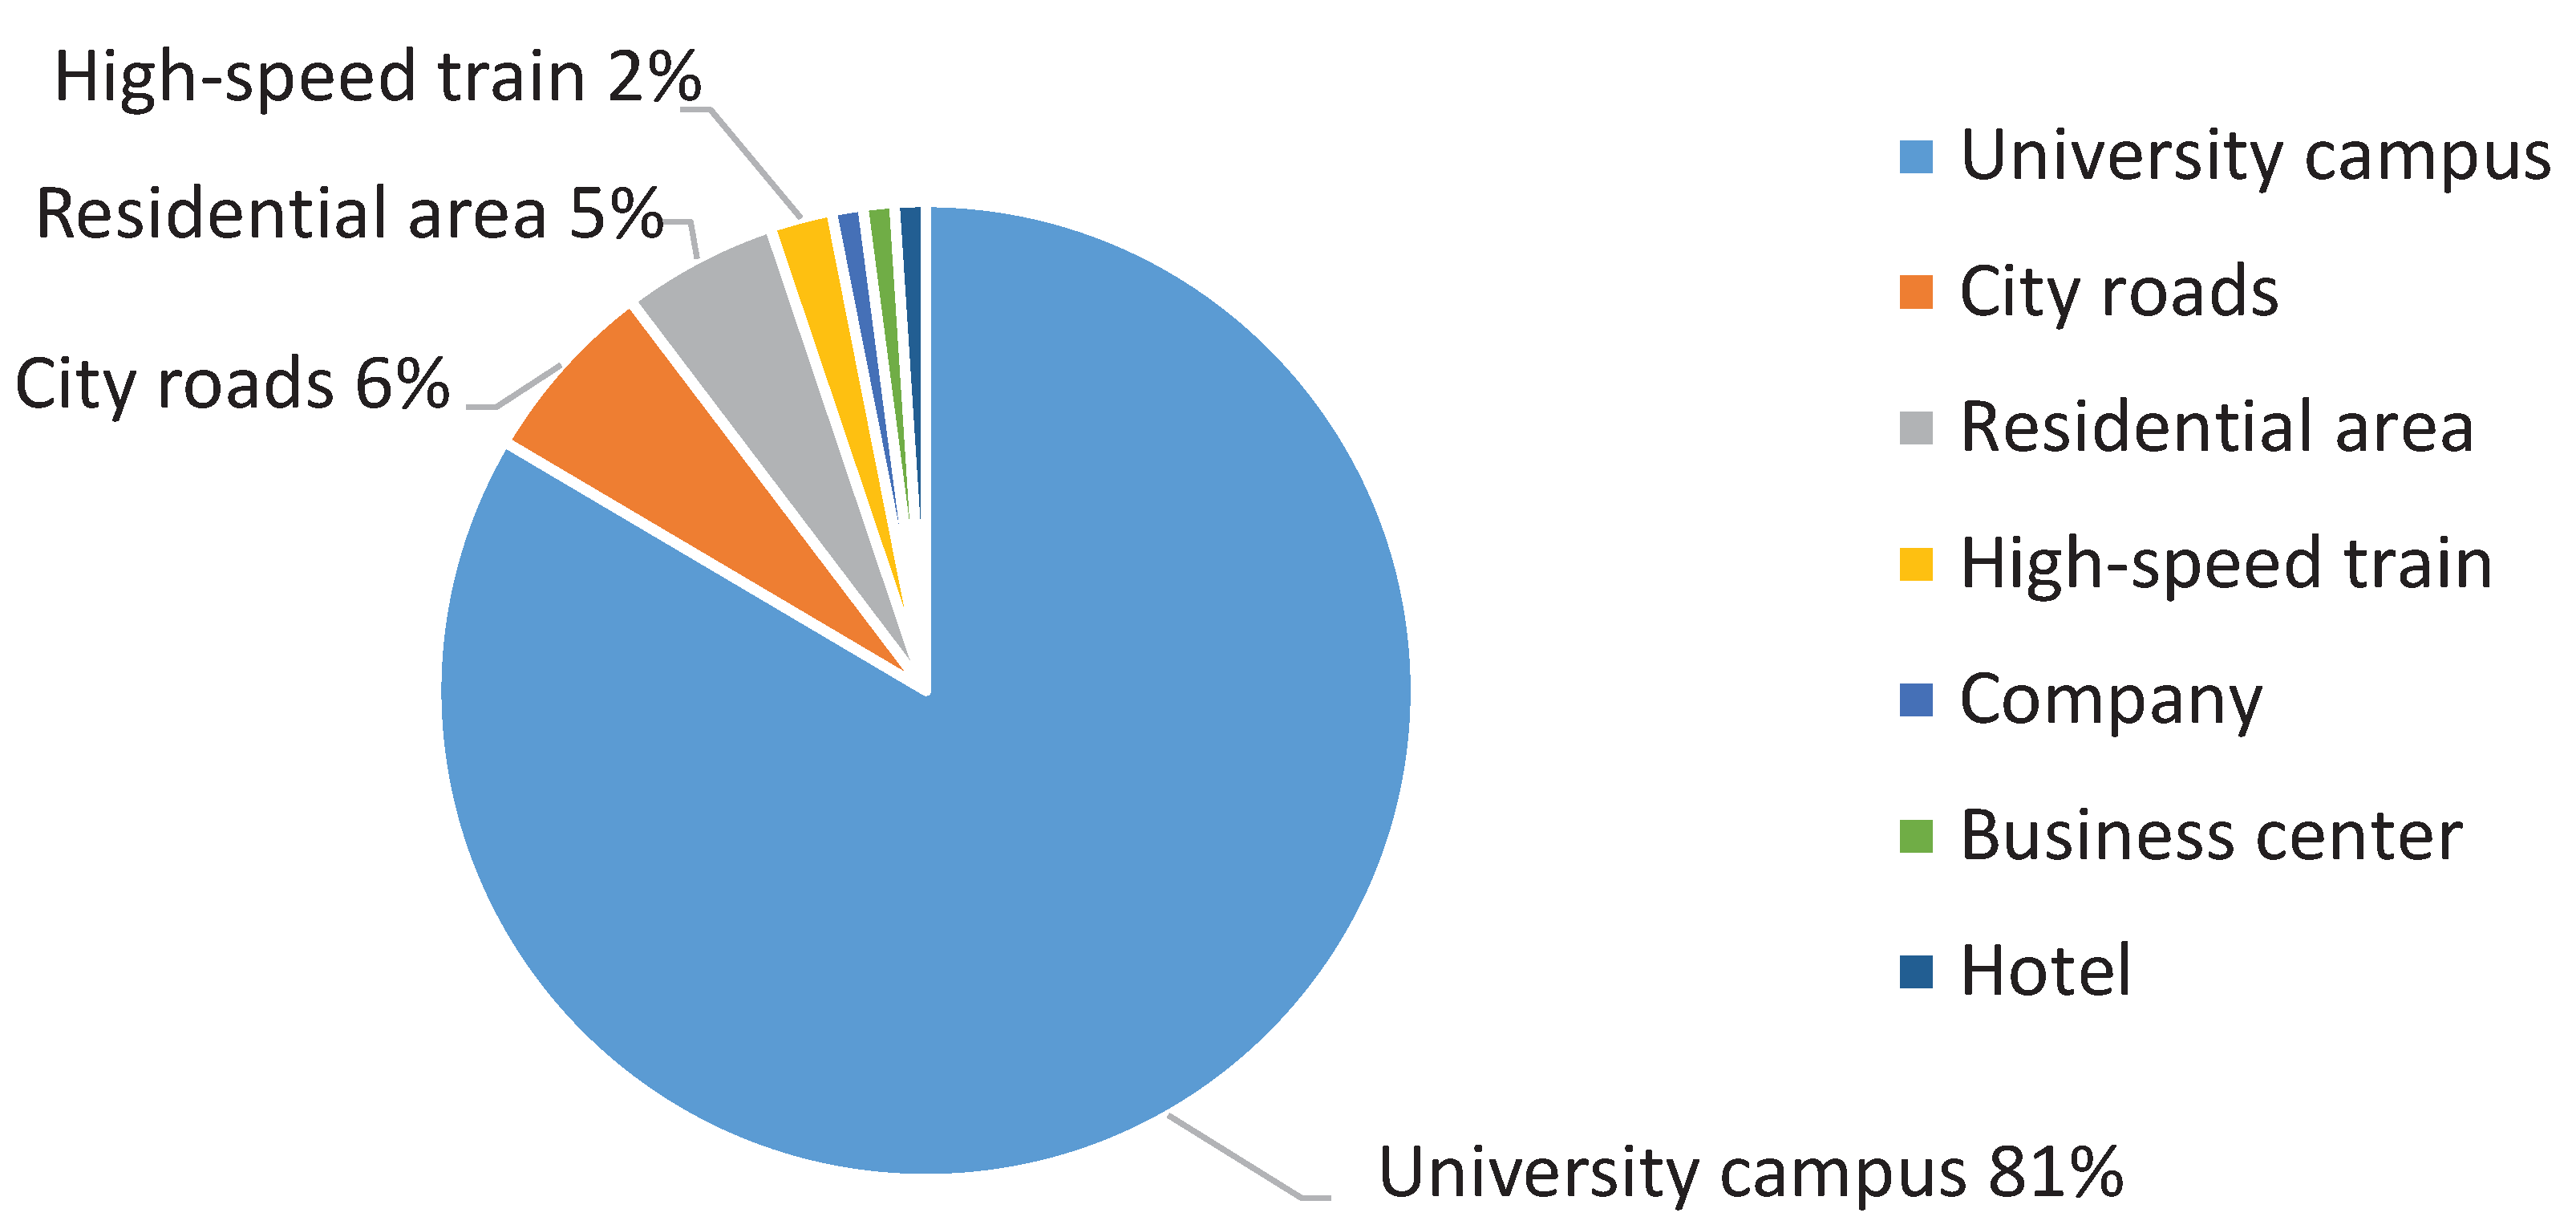
2.2. High Traffic Load Cells Identification and Current Situation

Taking the perspective of telecommunication operators powered by field data, the performance of access and single user data rate are two significant metrics used to evaluate service quality of cells as well as user experience. The performance of access is often related to the capacity of telecom equipment designed by vendors. More specifically, the loads of the universal main processing and transmission unit (UMPT) and LTE baseband processing units (LBBP) are considered when conducting configuration refinement. For the single user data rate, we always investigate two factors, the physical resource block (PRB) utilization ratio and the average number of online users (i.e., ANOU). Thus, after comprehensively considering the comments from vendors, we identify the maximum number of online users (MNOU), the PRB utilization ratio (or the average number of online users (ANOU)), and loads of UMPT and LBBP as three significant indicators of high traffic load cells. As shown in Table 1, these three indicators present different thresholds embedded by telecom equipment manufactured by different vendors.
Using these three indicators, we take cellular networks deployed in Jiangsu province as examples to study the features of high traffic load cellular networks. We monitor the field data of cellular networks multiple times in several weeks, and all field data reported in this paper are average means. As statistics show in Table 2, we observe that network performance metrics of cells with high traffic loads, that is, access success rate and single user downlink speed, are significantly lower than those of all cells. Moreover, around 81% of cells with high traffic loads are located in university campuses, which is shown in Figure 2. Based on these observations, we analyze the relationships between three indicators and the network performance metrics (i.e., access success rate and single user downlink speed) in Section 2.3 and Section 2.4.

2.3. Relationship between Access Success Rate and Equipment Capacity

The success access ratio of the cellular network is directly related with the capacity of the network equipment, which is represented by the threshold of MNOU and the flow control supported by boards. We take the UMPT and LBBP produced by Huawei as examples. Moreover, we realized the MNOU is 400 for a single cellular network. The flow control, affecting user access, is triggered when the central processing unit (CPU) utilization ratio of UMPT and LBBP is larger than 85%. More detailed field data are reported in Table 3 and Table 4. Table 3 summarizes the radio resource control (RRC) setup success rate and the unsuccessful times of physical uplink control channel (PUCCH) allocation under different numbers of online users when MNOU is larger than the predefined threshold. Table 4 studies the RRC setup success rate and the number of the dropped messages caused by flow control implemented on UMPT and LBBP, respectively.
It is obvious that the RRC setup success rate significantly decreases when MNOU is larger than the predefined threshold with larger unsuccess times of PUCCH allocation. Meanwhile, we observe that the number of dropped messages significantly increases when the maximum CPU utilization ratio is over 85%. According to field data reported in Table 3 and Table 4, we have to leave a certain level of margin for MNOU and the CPU loads of UMPT and LBBP, respectively. It is worth noting that different venders provide the reference value of MNOU. For example, the waring threshold of MNOU is 180 out of 200 when using Bell equipment. When equipment manufactured by Huawei, ZTE, Ericsson, and DTT are used, the waring threshold is 300 and the corresponding MNOU is 400.

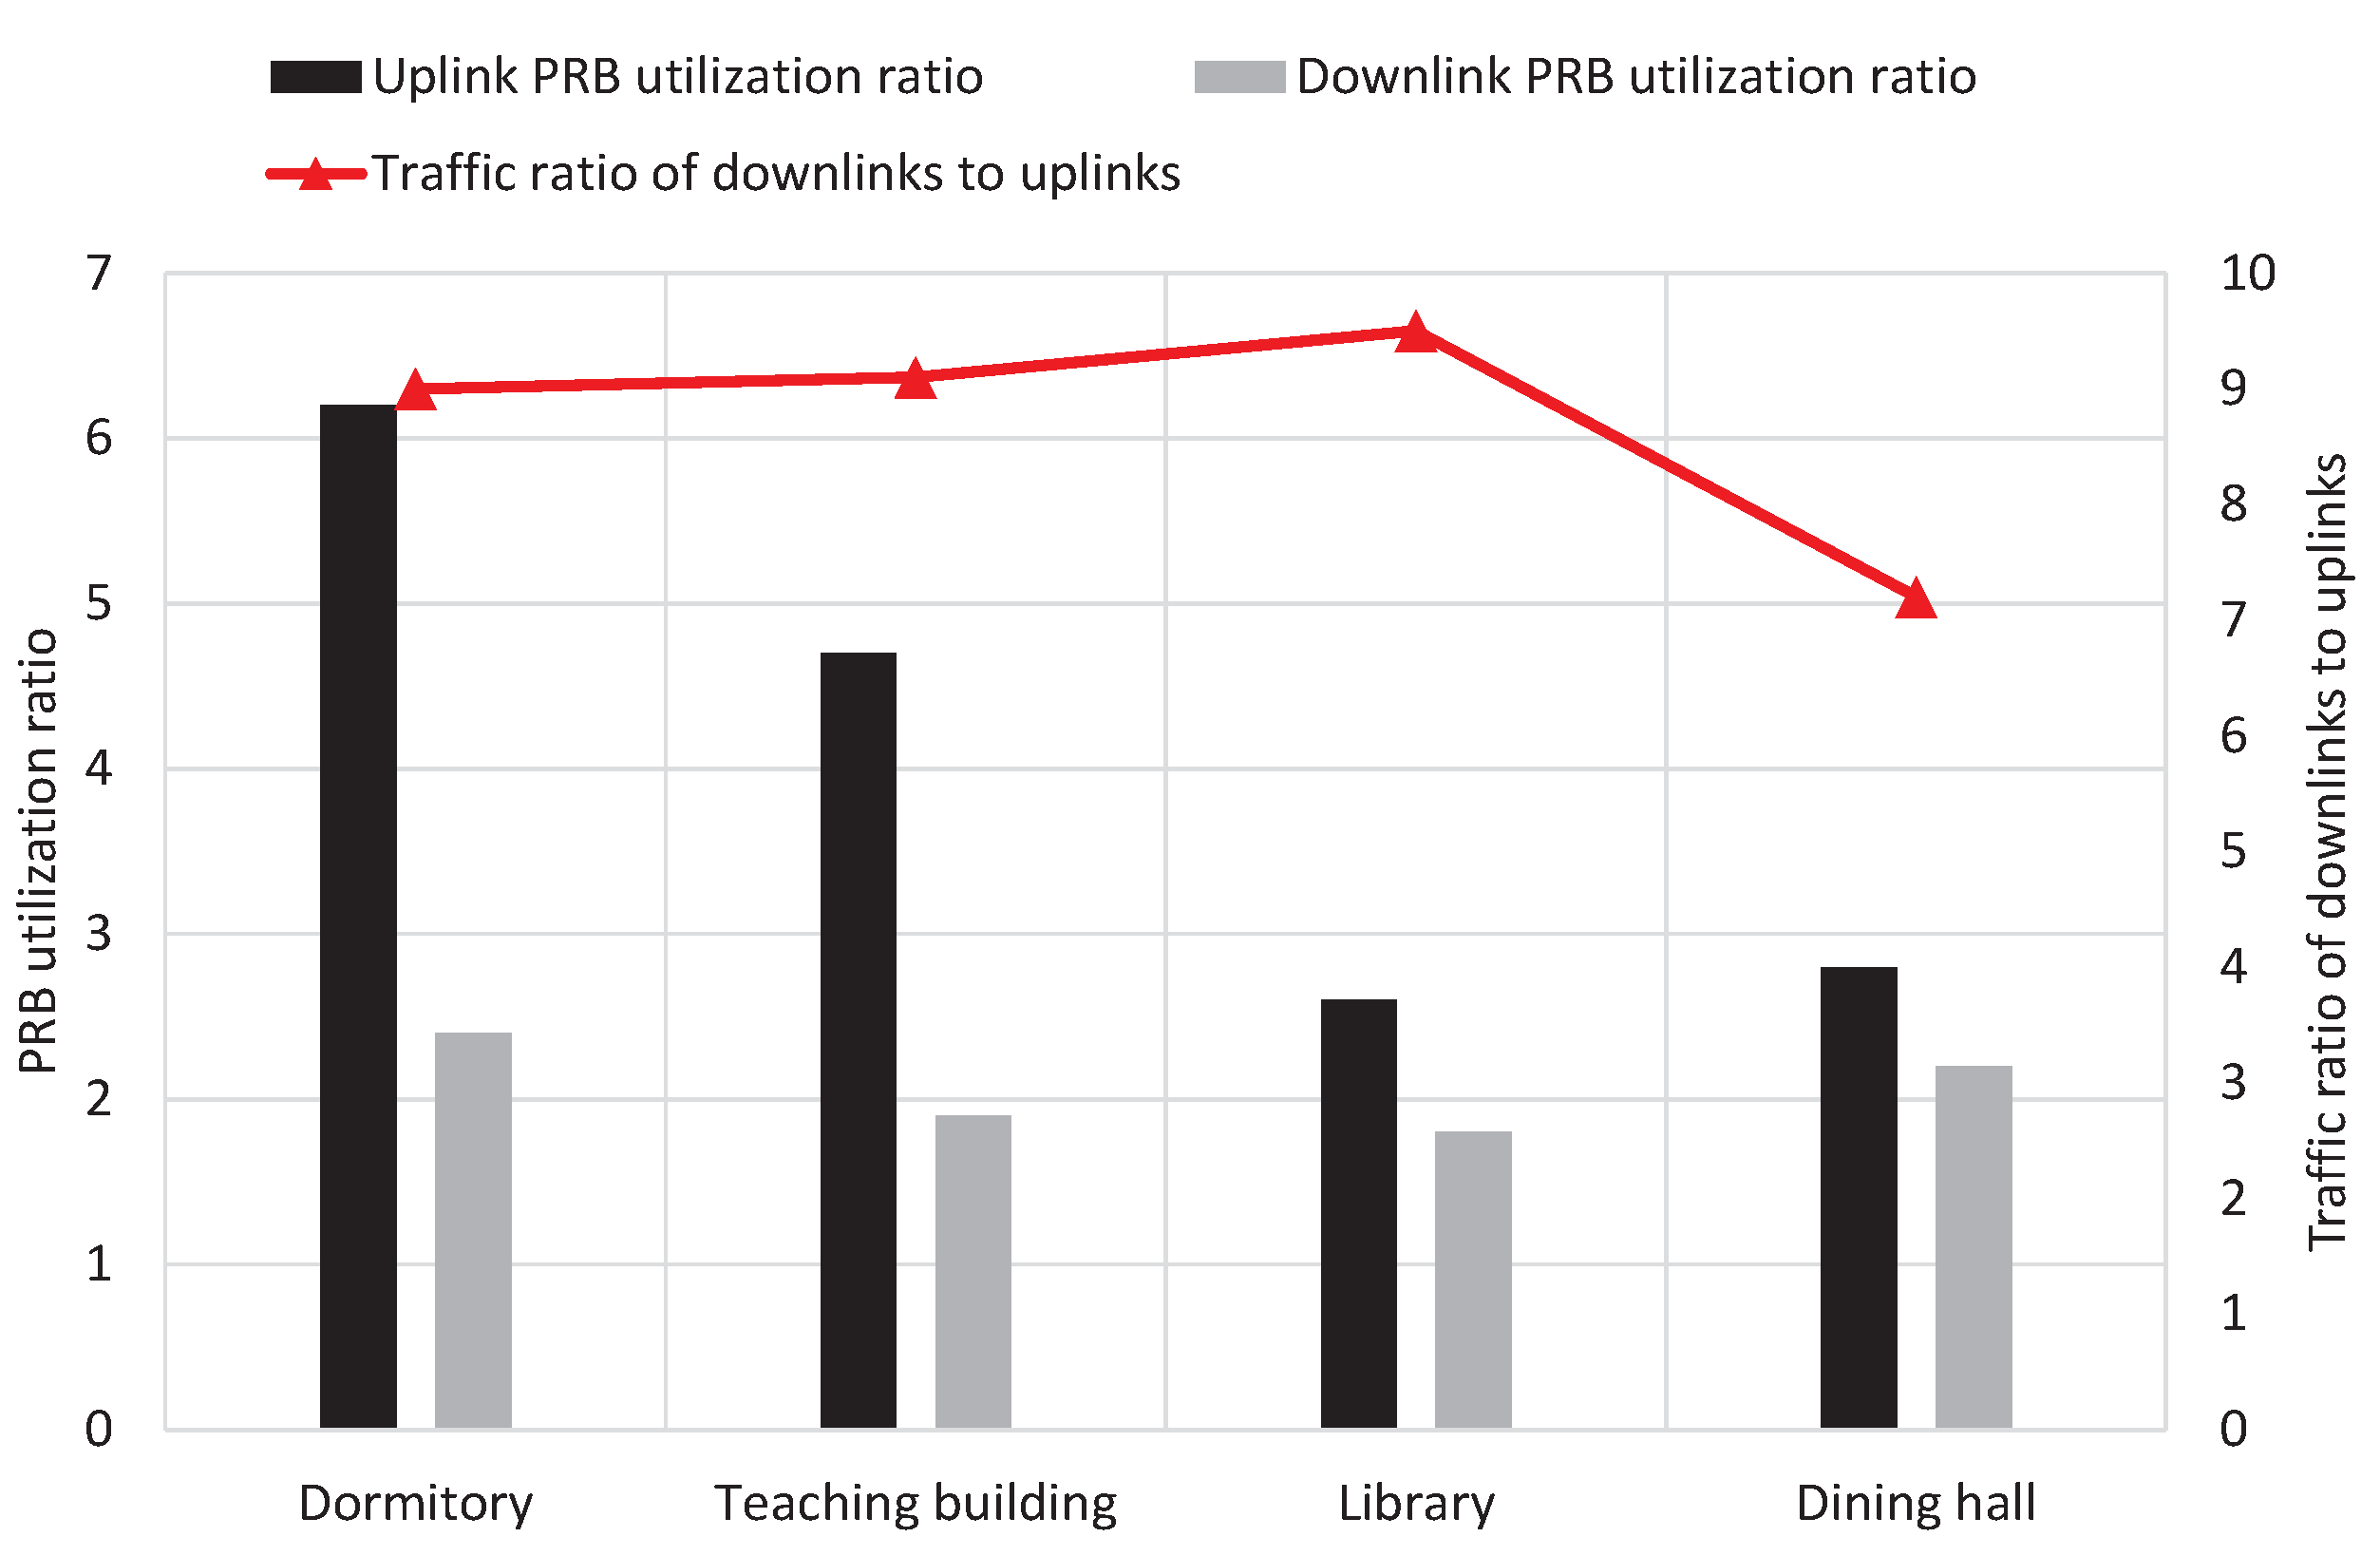
2.4. Relationship between PRB Utilization Ratio and Downlink Data Rate

We used 3 Mbps servers as the baseline of the downlink data rate to investigate the performance of a cellular network. According to the field data reported in Figure 3, the number of users with downlink speed lower than 3 Mbps significantly increases when the average number of users and PRB utilization ratio increases. As shown in Table 5, we realize that the percentages of users with low data rates are around 73% and 88% when downlink PRB utilization ratio ranges from 70% to 100%, respectively. Intuitively, we can set up the threshold of the utilization ratio of PRB according to field data as well as the threshold of ANOU, which are discussed in Section 3, Section 4 and Section 5.

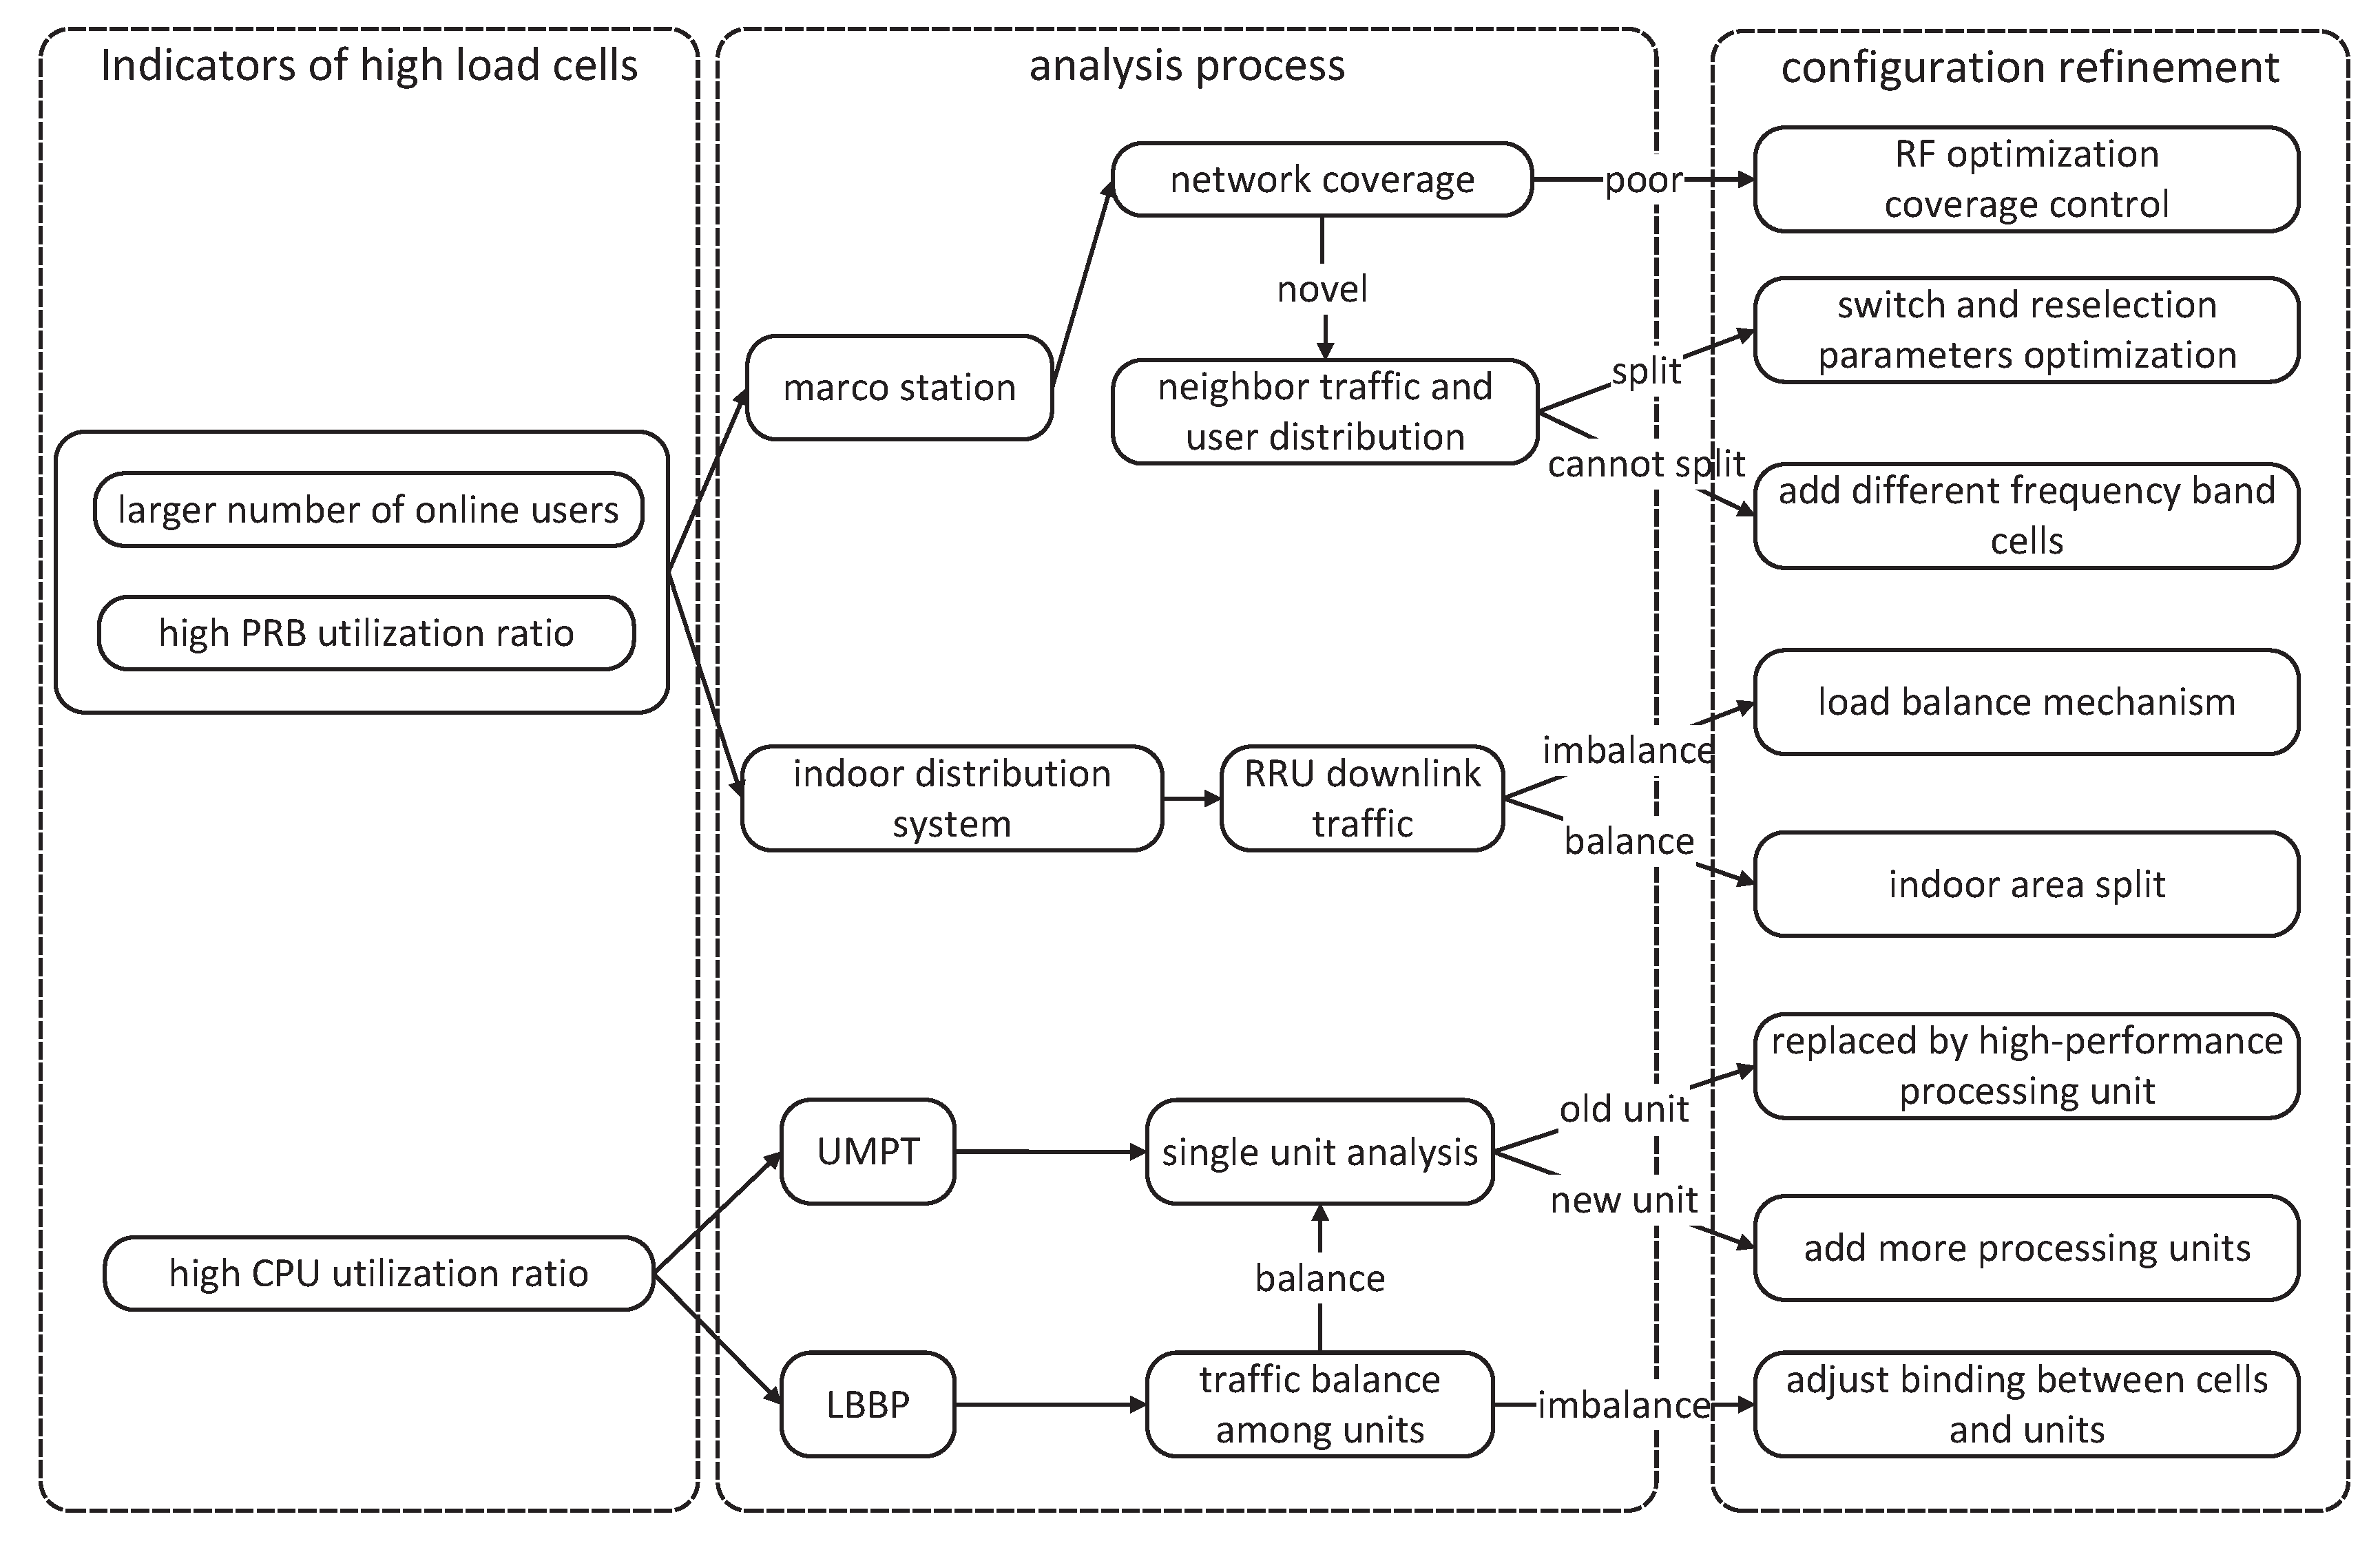
2.5. Analysis Process and Refinement Principles

As shown in Figure 4, we summarize the discussion in Section 2.3 and Section 2.4 by proposing the main flow of analysis process and configuration refinement for cellular networks. More specifically, by jointly considering the comments from vendors and the field data collected from current cellular networks (as shown in Table 1, Table 3 and Table 4), the MNOU and the PRB utilization ratio (or ANOU) are identified as the indicators of high traffic load macro cells and indoor distribution systems. For macro cells with high traffic loads, we can analyze traffic loads of neighbor cells and user distribution if the coverage of the current cell is not rational. For indoor distribution systems, the downstream traffic of remote radio unit(RRU) is analyzed if the traffic load is high. We categorize the case of high CPU utilization ratio into two folds that are high loads of UMPT and LBBP. Single unit analysis is conducted if the traffic load of UMPT is high, whereas the traffic load balance among different units is analyzed if the traffic load of LBBP is high. Traffic balance among units is carefully considered when the traffic load of LBBP is high. At the right side of Figure 4, we present different refinement policies corresponding to different cases. We present network configuration refinement of high traffic load cells in different scenarios using these policies in the following sections.

3. High Population Density Scenario

As shown in Figure 2, more than 80% of scenarios with high traffic load are located at university campuses, The university campuses always exhibit high population density. In this section, we take a university campus located in Jiangsu province to conduct a scenario study of high population density. We exploit statistical field data from university campuses in Jiangsu province to analyze the traffic feature and follow the analysis process and refinement principles as mentioned in Section 2.5 to improve the network performance.

3.1. Time Slots for Uplink and Downlink Traffic

As the red line shows in Figure 5, the traffic load of downlink is much larger than that of uplink in different areas of university campuses, such as dormitories, teaching buildings, libraries, and dining halls. Moreover, the PRB utilization ratio of downlinks is much lower than that of uplinks. The reason is that different vendors offer similar proactive mechanisms to adjust the PRB ratio of uplink, which leads to imbalances between the PRB utilization ratio of uplink and the PRB utilization ratio of downlink (i.e., as shown in Figure 5, the PRB utilization ratio of uplink is significantly larger than that of the downlink in low traffic scenarios).
Telecom operators always adjust the time slot ratio of uplink to downlink to achieve PRB utilization ratio balance between uplink and downlink. In Jiangsu province, the time slot ratio of uplink to downlink is generally configured as 1:3 for foundation networks provided by operators. Using this configuration, we take the dormitories of the university as an example. As shown in Table 6, we observe that the PRB utilization ratio between uplink and downlink approaches a balance within different vendors’ devices when the PRB utilization ratio of downlink is more than 20%. Similar trends can be found in different areas of university campus. Therefore, we can configure the time slot ratio of uplink to downlink as 1:3 for university campuses, which is consistent with foundation networks.

3.2. Scheduling Request and Channel Quality Indicator

The parameters related to the scheduling request (SR) and the channel quality indicator (CQI) directly determine the maximum number of online users for a single cell [12]. We take several cells deployed in this university campus using ZTE’s devices as an example because only ZTE devices support the adjustment of values of these parameters related to SR and CQI. The other vendors, such as Huawei, Ericsson, Bell, and DTT do not support the customization of these parameters.
As shown in Figure 6, we represent the traffic feature from campuses covered by ZTE devices. We observe that when the number of online users is larger 250, the wireless connection rate success rate is significantly deteriorated. Meanwhile, the practical cell capacity is much lower than nominal capacity. After studying the configurations related with SR and CQI, ‘SRTrCHNum’ and ‘CQIRpTTINum’ are two key parameters directly related with network performance. ‘SRTrCHNum’ and ‘CQIRpTTINum’ represent the number of allocated channels corresponding to the SR period of user equipment (UE) and the number of time division subframes in the shortest CQI periods. After reconfiguring ‘SRTrCHNum’ and ‘CQIRpTTINum’, the capacity of the corresponding cell can support 400 online users. In addition, we can give the first priority of user access using Huawei’s device, which can increase the number of online users to achieve the maximum device capacity.

3.3. Dual-Band Networks

The dual-band policy with F and D frequency bands is believed to be an effective approach to increase the network capacity. As we know, F and D frequency bands are operating at 1.9 GHz and 2.6 GHz. F frequency band is adopted to improve the network coverage due its relatively low path loss. Moreover, F frequency band can achieve better network coverage than D frequency band, which is widely used in the residential areas of cities. On the other hand, D frequency band is utilized to support telephone traffic in hot spots of cities. We investigate the switch policy in the dual-band network with F and D frequency bands. Intuitively, the priority of user reselection in D frequency band networks is higher than that in F frequency band networks and UE choose to stay in the D band cell with the highest priority. The other key configurations of user reselection are reported in Table 7. It is worth noting that dual-band networks with D 1 + D 2 and E 1 + E 2 do not exploit user reselection due to its high complexity of networking operation ( D 1 : 2575 2595 MHz, f c = 2585 MHz; D 2 : 2594.8 2614.8 MHz, f c = 2604.8 MHz; E 1 : 2320 2340 MHz, f c = 2330 MHz; E 2 : 2339.8 2359.8 MHz, f c = 2349.8 MHz).
‘ThreshXHigh’ and ‘ThreshXLow’ represent the thresholds of UE to reselect a frequency whose priority is higher and lower than the current frequency, respectively. ‘ThreshServLow’ is used for UE to reselect dissimilar frequency cells with low priority. It is obvious that the proper configuration of a dual-band network with D and F frequency bands can effectively mitigate the imbalance of busy and idle duration of cells. However, it is possible that the density of users becomes high in a single cell with D 1 and D 2 frequency bands (or E 1 and E 2 frequency bands). Mobile load balancing (MLB) can enable the imbalance traffic load in dual-band networks. In Figure 7, we report the trends of the number of online users when enabling MLB in cells equipped by Huawei devices.

3.4. Summary

We summarize the key configurations of different devices for university campuses in Table 8.

4. Emergency Scenario

In this section, we investigate traffic features of emergencies in terms of uplink, downlink and single user behavior. Several typical examples, including sport games, concerts, and scenic spots in holidays are investigated. Following the basic rules discussed in Section 2.5, we propose several network configuration refinements to improve user experience.

4.1. Uplink and Downlink Traffic Load

According to the field data, we observe that the traffic loads of uplink and downlink become significantly different in scenarios of different emergencies. In particular, the uplink traffic load is highest in ceremonies of large-scale events, whereas it exhibits its lowest values in transport hubs on holidays. We compare the traffic loads in different emergencies in Table 9.
According to the field data reported in Table 9, we configure the time slot ratio of uplink to downlink as 2:2 for the youth Olympic game and concert A. As shown in Table 10, compared with the situation when the time slot ratio of uplink to downlink is 1:3, we can observe that the PRB utilization ratio balance between uplink and downlink can be achieved when the time slot ratio of uplink to downlink is configured as 2:2.

4.2. Single User Behavior

In Table 11, we present the number of sent RRC messages per user and corresponding traffic loads in different scenarios. We observe that, in large-scale ceremonies and concerts, cells may experience low traffic because the majority of users prefer to check email or to send short messages than to play high-definition videos. However, with the large number of RRC messages, the traffic load caused by signaling packet exchanges increases.
Frequently signaling packet exchanges may occupy wireless channels. To increase the wireless channel utilization ratio, the telecommunication operators tend to adjust parameters related to user access. On the other hand, vendors usually encapsulate related algorithms and provide a small number of arguments for operators. Therefore, we report some typical parameters with the corresponding values in Table 12, which can significantly reduce the signaling traffic loads for cells.

4.3. Summary

According to the above analysis and the traffic loads characteristics of emergency, we summarize the refinement polices for cells in terms of time slot ratios of downlink to uplink, frequency band, and signaling packet load. In large-scale events and concerts, the time slot ratio of downlink to uplink is suggested to be configured as 2:2 because the uplink traffic load dominates the whole traffic load, which can improve the bearing capacity of uplink and user experience. Furthermore, key parameters related to user access are suggested to adjust to decrease signaling packet loads and to improve the bearing capacity in large-scale events and concerts.

5. High-Speed Scenario

High-speed mobility significantly affects the network QoS, and the typical scenario is the high-speed railway. This scenario is quite different from scenarios discussed in Section 3 and Section 4 due to its private networks and the quite high speed of the train. In this section, we analyze the different refinement policies to enhance QoS in terms of frequency bands, switching between different networks, idle detection, and location division.

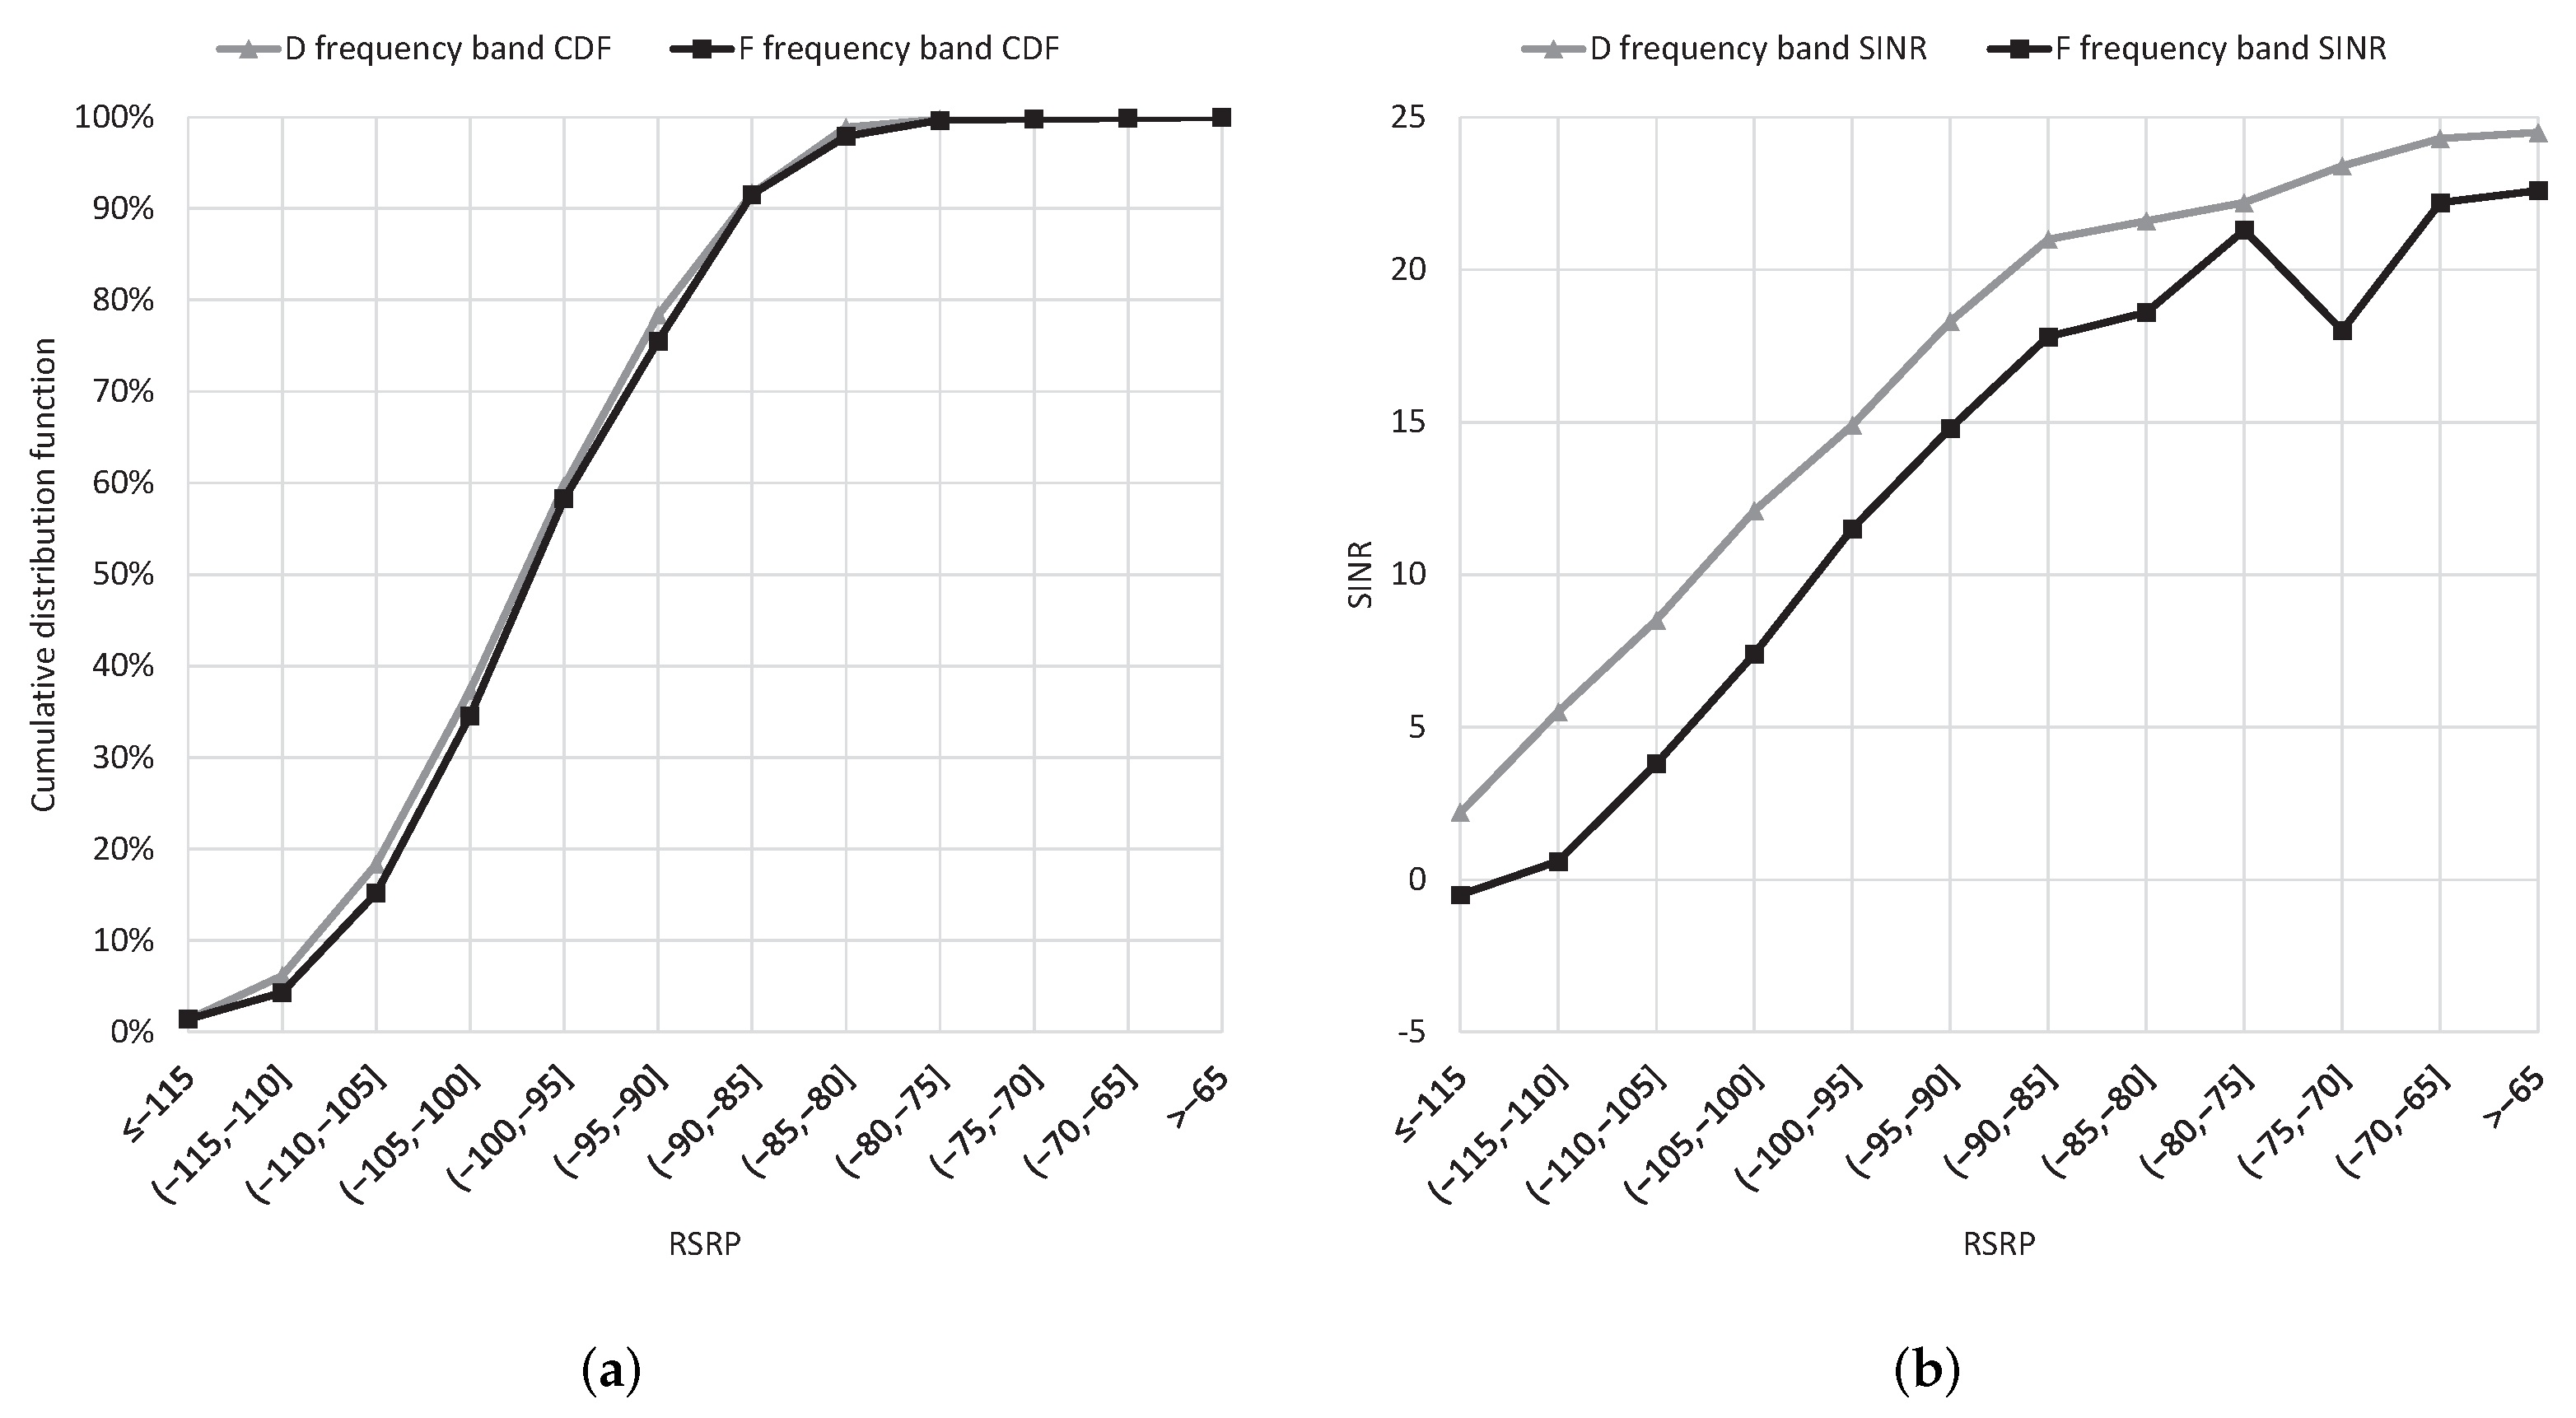
5.1. Frequency Band for Private Network
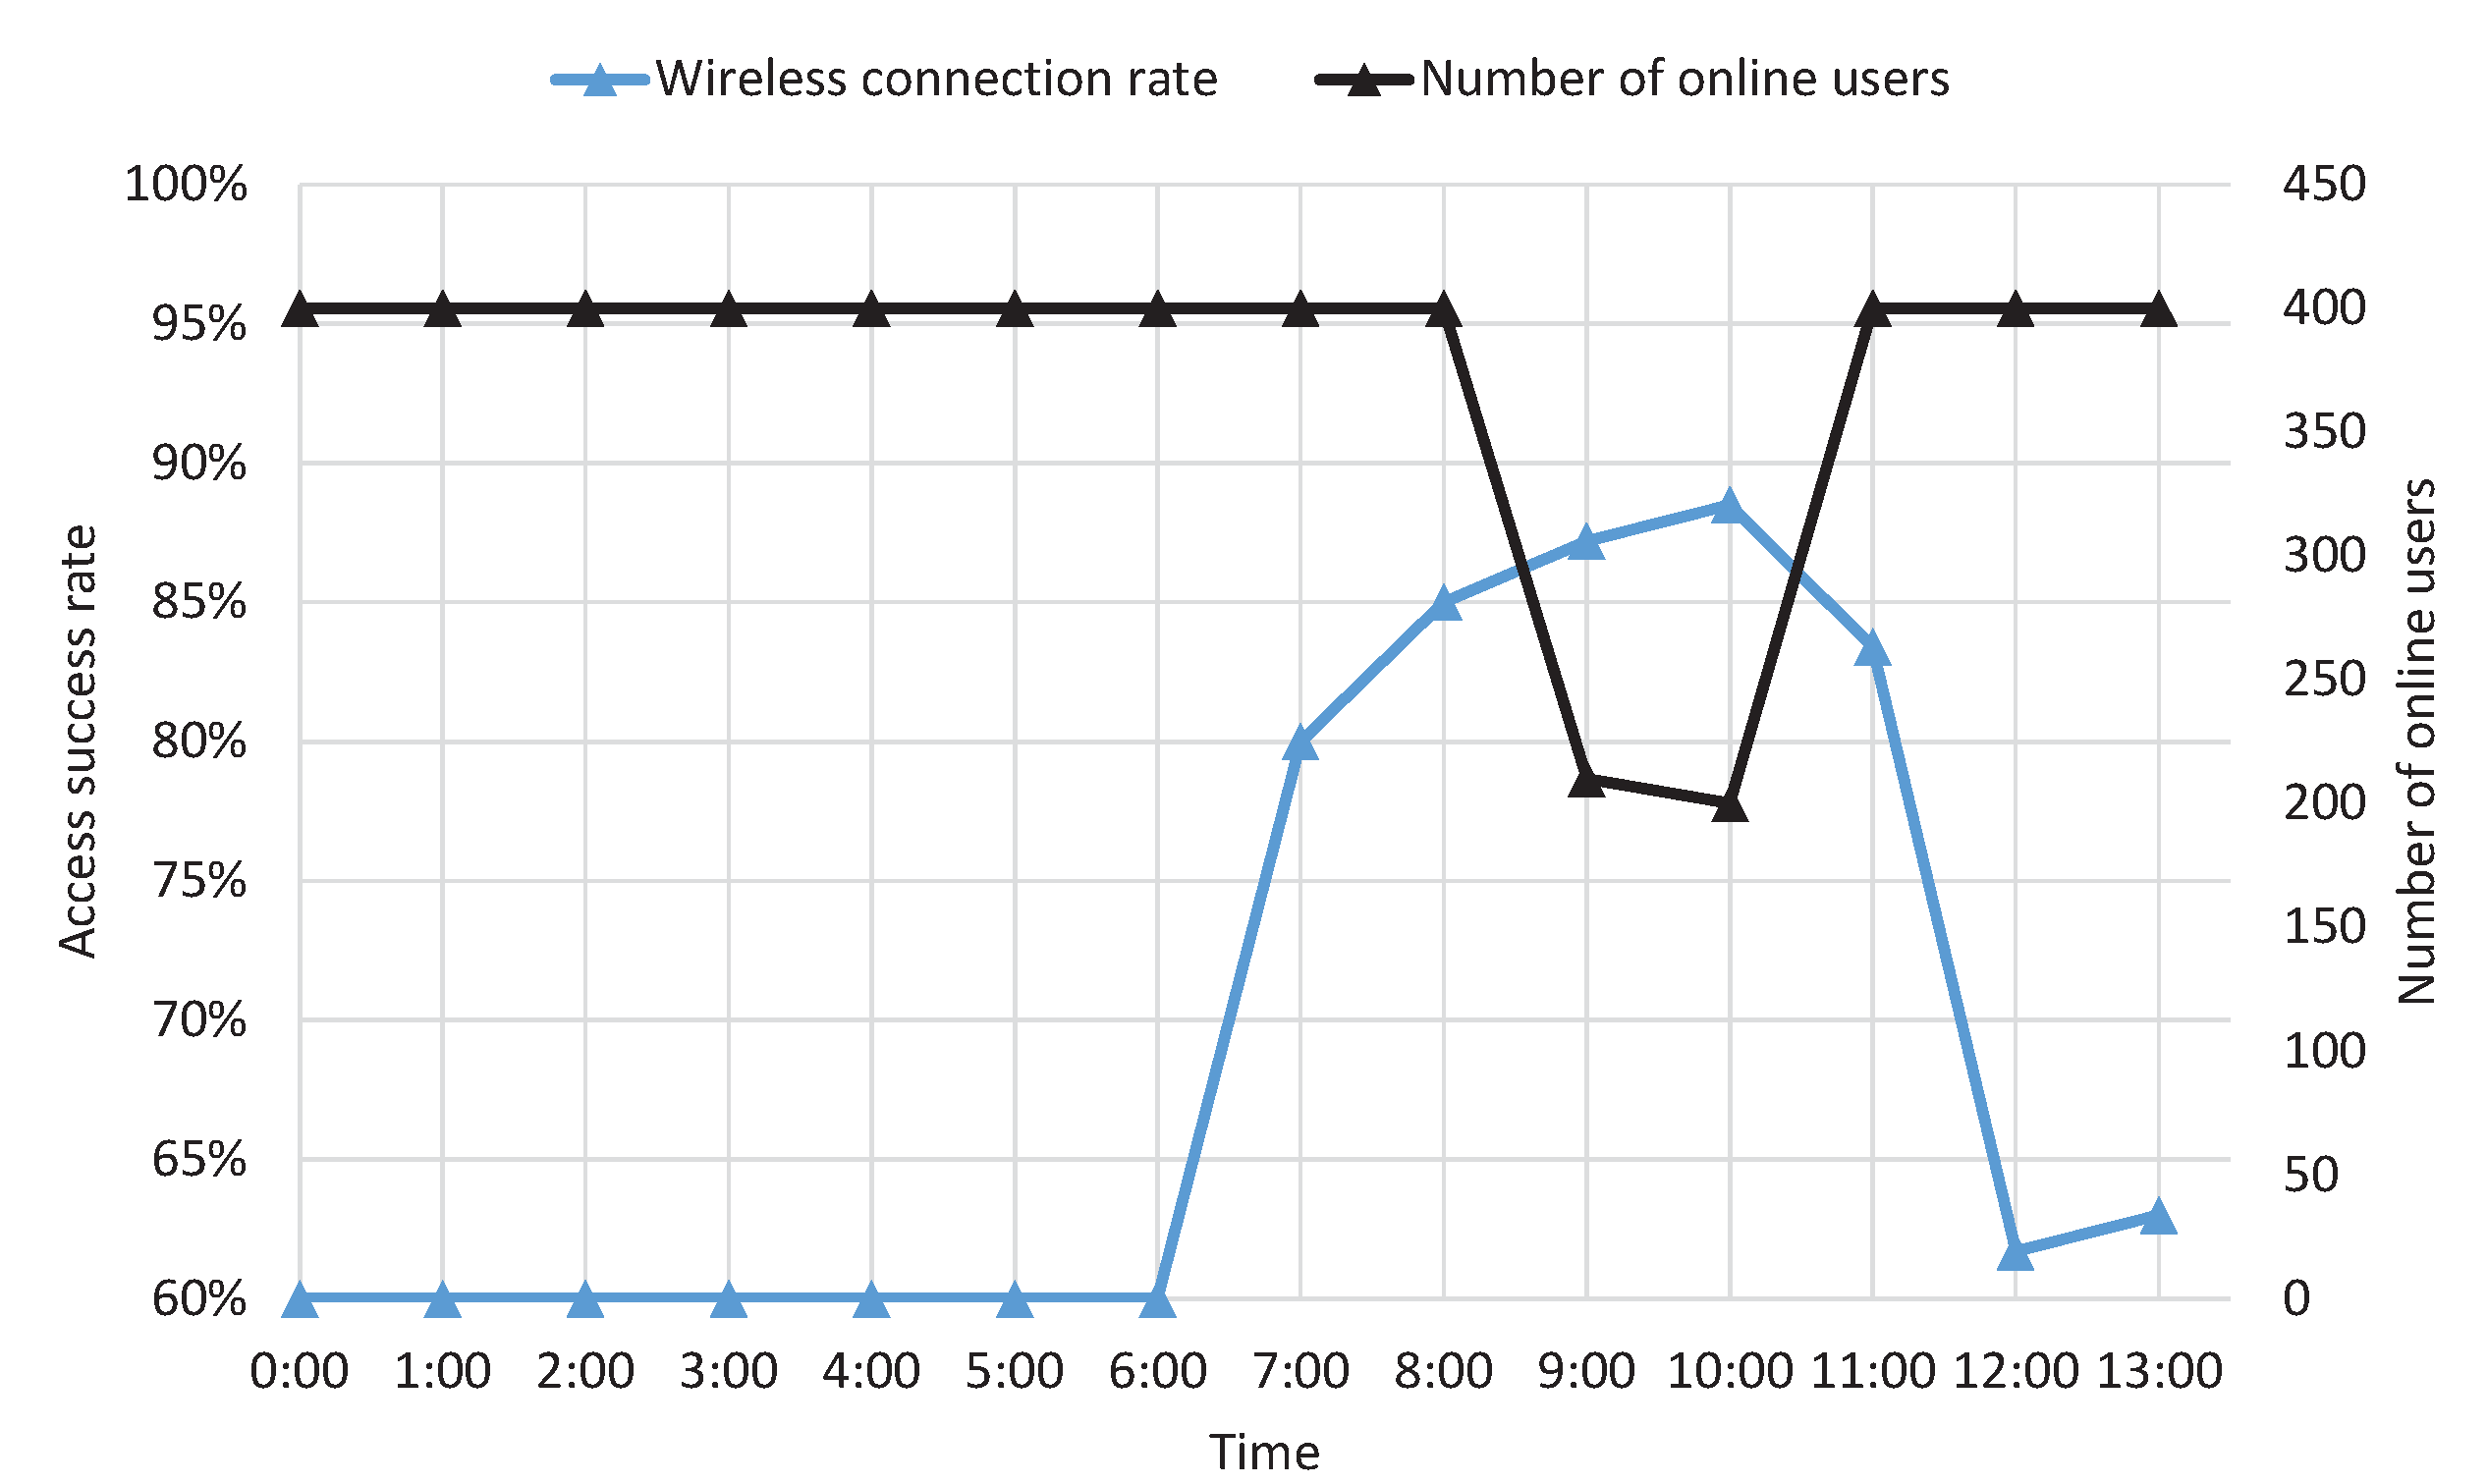
Most cities near the high-speed railway in Jiangsu province deploy public networks with the F band. We investigate two frequency band policies for private networks. One is that private networks use the F band, i.e., 1895∼1915 MHz. There exists an overlapping frequency band around 5 MHz between the private networks and neighboring public networks. The other is that the private networks exclusively use the D band without any overlapping frequency band.
By jointly considering Figure 8 and Table 13, we observe that the average RSRP increases 4 dB, and the signal to interference plus noise ratio (SINR) decreases 3 dB. The average download data rate decreases 3 Mbps using the first strategy. However, the performance using the first strategy is affected by communication quality of the cell edge. The download data rate of edge areas with low coverage decreases 4∼5 Mbps. We also realize that the performance using the second strategy is affected by signal quality at the cell edge. The percentage of area where the RSRP is lower than −110 dBm is 1.8%. In general, the private networks for high-speed railways are suggested to employ the D band if the public networks operate in the F band. The areas with low network coverage are suggested to operate in the F band.

5.2. Idle Detection

According to the field data, we observe that UEs are preferred to be out of the private networks in the idle state. Around 80% of UEs out of the private networks are failures to reselect networks. After analyzing network logs, we realize that the signal quality at the cell edge is higher than that in the cells by 10 dB, at least when reselecting cells. The delay caused by reselecting cells is significantly obvious. We adjust some parameters for network configuration as reported in Table 14, which results in the number of UEs being out of private networks in the idle state decreases by around 50%.

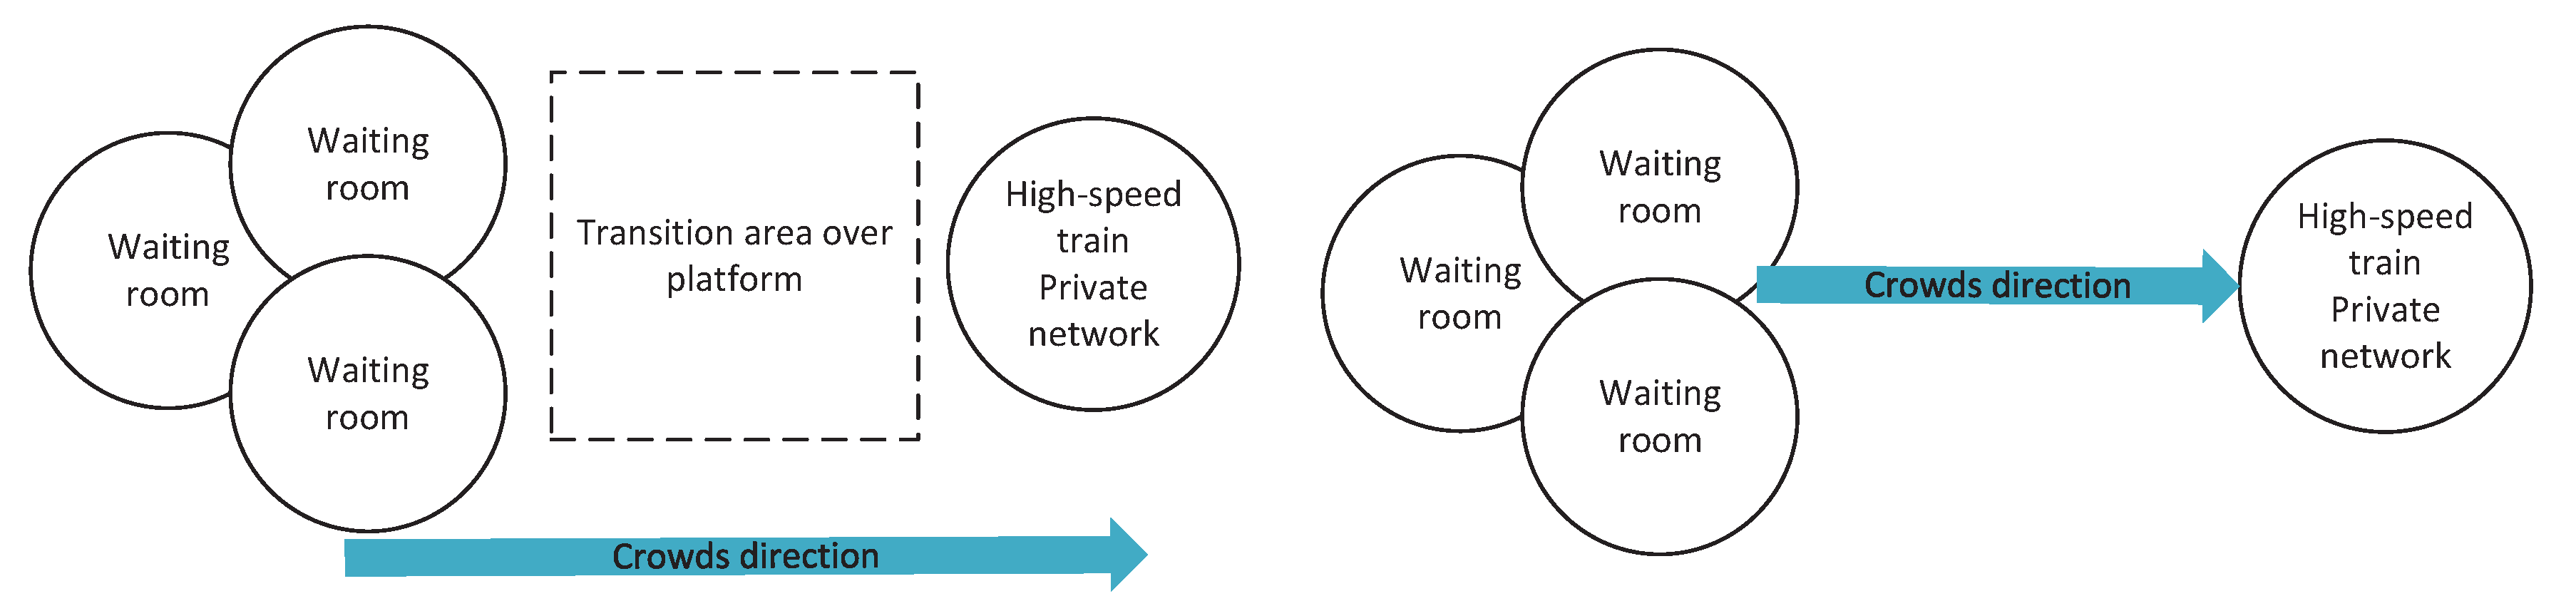
5.3. Location Division

The entries of high-speed railway stations are important areas that should be carefully considered regarding the access policies. The main refinement is to use different access policies according to the station size. The area division of large-scale and small-scale stations are presented in Figure 9.
For large-scale high-speed railway stations, such as Nanjing south station and Suzhou station in Jiangsu province, the waiting rooms are quite large with several indoor stations. Parts of indoor stations belonging to public networks do not incorporate with private networks. Therefore, we deploy the transition network on the platform. The UEs can access the transition cellular networks when they are outside the waiting rooms. Then, all UEs access the private networks of the high-speed railway after they are on the train. For small-scale stations, such as Zhenjiang station and Changzhou station, there are one or two indoor stations incorporating with the private networks. Therefore, the indoor stations should add neighbor areas with the private networks. UEs on the train can directly access the private networks as shown in Figure 9. Based on these policies, success access rates of more than 90% can be achieved for the private networks.

5.4. Other Policies

It is inevitable that UEs are occasionally out of the private networks. Thus, we deploy backup access points provided by vendors to enable UEs to access the private networks again. The backup access points are suggested to deploy at the edges of cities (located along the high-speed railway). The policy can effectively reduce the impact on the UEs who do not belong to the private networks. Furthermore, we enable network-assisted fast return (FR) to enable circuit switched fallback (CSFB). UEs bring the access frequency information of private networks in the channel release message after ending 2G calls. We also observe that the refinement policy increases the access success rate from 70% to 100%.

5.5. Summary

The traffic of private networks deployed for high-speed railways dynamically varies due to the running trains. In this section, we propose several refinement policies, including frequency band policy, idle detection, and location division, which can effectively improve the resource allocation and service quantity.

6. Conclusions

In this paper, taking the perspective of telecommunication operators, we refine the cellular network configuration to improve QoS and user experience for different scenarios. We analyze the traffic features of high traffic load cells based on the field data and propose basic principles of network configuration refinement. Moreover, we conduct case studies for different typical scenarios of high traffic loads, including high population density, emergencies, and high-speed mobility. In general, after following the proposed configuration refinement, the access success rate is up to 99.6% in Jiangsu province, with a low call dropping ratio around 0.18%. The switching success rate is up to 98.87%. The access success rate of CSFB in high-speed railways is up to 90% with 25 Mbps as a stable download data rate. Therefore, the proposed analysis flow and the refinement policy can significantly increase the quality of users’ experience and the service quality of cellular networks.

Author Contributions

Conceptualization, F.D., R.S., G.H. and Q.Q.; methodology, R.S., F.D., G.H. and Q.Q.; writing, R.S. and M.Z. All authors have read and agreed to the published version of the manuscript.

Funding

This research was funded by the Natural Science Foundation of Jiangsu Province, Grant No. BK20190733, the NUPTSF, Grant No. NY219166., the Ministry of Education-China Mobile Research Foundation, Grant No. MCM20170205, the Six Talent Peaks Project of Jiangsu Province, Grant No. DZXX-008, the China Postdoctoral Science Foundation, Grant No. 2019M661900, the Postdoctoral Research Funding Program of Jiangsu Province, Grant No. 2019K026, the NUPTSF Grant No. NY220028, and the project of “Localization and tracking system of IoUT”, Grant No. 2021W159.

Institutional Review Board Statement

Not applicable.

Informed Consent Statement

Not applicable.

Data Availability Statement

Not applicable.

Conflicts of Interest

The authors declare no conflict of interest.

Abbreviations

ACBAccess class barring
ANOUAverage number of online users
CQIChannel quality indicator
KPIKey performance indicators
LBBPLTE baseband processing unit
MACMedium access control
MNOUMaximum number of online users
PRBPhysical resource block
PUCCHPhysical uplink control channel
QoSQuality of service
RRCRadio resource control
SDNSoftware-defined network
SRScheduling request
UEUser equipment
UMPTUniversal main processing and transmission unit

References

  1. Saad, W.; Bennis, M.; Chen, M. A Vision of 6G Wireless Systems: Applications, Trends, Technologies, and Open Research Problems. IEEE Netw. 2020, 34, 134–142. [Google Scholar] [CrossRef] [Green Version]
  2. Kato, N.; Mao, B.; Tang, F.; Kawamoto, Y.; Liu, J. Ten Challenges in Advancing Machine Learning Technologies toward 6G. IEEE Wirel. Commun. 2020, 27, 96–103. [Google Scholar] [CrossRef]
  3. He, J.; Yang, K.; Chen, H.-H. 6G Cellular Networks and Connected Autonomous Vehicles. IEEE Netw. 2021, 35, 255–261. [Google Scholar] [CrossRef]
  4. Gatzianas, M.; Mesodiakaki, A.; Kalfas, G.; Pleros, N.; Moscatelli, F.; Landi, G.; Ciulli, N.; Lossi, L. Offline Joint Network and Computational Resource Allocation for Energy-Efficient 5G and beyond Networks. Appl. Sci. 2021, 11, 10547. [Google Scholar] [CrossRef]
  5. Jung, S.; Bahk, S. Online Control of Traffic Split and Distributed Cell Group State Decisions for Multi-connectivity in 5G and Beyond. IEEE Trans. Veh. Technol. 2021. [Google Scholar] [CrossRef]
  6. Silva, M.M.D.; Guerreiro, J. On the 5G and Beyond. Appl. Sci. 2020, 10, 7091. [Google Scholar] [CrossRef]
  7. Chien, T.V.; Ngo, H.Q.; Chatzinotas, S.; Renzo, M.D.; Ottersten, B. Reconfigurable Intelligent Surface-Assisted Cell-Free Massive MIMO Systems Over Spatially-Correlated Channels. IEEE Trans. Wirel. Commun. 2021, 3136925. [Google Scholar] [CrossRef]
  8. Ordonez-Lucena, J.; Ameigeiras, P.; Lopez, D.; Ramos-Munoz, J.J.; Lorca, J.; Folgueir, J. Network Slicing for 5G with SDN/NFV: Concepts, Architectures, and Challenges. IEEE Commun. Mag. 2017, 55, 80–87. [Google Scholar] [CrossRef] [Green Version]
  9. Foukas, X.; Patounas, G.; Elmokashfi, A.; Marina, M.K. Network Slicing in 5G: Survey and Challenges. IEEE Commun. Mag. 2017, 55, 94–100. [Google Scholar] [CrossRef] [Green Version]
  10. Mei, J.; Wang, X.; Zheng, K.; Boudreau, G.; Sediq, A.B.; Abou-Zeid, H. Intelligent Radio Access Network Slicing for Service Provisioning in 6G: A Hierarchical Deep Reinforcement Learning Approach. IEEE Trans. Commun. 2021, 69, 6063–6078. [Google Scholar] [CrossRef]
  11. Biczok, G.; Dramitinos, M.; Toka, L.; Heegaard, P.E.; Lonsethagen, H. Manufactured by Software: SDN-Enabled Multi-Operator Composite Services with the 5G Exchange. IEEE Commun. Mag. 2017, 55, 80–86. [Google Scholar] [CrossRef] [Green Version]
  12. D’Oro, S.; Restuccia, F.; Melodia, T. Toward Operator-to-Waveform 5G Radio Access Network Slicing. IEEE Commun. Mag. 2020, 58, 18–23. [Google Scholar] [CrossRef] [Green Version]
  13. Du, J.; Jiang, C.; Wang, J.; Ren, Y.; Debbah, M. Machine Learning for 6G Wireless Networks: Carrying Forward Enhanced Bandwidth, Massive Access, and Ultrareliable/Low-Latency Service. IEEE Veh. Technol. Mag. 2020, 15, 122–134. [Google Scholar] [CrossRef]
  14. Wadu, M.M.; Samarakoon, S.; Bennis, M. Joint Client Scheduling and Resource Allocation Under Channel Uncertainty in Federated Learning. IEEE Trans. Commun. 2021, 69, 5962–5974. [Google Scholar] [CrossRef]
  15. Tang, F.; Mao, B.; Kawamoto, Y.; Kato, N. Survey on Machine Learning for Intelligent End-to-End Communication Toward 6G: From Network Access, Routing to Traffic Control and Streaming Adaption. IEEE Commun. Surv. Tutorials 2021, 23, 1578–1598. [Google Scholar] [CrossRef]
  16. Sami, H.; Otrok, H.; Bentahar, J.; Mourad, A. AI-Based Resource Provisioning of IoE Services in 6G: A Deep Reinforcement Learning Approach. IEEE Trans. Netw. Serv. Manag. 2021, 18, 3527–3540. [Google Scholar] [CrossRef]
  17. Siriwardhana, Y.; Porambage, P.; Ylianttila, M.; Liyanage, M. Performance Analysis of Local 5G Operator Architectures for Industrial Internet. IEEE Internet Things J. 2020, 7, 11559–11575. [Google Scholar] [CrossRef]
  18. Liu, G.; Huang, Y.; Chen, Z.; Liu, L.; Wang, Q.; Li, N. 5G Deployment: Standalone vs. Non-Standalone from the Operator Perspective. IEEE Commun. Mag. 2020, 58, 83–89. [Google Scholar] [CrossRef]
  19. Kao, L.-C.; Liao, W. 5G Intelligent A+: A Pioneer Multi-Access Edge Computing Solution for 5G Private Networks. IEEE Commun. Stand. Mag. 2021, 5, 78–84. [Google Scholar] [CrossRef]
  20. Ahmad, A.; Atzori, L. MNO-OTT Collaborative Video Streaming in 5G: The Zero-Rated QoE Approach for Quality and Resource Management. IEEE Trans. Netw. Serv. Manag. 2020, 17, 361–374. [Google Scholar] [CrossRef]
  21. Aydin, O.; Jorswieck, E.A.; Aziz, D.; Zappone, A. Energy-Spectral Efficiency Tradeoffs in 5G Multi-Operator Networks With Heterogeneous Constraints. IEEE Trans. Wirel. Commun. 2017, 16, 5869–5881. [Google Scholar] [CrossRef]
  22. Jamaly, N.; Mauron, S.; Merz, R.; Schumacher, A.; Wenger, D. Delivering Gigabit Capacities to Passenger Trains: Tales from an Operator on the Road to 5G. IEEE Commun. Mag. 2019, 57, 18–23. [Google Scholar] [CrossRef]
  23. Qian, B.; Zhou, H.; Ma, T.; Yu, K.; Yu, Q.; Shen, X. Multi-Operator Spectrum Sharing for Massive IoT Coexisting in 5G/B5G Wireless Networks. IEEE J. Sel. Areas Commun. 2021, 39, 881–895. [Google Scholar] [CrossRef]
  24. Xu, Y.; Gui, G.; Gacanin, H.; Adachi, F. A Survey on Resource Allocation for 5G Heterogeneous Networks: Current Research, Future Trends, and Challenges. IEEE Commun. Surv. Tutor. 2021, 23, 668–695. [Google Scholar] [CrossRef]
  25. Mukherjee, A.; Goswami, P.; Khan, M.A.; Manman, L.; Yang, L.; Pillai, P. Energy-Efficient Resource Allocation Strategy in Massive IoT for Industrial 6G Applications. IEEE Internet Things J. 2021, 8, 5194–5201. [Google Scholar] [CrossRef]
  26. Kliks, A.; Kulacz, L.; Kryszkiewicz, P.; Bogucka, H.; Dryjanski, M.; Isaksson, M.; Koudouridis, G.P.; Tengkvist, P. Beyond 5G: Big Data Processing for Better Spectrum Utilization. IEEE Veh. Technol. Mag. 2020, 15, 40–50. [Google Scholar] [CrossRef]
Figure 1. The framework of network traffic feature analysis.
Applsci 12 01483 g001
Figure 2. Percentage of high traffic load cells.
Applsci 12 01483 g002
Figure 3. Downlink PRB utilization ratio vs. downlink data rate of a single user.
Applsci 12 01483 g003
Figure 4. Main flow of network configuration refinement for high traffic load cells.
Applsci 12 01483 g004
Figure 5. Downlink and uplink traffic and the corresponding PRB utilization ratio in different areas of university campus.
Applsci 12 01483 g005
Figure 6. Access success rate and number of online users at different times.
Applsci 12 01483 g006
Figure 7. Number of online users in cells using MLB at different times.
Applsci 12 01483 g007
Figure 8. Cellular network performance with different frequency band policies. (a) CDF vs. RSRP. (b) SINR vs. RSRP.
Applsci 12 01483 g008
Figure 9. Access polices of large-scale and small-scale high-speed railway stations.
Applsci 12 01483 g009
Table 1. Main indicators of high traffic load cells for different vendors.
HuaweiZTEEricssonDTTBell
MNOU>300>180
PRB utilization ratio (or ANOU)ANOU > 50, downlink PRB utilization ratio > 70%, downlink traffic > 2 GB,
or uplink PRB utilization ratio > 500 MB
Loads of UMPT and LBBPLBBP CPU utilization ratio > 80% or UMPT CPU utilization ratio > 65%UMPT CPU utilization ratio > 80%UMPT CPU utilization > 60%LBBP or UMPT CPU utilization ratio > 85%UMPT CPU utilization ratio > 85% or other module utilization ratio > 90%
Table 2. Access success rate and downlink speed comparison between all cells and high traffic load cells.
All cellsHigh Traffic Load Cells
Access success rate98%90%
Single user data rate (Mbps)81
Table 3. Number of online users is larger than the threshold in different times.
RRC Setup Success RateMNOUUnsuccess Times of PUCCH Allocation
99.90%3560
45.30%40210,161
30.90%39910,850
Table 4. RRC setup success rate vs. CPU utilization ratio of UMPT and LBBP.
Maximum CPU Utilization RatioRRC Setup Success RateNumber of Dropped MessagesMaximum CPU Utilization RatioRRC Setup Success RateNumber of Dropped Messages
LBBPUMPT
72%99.4%067%100.0%0
84%83.7%442971%86.5%192
85%82.2%473071%75.4%1161
86%81.5%481972%70.2%1230
Table 5. ANOU/Downlink PRB utilization ratio vs. Percentage of cells with low data rate.
ANOU and Downlink PRB Utilization RatioPercentage of Users
(Downlink Data Rate Lower than 3 Mbps)
50, 40∼50%1.75%
50, 50∼60%17.83%
50, 60∼70%41.30%
50, 70∼80%72.99%
50, 80∼100%88.24%
Table 6. PRB utilization ratio balance between uplink and downlink in dormitories of the university.
BellHuawei
Downlink PRB Utilization RatioAverage Uplink PRB Utilization RatioAverage Downlink PRB Utilization RatioAverage Uplink PRB Utilization RatioAverage Downlink PRB Utilization Ratio
0∼10%2%1%8%2%
10∼15%16%12%34%12%
15∼20%21%17%31%18%
20∼30%25%23%34%23%
≥30%30%32%40%42%
Table 7. Key configuration of user reselection in dual-band networks with D and F frequency bands.
ReselectionParametersConfiguration
F D ThreshXHighThreshXHigh = ThreshServLow + 4 dB
D F ThreshServLowAccording to the distribution of RSRP
If the percentage of R S R P > M = N % ,
the percentage of the number of users
in cells with D frequency band = N,
then ThreshServLow = M
 ThreshXLowThreshXLow = QRxLevMin
Table 8. Key configurations for cells with high population density.
HuaweiZTEBellEricssonDTT
Time slot ratio of uplink to downlink1:3
SR/CQIsetup user access first‘SRTrCHNum’
‘CQIRptTTINum’
N/A
Double networking reselection F + D : the priority of user reselection in D band
is higher than that of F band;
ThreshServLow setting: based on RSRP distribution of D cellular networks
Double networking load balanceEnable D 1 + D 2 , E 1 + E 2
Table 9. Traffic loads of different emergencies.
ScenarioLarge-Scale Ceremony EventConcertScenic Spots in HolidaysTransport Hubs in Holidays
The Youth Olympic GamesProvincial Sport GamesConcert AConcert BGarden A in National DayGarden B in HalloweenRailway Station in National Day
Uplink traffic (MB)36251731859.22853.25394.41002.5506.22
Downlink traffic (MB)357337031852.64985.82199141396825.23
Traffic ratio of uplink to Downlink0.982.142.151.755.054.1313.46
Table 10. PRB utilization ratio with different time slot ratios of uplink to downlink.
Time Slot Ratio of Uplink to Downlink = 1:3
Traffic ratio of uplink to downlinkUplink PRB utilization ratioDownlink PRB utilization ratio
0.88%33%4%
1.75%48.32%13.84%
Time Slot Ratio of Uplink to Downlink = 2:2
Traffic ratio of uplink to downlinkUplink PRB utilization ratioDownlink PRB utilization ratio
1.62%7.44%3.3%
2.14%5.12%5.98%
Table 11. Number of RRC attempts and corresponding traffic in different scenarios.
ScenarioLarge-Scale Ceremony EventConcertScenic Spots in HolidaysTransport Hubs in Holidays
The Youth Olympic GamesProvincial Sport GamesConcert AConcert BGarden A in National DayGarden B in HalloweenRailway Station in National Day
Number of RRC attempts per user108.593.8988.7105.680.57107.570.38
Traffic load of each RRC attempt (kB)61.0666.6676.8932.4475.23275.8127.74
Table 12. Access parameters related to signaling packet exchange.
ParametersFunctionPreferred Value
Control format indicator (CFI)Guarantee the resource of physical downlink control channel (PDCCH)3
UE inactivated timerIncreasing UE inactivated timer can reduce the number of establishing RRCs; decrease UE inactivated timer can reduce the number of online users during a certain period10
Access class barring (ACB) factorDecreasing the value of the ACB factor can reduce the number of attempts to establish RRC during a certain period0.95
Table 13. Comparison between two frequency band strategies for high-speed railway.
Average RSRP
(dBm)
Average SINR
(dB)
Downlink Data Rate
(Mbps)
strategy 1−93.1911.4221.34
strategy 2−96.9415.0624.33
Table 14. Parameters related to cell reselection.
ParametersPublic NetworkPrivate Network
(High-Speed Railway)
defaultpagingcycle1280 ms320 ms
tReselectionIntraEUTRA2 s0 s
Publisher’s Note: MDPI stays neutral with regard to jurisdictional claims in published maps and institutional affiliations.

