Abstract
In this paper, the authors analysed changes occurring during the rehabilitation processes in patients after early stroke based on analysis of their upper limbs’ target-reaching movement and muscle co-activation. Ischemic stroke often results in reduced mobility of the upper extremities and frequently is a cause for long-term disability. The ever-developing technology of 3D movement analysis and miniaturisation of equipment for testing the bioelectrical activity of muscles can help to assess the progress of rehabilitation. The aim of this study was to examine the use of analysis of target-reaching movement indicators and muscle co-activation for diagnosing the rehabilitation process in post-stroke patients. Twenty ischemic stroke patients in the early post-stroke phase (up to three months after the stroke), and twenty healthy subjects (the control group) took part in the experiments. The novel approach of the proposed research proved the usefulness of this approach in the diagnosis of the rehabilitation efficiency of rehabilitation in early post-stroke phase patients.
1. Introduction
Stroke is a dangerous medical condition with serious clinical, social and economic consequences. It is the third leading cause of death and the leading cause of severe disability among people over the age of 45 [1,2]. Early and comprehensive post-stroke rehabilitation aims to reduce patients’ mortality in the first month after stroke as well as the degree of disability and life helplessness [3]. Some stroke rehabilitation goals are to minimize the risk of pathological movement patterns, excessive spasticity, or prolonged muscular hypotonia [4]. Serious post-stroke issues include limited upper limb mobility and inaccurate diagnosis of therapy effects due to the lack of precise methods of therapy effectiveness evaluation, persisting the consequences of stroke measured by the stroke impact scale [5].
Currently, modern 3D analysis technology can be occasionally applied in order to analyse the rehabilitation progress. The assessment of motor functions in stroke patients is usually performed with standardized clinical scales. Some of the most frequently used clinical instruments for assessing upper extremity impairment and activity capacity in stroke are the Fugl–Meyer assessment of upper extremity (FMA-UE) and action research arm test (ARAT) [6]. However, observer-based ordinal instruments lack the sensitivity to assess subtle yet potentially significant changes in movement performance. These clinical scales tend to have a ceiling effect since they rely on scoring criteria rather than on a continuous measurement construct [7].
There have been numerous studies of rehabilitation progress with the assistance of kinematic analysis [6,8,9] in particular, with robotic exoskeletons (see: [10]). The applied devices support the motion of the shoulder girdle and the whole upper extremity. They significantly facilitate patients’ movement and allow registering the rehabilitation progress. The study of problems related to human motor skills can contribute to the implementation of better rehabilitation at the immediate and chronic stages after stroke. The current technology offers a number of kinematic indicators, which can be efficient parameters for objective functional assessment of the upper limb in people with movement disorders [11,12]. The majority of kinematic studies on stroke patients have focused on such parameters of accuracy of location in motion as close or far, low or high, and with or without clearance in front of the person. There were also studies involving different grasping tasks [13,14]. The task used in our research is similar to routine tasks of daily living, such as interacting with touchscreens or pressing buttons on different devices. Advantages of the analysis of trajectories of movement systems as a measurement tool include standardized instructions, adaptation of tasks according to patients’ functioning level, and the availability of quick feedback.
Additional information regarding the progress in rehabilitation may be provided through the analysis of the bioelectric activity of selected muscles of the examined limb. It is advisable to use the surface electromyography (sEMG) for this purpose, which determines the level of dependence of the bioelectric activity of individual muscles in the upper limb during simple motor activities.
Depending on the hypothesis related to disturbed bioelectric activity, researchers used sEMG as a tool to analyse muscle activity during the stretching of relaxed agonist and antagonist muscles [12], or to determine muscle co-activation between the triceps brachii and biceps brachii muscles, Ref. [15] used surface electromyography as a tool to diagnose the activity of eight muscles of the upper limb with a shoulder girdle during the training of eight different movement patterns among patients after stroke.
The obtained results showed statistically significant differences in the jerk and CI parameters between the study before and after the rehabilitation process (jerk closer PRE and POST , jerk further PRE and POST ), as well as no differences between the experimental and control groups. The novel approach of the research is proving the usefulness of the application of the presented research in the diagnosis of the effectiveness of rehabilitation of patients in the early post-stroke phase.
2. Materials and Methods
One of the main aims of this study was to examine the use of analysis of target-reaching movement indicators and muscle co-activation for diagnosing the rehabilitation process in post-stroke patients. Realizing the difficulties related to the availability of equipment and analysis of results, we hope that in a few years time kinematic analysis will become a common method of diagnosing treatment progress in stroke patients.
2.1. Study Participants
In this study, 20 patients after a left-sided stroke, 12 men and 8 women aged years (body weight kg; body height cm) were qualified for the study. They were classified as being in the early post-stroke phase. All participants in the study were patients of the rehabilitation department of St. Roch Hospital in Ozimek (Poland).
The control group included 20 healthy people, 10 men and 10 women, age years (body weight kg, body height cm) with no neurological problems.
Inclusion criteria for the study group comprised the following:
- First-time stroke;
- Preserved manipulative hand ability, with slight restrictions on movement and spasticity below or equal to 2 scores on the Modified Ashworth scale;
- Ability to understand instruction and perform tasks, determined by a score below 23 on the Mini-Mental State Examination (MMSE) scale.
The exclusion criteria were as follows:
- Cognitive impairment;
- Sensory aphasia;
- Visual impairment;
- Behavioural disorders;
- Joint stiffness.
Assessment of clinical status was made on the day of admission to the neurological rehabilitation department. All patients after ischemic stroke were confirmed by CT scanner. Participants were assessed using functional scales National Institute of Health Stroke Scale (NIHSS), Functional Indicator “Repty” (WFR), a Polish (Functional Independence Measure FIM) modification, and Fugl–Meyer Motor Assessment (FMA—upper limb).
All the patients were right handed, and were fully informed about the experimental procedures. All participants received information about the experimental procedures to be carried out and they gave their written consent to participate in the study. All patients’ personal data and research results are stored at the rehabilitation department at St. Roch Hospital in Ozimek (Poland). The research project was approved by the Bioethics Committee of the Opole Medical Chamber (No. 215, 25 March 2015).
2.2. Applied Equipment
In this study, the OptiTrack-Motion Capture System (NaturalPoint, Inc., Corvallis, OR, U.S.A.) was used for the purpose of optoelectronic motion analysis, allowing evaluating the target-reaching movement. The applied OptiTrack operates on the basis of a passive marker, which during motion recording reflects the emitted IR light from seven 250e cameras. The cameras record the image of a marker placed on the patient’s upper body, with a maximum resolution of pixels, and a frame rate of 100 frames per second.
Additionally, one camera recorded video footage at 100 frames per second. This number of cameras allowed for accurate imaging of the marker’s movement in space, without any loss of signal during the measurement. The data were recorded with Motive ver. 1.7.4 exported to C3D file format for processing. Markers with a diameter of 14 mm were placed symmetrically on both upper limbs.
In Figure 1, the complete set of markers applied in the study protocol is presented.
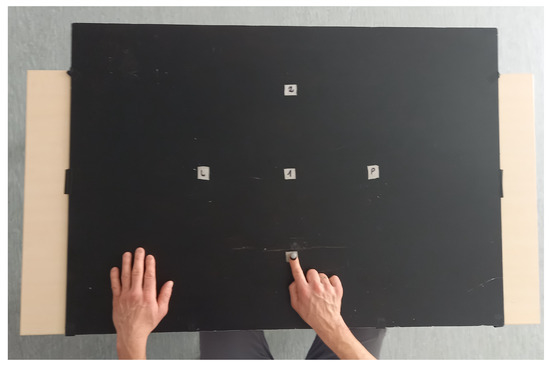
Figure 1.
Research platform with points (1—closer, 2—further, L—left/contralaterally, P—right/ipsilaterally).
Muscle bioelectrical activity measurement (sEMG) was performed using a TeleMyo DTS surface electromyography (Noraxon), following the SENIAM methodology [16]. The superficial muscles of the right upper limb (biceps brachii /triceps brachii–lateral head) were studied. Before the study, the electrode sticking site was prepared by removing hair and cleaning the skin to improve electrode adhesion. Surface electrodes (Ag/AgCl) were placed on the muscle belly between the motor point and the tendon attachment, along the longitudinal midline of the muscle.
The TeleMyo DTS system (Noraxon) had the following technical specifications: device fundamental noise, less than 1 μV RMS, input impedance greater than 100 MΩ, CMR (common-mode rejection ratio) greater than 100 dB, sampling frequency 1500 Hz, and gain 500. NORAXON MR-XP 1.07 Master Editionx software was used for signal processing and EMG analysis.
2.3. Study Protocol
The study protocol involved carrying out two tests—the first test was conducted within two days of admission to the hospital rehabilitation department, and the second test was carried out after six weeks of rehabilitation in the hospital rehabilitation department. The researchers did not interfere in the rehabilitation process and did not give any guidelines for intervention.
During the test, a patient sat on a chair in front of a table on which four markers were placed (Figure 1). The task performance was recorded during one test session for all participants. One trial consisted of a continuous movement toward four target points (1—closer, 2—further, L—left/contralaterally, P—right/ipsilaterally), performed at the patient’s own pace. Each participant made three series, and each series was recorded separately. During the test, each participant sat upright with the right elbow bent about at a angle, and pronated the forearm with the hand on the table. The left hand rested on the table outside the tracking area. The test procedure consisted of reaching with the finger of the right hand (touching with the fingertip) target points on the table surface. After touching a target point, the participant was supposed to return the hand to the starting point and continue the movement to the next target point. The starting point was located 15 cm from the participant’s chest on the sagittal axis of the body. The first target point (closer) was placed 20 cm from the starting point on the sagittal axis of the body. The second target point (further) was placed 20 cm from the first target point on the sagittal axis of the body. The third target point (contralaterally) was 20 cm from the first point on the left side of the transverse axis of the body. The hand movement took place to the left of the sagittal axis of the body. The fourth target point (ipsilaterally) was 20 cm from the first point on the right side of the transverse axis of the body. The hand movement was to the right side of the transverse axis of the body. The target points were specially placed in different parts of the tracking area so that reaching them required different combinations of joint movements. To record movement precision, a marker reflecting IR light from the cameras was placed on the participant’s fingernail of the middle finger.
An example of marker movement recording is shown in Figure 2. During the study, sEMG recordings of the studied muscles were recorded.
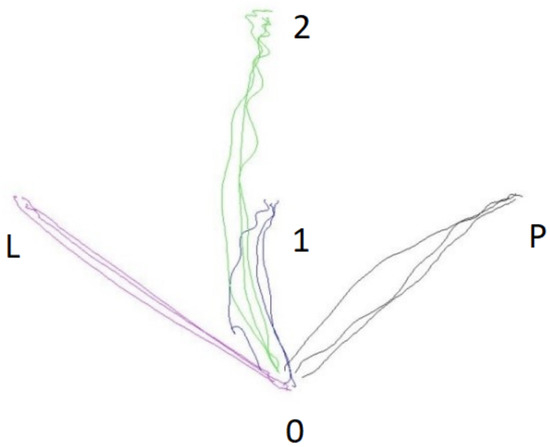
Figure 2.
Sample diagram of the movement trajectory to the particular target points during a test series in the experimental group.
- Blue line—1—closer;
- Green line—2—further;
- Red line—L—left/contralaterally;
- Black line—P—right/ipsilaterally.
The location of the OptiTrack system cameras during the study is shown in Figure 3.
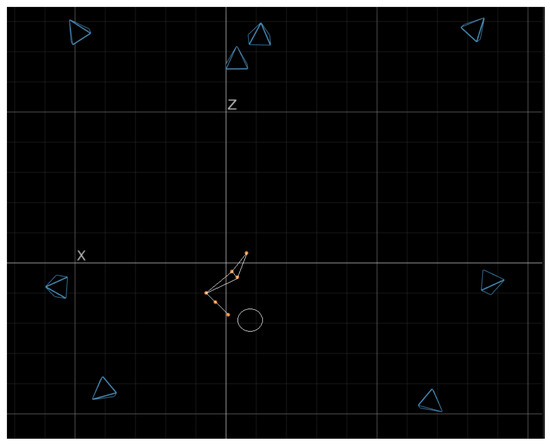
Figure 3.
Location of the OptiTrack cameras during the test.
2.4. Performed Data Analysis
The movement smoothness (trajectory smoothness) (JERK) was quantified using a normalized jerk score—JERK [17], as presented in Equation (1):
where
- —normalized JERK score;
- —third-order derivative of position with respect to time;
- t—movement time;
- a—movement amplitude.
The “t” and “a” are the movement time and movement amplitude, respectively, applied to normalize the jerk and eliminate the influence of movement time and distance.
The sEMG signals were smoothed by estimation of the root mean square, that was derived in the time window of 300 ms. To evaluate the relative level of co-contraction of the analysed muscles, the CI was calculated using Falconer and Winter’s methods [18], where, particularly, the following Equation (2) was used:
The is the area of the total antagonistic activity, calculated according to the following Equation (3):
where
- to denote the period during which the tibialis anterior EMG is less than the soleus EMG;
- to denote the period during which the soleus EMG is less than the tibialis anterior EMG.
The is the integral of the sum of tibialis anterior and soleus sEMG during performance of the task, calculated in accordance with the following Equation (4) [18]:
2.5. Statistical Analysis
The collected data were subsequently subjected to statistical analysis using the Jamovi 1.1.9 software package. Paired sample t-test was used in order to determine the significance of differences between pre- and post-rehabilitation test scores. Independent sample t-test was used to determine the significance of inter-group differences. The research also used the size of Cohen’s d effect. The sample size was calculated to be at least 20 participants on the assumption to detect a large Cohen’s d effect size or larger, power of , and a (two-sided) significance level.
3. Results
Table 1 presents the descriptive statistics of the tested parameters: CI and JERK in the experimental group (PRE/POST) and a single study in the control group. Table 2 shows the results of the statistical significance between the PRE and POST tests in the EXP group, while Table 3 presents the results of statistical significance of the POST test in the EXP group with the test in the CON group. In the experimental group, there are large discrepancies in the mean value in the CI further parameter (see Table 1) between the results of PRE () and POST ().

Table 1.
Descriptive statistics of CI and Jerk parameters in the experimental group (PRE/POST) and the control group.
Table 2.
Results of the statistical difference analysis in paired sample t-test, pre/post rehabilitation trial in experimental group.
Table 3.
Results of analysis of statistical difference in independent sample t-test and Mann–Whitney U test in the study between control and experimental group.
The results of this study were also statistically significantly different (, ), which are presented in Table 2. Large discrepancies also occurred in the mean values of the results of the jerk closer PRE () and POST () and the parameters of jerk further PRE () and POST () (Table 1). These results, as the only ones in the jerk parameter (Table 2), were statistically significantly different at the significance level (Jerk Closer , ; jerk further , ). The rehabilitation process had a significant effect on improving the mean CI and jerk scores in the experimental group. The CI score on average improved by and the jerk score by . Correspondingly, CI closer improved by , CI further , CI contralaterally and CI ipsilaterally by : in contrast, jerk closer , jerk further , jerk contralaterally and jerk ipsilaterally . Despite the rehabilitation process, results differed in favour of the control group and in jerk by , but in CI there were no significant mean differences.
The results also show that the significance of the differences in p and Cohen’s effect size was the highest in the closer movement direction, followed by further, and contralaterally and CI further. This ranking was closely related to the degree of difficulty in performing the movement in a particular direction (Table 3).
4. Discussion and Conclusions
The results of the study showed statistically significant differences in the analysed parameters in the rehabilitation process of stroke patients in relation to healthy subjects. Investigating the use of analysis of target-reaching movement indicators and muscle co-activation to monitor the rehabilitation process is becoming increasingly important in the rehabilitation of post-stroke patients.
This is supported by one of the hypotheses based on the theory of reorganization of cortical brain structures, which indicates the need for rehabilitation in the form of bilateral task performance involving both paretic and non-paretic cerebral hemispheres [19,20]. Quantitative motion analysis provides information on the motor compensation strategies used by stroke patients, and is therefore of considerable clinical relevance [21], as it reveals the patient’s current condition and allows comparisons with healthy controls [6].
The used parameters, i.e., jerk and IC, facilitate clinical studies of patients in terms of motion analysis, and can be useful not only for better rehabilitation planning, but also for enhancing the effective application of technology-based devices [22]. One of the main advantages of this method is also the detection of individual deficits, which may remain invisible in the traditional patient assessment process. Hussain et al. (see [6]) argued that movement parameters analysis can provide valuable and specific information about sensorimotor impairment of the upper limb following stroke that might not be captured using traditional clinical scales. Our research confirms this argument since the analysis of the trajectory of movement ipsilaterally showed no differences, which is not revealed in the traditional assessment. Such information can make the patients realize the need for further rehabilitation in this area.
Trajectory analysis also makes it possible to develop a reliable reference scale for healthy people [23,24]. Otaka et al. (see [25]) noted that arm movements in hemiparetic stroke patients were slower, less accurate, less smooth, and more segmented than in healthy controls. In the present study, the imaging of movement demonstrated that toward the end of the movement, its trajectory was often found to be clustered in post-stroke patients, resembling a spider’s web. Similar conclusions were reached by Hussain et al. (see [6]). Movement trajectories are frequently tested in fast pointing movements using motion capture systems, and are considered key variables for kinematic movement analysis of upper limb tasks in stroke [13,14]. The present study confirmed their significance by way of performing a task of indicating a determined point by a group of post-stroke patients.
The authors of this paper also stress the possibility of using the above methodology to determine patients’ individual deficits and pathological compensatory movements. The validity of determination of compensation levels and diagnosis of deficits were also discussed by other authors [8,26]. They showed that during the reaching for an object, the patients displayed a reduced arm elongation and trunk axial rotation due to motor deficit. It was related to their use of compensatory strategies, which included trunk forward displacement and extra head movements. The generated specific movement compensation is closely related to the movement trajectory and the placement of objects reached for by a patient [27].
The study of movement trajectory appears to be a promising stroke assessment tool. Further research is still necessary to assess the relationship between its outcome variables and clinical measures of upper extremity impairment. This type of research proves the need to use the tools we use to support the diagnostic process of rehabilitation; however, the researchers are aware that there is still a long way to go, due to the cost and process of processing the collected information. We are also aware that the development of modern information technology will significantly simplify this system.
The study of surface electromyography in patients after stroke raises a lot of controversy and reservations as to the reliability associated with disorders of the central nervous system. The central nervous system uses various mechanisms to improve the patterns of muscle activation needed for movement after a stroke [28,29]. The impairment in muscle activation depends on both the degree of impaired motor control and the movement (compensation) strategy to compensate for the impairment. The conducted research showed the level of co-activation, but after the rehabilitation process, no statistically significant changes were found in this parameter. The findings of [30] suggest that increased activation of the triceps as an agonist and better coordination between the triceps and biceps muscles could mediate the observed changes in shoulder function. Changes in EMG activity were relatively small compared to changes in arm function, indicating that they could also be related to factors such as the involvement of other muscles in the compensation of movement [30,31].
The created specific movement compensation is closely related to the direction of movement and the location of the objects that the patient must use [27]. Co-activation is noticeable in new tasks performed by patients; however, with learning a new task, its activity decreases [32]. This type of research confirms the need to use the tools used by authors to support the diagnostic process of rehabilitation; however, we are aware that there is still a long way to go for their widespread use, due to the costs as well as the procedure of processing the collected information. We are also aware that the development of modern information technology will significantly simplify the described system.
We are also aware of the limitations resulting from the inability to test each of the patients admitted for rehabilitation. The low popularity of the sEMG examination and the OptiTrack or other motion capture systems may also seem problematic. However, the authors are aware that there is great progress in simplifying these devices and, thanks to such research, adapting them to the needs of the hospital. Our research will allow to improve and verify the general process of rehabilitation and show the usefulness of the performed motor activities.
Author Contributions
Conceptualization, M.K. and P.P.; methodology, M.K., P.P. and A.K.-S.; software, M.K. and P.P.; validation, M.K., P.P., P.D. and A.K.-S.; formal analysis, M.K., P.P. and A.K.-S.; investigation, M.K., P.P., M.B. and P.D.; resources, M.K., P.P. and M.B.; data curation, M.K., P.P., M.B. and P.D.; writing—original draft preparation, M.K., P.P., P.D. and A.K.-S.; writing—review and editing, M.K., P.P., P.D. and A.K.-S.; visualization, M.K., P.P. and A.K.-S.; supervision, M.K., P.P., M.B. and A.K.-S.; project administration, M.K., M.B. and P.P.; funding acquisition, M.K. All authors have read and agreed to the published version of the manuscript.
Funding
This research received no external funding.
Institutional Review Board Statement
Not applicable.
Informed Consent Statement
Informed consent was obtained from all subjects involved in the study.
Data Availability Statement
Data available upon written request.
Acknowledgments
The authors would like to thank the participants included in our trial for their involvement and enthusiasm, and the employees of the Rehabilitation Department at St. Roch Hospital in Ozimek (Poland).
Conflicts of Interest
The authors declare no conflict of interest.
References
- Syme, P.D.; Byrne, A.W.; Chen, R.; Devenny, R.; Forbes, J.F. Community-based stroke incidence in a Scottish population: The Scottish Borders Stroke Study. Stroke 2005, 36, 1837–1843. [Google Scholar] [CrossRef]
- Kałużny, K.; Kałużna, A.; Kochański, B.; Cichosz, M.; Płoszaj, O.; Pawiłan, M.; Zukow, W.; Hagner, W. Wpływ rehabilitacji neurologicznej na funkcjonowanie pacjentów po przebytym udarze niedokrwiennym mózgu–analiza retrospektywna (The influence of neurological rehabilitation on the functioning of patients after ischemic stroke—A retrospective analysis). J. Educ. Health Sport 2016, 6, 38–52. [Google Scholar]
- Cardol, M.; de Jong, B.A.; van den Bos, G.A.; Beelen, A.; de Groot, I.J.; de Haan, R.J. Beyond disability: Perceived participation in people with a chronic disabling condition. Clin. Rehabil. 2002, 16, 27–35. [Google Scholar] [CrossRef]
- Johansson, A.; Mishina, E.; Ivanov, A.; Björklund, A. Activities of daily living among St Petersburg women after mild stroke. Occup. Ther. Int. 2007, 14, 170–182. [Google Scholar] [CrossRef] [PubMed]
- Lai, S.M.; Studenski, S.; Duncan, P.W.; Perera, S. Persisting consequences of stroke measured by the Stroke Impact Scale. Stroke 2002, 33, 1840–1844. [Google Scholar] [CrossRef]
- Hussain, N.; Alt Murphy, M.; Sunnerhagen, K.S. Upper limb kinematics in stroke and healthy controls using target-to-target task in virtual reality. Front. Neurol. 2018, 9, 300. [Google Scholar] [CrossRef]
- Bustrén, E.L.; Sunnerhagen, K.S.; Alt Murphy, M. Movement kinematics of the ipsilesional upper extremity in persons with moderate or mild stroke. Neurorehabilit. Neural Repair 2017, 31, 376–386. [Google Scholar] [CrossRef] [PubMed]
- Blaszczyszyn, M.; Szczesna, A.; Opara, J.; Konieczny, M.; Pakosz, P.; Balko, S. Functional differences in upper limb movement after early and chronic stroke based on kinematic motion indicators. Biomed. Pap. Med. Fac. Univ. Palacky Olomouc Czech Repub. 2018, 162, 294–303. [Google Scholar] [CrossRef] [PubMed]
- Mencel, J.; Jaskólska, A.; Marusiak, J.; Kamiński, Ł.; Kurzyński, M.; Wołczowski, A.; Jaskólski, A.; Kisiel-Sajewicz, K. Motor Imagery Training of Reaching-to-Grasp Movement Supplemented by a Virtual Environment in an Individual With Congenital Bilateral Transverse Upper-Limb Deficiency. Front. Psychol. 2021, 12, 943. [Google Scholar] [CrossRef]
- Rahman, M.H.; Kittel-Ouimet, T.; Saad, M.; Kenné, J.P.; Archambault, P.S. Development and control of a robotic exoskeleton for shoulder, elbow and forearm movement assistance. Appl. Bionics Biomech. 2012, 9, 275–292. [Google Scholar] [CrossRef][Green Version]
- Trincado-Alonso, F.; Dimbwadyo-Terrer, I.; de los Reyes-Guzmán, A.; López-Monteagudo, P.; Bernal-Sahún, A.; Gil-Agudo, Á. Kinematic metrics based on the virtual reality system Toyra as an assessment of the upper limb rehabilitation in people with spinal cord injury. BioMed Res. Int. 2014, 2014, 904985. [Google Scholar] [CrossRef][Green Version]
- Levin, M.F.; Michaelsen, S.M.; Cirstea, C.M.; Roby-Brami, A. Use of the trunk for reaching targets placed within and beyond the reach in adult hemiparesis. Exp. Brain Res. 2002, 143, 171–180. [Google Scholar] [CrossRef]
- Patterson, T.S.; Bishop, M.; McGuirk, T.; Sethi, A.; Richards, L. Reliability of upper extremity kinematics while performing different tasks in individuals with stroke. J. Mot. Behav. 2011, 43, 121–130. [Google Scholar] [CrossRef]
- Alt Murphy, M.; Häger, C.K. Kinematic analysis of the upper extremity after stroke—How far have we reached and what have we grasped? Phys. Ther. Rev. 2015, 20, 137–155. [Google Scholar] [CrossRef]
- Nguyen, H.B.; Lee, S.W.; Harris-Love, M.L.; Lum, P.S. Neural coupling between homologous muscles during bimanual tasks: Effects of visual and somatosensory feedback. J. Neurophysiol. 2017, 117, 655–664. [Google Scholar] [CrossRef]
- Neto, G.R.; Santos, H.H.; Sousa, J.B.; Júnior, A.T.; Araújo, J.P.; Aniceto, R.R.; Sousa, M.S. Effects of high-intensity blood flow restriction exercise on muscle fatigue. J. Hum. Kinet. 2014, 41, 163. [Google Scholar] [CrossRef]
- Yang, Q.; Yang, Y.; Luo, J.; Li, L.; Yan, T.; Song, R. Kinematic outcome measures using target-reaching arm movement in stroke. Ann. Biomed. Eng. 2017, 45, 2794–2803. [Google Scholar] [CrossRef]
- Nagai, K.; Yamada, M.; Tanaka, B.; Uemura, K.; Mori, S.; Aoyama, T.; Ichihashi, N.; Tsuboyama, T. Effects of balance training on muscle coactivation during postural control in older adults: A randomized controlled trial. J. Gerontol. Ser. Biomed. Sci. Med. Sci. 2012, 67, 882–889. [Google Scholar] [CrossRef]
- DeJong, S.L.; Lang, C.E. Comparison of unilateral versus bilateral upper extremity task performance after stroke. Top. Stroke Rehabil. 2012, 19, 294–305. [Google Scholar] [CrossRef]
- Kantak, S.; McGrath, R.; Zahedi, N. Goal conceptualization and symmetry of arm movements affect bimanual coordination in individuals after stroke. Neurosci. Lett. 2016, 626, 86–93. [Google Scholar] [CrossRef]
- Rueda, F.M.; Montero, F.R.; de Heredia Torres, M.P.; Diego, I.A.; Sánchez, A.M.; Page, J.M. Análisis del movimiento de la extremidad superior hemiparética en pacientes con accidente cerebrovascular: Estudio piloto. Neurología 2012, 27, 343–347. [Google Scholar] [CrossRef]
- Alt Murphy, M.; Willén, C.; Sunnerhagen, K.S. Responsiveness of upper extremity kinematic measures and clinical improvement during the first three months after stroke. Neurorehabilit. Neural Repair 2013, 27, 844–853. [Google Scholar] [CrossRef]
- Coderre, A.M.; Abou Zeid, A.; Dukelow, S.P.; Demmer, M.J.; Moore, K.D.; Demers, M.J.; Bretzke, H.; Herter, T.M.; Glasgow, J.I.; Norman, K.E.; et al. Assessment of upper-limb sensorimotor function of subacute stroke patients using visually guided reaching. Neurorehabilit. Neural Repair 2010, 24, 528–541. [Google Scholar] [CrossRef]
- Longhi, M.; Merlo, A.; Prati, P.; Giacobbi, M.; Mazzoli, D. Instrumental indices for upper limb function assessment in stroke patients: A validation study. J. Neuroeng. Rehabil. 2016, 13, 1–11. [Google Scholar] [CrossRef]
- Otaka, E.; Otaka, Y.; Kasuga, S.; Nishimoto, A.; Yamazaki, K.; Kawakami, M.; Ushiba, J.; Liu, M. Clinical usefulness and validity of robotic measures of reaching movement in hemiparetic stroke patients. J. Neuroeng. Rehabil. 2015, 12, 1–10. [Google Scholar] [CrossRef]
- Aprile, I.; Rabuffetti, M.; Padua, L.; Di Sipio, E.; Simbolotti, C.; Ferrarin, M. Kinematic analysis of the upper limb motor strategies in stroke patients as a tool towards advanced neurorehabilitation strategies: A preliminary study. BioMed Res. Int. 2014, 2014, 636123. [Google Scholar] [CrossRef]
- Massie, C.L.; Malcolm, M.P. Instructions emphasizing speed improves hemiparetic arm kinematics during reaching in stroke. NeuroRehabilitation 2012, 30, 341–350. [Google Scholar] [CrossRef]
- Kotov-Smolenskiy, A.; Khizhnikova, A.; Klochkov, A.; Suponeva, N.; Piradov, M. Surface EMG: Applicability in the Motion Analysis and Opportunities for Practical Rehabilitation. Hum. Physiol. 2021, 47, 237–247. [Google Scholar] [CrossRef]
- Campanini, I.; Disselhorst-Klug, C.; Rymer, W.Z.; Merletti, R. Surface EMG in clinical assessment and neurorehabilitation: Barriers limiting its use. Front. Neurol. 2020, 11, 934. [Google Scholar] [CrossRef]
- Barker, R.N.; Brauer, S.; Carson, R. Training-induced changes in the pattern of triceps to biceps activation during reaching tasks after chronic and severe stroke. Exp. Brain Res. 2009, 196, 483–496. [Google Scholar] [CrossRef]
- Chaytor, C.P.; Forman, D.; Byrne, J.; Loucks-Atkinson, A.; Power, K.E. Changes in muscle activity during the flexion and extension phases of arm cycling as an effect of power output are muscle-specific. PeerJ 2020, 8, e9759. [Google Scholar] [CrossRef]
- Gribble, P.L.; Mullin, L.I.; Cothros, N.; Mattar, A. Role of cocontraction in arm movement accuracy. J. Neurophysiol. 2003, 89, 2396–2405. [Google Scholar] [CrossRef]
Publisher’s Note: MDPI stays neutral with regard to jurisdictional claims in published maps and institutional affiliations. |
© 2022 by the authors. Licensee MDPI, Basel, Switzerland. This article is an open access article distributed under the terms and conditions of the Creative Commons Attribution (CC BY) license (https://creativecommons.org/licenses/by/4.0/).