Article

Effect of Process Parameters on Distortions Based on the Quantitative Model in the SLM Process

1
School of Transportation and Logistics Engineering, Wuhan University of Technology, Wuhan 430063, China
2
Wuhan Hangke Logistics Company Limited, CCCC Second Harbour Engineering Company Ltd., Wuhan 430013, China
3
School of Art and Design, Wuhan University of Technology, Wuhan 430070, China
4
Mechanical and Manufacturing Engineering Department, Miami University, Oxford, OH 45056, USA
*
Author to whom correspondence should be addressed.
Appl. Sci. 2022, 12(3), 1567; https://doi.org/10.3390/app12031567
Submission received: 1 January 2022 / Revised: 28 January 2022 / Accepted: 28 January 2022 / Published: 31 January 2022
(This article belongs to the Special Issue Smart Manufacturing and Materials)

Abstract

:
The selective laser melting (SLM) process provides a more extensive design space and manufacturability. However, it is still hindered by its inaccuracy in dimension and functionality. The distortion in the SLM process affects the dimensional accuracy of the component and may even hinder the SLM process. Still, the distortion mechanism has not been well explained; specifically, the effects from the process parameters and scan strategies on the distortion have not been sufficiently investigated. In this study, a quantitative model that considers displacements, plastic strains, and thermal strains on each layer is developed to analyze the distortion mechanism. The distortion is found to be induced by a residual stress gradient among the layers. Then, a transient numerical method calculates residual stress, plastic strain, and distortion in the SLM process. Different simulations with various layers, scanning speeds, stiffness of support structures, and scan strategies are performed to study the relationship between process parameters and distortion. It can be found that the distortion decreases as the height increases. The distortion increases with the scanning speed, reaching the maximum at 700 mm/s and then dropping. We concluded that increasing the stiffness of the support structures is beneficial to reduce the distortion and changing the scanning direction among layers is useless to reduce the distortion. This study gives a theoretical model to analyze the distortion and provides guidance for reducing distortions in the SLM process.

1. Introduction

Additive manufacturing (AM) is a promising approach for rapid prototyping [1]. As a precision AM technology, selective laser melting (SLM) is widely employed in medical instruments, aerospace, and auto industries [2,3,4]. However, the thermal stresses accumulated within the process lead to defects such as distortions, laminations, and cracks [5,6]. The distortion is a common problem for SLM technology [7]. In addition, it decreases the dimensional accuracy of the SLM-printed component and may hinder the laying of the powder bed [8].
Many researchers have attempted to explain the mechanism of the distortion. Kruth et al. [9] first proposed the temperature gradient mechanism (TGM) to explore the residual stress mechanism in the powder bed fusion. The method is then widely used to qualitatively analyze transient distortions during the process [10,11,12]. However, it focuses on micro-temperature distribution, which determines local residual stresses and distortions and cannot explain the distortion after the process or even after cut from the substrate. Xie et al. [13] assumed constraining force between the deposited layers to analyze the distortion. The theoretical prediction results have the same trend as the experimental results. However, plastic strains dramatically formed in the AM process were not considered in the method, and they might differ among deposited layers. Therefore, it is still essential to propose a reasonable model to illustrate the mechanism of distortion.
The numerical simulation method has been commonly utilized to study the distortion of additive manufacturing. Li et al. [14] proposed a numerical model to simulate cantilever deformations, matching the experimental results. Tawfik et al. [15], Afazov et al. [16], Song et al. [17], and Biegler et al. [18] proposed 3D models using the finite element method (FEM) to predict residual stresses and distortions of AM parts. Many studies have been made to investigate the characteristics of distortion. Mugwagwa et al. [19] found that decreasing laser power was beneficial to reduce residual stresses and distortions. Zhang et al. [20] investigated the distortion of porous structures and concluded that increasing the thickness and porosity of added layers could reduce the distortion of the substrate. Li et al. [14] studied the distortion of a twin cantilever using the simulation model, which was verified by experiments, and found that residual stresses along the scan direction mainly determine the distortion. Yan et al. [21] conducted island scanning methods with various sizes and sequences. The 20 × 20 mm2 outside-in island method contributed to the slightest distortion but increased the residual stress. In addition, pre-heating the substrate is valuable to alleviate the distortions of AM parts [22]. Although many efforts to explore the distortion’s regularity have been made, it is still required to illustrate the effects of process parameters and scan strategies on the distortion.
Thus, in this paper, a theoretical model considering plastic strains in deposited layers is proposed to reveal the distortion mechanism, and the influence of process parameters and scan strategies on the distortion is investigated. The experimentally verified transient thermo-mechanical model, which was developed in the previous study of the present authors [23], is employed to calculate stresses and distortions of the SLM-printed component. First, thin-walled components with various build heights, scanning speeds, and stiffness of the support structures and plate parts printing with different scan strategies are simulated. Then, the distortion mechanism is revealed by a quantitative model considering displacements, plastic strains, residual stresses, and thermal strains in each layer. Finally, the effect of process parameters and scan strategies on distortion is studied with the help of simulation results and the theoretical model.

2. Materials and Methods

2.1. Materials

Ti-6Al-4V has a high strength-to-weight ratio and good corrosion resistance [24]. In this study, SLM-printed components and substrates use Ti-6Al-4V. The thermal physical parameters of Ti-6Al-4V are listed in Table 1, and the mechanical properties are listed in Table 2.

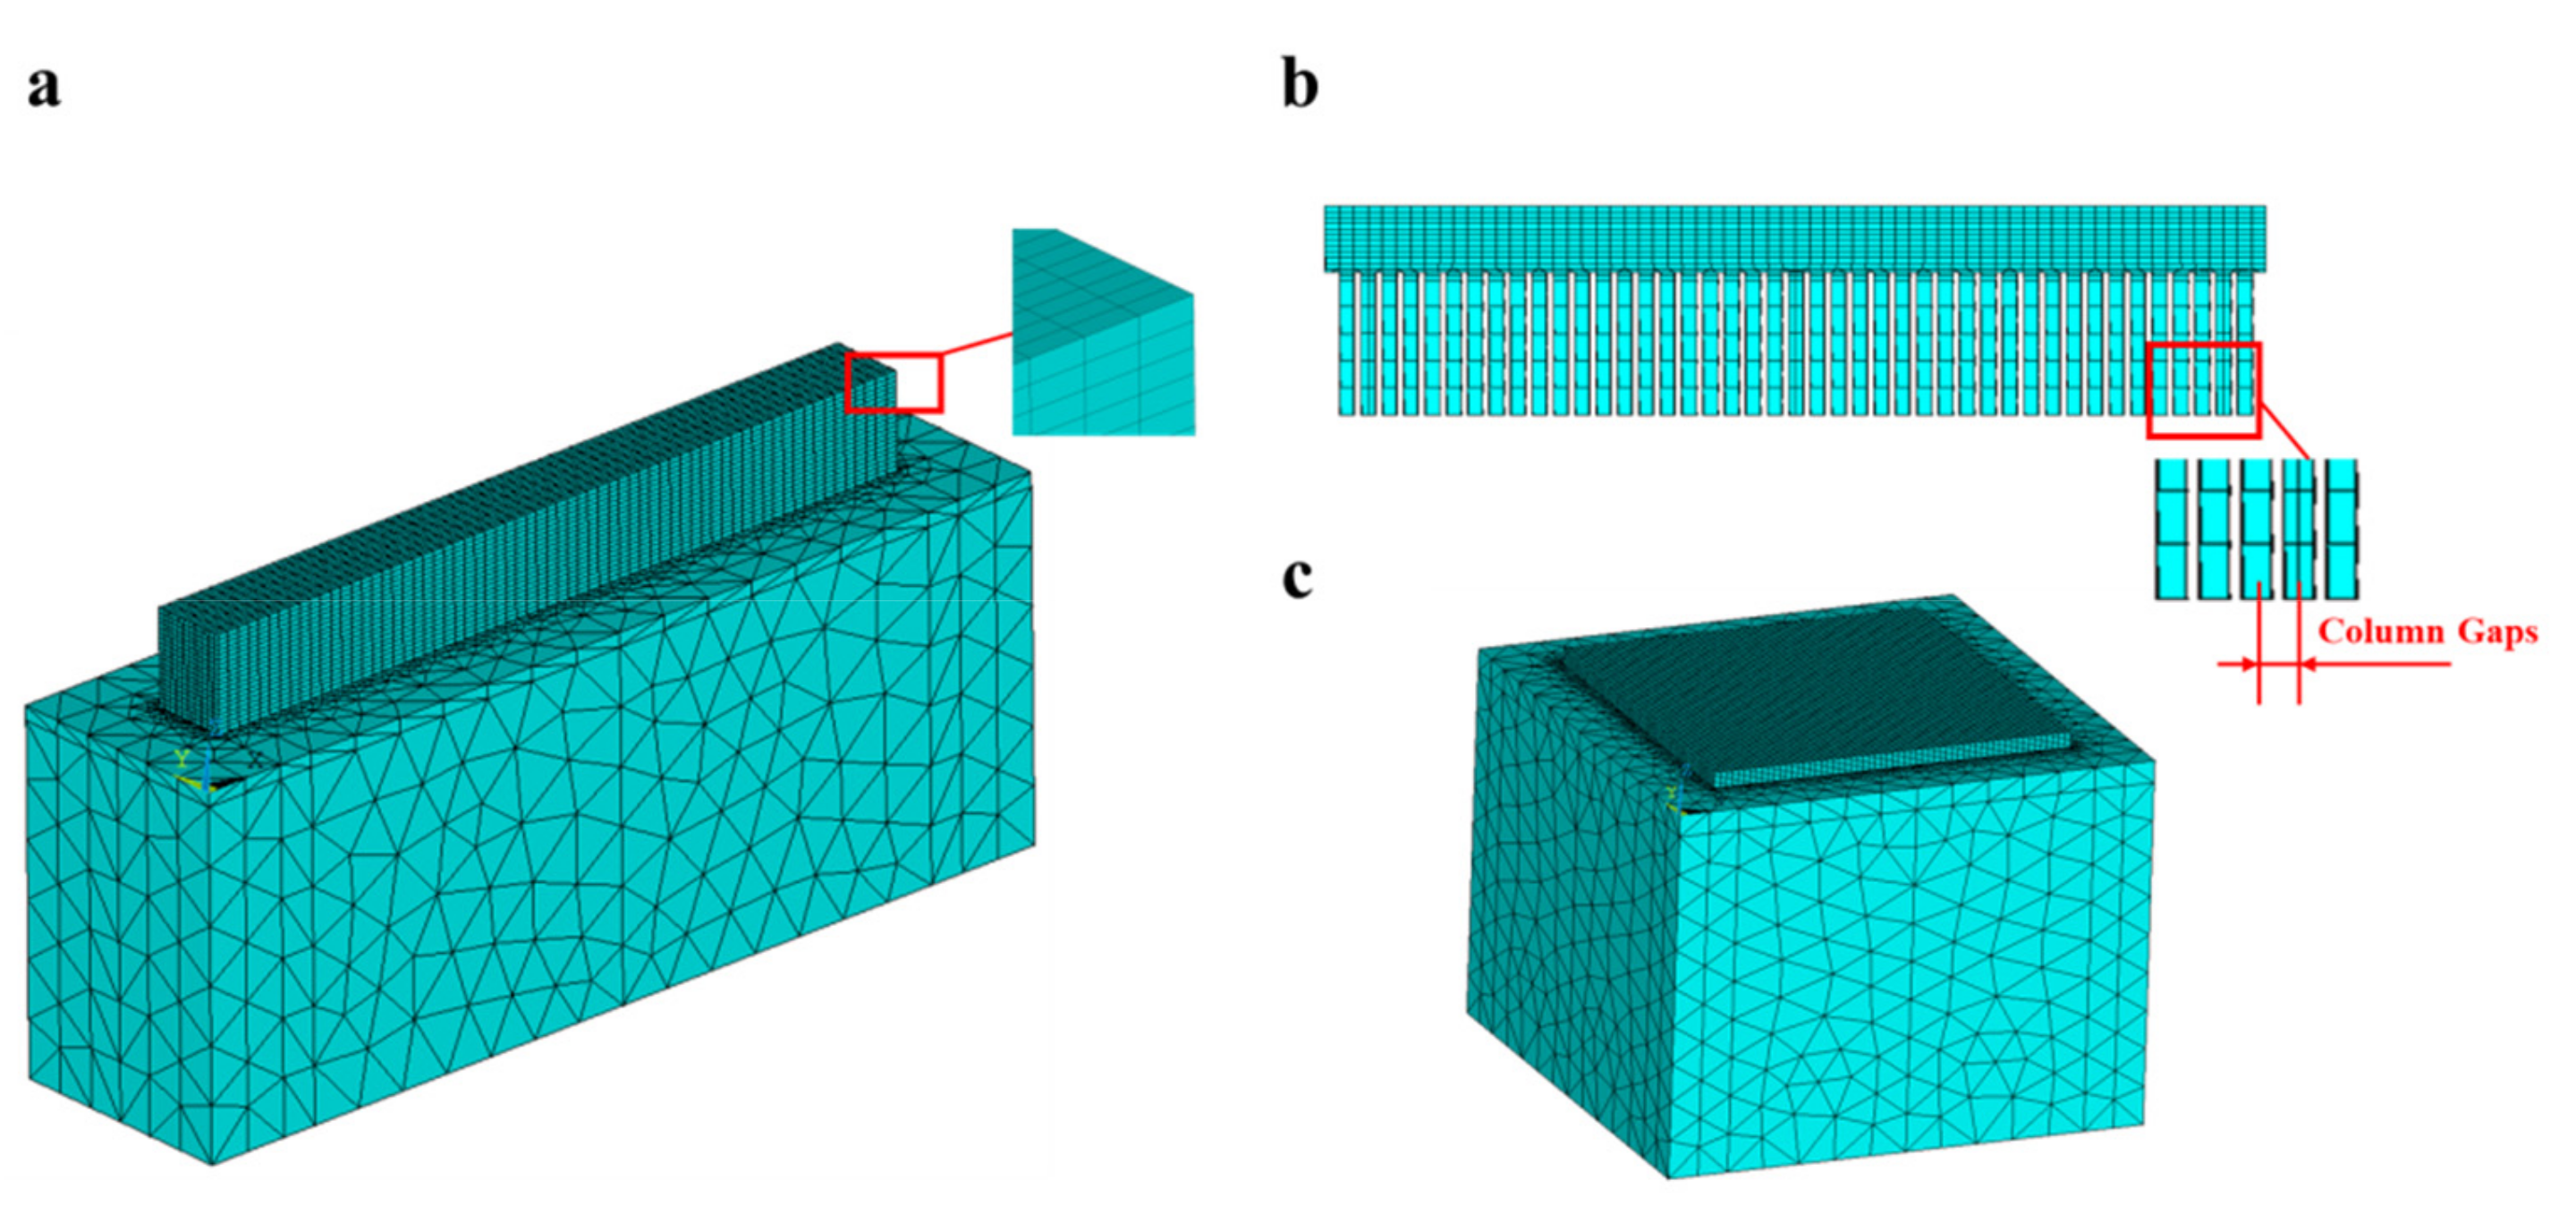
2.2. Numerical Method

The thermo-structural model is utilized to investigate residual stresses and distortions of SLM. The thermal simulation model is established using the FLUENT, a computational fluid dynamics (CFD) software, to calculate temperature fields in the SLM process. During the process, the governing equation can be expressed as:
ρ c T t + u T = x k x T x + y k y T y + z k z T z q l + Q
where ρ is the density, c is the specific heat, T is the temperature of the material, t is time, u is the velocity of the liquid metal, kx, ky, and kz are the thermal conductivities along the x, y, and z directions, ql is the heat loss through the surface of the part, and Q is the heat source. To accurately simulate the thermal effect, a volumetric Gaussian distributed heat source is used in this model.
After the thermal simulation, the temperature field is loaded into the mechanical model built using the FEA method to calculate thermal stresses, strains, and distortions. For example, the total strain, εtot, can be defined as:
ε t o t = ε e + ε p + ε t h
where εe is the elastic strain, εp is the plastic strain, and εth is the thermal strain.
More details of the thermo-mechanical model and the experimental verification of it can be found in our recent work [23].

2.3. Simulation Details

A thin-walled model is established (shown in Figure 1a) to investigate the distortion mechanism. The substrate dimensions are 8 × 2 × 3 mm3, and the powder bed region is 6.6 × 0.64 × 0.8 mm3. The powder bed region, which is dramatically heat-affected and undergoes a phase change, is finely meshed with 100 × 40 × 40 μm3 cubic element to improve the calculation efficiency. The substrate is meshed using coarse tetrahedrons. First, a thin-walled part with twenty layers and one track (6 mm length) within each layer is fabricated using a fixed scan speed of 800 mm/s. Other detailed process parameters are detailed in Table 3. Then, to investigate the effect of the height on the distortion, more simulations are conducted with various layers ranging from four to fifteen. This study is also to examine the effect of scanning speed on distortion. Therefore, six thin-walled parts with a height of 240 μm are manufactured at different scanning speeds ranging from 500 mm/s to 1000 mm/s. The stiffness of support structures depends on the elastic modulus and the porosity. The substrate of the thin-walled model is modified into a columnar structure (as shown in Figure 1b) to explore the effect of support structures stiffness on the distortion. The gap between each column determines the stiffness. As the column gap increases, the stiffness of support structures decreases. Five simulations at different column gaps in support structures ranging from 150 μm to 750 μm are performed. The height of the thin wall is 200 μm. A plate model shown in Figure 1c is built for exploring the relationship between scan strategies and distortions. The dimensions of the substrate are 4 × 4 × 3 mm3, and the powder zone is 2.6 × 2.6 × 0.016 mm3. Similar to the thin-walled model, the powder zone of this model is divided into 50 × 50 × 40 μm3 cubic elements. The scanning speed is fixed at 800 mm/s, and the scanning scale is 2 × 2× 0.016 mm3 (four layers). Figure 2 shows six different scanning patterns employed in the simulation model. Case (a) is unidirectional scanning, where the scanning direction of each layer stays the same. In Case (b), the scanning movement rotates 90° between layers. Case (c) also has a 90° rotation, but the scanning direction is at a 45° angle to the boundary of the powder bed. The rotation angle in Case (d) is 45°, and the initial scanning movement is along the x-direction. The contour scanning pattern is widely adopted in the SLM process [27]. Case (e) and Case (f) are the out–in and the in–out scanning strategy, respectively.

3. Results

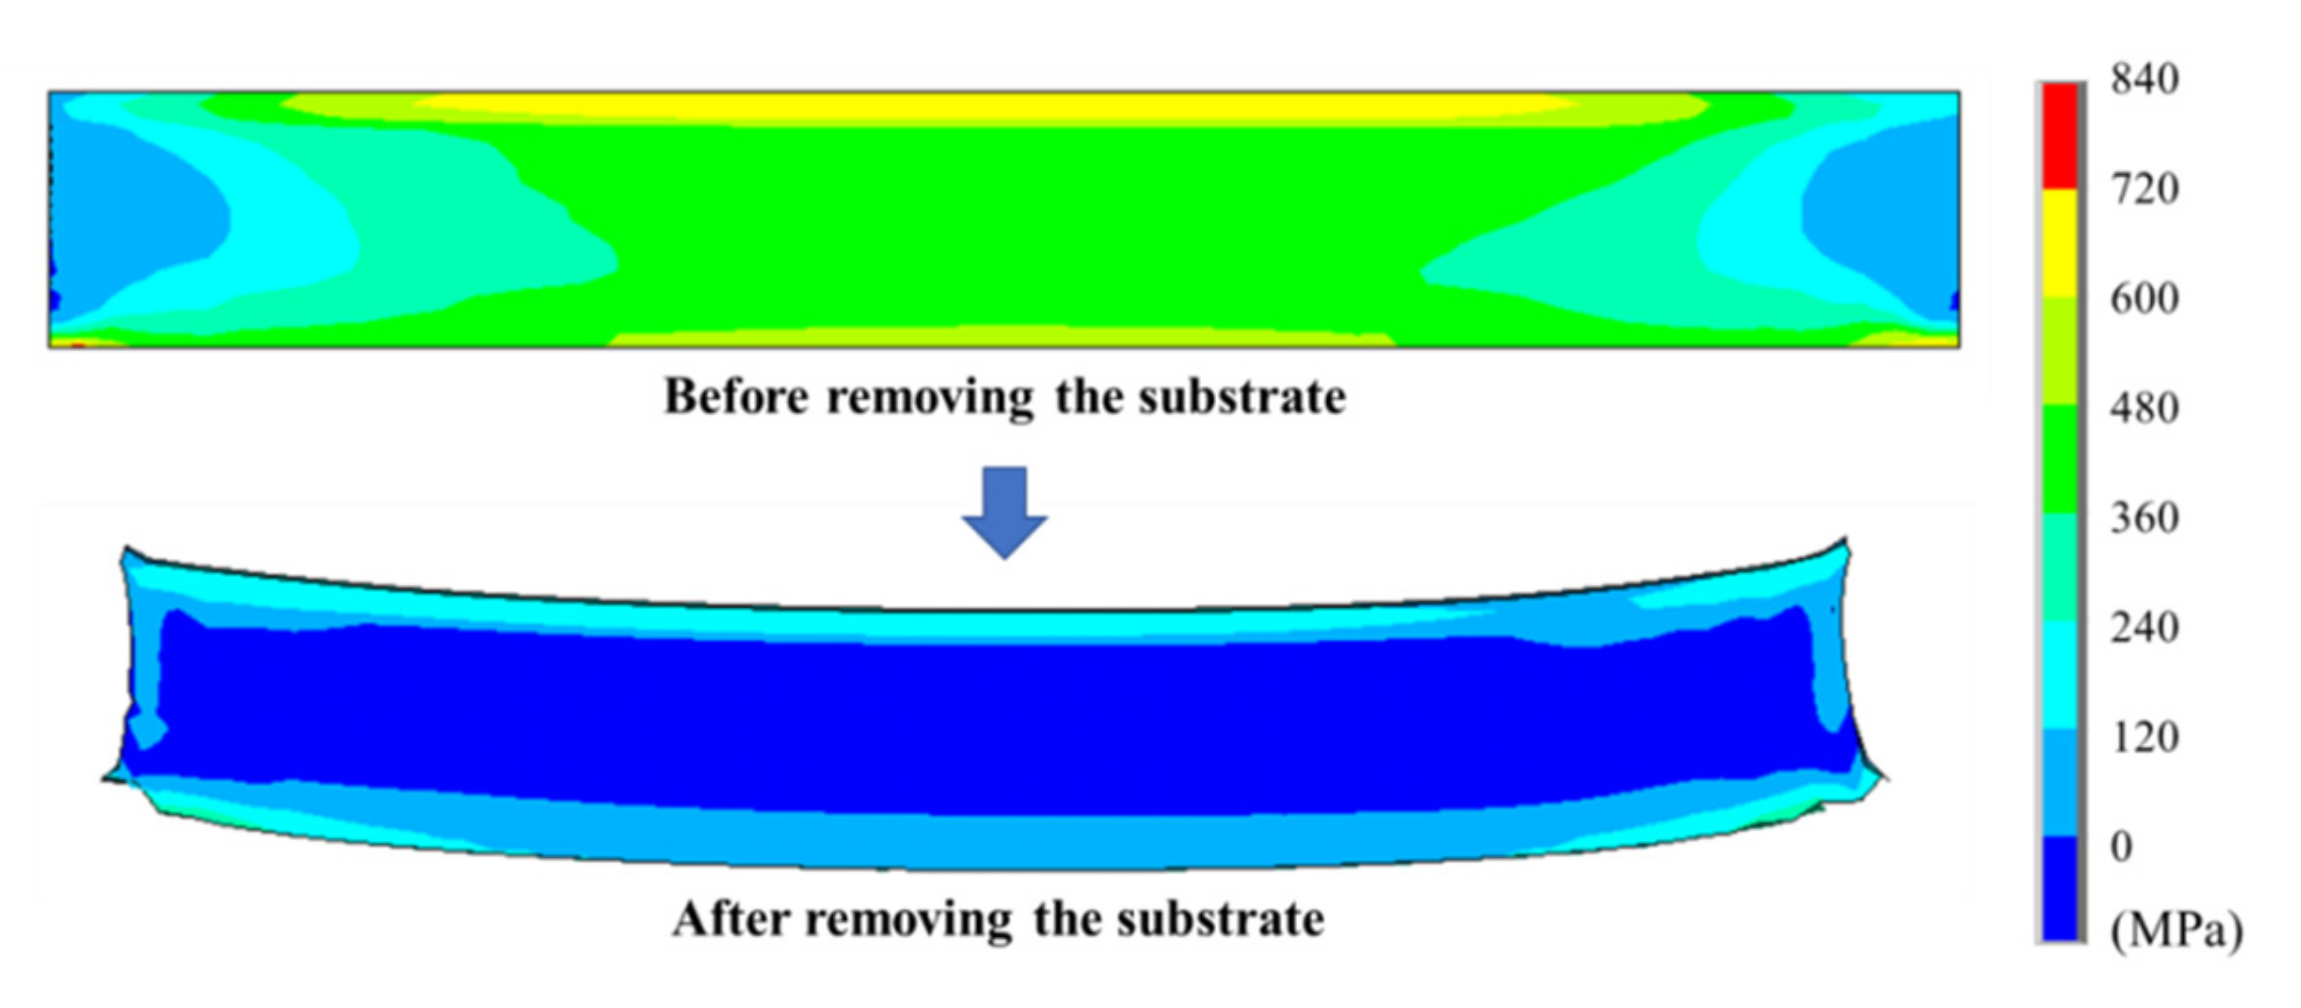
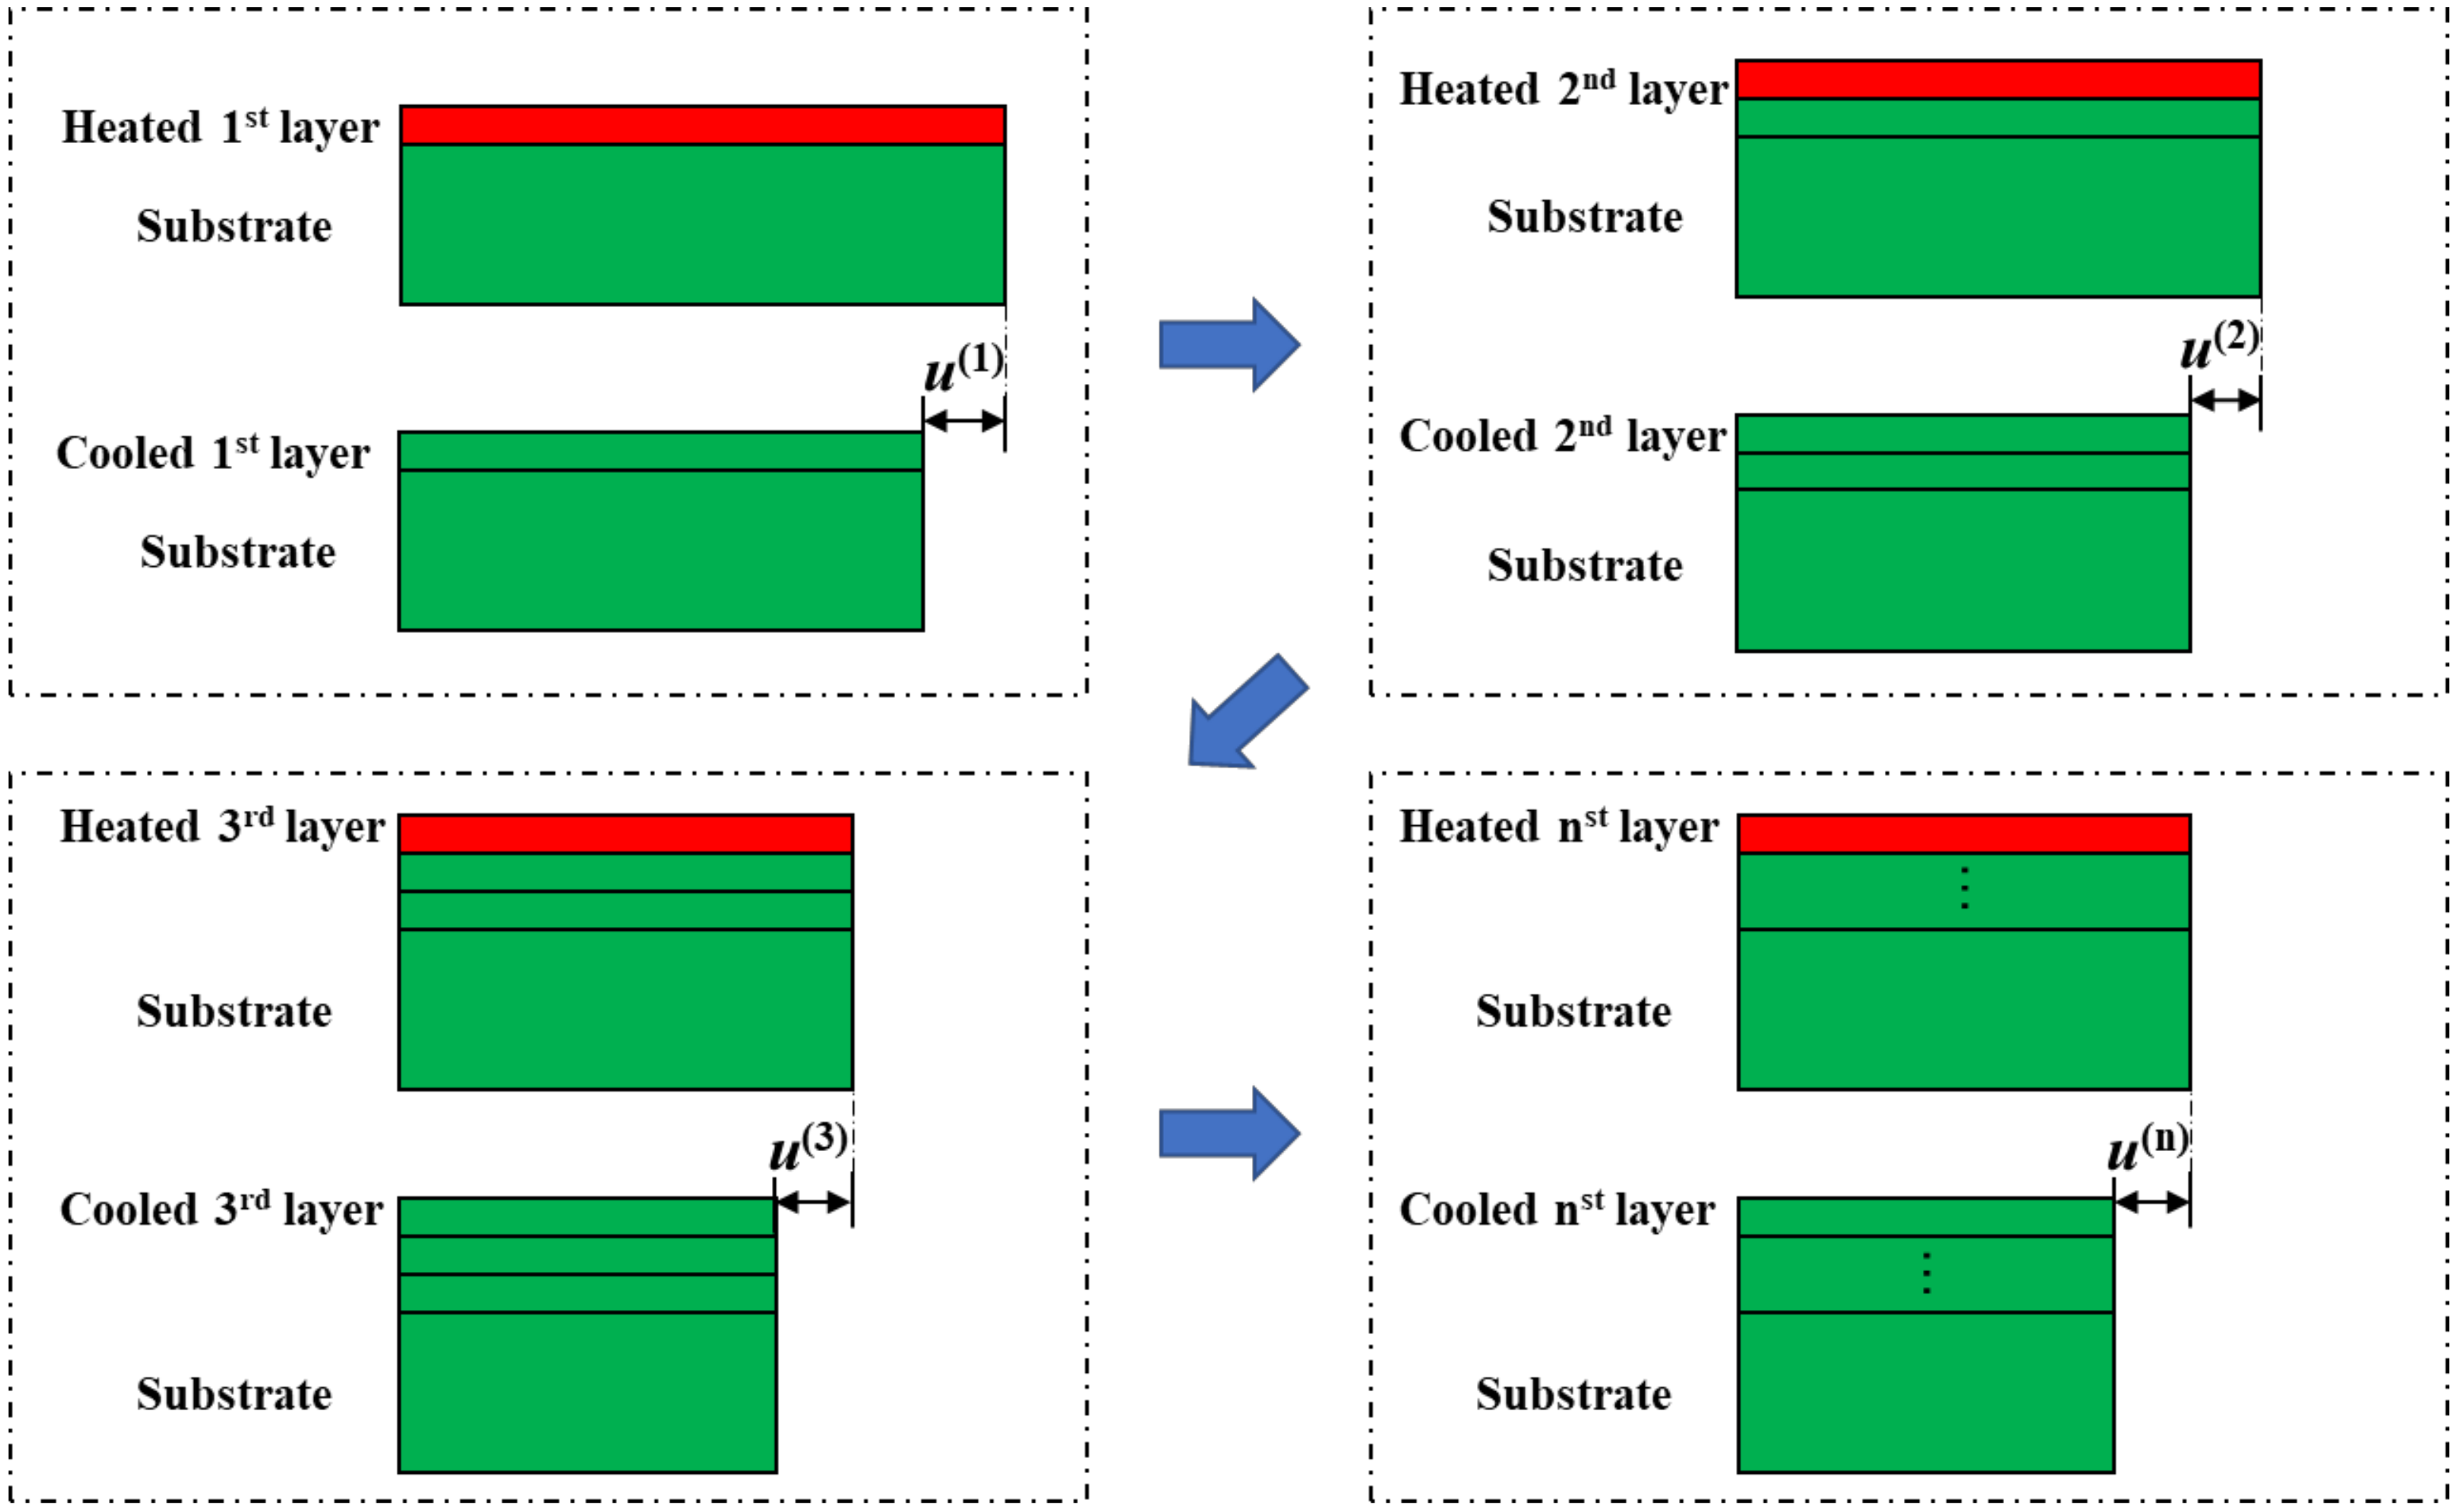
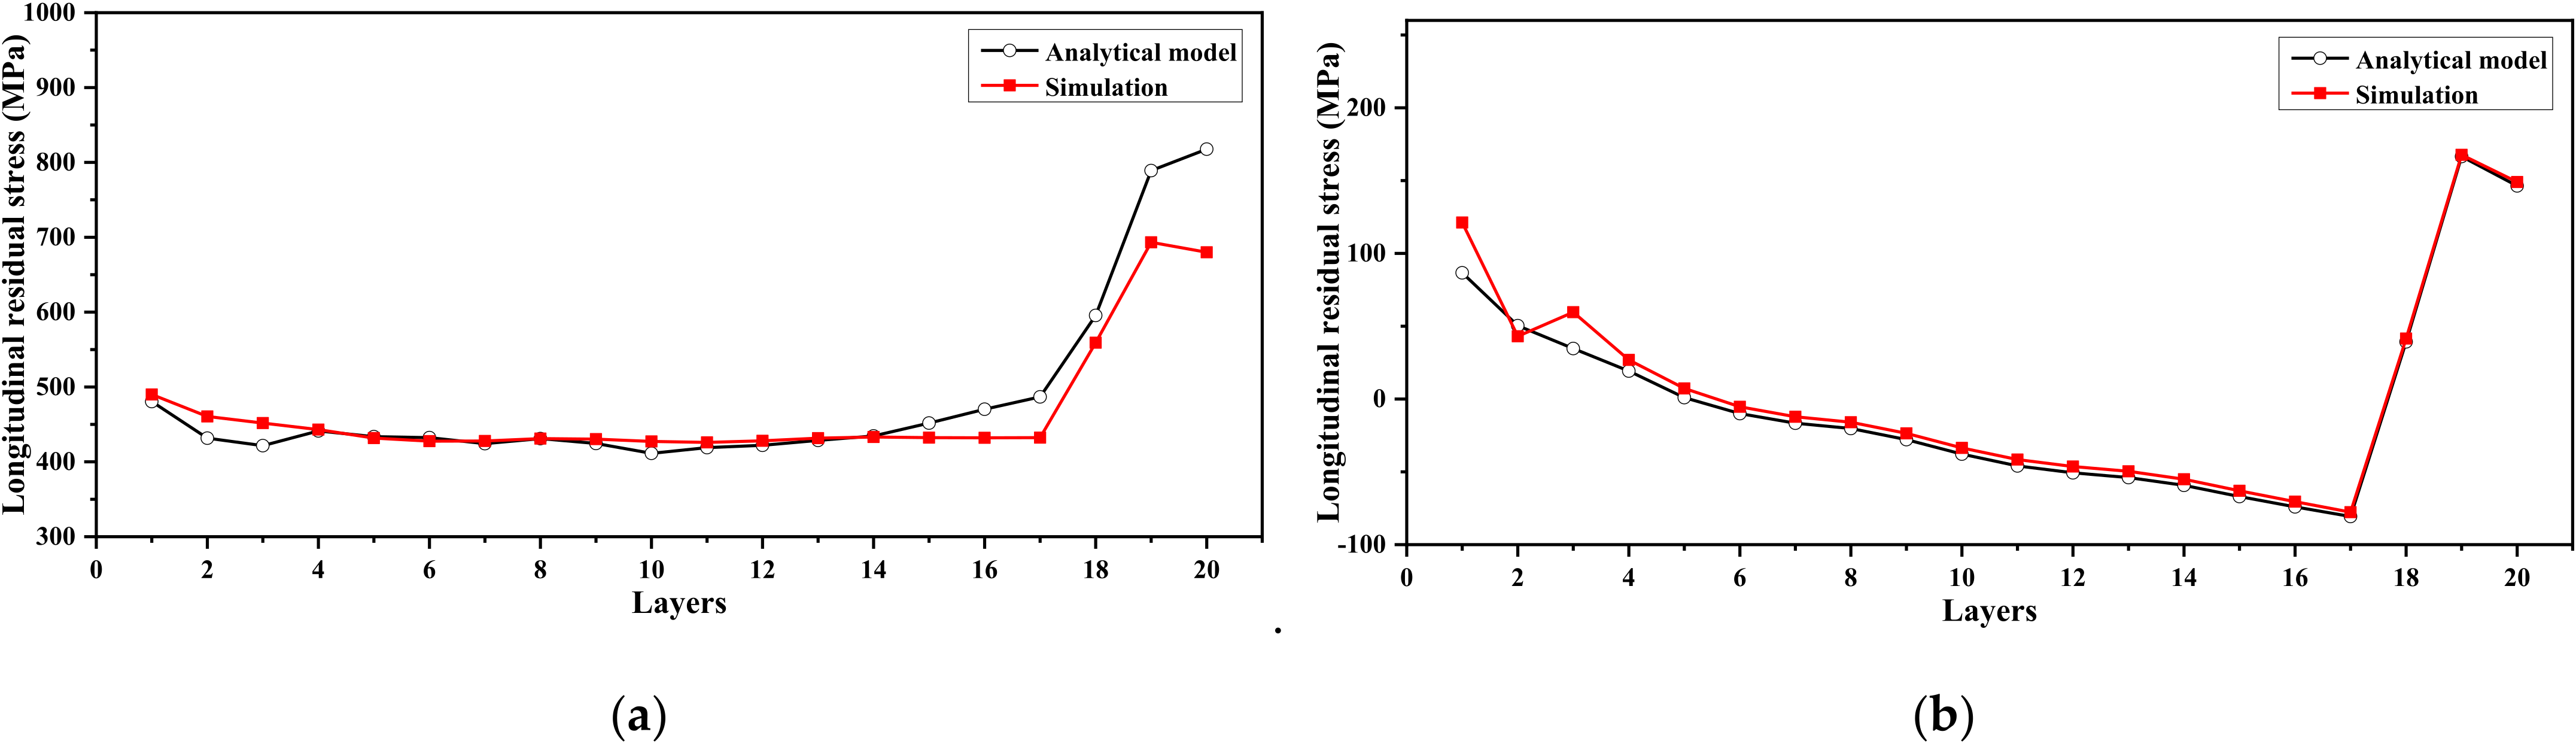
3.1. Mechanism of Distortion

Observing the stress field on the twenty-layer thin wall (as shown in Figure 3), the longitudinal residual stress is significantly reduced, and distortion is formed after removing the substrate. This means that residual stresses influence the distortion before the substrate is removed. Therefore, an analytical model is established to investigate the distribution and evolution of residual stresses in the thin wall to study the distortion mechanism.
A thin wall has n layers with a thickness of h, width of w, and length of L. During the SLM process, the newly added layer is deposited on the previous layer or substrate. The newly added layer shrinks due to the cooling effect, which drives the deposited layers and substrate to shrink (as shown in Figure 4). It is assumed that the newly added layer has the same displacement as the structure below. The plastic strain in the substrate is neglected since the plastic area is relatively small in the substrate. Since the distortion is mainly affected by the residual stress in the scanning direction [14], we only discuss stresses and strains in the longitudinal direction. The manufacturing process is divided into the following steps (as shown in Figure 4) to calculate the residual stress on each layer.
(1) Step 1. When the first layer is deposited and cooled down, the residual stress in the substrate σ s ( 1 ) can be expressed as:
σ s ( 1 ) = E s ε s _ e ( 1 ) = E s u ( 1 ) L ε s _ t h ( 1 )
where E s is the elastic modulus of the substrate, ε s _ e ( 1 ) is the elastic strain of the substrate, u ( 1 ) is the displacement of the component, and ε s _ t h ( 1 ) is the thermal strain of the substrate. The residual stress in the first layer σ f 1 ( 1 ) is defined as:
σ f 1 ( 1 ) = E f ε f _ e 1 ( 1 ) = E f u ( 1 ) L ε f _ p 1 ( 1 ) ε f _ t h 1 ( 1 )  
where E f is the elastic modulus of the deposited material, and ε f _ e 1 ( 1 ) , ε f _ p 1 ( 1 ) , and ε f _ t h 1 ( 1 ) are the elastic strain, the plastic strain, and the thermal strain of the deposited material, respectively. The force balance in the longitudinal direction can be expressed as:
σ s ( 1 ) A s + σ f 1 ( 1 ) A f 1 = 0  
where A s is the equivalent sectional area of the substrate, and A f 1 is the sectional area of the first layer. Therefore, the displacement of the first layer u ( 1 ) can be expressed as:
u ( 1 ) = E s A s ε s _ t h ( 1 ) + E f A f 1 ε f _ p 1 ( 1 ) + ε f _ t h 1 ( 1 ) E s A s + E f A f 1  
(2) Step 2. When the second layer is added, residual stresses in the substrate, the first layer, and the second layer can be expressed as:
σ s ( 2 ) = E s ε s _ e ( 2 ) = E s u ( 1 ) + u ( 2 ) L ε s _ t h ( 2 )
σ f 1 ( 2 ) = E f ε f _ e 1 ( 2 ) = E f u ( 1 ) + u ( 2 ) L ε f _ p 1 ( 2 ) ε f _ t h 1 ( 2 )
σ f 2 ( 2 ) = E f ε f _ e 2 ( 2 ) = E f u ( 2 ) L ε f _ p 2 ( 2 ) ε f _ t h 2 ( 2 )
The force balance in the longitudinal direction can be expressed as:
σ s ( 2 ) A s + σ f 1 ( 2 ) A f 1 + σ f 2 ( 2 ) A f 2 = 0
The displacement of the second layer can be expressed as:
u ( 2 ) = L E s A s ε s _ t h ( 2 ) ε s _ t h ( 1 ) + E f A f 1 ε f _ p 1 ( 2 ) ε f _ p 1 ( 1 ) + ε f _ t h 1 ( 2 ) ε f _ t h 1 ( 1 ) + E f A f 2 ε f _ p 2 ( 2 ) + ε f _ t h 2 ( 2 ) E s A s + E f A f 1 + E f A f 2
(3) Step n. When the nth layer is deposited, the displacement of the nth layer can be expressed as:
u ( n ) = L E s A s ε s _ t h ( n ) ε s _ t h ( n 1 ) + E f k = 1 n 1 A f k ε f _ p k ( n ) ε f _ p k ( n 1 ) + ε f _ t h k ( n ) ε f _ t h k ( n 1 ) + A f n ε f _ p n ( n ) + ε f _ t h n ( n ) E s A s + E f k = 1 n A k
The residual stress in the i t h layer after the process can be expressed as:
σ f i ( n ) = E f k = i n u ( k ) L ε f _ p i ( n ) ε f _ t h i ( n )  
Hence, the residual stress on each layer is related to changes in displacements, plastic strains, and thermal strains. After cutting from the substrate, the component shrinks and bends due to the residual stress. Therefore, the residual stress in the final part can be divided into two aspects: axial stress and bending stress. After being removed from the substrate, the component is free from external constraints, and the total force at the cross-section should be zero. Since the cross-sectional area of each layer is the same, the i th layer axial stress after shrinkage σ f _ a i can be expressed as:
σ f _ a i = σ f i ( n ) k = 1 n σ f k ( n ) n
Define the bending curve with K. The bending stress of the ith layer σ f _ b i can be expressed as:
σ f _ b i = E f K i n + 1 2 h
The bending moment at the cross-section induced by the bending stress M b can be expressed as:
M b = w h K i = 1 n E f i n + 1 2 h 2
The other moment induced by the axial stress Ma can be expressed as:
M a = w h i = 1 n σ f _ a i i n + 1 2 h
Since the total moment at the cross-section should be zero, the expression of bending curve K can be obtained:
K = i = 1 n σ f _ a i i n + 1 2 h E f i = 1 n i n + 1 2 h 2
Therefore, the distortion degree of the component D can be evaluated with –K. The ith layer residual stress in the component can be expressed as:
σ f i = σ f _ a i + σ f _ b i = σ f i ( n ) k = 1 n σ f k ( n ) n + E f K i n + 1 2 h
According to the evolution of plastic strains in the twenty-layer thin wall, residual stresses before removing from the substrate can be obtained from the above equations. Figure 5a shows the residual stress comparison between the analytical model and the simulation. The residual stress distributions along the vertical direction have the same trend. The differences in the upper layers may be due to the influence of their free deformations on stress reduction in the analytical model being ignored. To validate the distortion analytical model, the residual stress of the simulation result is used as the initial value for calculating the bending stress. After removing the substrate, residual stress distributions of the analytical model and the simulation are shown in Figure 5b. The analytical results match well with the simulation results.

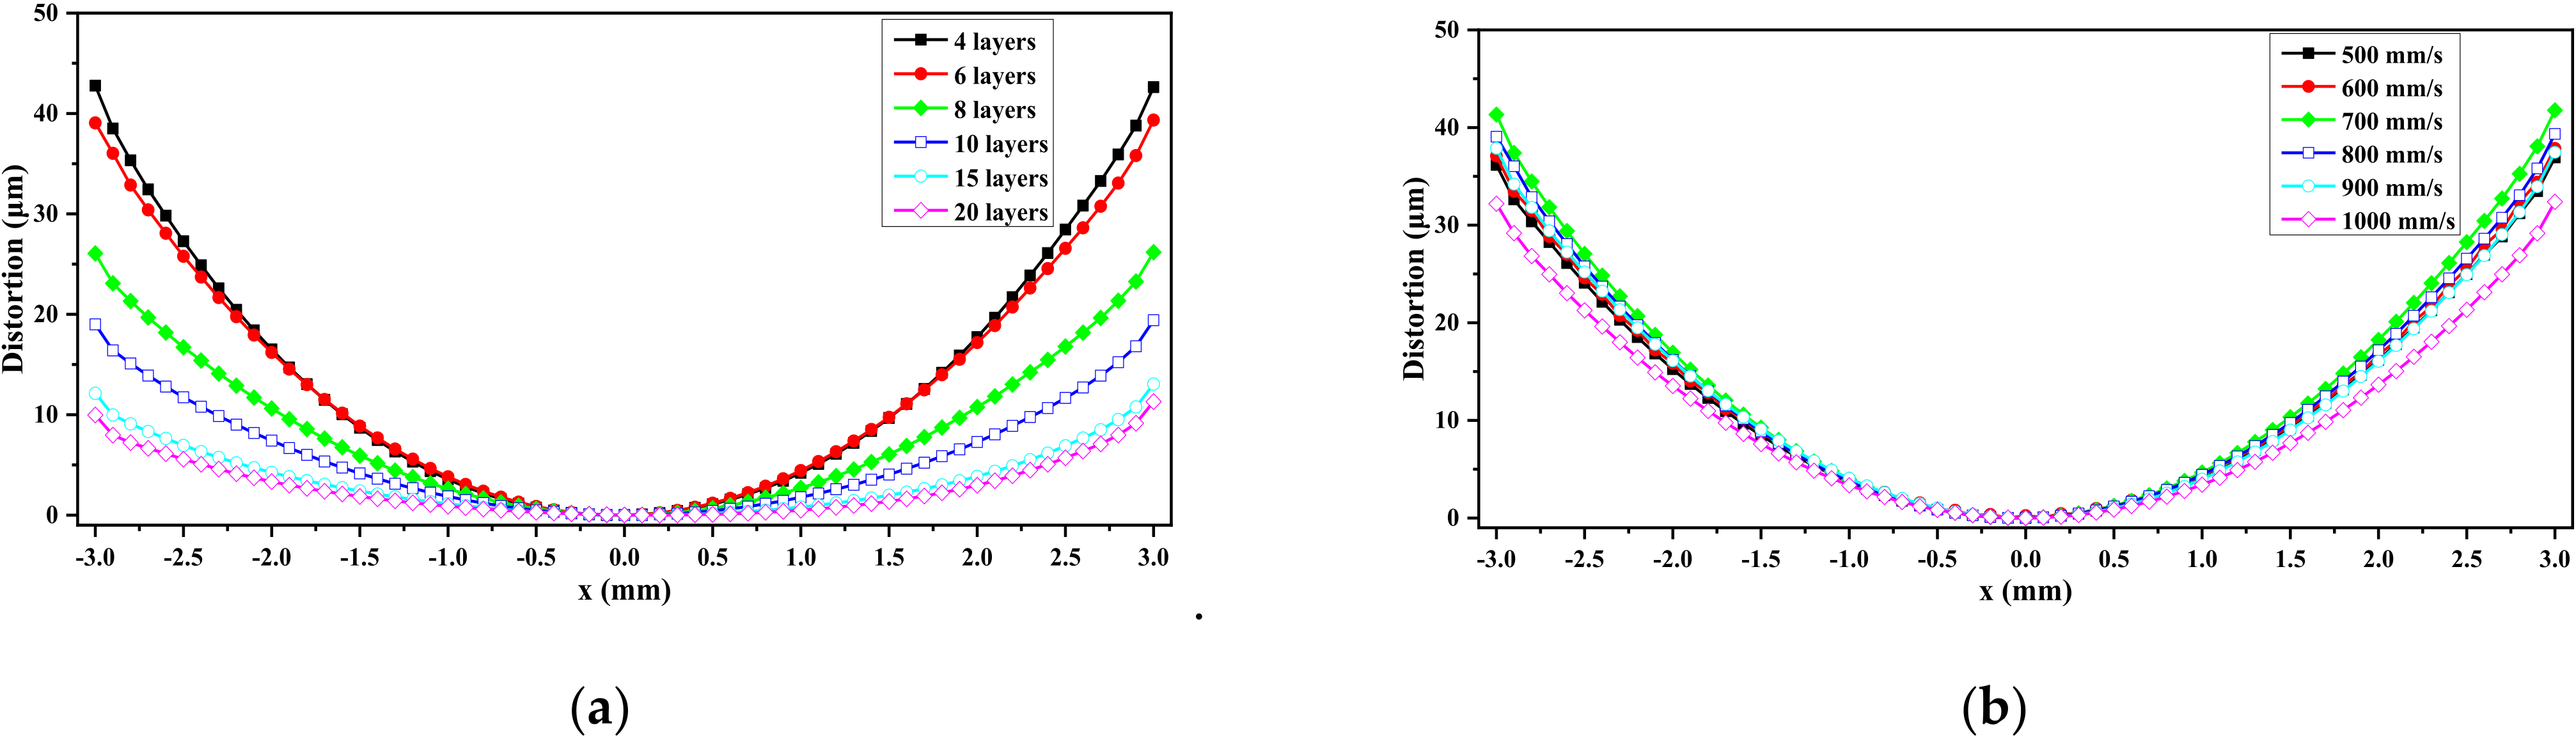
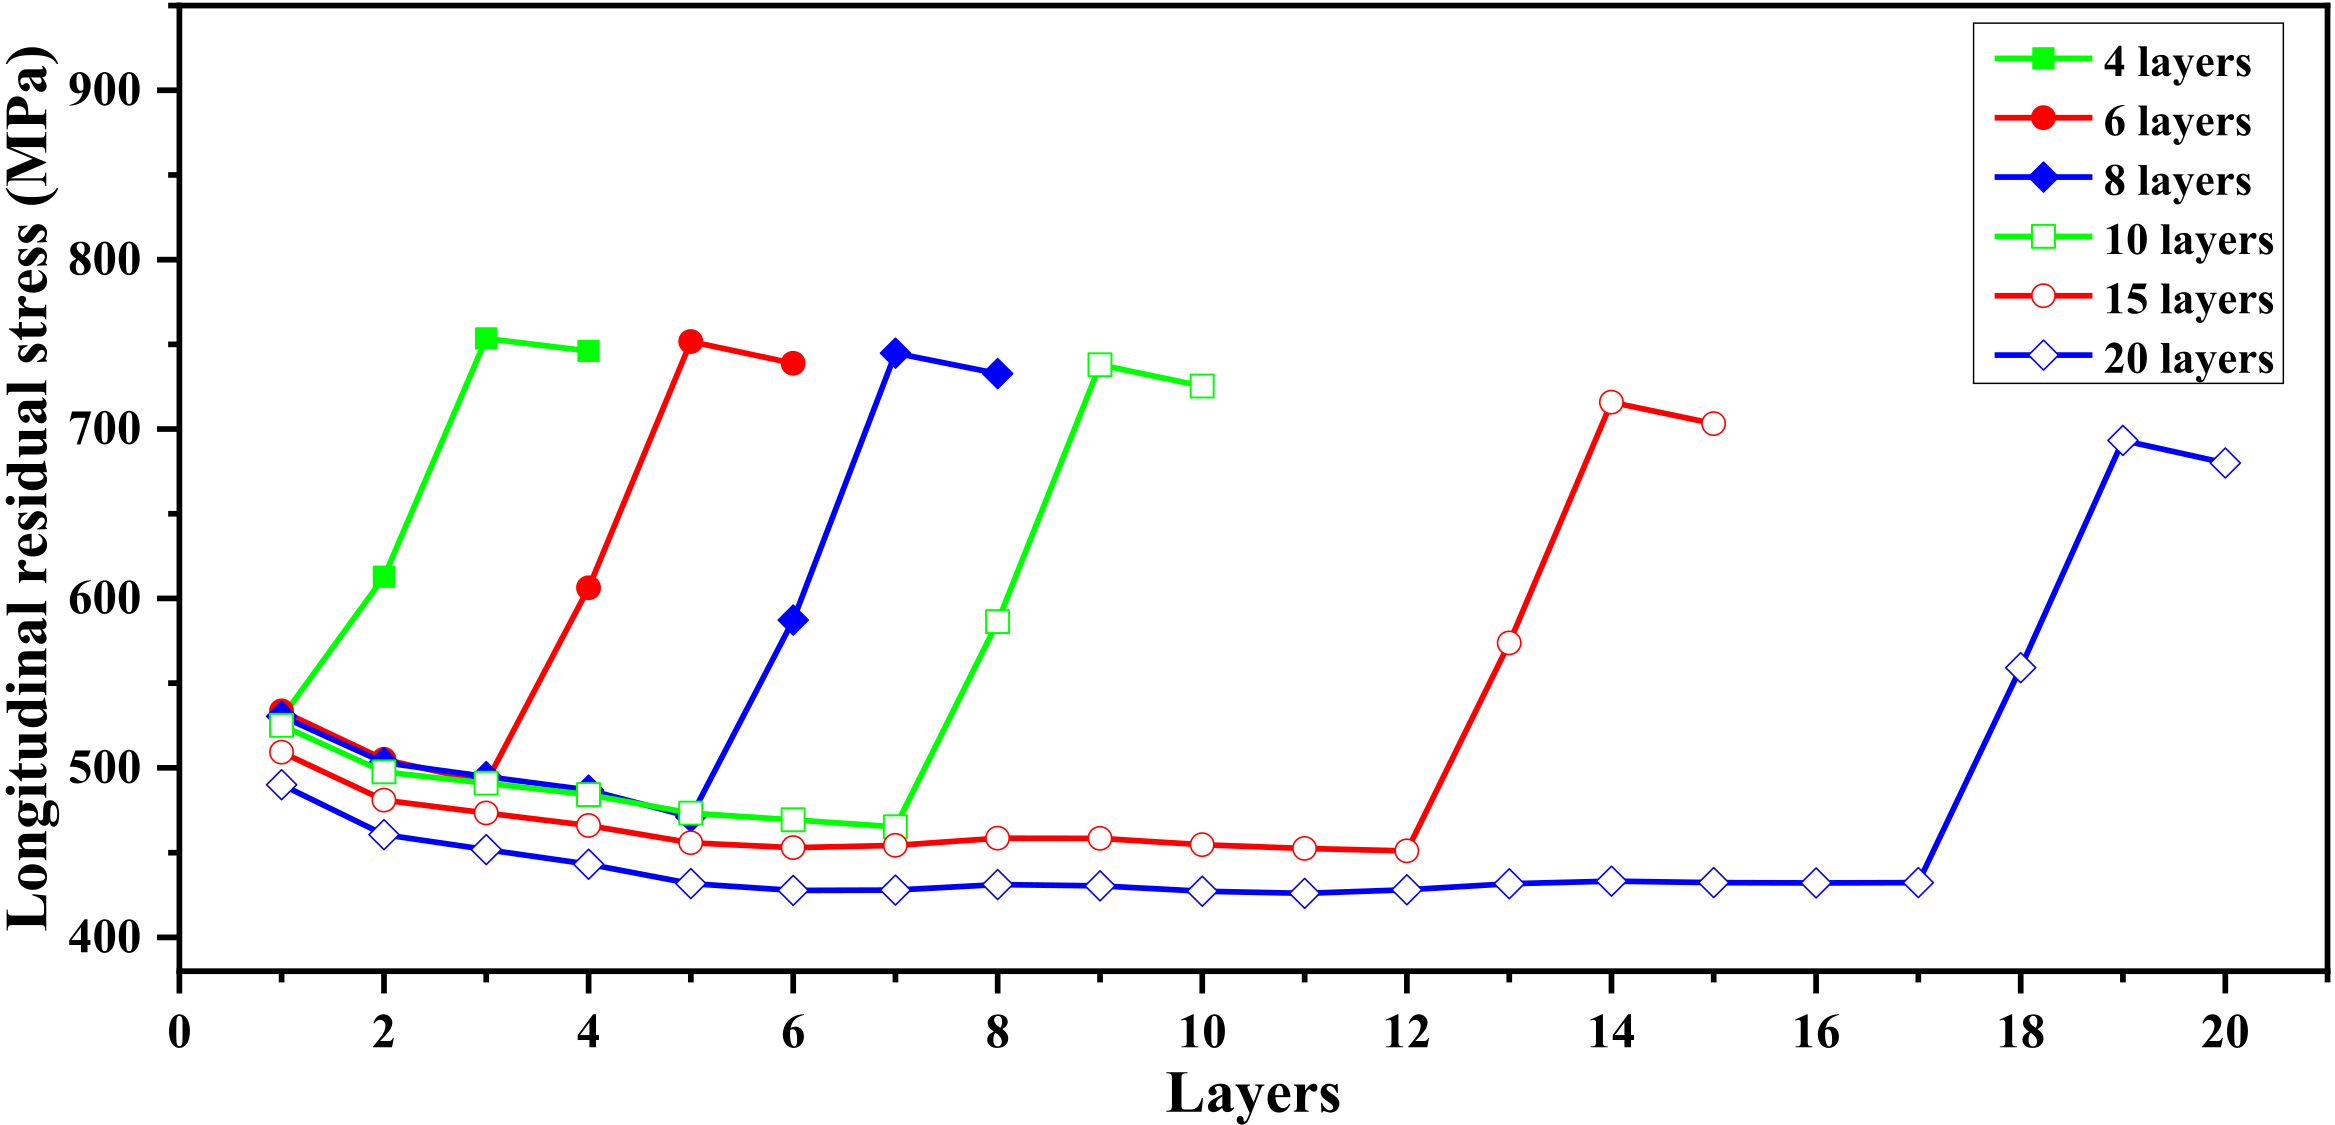
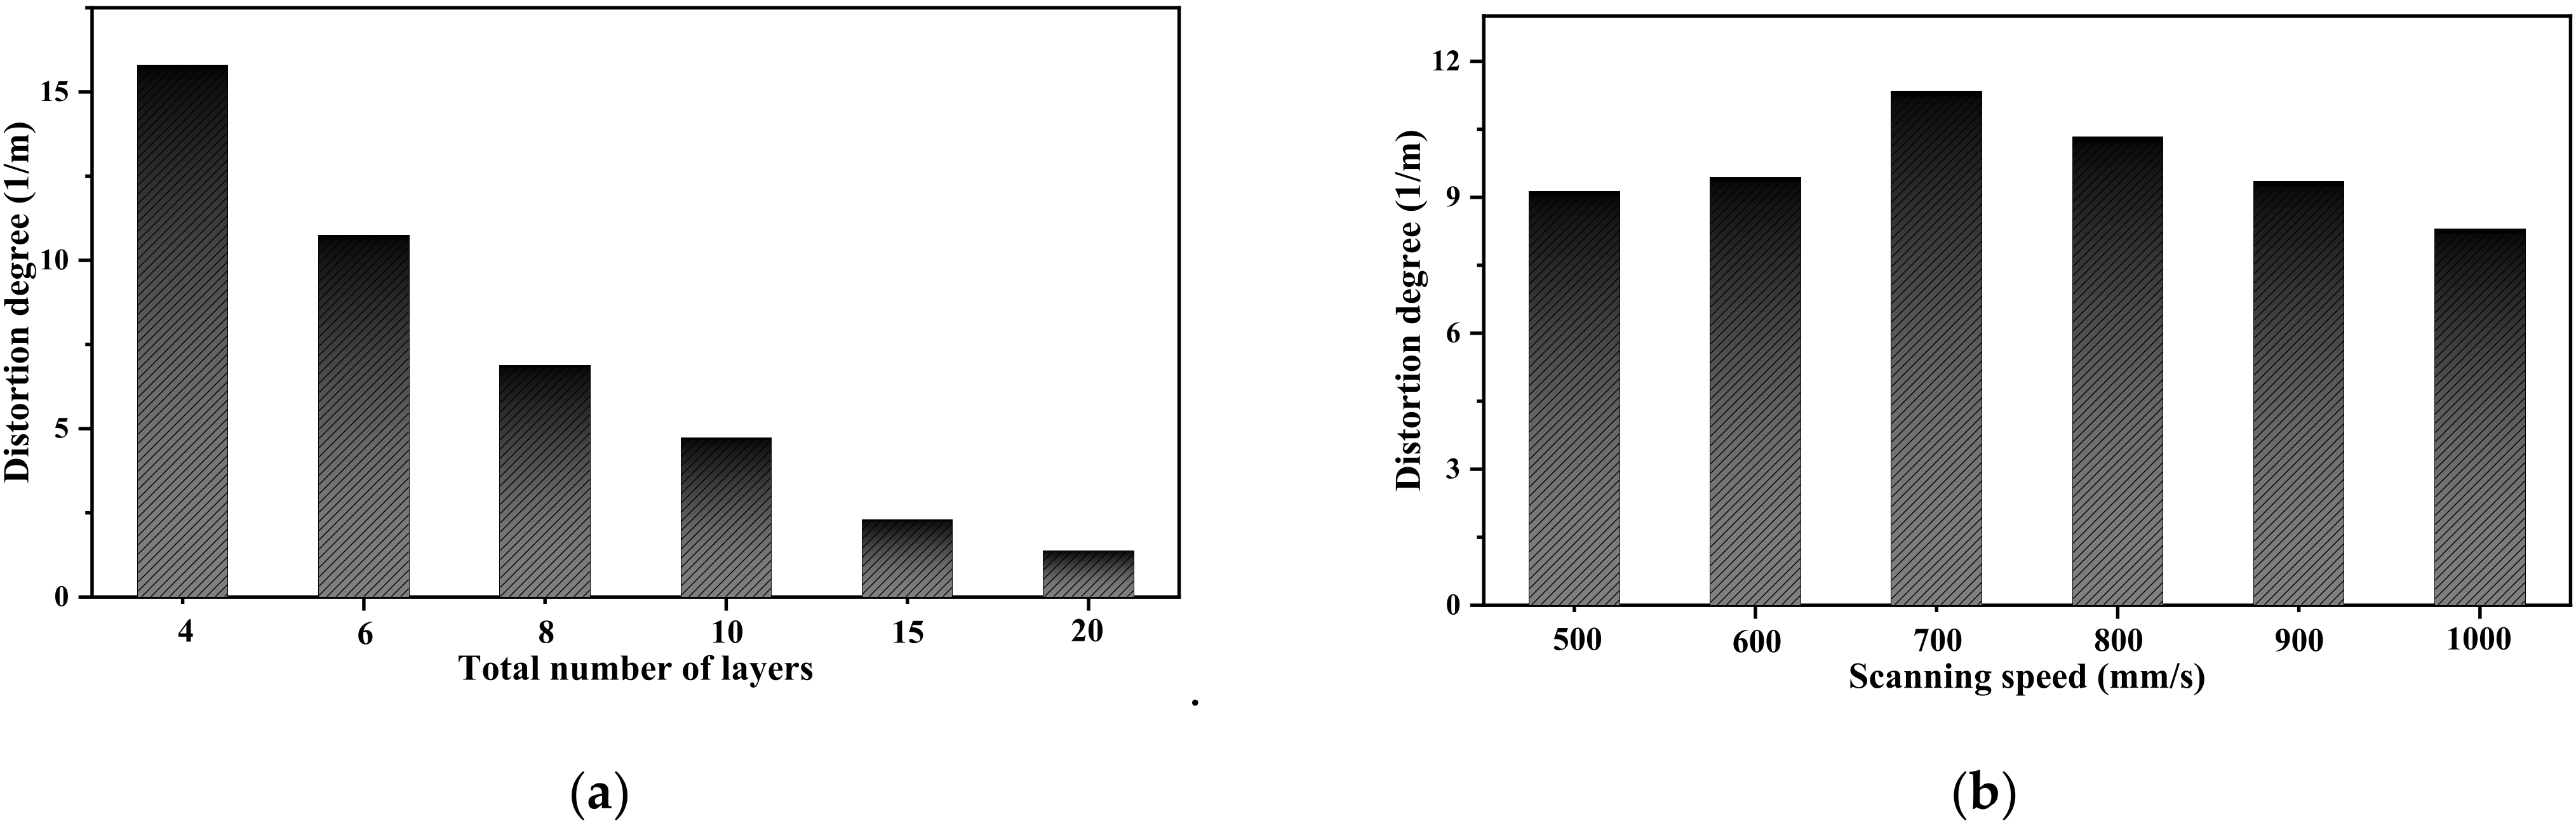
3.2. Number of Layers and Scanning Speed

Figure 6a shows the simulated distortions of the six components fabricated with different layers. As the number of layers increases, the distortion decreases. Figure 7 shows the residual stress distribution along the z-direction. The residual stress in a specific layer decreases as more layers are deposited. This is caused by the tightening effect of added layers on the deposited layers. In addition, the residual stresses in the top three layers are higher than that of the other layers, which plays a crucial role in component distortion. Since the layers adjacent to the newly added layer are affected by the laser heat, the constraining effect on the newly added layer is not strong. Therefore, a low plastic strain is formed in the newly added layer during the cooling stage, and the residual stress is relatively high after cooling down. Meanwhile, the plastic strain in the adjacent deposited layers increases, and the residual stress decreases due to the reheating effect. According to Equation (18), the distortion degree with different layers is obtained, as shown in Figure 8a. As the number of layers increases from four to twenty, the distortion degree decreases from 15.8 m−1 to 1.4 m−1. This is in good agreement with the simulation results (as shown in Figure 6a). Although the moment induced by axial stress increases with the number of layers, the moment of inertia has a greater increasing rate. It can be concluded that increasing the number of layers is beneficial to decrease the distortion.
Figure 6b shows distortions on the top layer of components fabricated with different scanning speeds. Since the scanning speed increases from 500 mm/s to 1000 mm/s, the distortion increases first and decreases after 700 mm/s. Figure 8b shows the distortion degree calculated according to Equation (18), with the same trend as the simulation result. The component fabricated with the scanning speed of 1000 mm/s has the minimum distortion degree.

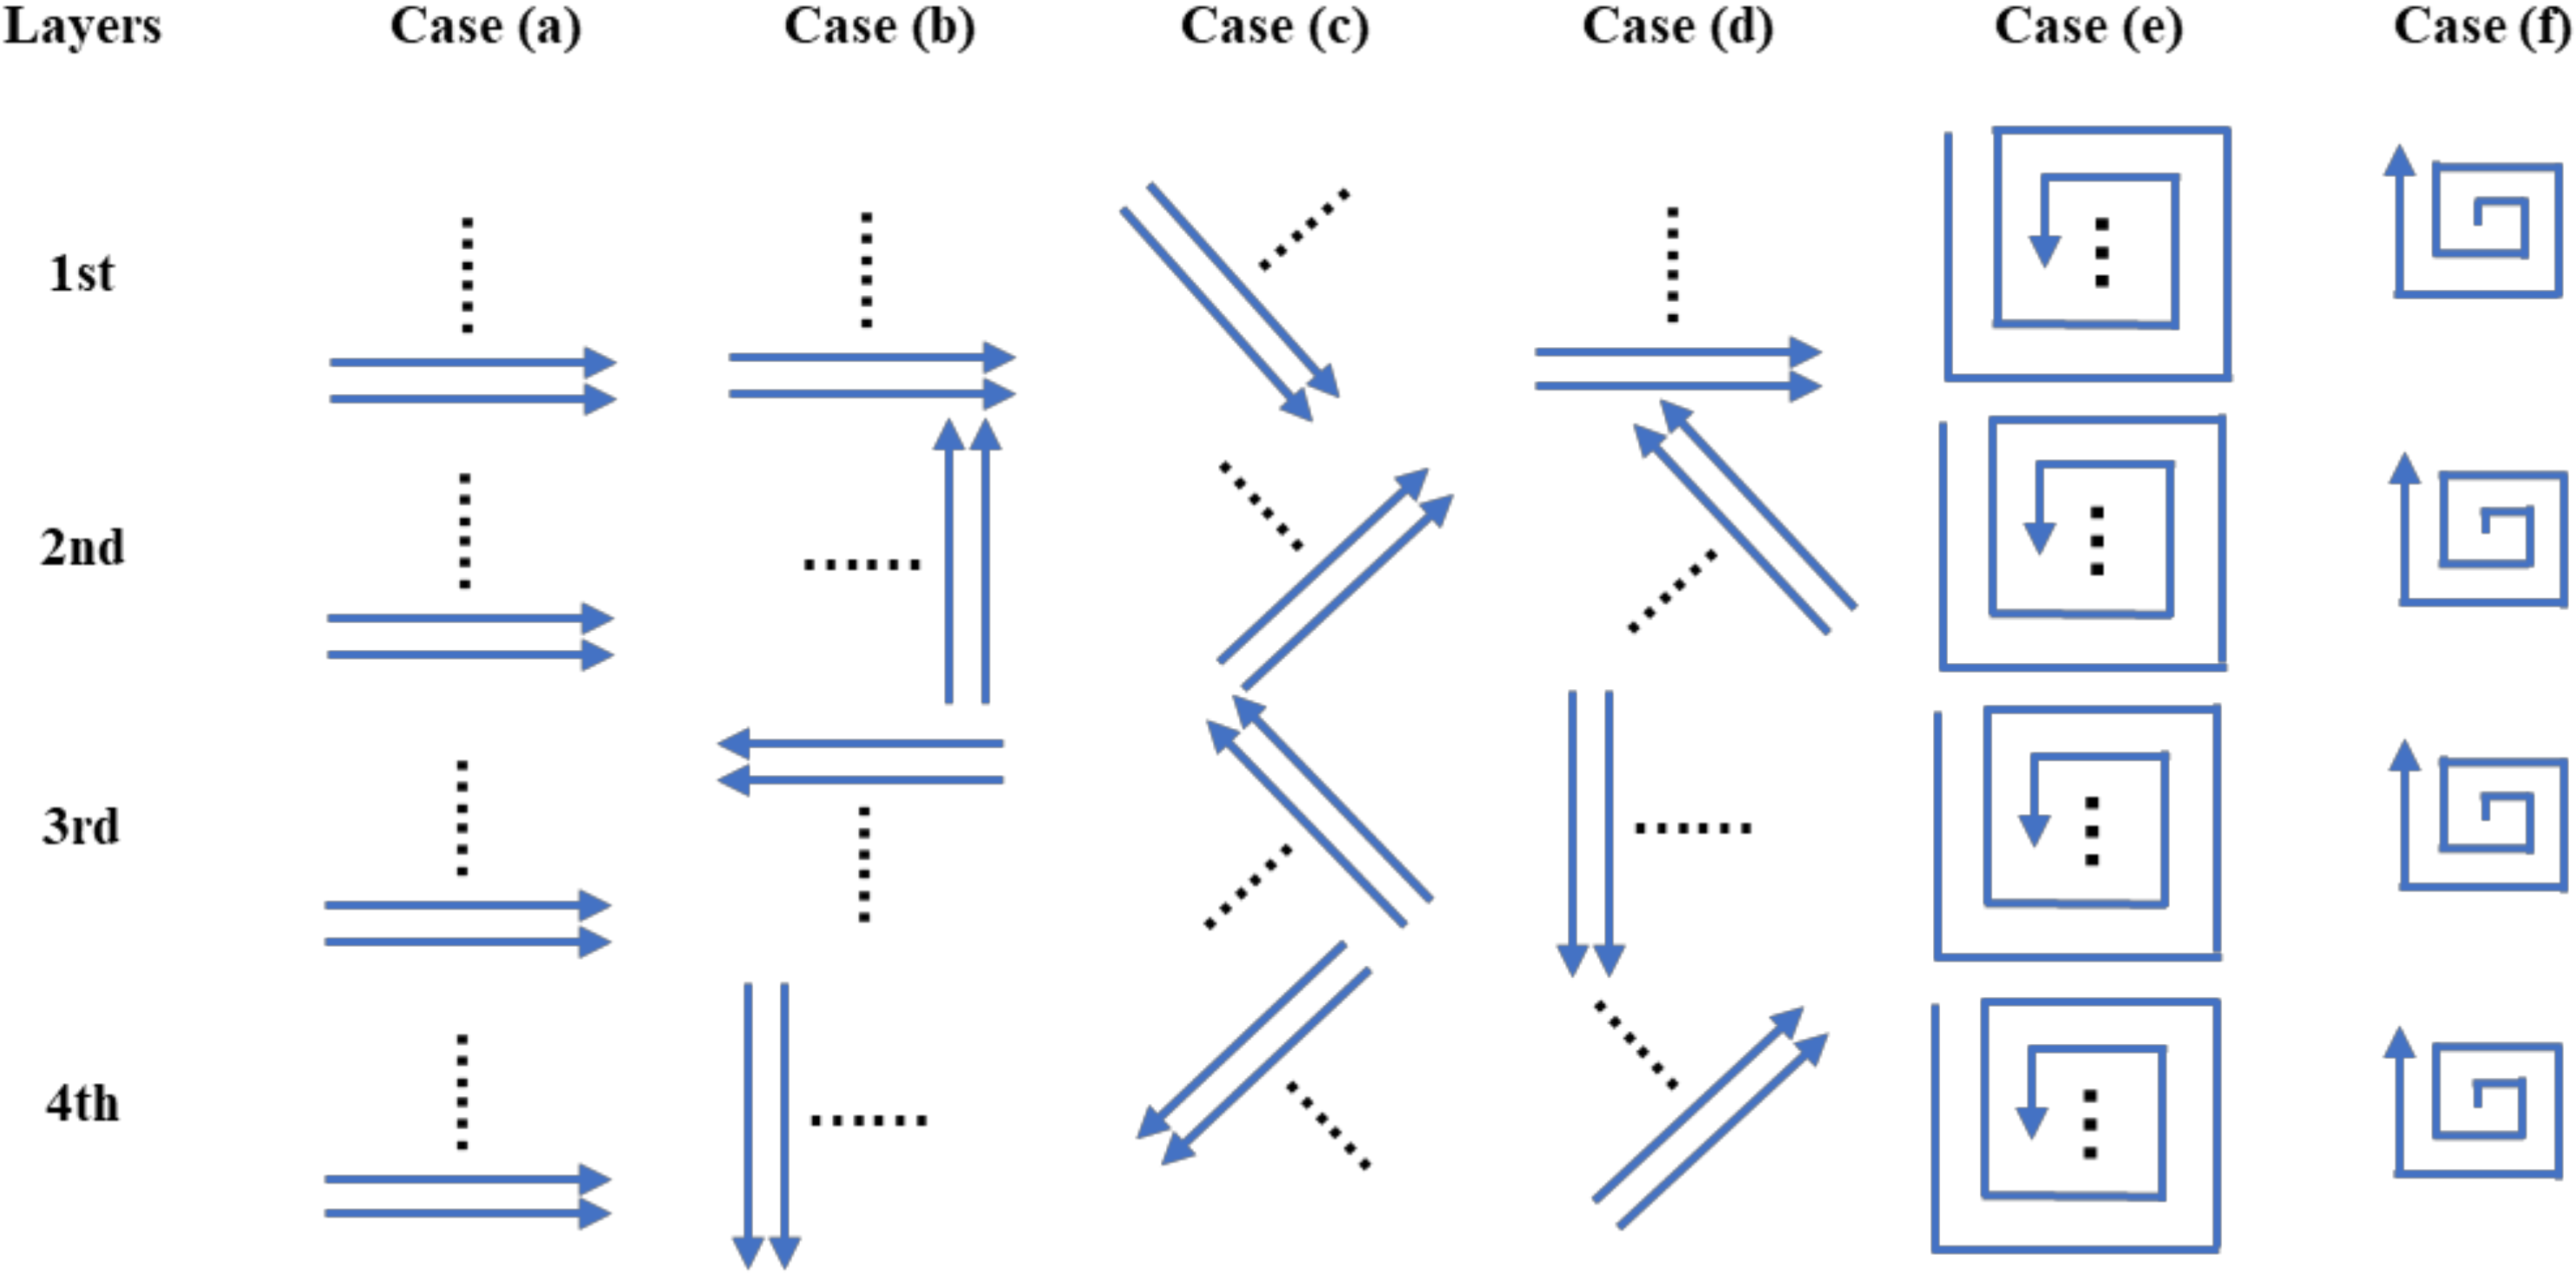
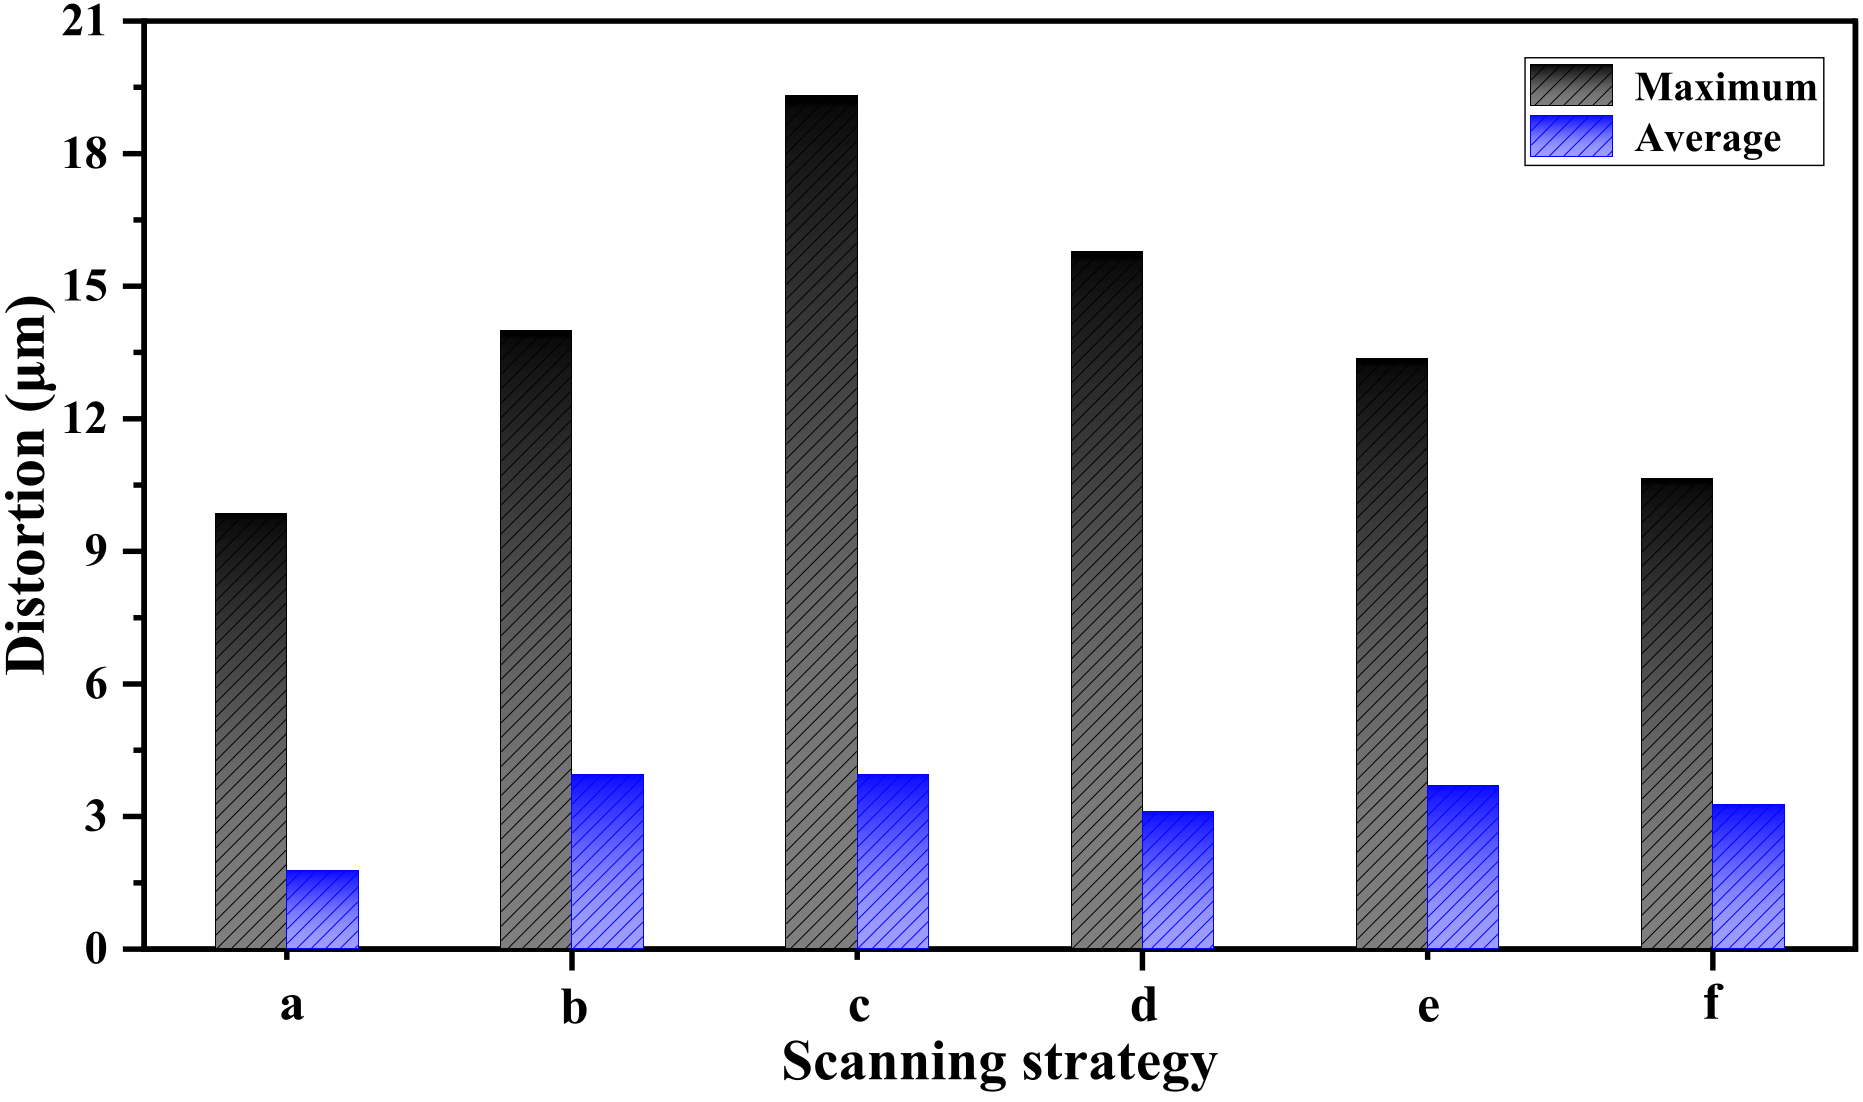
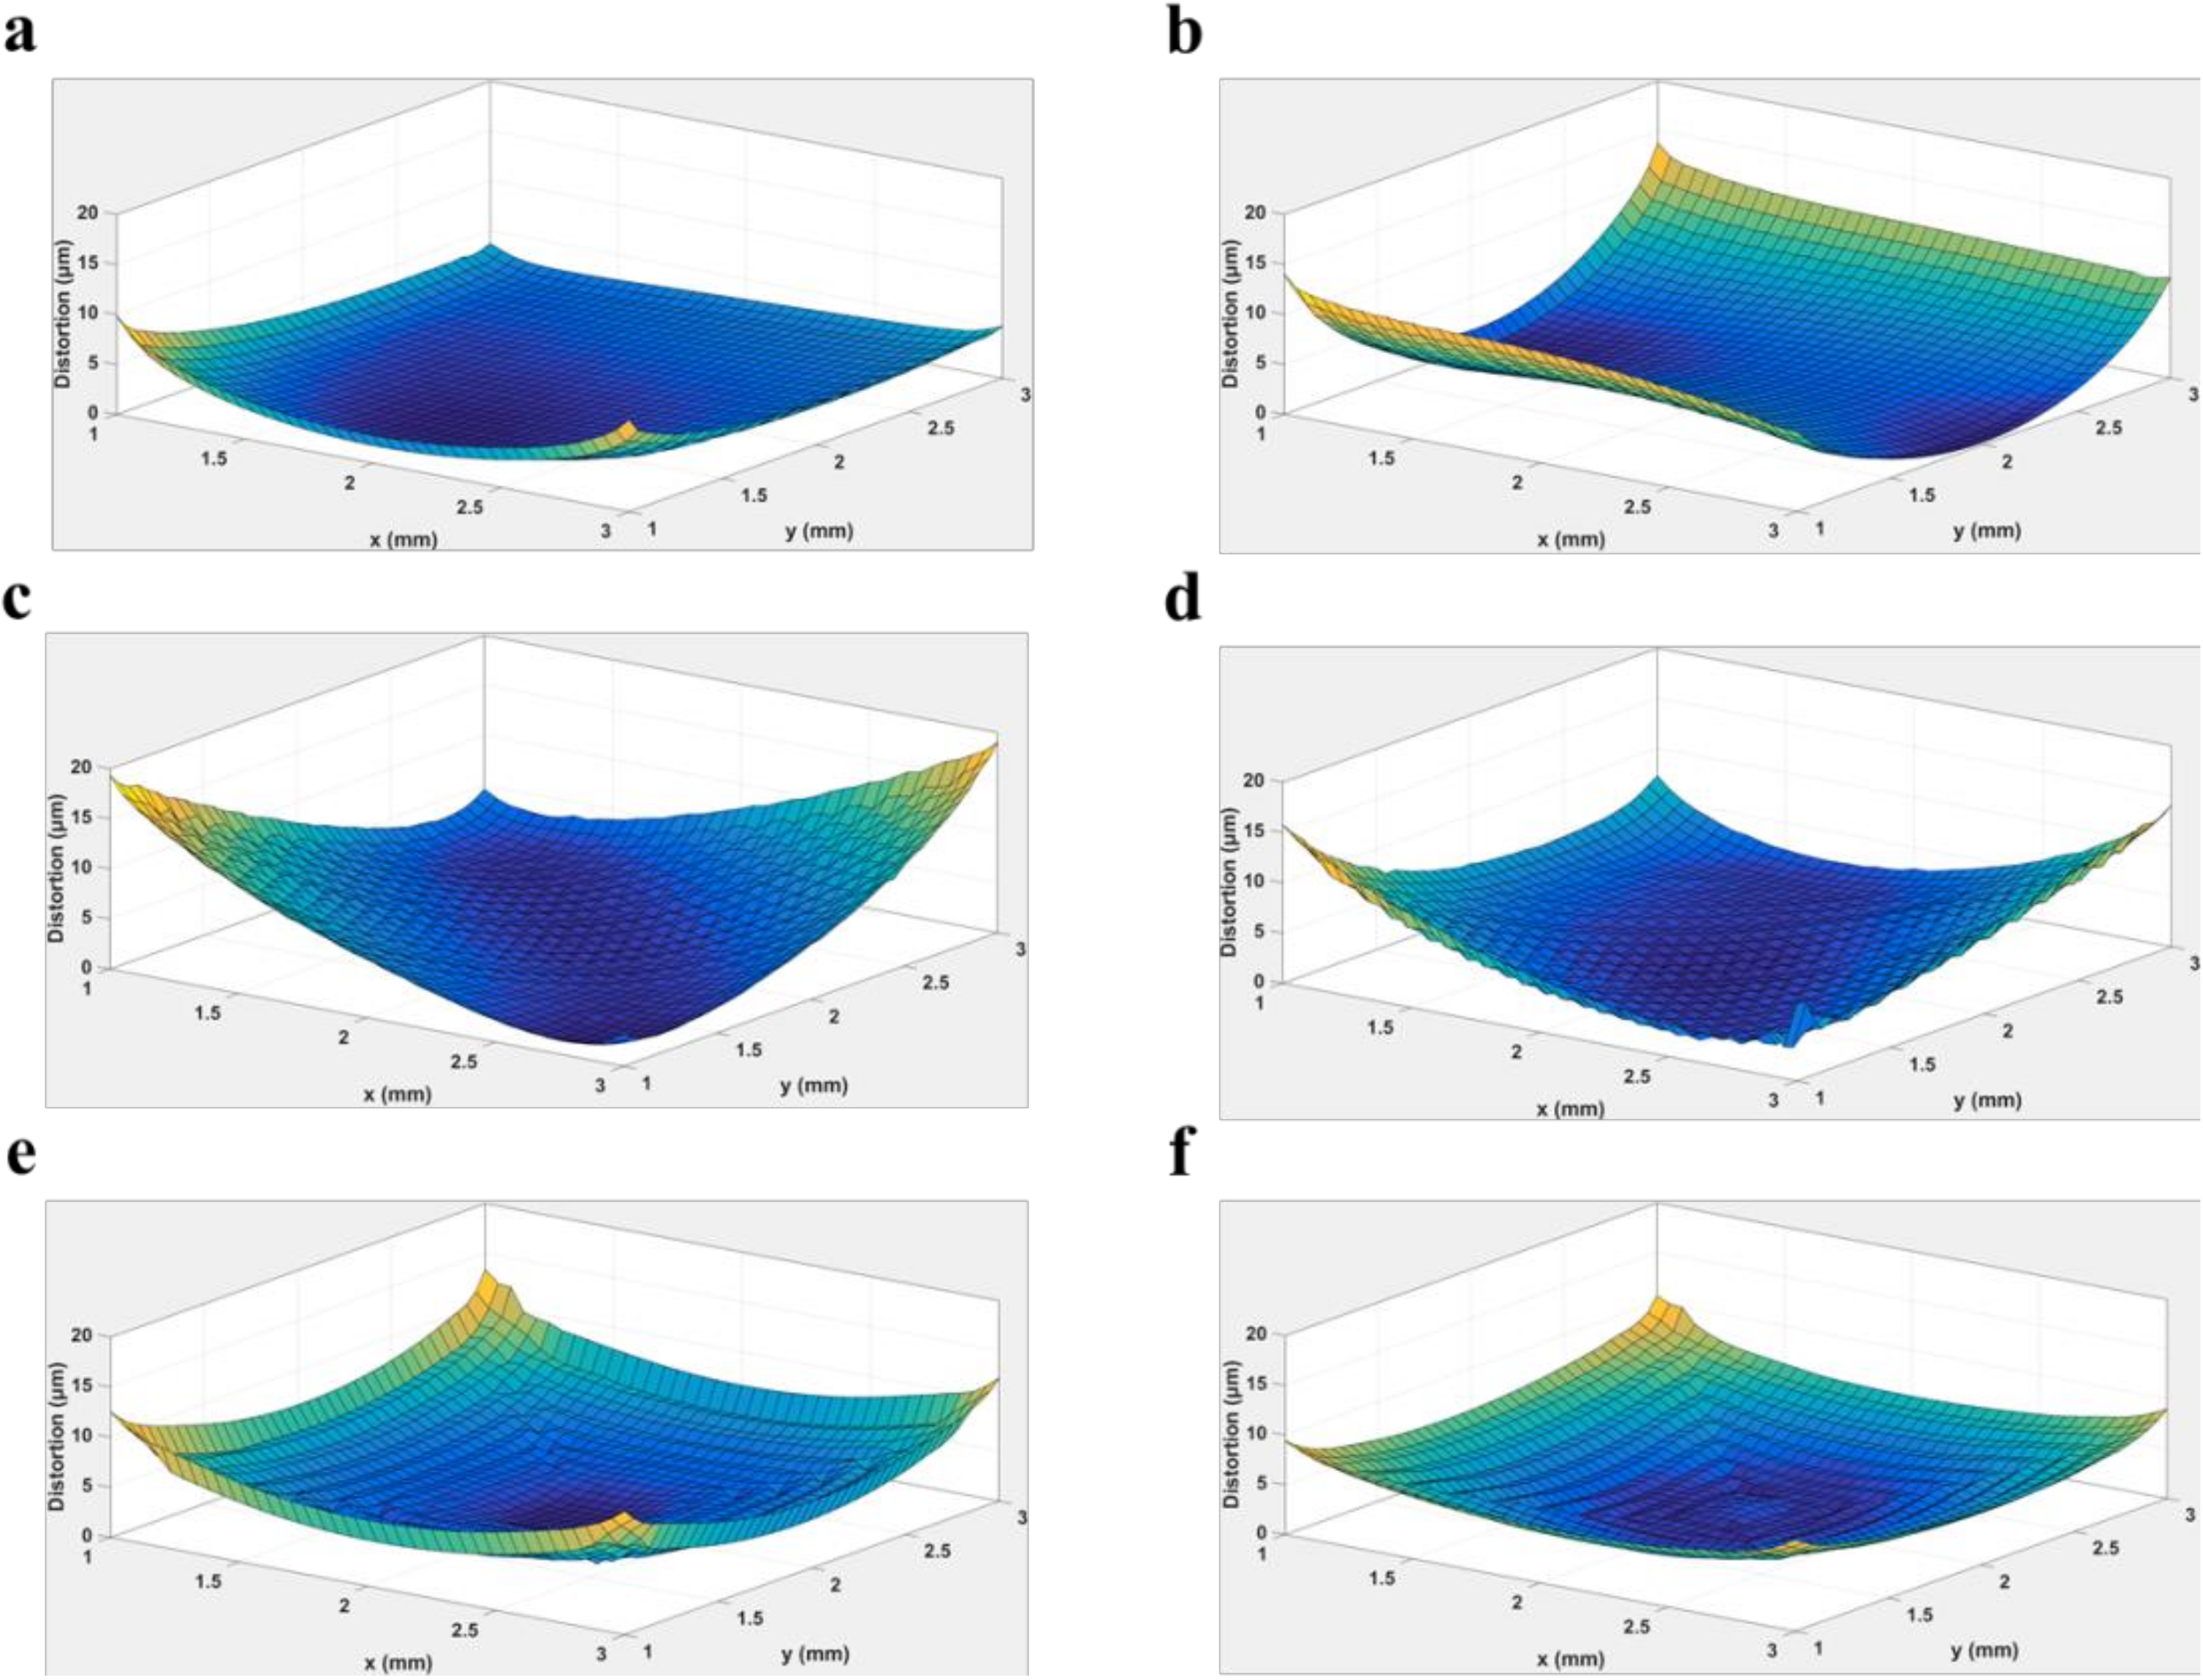
3.3. Stiffness of Support Structures and Scanning Strategy

Residual stress distributions of different components fabricated on support structures with column gaps ranging from 150 μm to 750 μm are shown in Figure 9. As the column gap increases, which decreases the stiffness of the support structures, the residual stress in each layer decreases. According to Equation (12), reducing the stiffness of the support structures is equivalent to reducing the value of EsAs, which increases the absolute value of the displacement. Then, the residual stress will be reduced correspondingly (refer to Equation (13)). However, the distortion degree continuously increases from 13.4 m−1 to 18.3 m−1 as the stiffness of the support structures decreases (shown in Figure 10). This is because the residual stress gradient in the building direction increases as the stiffness decreases. The simulated distortions, shown in Figure 11, present the same trend. It can be concluded that increasing the stiffness of the support structures is beneficial to reducing the distortion of the component.
Figure 12 shows the maximum and average distortion for different scanning strategies, and Figure 13 shows the distribution of distortions with different scanning strategies. Case (a) has the minimum distortion. This is because the scanning directions are consistent in Case (a). In addition, residual stress distributions in the x-direction and the y-direction are nearly the same among layers. This leads to a low residual stress gradient in the building direction. However, the distortion significantly increases when changing the scanning direction, such as Case (b). As shown in Figure 13b, the distortion is mainly distributed in the y-direction. Since the residual stress in the scan direction is relatively high [14], the residual stresses in the y-direction (along the scanning path) are much higher in the upper layers than in the lower layers, where the scanning direction is along the x-direction.
Conversely, the residual stress in the x-direction is less in the upper layers than in the lower layers. Thus, the distortion distribution along the x-direction is high in the middle and down at the ends. Distortions in Case (c) and Case (d) are higher than in other cases. This is because the residual stress rises as the scan length increases. Therefore, the maximum distortion is located in the 45° direction. In addition, the distortion in Case (d) is less than that in Case (c) due to the relatively small change in the scanning direction. The distortion distributions of Case (e) and Case (f) are similar, which are low in the center and high at the edges.

4. Discussion and Conclusions

In this study, a transient thermo-structural model is used to calculate the residual stress, plastic strain, and distortion in the SLM process. We propose a theoretical model considering displacements, plastic strains, and thermal strains to investigate the mechanism of distortion. Before removing the substrate, there is significant tensile stress in the component. The residual stress is released when the substrate is removed and the part shrinks. Meanwhile, the difference in axial residual stress (residual stress gradient) leads to distortion. The distortions of thin-walled and plate models, fabricated with different layers, scanning speeds, stiffness of support structures, and scanning strategies, are investigated. As the number of layers increases, the distortion significantly decreases. This is because as the height goes up, the increase rate of the moment of inertia is greater than the bending moment. The distortion degree increases slightly (from 9.13 to 11.3) with the scanning speed, reaches the maximum at 700 mm/s, and decreases (from 11.3 to 8.3). The scanning speed of 1000 mm/s results in the lowest distortion. As the stiffness of the support structures decreases, the distortion degree increases from 13.4 to 18.3. Therefore, increasing the stiffness of the support structures is beneficial to reducing the distortion. Since the scanning directions are consistent in Case (a), the residual stress distributions in the x-direction and the y-direction are nearly the same among layers. Therefore, Case (a) has the minimum distortion. Compared with Case (b), where scanning directions are changed among layers and the distortion is high, it can be indicated that changing the scanning direction among layers is useless to reduce the distortion. Case (c) deduces the maximum distortion where the maximum displacement in the vertical direction is 19.3 μm. This is because the scanning direction is at a 45° angle to the boundary, which is equivalent to extending the scan length. It can be indicated that long scan lengths should be avoided to reduce distortion.

Author Contributions

Conceptualization, S.Z. and X.X.; methodology, S.Z. and L.P.; software, S.Z. and C.X.; validation, S.Z., L.P., C.X. and X.X.; formal analysis, S.Z. and X.X.; investigation, S.Z. and L.P.; resources, S.Z. and X.X.; data curation, S.Z. and C.X.; writing—original draft preparation, S.Z. and X.X.; writ-ing—review and editing, S.Z., L.P., C.X. and X.X.; visualization, S.Z. and X.X.; supervision, S.Z., L.P., C.X. and X.X.; project administration, S.Z., L.P., C.X. and X.X.; funding acquisition, S.Z., L.P., C.X. and X.X. All authors have read and agreed to the published version of the manuscript.

Funding

This research received no external funding.

Acknowledgments

The first author, Sheng Zou, gives thanks to the financial assistance from the Fundamental Research Funds for the Central Universities of China (2016-JL-012).

Conflicts of Interest

The authors declare no conflict of interest.

References

  1. Xiao, X.; Waddell, C.; Hamilton, C.; Xiao, H. Quality Prediction and Control in Wire Arc Additive Manufacturing via Novel Machine Learning Framework. Micromachines 2022, 13, 137. [Google Scholar] [CrossRef]
  2. Xiao, X.; Xiao, H. Autonomous robotic feature-based freeform fabrication approach. Materials 2022, 15, 247. [Google Scholar] [CrossRef]
  3. Zhou, Y.H.; Wang, D.-W.; Song, L.-J.; Mukhtar, A.; Huang, D.-N.; Yang, C.; Yan, M. Effect of heat treatments on the microstructure and mechanical properties of Ti2AlNb intermetallic fabricated by selective laser melting. Mater. Sci. Eng. A 2021, 817, 141352. [Google Scholar] [CrossRef]
  4. Zhu, G.-L.; Pan, W.-T.; Wang, R.; Wang, D.-H.; Shu, D.; Zhang, L.; Dong, A.-P.; Sun, B.-D. Microstructures and mechanical properties of GTD222 superalloy fabricated by selective laser melting. Mater. Sci. Eng. A 2021, 807, 140668. [Google Scholar] [CrossRef]
  5. Shi, X.-Z.; Wang, H.-X.; Feng, W.-W.; Zhang, Y.-L.; Ma, S.-Y.; Wei, J. The crack and pore formation mechanism of Ti-47Al-2Cr-2Nb alloy fabricated by selective laser melting. Int. J. Refract. Met. Hard Mater. 2020, 91, 105247. [Google Scholar] [CrossRef]
  6. Wang, M.-S.; Liu, E.-W.; Du, Y.-L.; Liu, T.-T.; Liao, W.-H. Cracking mechanism and a novel strategy to eliminate cracks in TiAl alloy additively manufactured by selective laser melting. Scr. Mater. 2021, 204, 114151. [Google Scholar] [CrossRef]
  7. Tan, Z.-J.; Gao, S.; Lan, L.; He, B. Effect of Rescanning Strategy on Residual Stress and Distortion of Two Alloys Manufactured by Selective Laser Melting. J. Mater. Eng. Perform. 2021, 30, 6493–6501. [Google Scholar]
  8. Xie, D.-Q.; Lv, F.; Liang, H.-X.; Shen, L.-D.; Tian, Z.-J.; Zhao, J.-F.; Song, Y.-D.; Shuai, C.-J. Towards a comprehensive understanding of distortion in additive manufacturing based on assumption of constraining force. Virtual Phys. Prototyp. 2021, 16, 85–97. [Google Scholar] [CrossRef]
  9. Kruth, J.P.; Froyen, L.; Van Vaerenbergh, J.; Mercelis, P.; Rombouts, M.; Lauwers, B. Selective laser melting of iron-based powder. J. Mater. Process. Technol. 2004, 149, 616–622. [Google Scholar] [CrossRef]
  10. Mirkoohi, E.; Dobbs, J.R.; Liang, S.Y. Analytical mechanics modeling of in-process thermal stress distribution in metal additive manufacturing. J. Manuf. Process. 2020, 58, 41–54. [Google Scholar] [CrossRef]
  11. Promoppatum, P.; Yao, S.-C. Influence of scanning length and energy input on residual stress reduction in metal additive manufacturing: Numerical and experimental studies. J. Manuf. Process. 2020, 49, 247–259. [Google Scholar] [CrossRef]
  12. Ning, J.-Q.; Sievers, D.E.; Garmestani, H.; Liang, S.Y. Analytical Thermal Modeling of Metal Additive Manufacturing by Heat Sink Solution. Materials 2019, 12, 2568. [Google Scholar] [CrossRef] [Green Version]
  13. Xie, D.-Q.; Zhao, J.-F.; Liang, H.-X.; Tian, Z.-J.; Shen, L.-D.; Xiao, M.; Ahsan, M.N.; Wang, C.-J. Assumption of Constraining Force to Explain Distortion in Laser Additive Manufacturing. Materials 2018, 11, 2327. [Google Scholar] [CrossRef] [Green Version]
  14. Li, C.; Liu, J.-F.; Fang, X.-Y.; Guo, Y.-B. Efficient predictive model of part distortion and residual stress in selective laser melting. Addit. Manuf. 2017, 17, 157–168. [Google Scholar] [CrossRef]
  15. Tawfik, S.M.; Nasr, M.N.A.; El Gamal, H.A. Finite element modelling for part distortion calculation in selective laser melting. Alex. Eng. J. 2018, 58, 67–74. [Google Scholar] [CrossRef]
  16. Afazov, S.; Denmark, W.A.D.; Toralles, B.L.; Holloway, A.; Yaghi, A. Distortion prediction and compensation in selective laser melting. Addit. Manuf. 2017, 17, 15–22. [Google Scholar] [CrossRef]
  17. Song, X.; Feih, S.; Zhai, W.; Sun, C.-N.; Li, F.; Maiti, R.; Wei, J.; Yang, Y.-Z.; Oancea, V.; Brandt, L.R.; et al. Advances in additive manufacturing process simulation: Residual stresses and distortion predictions in complex metallic components. Mater. Des. 2020, 193, 108779. [Google Scholar] [CrossRef]
  18. Biegler, M.; Graf, B.; Rethmeier, M. In-situ distortions in LMD additive manufacturing walls can be measured with digital image correlation and predicted using numerical simulations. Addit. Manuf. 2018, 20, 101–110. [Google Scholar] [CrossRef]
  19. Mugwagwa, L.; Yadroitsev, I.; Matope, S. Effect of Process Parameters on Residual Stresses, Distortions, and Porosity in Selective Laser Melting of Maraging Steel 300. Metals 2019, 9, 1042. [Google Scholar] [CrossRef] [Green Version]
  20. Zhang, Y.; Zhang, J. Finite element simulation and experimental validation of distortion and cracking failure phenomena in direct metal laser sintering fabricated component. Addit. Manuf. 2017, 16, 49–57. [Google Scholar] [CrossRef] [Green Version]
  21. Yan, H.; Shen, L.-D.; Wang, X.; Tian, Z.-J.; Xu, G.-J.; Xie, D.-Q.; Liang, H.-X. Stress and deformation evaluation of the subarea scanning effect in direct laser-deposited Ti-6Al-4V. Int. J. Adv. Manuf. Technol. 2018, 97, 915–926. [Google Scholar] [CrossRef]
  22. Cao, J.; Gharghouri, M.A.; Nash, P. Finite-element analysis and experimental validation of thermal residual stress and distortion in electron beam additive manufactured Ti-6Al-4V build plates. J. Mater. Process. Technol. 2016, 237, 409–419. [Google Scholar] [CrossRef]
  23. Zou, S.; Xiao, H.-B.; Ye, F.-P.; Li, Z.-C.; Tang, W.-Z.; Zhu, F.; Chen, C.-T.; Zhu, C. Numerical analysis of the effect of the scan strategy on the residual stress in the multi-laser selective laser melting. Results Phys. 2020, 16, 103005. [Google Scholar] [CrossRef]
  24. Zhang, L.-C.; Chen, L.-Y. A Review on Biomedical Titanium Alloys: Recent Progress and Prospect. Adv. Eng. Mater. 2019, 21, 1801215. [Google Scholar] [CrossRef] [Green Version]
  25. Zhang, T.; Li, H.; Liu, S.; Shen, S.-N.; Xie, H.-M.; Shi, W.-X.; Zhang, G.-Q.; Shen, B.-N.; Chen, L.-W.; Xiao, B.; et al. Evolution of molten pool during selective laser melting of Ti-6Al-4V. J. Phys. D-Appl. Phys. 2019, 52, 055302. [Google Scholar] [CrossRef]
  26. Parry, L.; Ashcroft, I.A.; Wildman, R.D. Understanding the effect of laser scan strategy on residual stress in selective laser melting through thermo-mechanical simulation. Addit. Manuf. 2016, 12, 1–15. [Google Scholar] [CrossRef] [Green Version]
  27. Cheng, B.; Shrestha, S.; Chou, K. Stress and deformation evaluations of scanning strategy effect in selective laser melting. Addit. Manuf. 2016, 12, 240–251. [Google Scholar]
  28. Chen, C.-P.; Yin, J.; Zhu, H.-H.; Xiao, Z.-X.; Zhang, L.; Zeng, X.-Y. Effect of overlap rate and pattern on residual stress in selective laser melting. Int. J. Mach. Tools Manuf. 2019, 145, 103433. [Google Scholar] [CrossRef]
Figure 1. Simulation models: (a) the thin-walled model with twenty layers; (b) the thin-walled model with the columnar support structures; (c) the plate model.
Applsci 12 01567 g001
Figure 2. The schematic diagram of scanning strategies: Case (a) is the unidirectional scanning; Case (b) has 90° rotation angles; Case (c) is the 45° inclined scanning with 90° rotation angles; Case (d) has 45° rotation angles; Case (e) is the out–in scanning; Case (f) is the in–out scanning.
Applsci 12 01567 g002
Figure 3. The longitudinal residual stress distribution before and after removing the substrate.
Applsci 12 01567 g003
Figure 4. The schematic diagram of the SLM process.
Applsci 12 01567 g004
Figure 5. The residual stress comparisons between the analytical model and the simulation: (a) before removing the substrate; (b) after removing the substrate.
Applsci 12 01567 g005
Figure 6. Distortions along the x-direction: (a) components fabricated with different layers; (b) components fabricated with different scanning speeds.
Applsci 12 01567 g006
Figure 7. Residual stress distributions along the vertical direction of components fabricated with different layers.
Applsci 12 01567 g007
Figure 8. The distortion degree of the component with different (a) number of layers and (b) scanning speed.
Applsci 12 01567 g008
Figure 9. Residual stress distributions along the vertical direction of components with different column gaps in support structures.
Applsci 12 01567 g009
Figure 10. The distortion degree of the component with different support structures stiffness.
Applsci 12 01567 g010
Figure 11. The distortion of the component with different support structures stiffness.
Applsci 12 01567 g011
Figure 12. The maximum distortions and average distortions of components fabricated with different scanning strategies.
Applsci 12 01567 g012
Figure 13. The distribution of distortions with different scanning strategies. Case (a) is the unidirectional scanning; Case (b) has 90° rotation angles; Case (c) is the 45° inclined scanning with 90° rotation angles; Case (d) has 45° rotation angles; Case (e) is the out–in scanning; Case (f) is the in–out scanning.
Applsci 12 01567 g013
Table 1. Thermal properties of Ti-6Al-4V (data is obtained from Reference [25]).
Property (Unit)Value
Latent heat ΔH (J·kg−1)2.86 × 10⁵
Density ρ (kg·m−3) 4420 0.15   ( T 296 ) T < 1923   K   3920 0.68   ( T 1923 ) T 1923   K
Specific heat cp (J·kg−1·K−1) 483 + 0.22 T T 1268   K 413 + 0.18 T 1268   K < T 1923   K 831 T > 1923   K
Thermal conductivity kλ (W·m−1·K−1) 1.260 + 0.016 T T 1268   K 3.513 + 0.013 T 1268   K < T 1923   K 12.752 + 0.024 T T > 1923   K
Viscosity μ (N·m−1·s−1)exp(−1.6 + 5346/T) × 10−3
Table 2. Mechanical properties of Ti-6Al-4V (data is obtained from Reference [26]).
Temperature
(K)
Thermal Expansion Coefficientαth (1/K)Elastic Modulus
E (GPa)
Yield Stress
σy (MPa)
Plastic Tangent Modulus
Hp (GPa)
2968.7812510000.7
3669.831106302.2
477101006302.2
58910.71005252.2
70011.1805001.9
81111.2744461.9
92211.7553001.9
103312.227452
114412.320252
136612.4552
192312.50.10.10.1
Table 3. Process parameters of the simulation (data is obtained from References [23,28]).
Parameters (Unit)Value
Layer thickness h (μm)40
Porosity ϕ0.48
Laser power P (W)200
Laser radius r0 (μm)75
Hatch space dh (μm)100
Scanning speed v (mm/s)500, 600, 700, 800, 900, 1000
Dwelling time between layers td (s)8
Ambient temperature T (K)300
Publisher’s Note: MDPI stays neutral with regard to jurisdictional claims in published maps and institutional affiliations.

