1. Introduction
The measurement of ice adhesion to surfaces is highly relevant for developers of icephobic materials that aim to reduce ice adhesion to an extent, at which only low energy is required to remove this ice. These so-called low ice adhesion surfaces would benefit many technical applications, such as in the energy and transport sector.
Many different test methods have been developed over the past few decades to assess this functionality, addressing different complexity levels, ice types, and ice removal techniques. An extensive review on these methods is given by Work and Lian, with the aim to compare the different test designs with the needs for aircraft-relevant icing conditions. It included the centrifuge test as one of the most prominent methods for ice adhesion assessments, highlighting the benefit (throughput) but also the drawbacks (e.g., missing strain rate control, edge effects, and vibration) [
1]. Despite these drawbacks, the centrifuge tests used for ice adhesion measurements appeared to be robust, easy to handle, and relatively accessible test devices that deliver reproducible results in a reasonable time [
2,
3,
4,
5,
6,
7,
8]. They are generally used in a comparative manner, using reference or benchmark surfaces (e.g., aluminum, steel, unmodified coatings) to identify improvements (reduced ice adhesion) for the new developed materials. The tests support the iterative formulation work on low ice adhesion surfaces and allow the selection of promising candidates. As a tool for the initial assessments, they do not address the performance prediction in the target technical environment. In this study, the centrifuge test is also used for the assessment of relevant test parameters and influential surface properties.
Work and Lian used available test results from the literature to identify parameter correlations [
1]. The first trend they observed is that the ice adhesion strength increases with decreasing temperatures, regardless of the used test method. The second raised aspect covers the effects of velocity (and resulting ice type). Derived from literature data, they identified a decrease in the maximum observed adhesion values for impact ice (accreted at different velocities) compared to static ice (formed by pouring water into a mold and freezing it) [
1]. Unfortunately, the data consistency was rather poor, and the comparability of different test designs was limited. To account for this, in this study, we addressed the effects of the velocity during the ice formation process in the ice adhesion centrifuge test. The gained knowledge will contribute to an improved understanding of the influencing test parameters, paving the way to harmonize test designs based on substantiated test data.
Besides the efforts on the development and definition of test designs for ice adhesion, many research activities are dealing with the understanding of the required surface characteristics to achieve low ice adhesion surfaces.
Table 1 summarizes studies on the correlations between surface properties and ice adhesion test results, derived from centrifuge tests. The ice formation type is also indicated as one determining parameter of ice adhesion test results.
The papers summarized in
Table 1 mainly addressed material properties, such as the surface roughness and wettability, which are also covered in the current study. The surfaces used for the current study had to fulfil two main requirements: first, a high surface robustness (mechanical, chemical) to guarantee high repeatability of the tests without performance degradation; and second, a range of surface properties from rough to smooth and good to poor water wettability to assess the effects of the surface properties on the ice adhesion test results.
With this study, we aimed to provide data for the effects of ice types on the results of the ice adhesion centrifuge test. We also investigated a relevant range of surface properties to clarify the impact of the roughness and surface wettability on the measured ice adhesion strength. With these topics, we offer an improved understanding of the needs for ice adhesion test procedures that can be used for necessary harmonization and standardization activities.
2. Materials and Methods
Material selection for this study was based on the results of a pre-screening process to identify robust and long-lasting surfaces that deliver reproducible results over the complete duration of tests. The preparation of test samples was performed in a single process with identical material batches to avoid deviations due to changes in the material composition, handling, or environmental conditions. Test samples (EN AW 5083, dimension 220 × 30 × 4 mm
3 for IFAM centrifuge tests) were sanded and cleaned with isopropanol prior to material application. For the first coating type, “Primer”, an epoxy primer (Aerodur 37045 Barrier Primer White with Hardener S66/22R; Akzo Nobel, Sassenheim, The Netherlands), was used in a mixing ratio of 2:1 by volume. Material preparation and application were performed according to the supplier’s specifications using a spray gun (SATA Jet 90, Ø 1.3 mm; pressure 1.6 Bar; distance 40 cm) under standard conditions (temperature 21 °C, relative humidity 40%). After the coating application, samples were stored at room temperature in a clean environment for 12 h prior to thermal curing at 60 °C for 60 min. The resulting dry film thickness of the primer was 40 ± 10 µm (according to DIN EN ISO 2808:2019 with byko-test 8500 P Fe/NFe, Byk Gardner, Geretsried, Germany) [
18].
The second coating type, “Standox”, is a clear coat that is used for repair purposes in the automotive industry. It was applied on the primer coating (described above) to ensure sufficient adhesion properties. Standocryl VOC-Premium Clear K9540 with Hardener VOC 10–20 was purchased (Standox GmbH, Wuppertal, Germany) and material preparation was performed according to the supplier’s specifications at a mixing ratio of 3:1 (by volume). The application and curing parameters were identical to those of the primer coating. The same conditions were applied to the third coating type, “PUR C25”, which is a non-commercial 2-component formulation based on silanized polyisocyanate-curing acrylic resin, as described in [
16]. The material was selected as a potential icephobic material and was applied on the primer coating. The total film thickness (including primer) for the samples Standox and PUR C25 was 70 ± 15 µm [
18]. The fourth material in this study was “PTFE-tape” (extruded polytetrafluoroethylene PTFE film tape 5490; 3M Deutschland GmbH, Neuss, Germany), which was applied on primed test samples according to the supplier’s specifications. The film thickness of the tape was 90 µm.
All selected materials in the pre-tests showed sufficient mechanical and chemical resistance with no changes in the basic surface properties prior to and after repeated cleaning with isopropanol or during icing/de-icing cycles. Wettability tests were performed with the Drop Shape Analyzer DSA 100S (Krüss GmbH, Hamburg, Germany), according to relevant specifications (DIN EN ISO 19403-2) [
19]. Surface free energy (SFE) was determined by measuring the dynamic contact angle of three liquids: water, diiodomethane, and ethylene glycol (droplet application of 0.2 µL/s, total volume of 6.0 µL), and calculated according to the method of Owens, Wendt, Rabel, and Kaelble (OWRK). The water contact angle (WCA) was extracted from this measurement. The water sliding angle (WSA) was determined with a water droplet volume of 20 µL and tilting speed of 60 °/min. The sliding angle was defined as the angle at which the advancing and receding angles of the water droplet moved at least 1 mm from the starting point [
20]. Contact angle hysteresis (CAH) was determined at this sliding angle or at the maximum tilting angle of 90° (in the case where the water droplet did not run off) by calculating the difference between advancing and receding angles. The tilting method was chosen as it delivers consistent results for fresh and aged coating surfaces. Roughness data R
a (arithmetic average value of the roughness profile) and R
z (maximum height of the profile) were determined using a Perthometer M2 (Mahr GmbH, Göttingen, Germany).
The four selected materials represent a reasonable range of wettability and roughness properties (from smooth to rough and hydrophilic to hydrophobic). Surface parameters are expressed in
Table 2 as the means of 6 measurements from 3 test samples.
Tests started 21 days after coating application, at the earliest. Prior to each test, samples were cleaned using isopropanol and soft tissue. Between the tests, samples were stored in a dry and dark environment at room temperature.
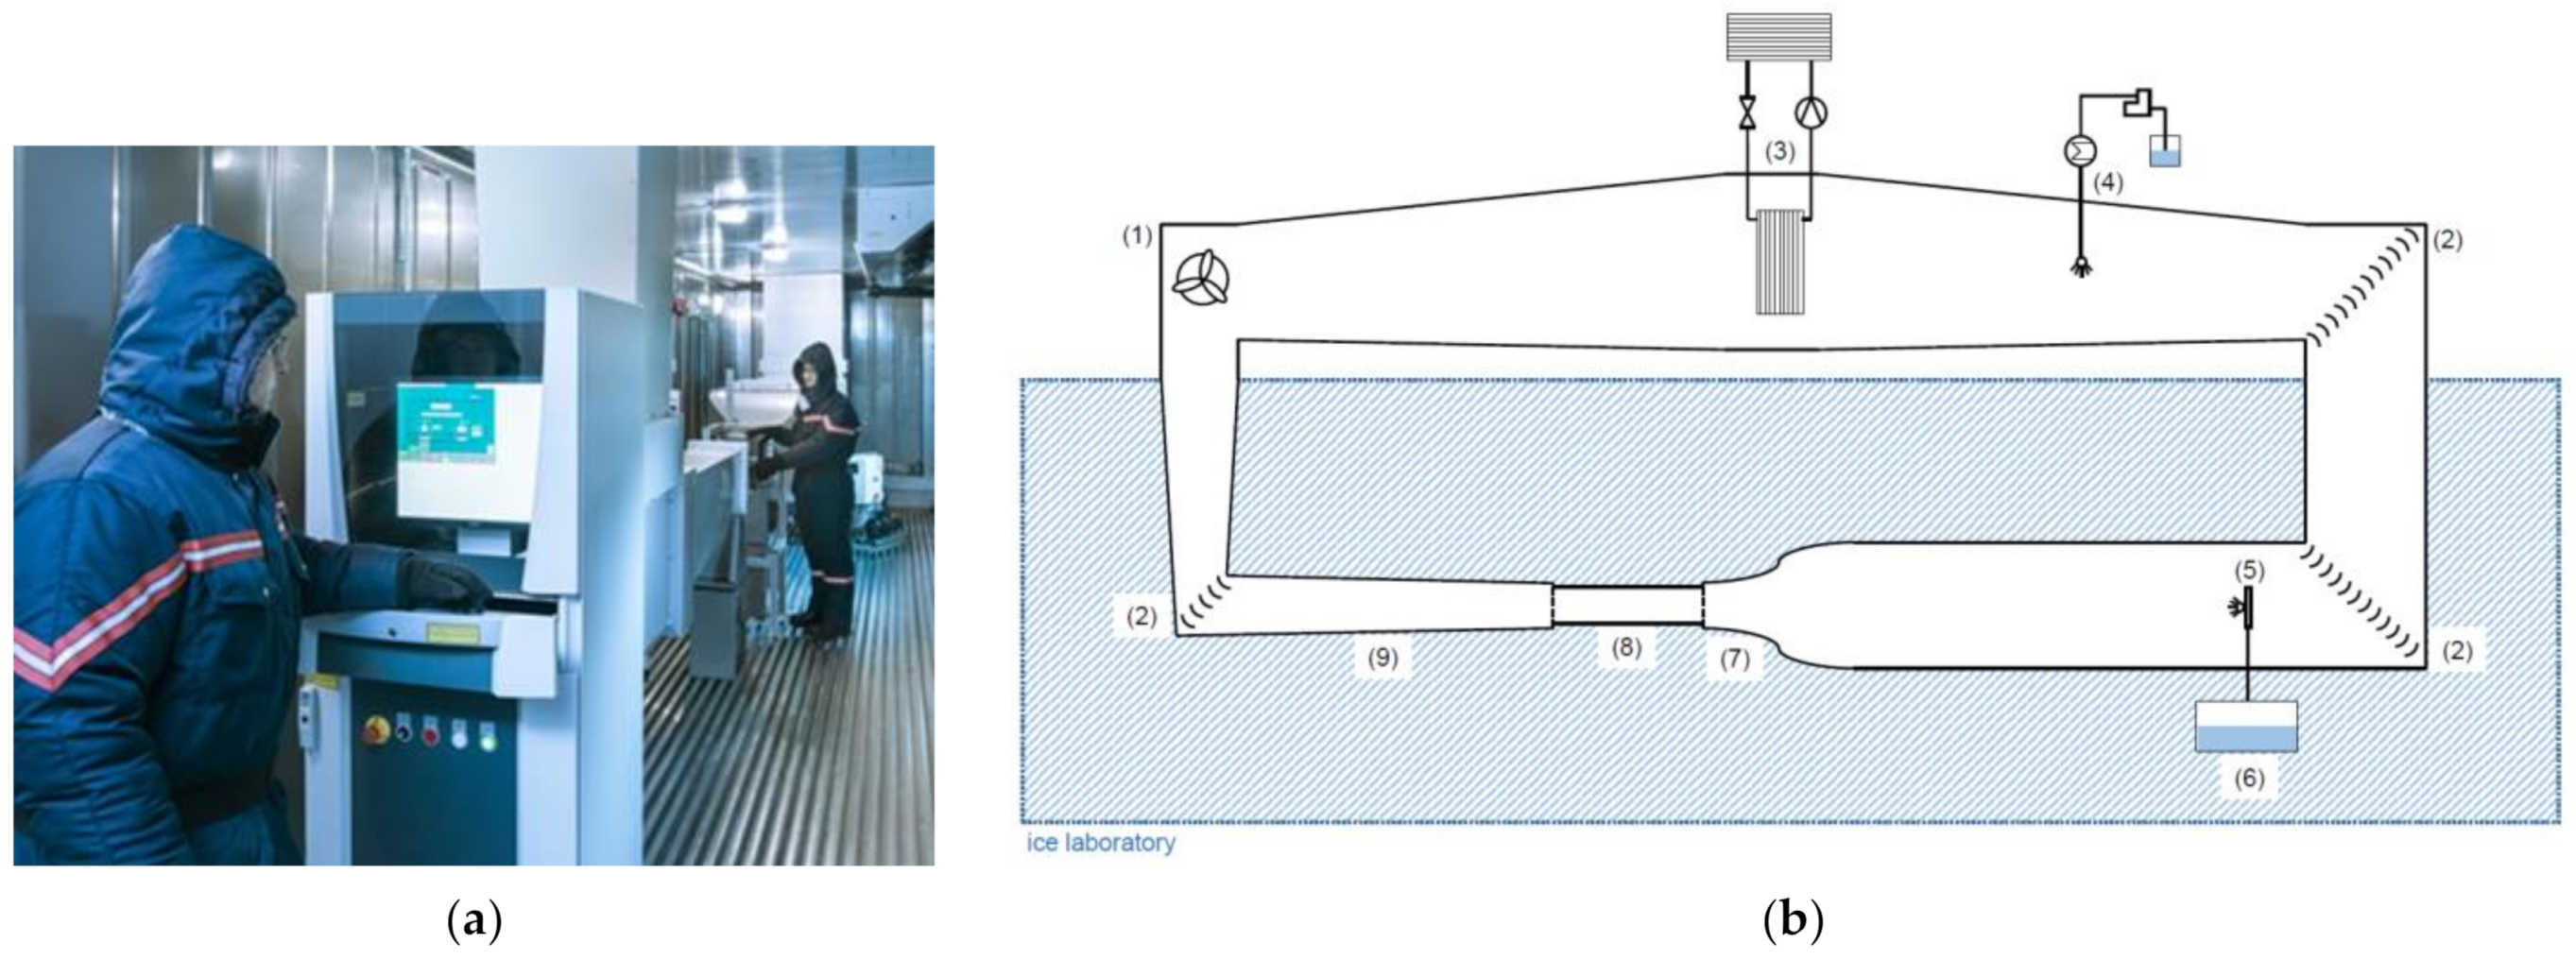
Ice adhesion centrifuge tests were conducted in the Fraunhofer IFAM ice lab with an integrated ice wind tunnel (
Figure 1). The ambient temperature during the ice formation and adhesion tests was kept constant at −8 °C. This temperature was selected as it is low enough to prevent unstable icing conditions (these may occur close to 0 °C). Additionally, at −8 °C, different ice types can form in the ice wind tunnel, depending on the air velocity. Prior to the ice formation process, test samples were pre-conditioned to this test temperature. Four different scenarios were defined for the assessment of the ice adhesion depending on the ice types and velocities (
Table 3).
Static ice was produced by inserting each test sample into a silicone mold that allowed defined ice formation in the required area (
Figure 2a). Three milliliters of de-ionized water were filled into the mold and allowed to freeze onto the test surface. After 90 min, the silicone mold was removed, and the sample was stored for a minimum of 15 min at the test temperature without any mechanical disturbance prior to the installation into the centrifuge.
For impact ice, the pre-conditioned test sample was mounted onto a custom-made sample holder that allowed the positioning of the test surface in the center of the ice wind tunnel test section for a defined time (
Figure 2b). After impact ice formation, the sample was removed from the ice wind tunnel and kept in the specimen holder for 10 min at a constant temperature of −8 °C. After disassembly from the specimen holder, the test sample was stored for an additional five minutes prior to the installation in the centrifuge for testing of the ice adhesion.
The four icing scenarios resulted in the formation of different ice types and shapes (
Table 4). For static ice, compact glaze ice was produced in a well-defined area. Impact ice that was produced at 40 and 60 m/s also appeared as clear glaze ice but with a rough surface. Water droplets in the ice wind tunnel section hit the surface and were frozen at the test surface rather instantly. However, the following water droplets could run over this first icing layer before freezing, resulting in ice formations also at the test sample sides (also covered with the test materials). This phenomenon was not observed for impact ice accreted at a 95 m/s wind tunnel velocity. Short freezing times led to ice growth towards the wind direction instead of ice formations at the sample sides. The ice started to develop a milky appearance and was defined as mixed ice (mixture of glaze and rime ice).
For ice adhesion tests, a custom-made centrifuge with a modified rotor to place and fasten the prepared test samples was used as already described elsewhere [
16]. Opposite the ice is a counterweight that can be adjusted, according to the ice mass, to reduce vibrations (see
Figure 3). Generally, the centrifuge test uses centripetal forces to apply shear stress to the ice and remove it from the test surface. The prepared sample was fixed in the centrifuge, in which the iced sample was spun at a constantly increasing rate until the ice was sheared off. Separation was detected by a piezoelectric cell (MTN/1185C Series, Monitran Ltd., Penn, UK) when the ice hit the centrifuge wall and was correlated to the rotational speed of the centrifuge rotor. This speed (angular velocity
ω in rad/s) was used to calculate the shear strength of ice to the substrate, according to the following equation:
where
mice is the mass of ice (kg),
r is the radius of the rotating beam at the mid-length ice position (m), and
A is the surface area of the adherent interface (m
2) [
21]. The calculated values in this study express the adhesive strength of the ice.
In addition to the ice types, the centrifuge acceleration speed varied from 100 rpm/s (10.472 rad/s
2) and 200 rpm/s (20.944 rad/s
2) to 300 rpm/s (31.416 rad/s
2) for the static ice test samples.
Figure 4a shows the device-specific force evolutions during the test runs with different acceleration speeds up to the maximum centrifuge rotational speed (10,000 rpm) for an ice mass of 3 g. For 300 rpm/s, the maximum speed was reached after 34 s, and for 100 rpm/s, after 100 s. Furthermore, the differences that occurred between the ice masses for impact ice (compared with
Table 3) also have an effect on the strength evolution during the centrifuge test.
Figure 4b depicts the correlations between the ice masses and adhesion strength for an acceleration speed of 200 rpm/s that was used for impact ice adhesion assessments in this study.
Four to eight test samples per material type were available for the testing period and used randomly over the whole duration of this study with changing ice types and centrifuge acceleration speeds.
3. Results
The results of this study are displayed in the following subsections according to the main questions this study focused on. These include the durability determination of the test surfaces as a pre-requisite for the result interpretation (
Section 3.1), detailed assessment of the gained data per scenario and material (
Section 3.2), result comparison for different ice types (
Section 3.3) and for different ice adhesion test parameter set-ups (
Section 3.4), and finally, the interdependencies between the surface properties and ice adhesion test results (
Section 3.5).
Quantitative ice adhesion results were derived from tests with 100% adhesive failure of the ice. This was observed for the materials Standox, PUR C25, and PTFE-tape. Partial detachment of the ice or even no ice shedding occurred for the primer coating in all test set-ups. The ice adhesion to the primer surface was higher than the maximum shear strength of the test (at a maximum centrifuge speed of 10,000 rpm: >231 kPa for 2 g of ice and >347 kPa for 3 g ice). This was evaluated as a qualitative result only.
For tests with static ice, one data point per test day and used sample was obtained. A maximum of 10 tests per day were conducted. For impact ice, a maximum of six samples per working day were tested in a twofold measurement. At least three independent test days per parameter set and material were conducted.
3.1. Durability of Test Surfaces
The materials used in this study were selected because of their expected durability to deliver reproducible results over the complete test period. Additionally, due to COVID-19-related restrictions regarding the presence of staff, the duration of this study had to be prolonged (200 days). To guarantee the comparability of the test results over the complete period, test set-ups for static ice (centrifuge acceleration speed: 200 rpm/s) and impact ice (95 m/s; centrifuge acceleration speed: 200 rpm/s) were conducted repeatedly. The results of the ice adhesion strength measurements are summarized in
Figure 5a,b (no quantitative results were available for the primer coating due to cohesive ice failure).
For the Standox material, the data points over time were on comparable levels with the resulting means of 39 kPa for impact ice (95 m/s) and 185 kPa for static ice. No trends were identified that indicate material degradation or parameter variances within the test set-ups. The same applied for the PTFE-tape material, with means of 63 kPa for impact ice and 131 kPa for static ice. For the PUR C25 material, the test results remained at a stable low level over the complete test period for impact ice (mean of 15 kPa) and static ice (mean of 41 kPa).
No visible defects for the used materials were reported. A comparison of the test results showed no time-dependent changes for the three quantifiable materials Standox, PUR C25, and PTFE-tape. The results already showed differences between surfaces and ice types, which is further assessed in the following sections.
3.2. Data Analysis
Ice adhesion test results are often accompanied by comparably high data scattering, which is caused by the high sensitivity of the ice–substrate interface to fluctuations in temperature, pre-conditioning parameters, and icing durations. Additionally, contaminations in the water and on test substrates may occur, and mechanical disturbances during ice formation and sample handling affect the measurement values. Finally, the test devices and also the staff need to work under harsh lab conditions (in this case, at a temperature of −8 °C), resulting in higher stress levels for man and machine. To account for this, limited overall test times and detailed and robust test protocols are defined. Test repetitions increase the data points and help to identify single measurement errors.
In this study, a minimum of 10 data points per coating material for tests with impact ice and 8 data points for tests with static ice were assessed. For the exploratory data analysis of the ice adhesion test results, box plots were used to achieve a high data quality. To identify extreme values/outlier candidates in the data sets, the 1.5 × IQR rule was selected (interquartile range IQR multiplied by 1.5 and added to the third quartile or subtracted from the first quartile) as an established statistical tool [
22]. Data points outside this calculated range were defined as outliers and subsequently removed prior to the final calculation of the medians, means, and standard deviations per material and parameter set [
23].
Table 5,
Table 6,
Table 7,
Table 8,
Table 9 and
Table 10 summarize the results of the data analysis, including boxplots that indicate outliers as dots outside the whiskers. The resulting medians, means, and standard deviations for the ice adhesion strength are given prior to and after the removal of identified outliers. The latter are indicated as “cleaned” values.
For impact ice, accreted at a wind speed of 95 m/s in the ice wind tunnel, clear differences between the surfaces were observed (
Table 5). For PUR C25, the lowest ice adhesion was observed in this parameter set. The difference between the median and mean value is negligible for the evaluation. No outliers were identified. Standox represents an example where two outliers were observed (dots outside the whiskers). They were removed from the data set, resulting in a reduced standard deviation (“cleaned” data set used for the following assessments). For PTFE-tape, the highest ice adhesion strength for this parameter set was observed. Here, the data distribution was comparably high, with equal mean and median values.
The results for impact ice, accreted at 60 m/s, are summarized in
Table 6. The PUR C25 material again showed the lowest ice adhesion. One identified outlier was removed from the data set, resulting in a slight reduction in the mean and standard deviation. Tests with PTFE-tape showed higher ice adhesion strength data compared to PUR C25. For Standox, data dispersion was high, preventing a clear ranking between PTFE-tape and Standox. However, there was a trend that for tests with the Standox material, higher ice adhesion strength data were observed.
A further general increase in the ice adhesion strength was observed for impact ice, accreted at 40 m/s velocity (
Table 7). For the material ranking, PUR C25 again showed the lowest ice adhesion strength. Standox and PTFE-tape were on comparable higher levels.
Ice adhesion tests with static ice were conducted with identical centrifuge acceleration speeds of 200 rpm/s as used for the impact ice tests (
Table 8). Again, the PUR C25 material delivered the lowest ice adhesion results. For the PTFE-tape, as the second ranked material in this parameter set, an outlier was identified and removed. Standox material showed the highest ice adhesion strength for this set-up.
Static ice that was tested at a centrifuge acceleration speed of 100 rpm/s (
Table 9) delivered comparable results to those tested with a 200 rpm/s acceleration speed.
For static ice tested with an increased centrifuge acceleration speed of 300 rpm/s, the material ranking was comparable with those of the lower acceleration speeds (
Table 10). For PTFE-tape, an outlier was removed, resulting in comparable median and mean values and a reduced standard deviation.
As an overall summary of this evaluation, it can be stated that the obtained data quality is appropriate for further correlation assessments. The identified outliers were removed from the data sets and the resulting means and standard deviations were used for the following correlation assessments.
3.3. Ice Types
The influence of the ice formation process on the ice adhesion strength is one important aspect of this paper.
Figure 6 summarizes the centrifuge test results for the materials Standox, PUR C25, and PTFE-tape. Tests with these materials delivered quantifiable results with complete adhesive failures between the ice and test surface. For the primer coating material, only cohesive ice failures or even no ice shear-off were observed, giving the qualitative result that the ice adhesion strength was significantly higher than the appearing shear forces in the conducted tests. Therefore, the primer is not included in the figure.
Clear indications show that regardless of the material, the highest impact velocities (95 m/s) of the impinging water droplets led to the lowest ice adhesion strength for the respective materials. A reduction in the impact velocity to 60 and 40 m/s led to an increase in the ice adhesion strength. A further increase was observed for the unmodified polyurethane coating, Standox, for static ice formations. Due to the comparable high standard deviations, no clear difference between static ice and impact ice (40 m/s) was observed for the low ice adhesion material, PUR C25, and PTFE-tape.
By comparing the actual ice formations on the test samples (
Table 4), one can argue that increased adhesive strength for ice, accreted at 60 and 40 m/s, may be related to the increased ice area, including the coverage of the (coated) sides of the test specimen to a certain extent. This is caused by water droplets moving over the test sample before freezing. However, this effect seems to have less significance, and for static ice with well-defined ice areas, the trend was continued.
The potential to distinguish between the tested materials is of importance for a lab-based test design. Here, impact ice might be more realistic for technical applications (e.g., aircraft, wind rotor blade) but delivers a narrow range of test results (for 95 m/s, an impact ice minimum of 15 kPa and maximum of 63 kPa). In contrast, static ice delivers a wider result range (minimum of 41 kPa and maximum of 185 kPa), potentially allowing an improved ranking during material development processes. However, surface characteristics (especially roughness) must be considered in the test parameter definition (
Section 3.5).
3.4. Centrifuge Acceleration Speed
For tests with static ice formations, the effects of the centrifuge acceleration speed on the ice adhesion strength data were assessed (
Figure 7). The results determined at acceleration speeds of 100 and 200 rpm/s, respectively, showed comparable results. A reduced standard deviation was observed for the test results of the low ice adhesion material PUR C25 at 100 rpm/s. This might be linked to an improved test resolution: at 100 rpm/s, the calculated mean of 40 kPa was reached after 34 s, and at 200 rpm/s, already after 17 s (compare also with
Figure 4). For the 300 rpm/s acceleration speed, the adhesive strength slightly increased for all materials but not significantly.
3.5. Interdependencies of the Surface Properties and Ice Adhesion Strength
The effects of the surface properties on results of the ice adhesion centrifuge test are assessed in the following section.
Figure 8 shows exemplarily R
a values (arithmetical mean deviation of the assessed surface profile) as an often-used basic parameter for the surface roughness in comparison with the ice adhesion strength per ice formation type.
The PUR C25 material with the lowest material roughness in this study showed the lowest ice adhesion values in all ice formation types. For impact ice, accreted at 95 m/s (dotted line), the increase in the ice adhesion strength correlated with an increase in the roughness for the materials Standox (Ra = 0.07 µm) and PTFE-tape (Ra = 0.11 µm). This changed for ice accreted at lower velocities and for static ice. The measured ice adhesion strength was comparable (60 and 40 m/s velocity) or higher (static ice) for the smoother Standox material than for the PTFE-tape.
These findings may be explained by the underlying ice formation processes. Impacting water droplets (velocity 95 m/s) may enter the surface structure of PTFE-tape. They can overcome the low material wettability (SFE = 15.1 mN/m) due to their high energy, resulting in a higher ice adhesion than for water with less or zero impact energy. This is also of specific relevance for superhydrophobic surfaces (high surface roughness, low wettability), which were not included in this test program due to their expected limited durability.
It is further postulated that with a significant increase in the roughness (as for the primer R
a = 1.5 µm), the ice adhesion strength increases significantly, regardless of the ice formation type. The surface wettability, as the second main surface property, is displayed in
Figure 9 against the ice adhesion test results for different ice types. The surface free energy (SFE) was selected as the parameter for this evaluation.
The lowest SFE of the PTFE-tape (SFE = 15.1 mN/m) in this study did not result in the lowest ice adhesion strength (as presented before). PUR C25 (SFE = 18.0 mN/m) showed lower ice adhesion test results for all ice formation types. The effects of the ice formation types and the interdependencies with the surface properties roughness and wettability included the following:
For high impact velocities (95 m/s), the surface roughness is of higher relevance than the wettability properties, resulting in increased ice adhesion for the rougher but low-wettability PTFE-tape compared to the Standox coating.
For lower impact velocities (60 and 40 m/s), the roughness and wettability properties cancel each other out, resulting in comparable ice adhesion results for the PTFE-tape and Standox material.
For zero impact velocities (static ice), the surface wettability is of higher relevance than the roughness, resulting in a higher ice adhesion strength for Standox compared to PTFE-tape.
These findings are of significant importance for the development of icephobic materials and the definition of accompanying test designs. As soon as surface structures (used to reduce the wettability by increasing the roughness) are addressed, impact ice formations need to be considered to minimize the risk of overestimating the reduction in ice adhesion under relevant technical conditions. Therefore, the definition of test parameters should also address the desired technical applications.
4. Discussion
In this study, different test parameter set-ups for the ice adhesion centrifuge test were assessed in combination with durable reference materials, representing different surface properties with regard to the roughness and wettability. With regard to the effects of ice types, this study showed that the ice adhesion strength is lower for impact ice compared to static ice. This was also reported by Tetteh and Loth in tensile ice adhesion tests [
24]. One explanation for this finding is that ice accreted at a high velocity (in our study, 95 m/s) contains more air inclusions due to quasi-instant freezing of the droplets by impacting the surface or ice that has already been built at the test surface. The ice appears opaque, and the trapped air may reduce the contact area with the surface. Reducing the impact energy of the water (in our study, 60 and 40 m/s, static) leads to ice with less air inclusions and more bonding options to the surface, increasing the ice adhesion. Moreover, from a material perspective (at least for polymeric materials), we can postulate that a slower freezing process leads to increased adhesion. At a sub-molecular level, polar groups in the polymer matrix may become oriented to the interface and promote interactions with the water molecules. Work and Lian identified further possible explanations for the finding of higher adhesion strength for static (mold) ice, including stress differences frozen into the ice, larger grains, and, for rough surfaces, weaker stress concentrations at the interface due to a lack of penetration into surface structures [
1]. Due to the complexity of ice formation processes, there are certainly overlapping parameters that cancel each other out or intensify the observed effects. This also applies to the effects of drag forces on the different ice shapes (impact vs. static ice) during the centrifuge test. This paper does not further address these aspects but includes a study that was conducted with regard to the effects of ice types on ice adhesion measurements using a centrifuge test. Rønneberg et al. identified for different ice types the following ranking (increasing ice adhesion): precipitation (hard rime) ice 5.6 m/s > impact ice 15 m/s > static ice. They concluded that the ice adhesion strength inversely correlated with the apparent density of the ice type [
8]. The same trend was also reported in a related study, but it was less significant [
25]. These contrary results emphasize the need to further improve the understanding of ice formation processes to improve test systems and identify crucial parameters for technical applications.
Considering the topic “surface properties” in the overall discussion, the complexity further increases. As summarized in
Table 1, different studies have already addressed correlation aspects. The diversity of different correlation findings is now understandable, as the ice type used has a significant impact on the test results and the material ranking with regard to their ability to reduce the ice adhesion. However, roughness is a crucial surface parameter and can increase the ice adhesion strength significantly, as it was observed in this study for the primer coating material (R
a = 1.5 µm), only delivering cohesive ice failures or no ice shedding at all. This finding is in agreement with other centrifuge test-related studies for static ice [
17], impact ice at 25 m/s [
15], and rotor tests [
7,
14]. Nevertheless, the complexity of the surface roughness is higher than the expressed parameter R
a and R
z, especially for superhydrophobic surfaces. This is to be addressed in future studies.
For the expression of the wettability, this study used the surface free energy (SFE) as the determining parameter. The higher this value, the better the wettability of a liquid (water) at the solid surface due to available bonding options. The roughness and chemical composition of the solid are the determining factors for the SFE and an optimum for the icephobic performance was observed for PUR C25 (18.0 mN/m). A further decrease in PTFE-tape (15.1 mN/m) is related to an increase in the roughness, resulting in a higher ice adhesion strength. This was already published for other polymeric coatings during the degradation process [
13]. However, to our knowledge, this has not been reported by other research groups for icephobic properties. Furthermore, the often-highlighted parameter contact angle hysteresis (CAH), as a suitable correlating parameter for the icephobic performance [
9,
11,
15], follows the same trend as the SFE. The identified findings might not be valid for superhydrophobic surfaces (e.g., [
26,
27,
28,
29,
30]) or materials following or inspired by the slippery liquid-infused porous surfaces (SLIPS) approach (e.g., [
24,
31,
32,
33]), as they can generate “extreme” values, constituting exceptions to the general rule. Moreover, the elastomeric properties of coating materials are discussed as relevant parameters for the ice adhesion strength [
12] but should not be dominant in this study due to the low (<100 µm) and comparable material thicknesses.
In general, the data point distribution for ice adhesion tests is comparably high and standard deviations ≥ 20% are often reported (e.g., [
8,
15,
25]). This also applies to the current study, specifically for the low ice adhesion surface PUR C25, with data points below 50 kPa. One reason for this is the limited data resolution in the lower measurement area. Further reasons, such as the limited material durability in repeated tests or disturbing factors (e.g., temperature fluctuation, mechanical disturbance of the ice–test surface interface, contaminations), were excluded in this study as much as possible. All measures to reduce the data scattering need to be considered, and the reduction in the acceleration speed of the centrifuge should be considered in order to increase the test resolution and improve the data quality.


