Article

Detection of Geomagnetic Signals as Precursors to Some Earthquakes in China

1
Department of Insurance, School of Finance, Yunnan University of Finance and Economics, Kunming 650221, China
2
Institute of Geophysics, China Earthquake Administration, Beijing 100081, China
*
Author to whom correspondence should be addressed.
Appl. Sci. 2022, 12(3), 1680; https://doi.org/10.3390/app12031680
Submission received: 19 December 2021 / Revised: 28 January 2022 / Accepted: 4 February 2022 / Published: 6 February 2022
(This article belongs to the Section Earth Sciences)

Abstract

:
Extracting weak seismic-magnetic signals from strong electromagnetic backgrounds has always been an important part of seismic-electromagnetic research. Based on the data of D/H/Z components measured through a three-axis ring-core-type fluxgate magnetometer in GLM (Geermu), JYG (Jiayuguan), and KSH (Kashi) observatories, we analyzed geomagnetic signals as precursors to some earthquakes in China using the polarization method. The most effective main frequency of seismic-electromagnetic emission was determined according to the skin effect. The results showed that only 5 out of 37 earthquakes were found to have probable signals of seismomagnetic anomalies before them. Further research revealed that the significant enhancements of polarization ratios of YZH and YZG (YZH, the spectral power ratio of Z to H and YZG, the spectral power ratio of Z to G) occurred five days prior to the Jinta earthquake (Ms 5.4) and continued for about two months. The polarization ratio of YZH reached an abnormally high value about one month before some earthquakes (Ms 7.4, Ms 6.7, Ms 6.7) near the KSH station and lasted for about one week to half a month, then returned to the normal value. Similarly, some enhancements of polarization ratios of YZH and YZG occurred two months before the Haixi earthquake (Ms 5.0) and lasted for about one month. Analysis results showed that the enhancements prior to earthquake events may be closely related to the Jinta earthquake and a series of earthquakes near the KSH station; however, the high value of YZH and YZG in GLM station had nothing to do with the Haixi earthquake.

1. Introduction

The prelude and occurrence of earthquakes have been shown to possibly coincide with changes in the geomagnetic field, which are called seismomagnetic signals [1,2,3,4,5]. Pride proposed that fluid within rock voids plays an important role in generating electromagnetic anomalies prior to earthquakes [6]. When a micro-fissure expands, void fluids tend to disperse into the new and expanded fissures according to Darcy’s Law. This in turn alters the electrical conductivity of the rocks in the focal zone, which changes the induced geomagnetic field coupled with a variation of the external geomagnetic field [7,8,9].
Geomagnetic variation data recorded by observation instruments mainly contain three parts. The first part is the external variation of geomagnetic field, including Sq (solar quiet day variation), magnetic storm, bay, and pulsation, etc. The second part is the induced magnetic field generated by internal and external electric currents, which are related to electrical structure changes in the focal zone. The third part is the possible disturbance resulting from some changes in the observed environment, such as the interference of railways, subways, or electric transmissions. Although the energy of seismic-electromagnetic emission continuously accumulates during the earthquake preparation process, its intensity remains weak and is usually covered by external geomagnetic variations or man-made disturbances [10,11]. The key problem regarding these seismogenic emissions is the detection and identification of weak signals from a strong geomagnetic background field. Therefore, Hayakawa et al. developed the polarization method and found that the spectral power ratio of the vertical magnetic field (Z) to horizontal magnetic field (H) anomalously increased within the frequency range of 0.01 Hz prior to an earthquake on 8 August 1993 [12]. Polarization analysis has since been widely applied in seismic-electromagnetic studies [13,14,15,16,17,18,19]. In order to prevent the phenomenon that the amplitude of horizontal component (H) is small when the geomagnetic activity is weak but the polarization value increases abnormally, Ida and Li et al. eliminated the geomagnetic data of the horizontal component with small amplitude during periods of weaker geomagnetic activity and developed an improved polarization method [5,20]. They applied the improved polarization method to the ULF data observed in China and found some significant precursory effects for three earthquakes. Nevertheless, it was demonstrated that this special phenomenon should be large-scale or even global [21,22,23], and it can be identified by multiple-station comparisons.
In this study, we applied the original polarization method to analyze geomagnetic data observed at the JYG, GLM, and KSH stations in China to identify potential precursory signals to earthquake events.

2. Polarization Analysis

The polarization analysis method is based on the measurement of the spectral power ratio of Z to the horizontal magnetic fields (H and G), as given by Hayakawa and Kotsarenko [12,24]:
Y Z H = S Z ( ω ) S H ( ω ) ,             Y Z G = S Z ( ω ) S G ( ω )
G = H 2 + D 2
where SZ, SH, and SG represent the spectral power of Z, H, and total horizontal component (G), respectively. The total horizontal component is obtained from Equation (2). The spectral powers of SZ, SH, and SG are obtained through a fast Fourier transform (FFT). Previous geomagnetic diurnal variation studies have suggested that more artificial noise is included during daytime than nighttime [5,22]. Each geomagnetic component (Z/H/G) was therefore chosen at local midnight (LT 22:00:00–01:59:59) as the analysis object to minimize artificial effects.
The electromagnetic skin effect was used to obtain the possible emission frequency originating from the earthquake source [5]. The skin depth is defined as
δ = 2 ρ μ ω 1 2
where ρ is resistivity, ω is angular frequency, and μ is magnetic permeability, which can be obtain as μ = μ0 = 4π × 10−7 (H/m) where μ0 is the vacuum permeability. A single resistivity was not identified near the hypocenter of these earthquakes; we thus used the resistivity of sedimentary rock as the average resistivity in this study (ρ = 10 Ω·m).

3. Polarization Results and Earthquakes

Geomagnetic data of three components (D/H/Z) were measured through a three-axis ring-core-type fluxgate magnetometer by 1s sampling rate from 2008 to 2017 in the JYG, GLM, and KSH stations. Data time series during each 30-min interval between 22:00:00 and 01:59:59 were then subjected to FFT analysis. The daily polarization energy was taken as the average spectral power over the entire period of each day, and the polarization ratios of YZH and YZG were then calculated. Earthquakes with the shortest epicentral distance from the observatories were selected as the seismic events and some potential earthquake precursor signatures were obtained from the ultralow-frequency (ULF) records. The Dst (disturbance storm time) index was used to describe the activity of geomagnetic field. Seismic events were selected as follows. First, selected earthquakes of magnitude greater than 5.0 in mainland China from 2008 to 2017. We then calculated the epicenter distance from each earthquake to each geomagnetic station, and finally screened out the earthquake events that have the shortest distance from KSH/JYG/GLM as analysis objects. The total number of selected earthquakes is 37, with 1 earthquake closest to JYG station, 7 earthquakes closest to GLM station, and 29 earthquakes closest to KSH station. However, only 5 out of 37 earthquakes were found to have probable signals of seismomagnetic anomalies before them. Table 1 lists the 37 earthquakes and corresponding information, and Figure 1 shows the distribution of observatories and the five earthquakes.

3.1. Polarization Results of the Jinta Earthquake

An Ms 5.4 earthquake occurred on 3 May 2012 at 02:19 UT in Jinta Inner Mongolia, China. The earthquake focal depth was 8 km and most closely located (about 100 km) to the JYG observatory in western China (Figure 1c). The resistivity of the hypocenter is approximately 10 Ω·m, the magnetic permeability is approximately 4π × 10−7 (H/m), and the depth is 8 km. According to the Equation (3), the possible seismic-electromagnetic emission frequency originating from the earthquake source was about 0.04 Hz. The polarization ratios of YZH and YZG of the geomagnetic data within the frequency range of 0.04 Hz in the JYG station were thus obtained.
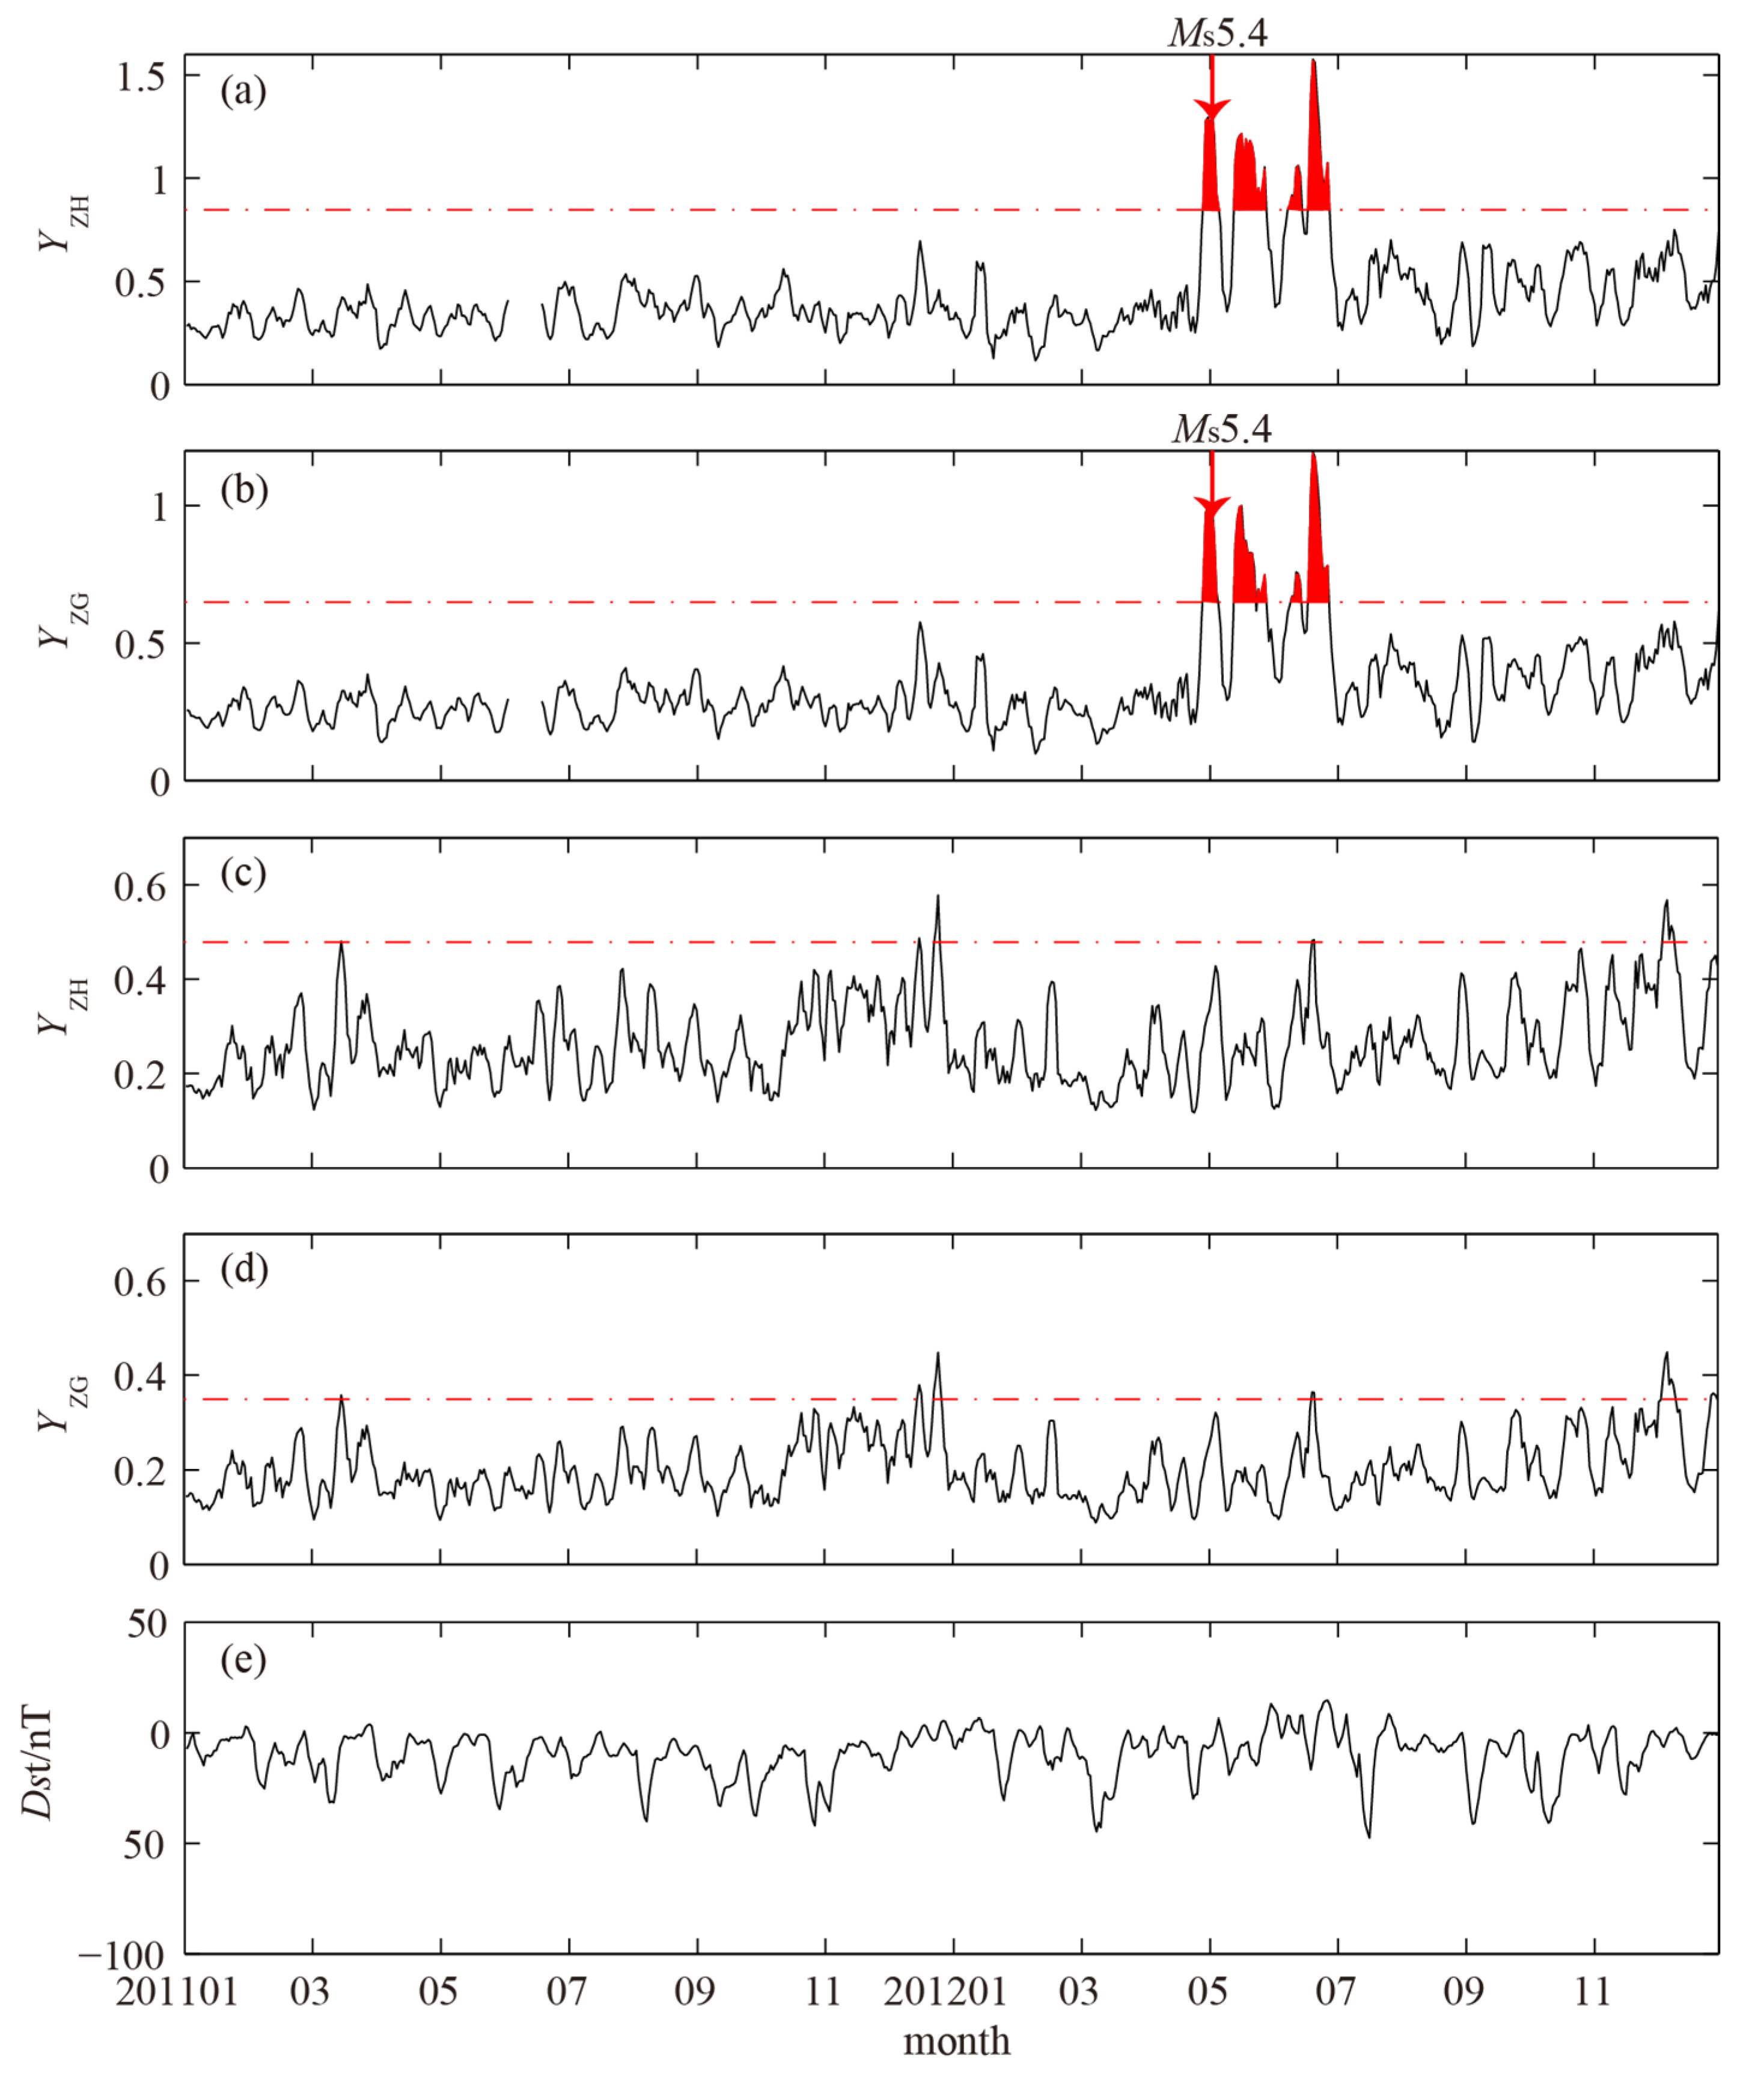
Figure 2a,b illustrate the temporal evolution of the YZH and YZG during 2011–2012. A five-day moving average was used in all calculation results in the plot. A vertical arrow indicates the earthquake occurrence date (3 May 2012). The red dotted line represents the threshold value of m + 2σ, where m is the mean value of polarization ratio over the entire period and σ is the standard deviation.
Some significant enhancements of YZH started on 29 April 2012, and ended on 27 June 2012. That was 5 days prior to the earthquake and lasted for nearly 2 months afterward (Figure 2a). The maximum polarization value of YZH during that period was approximately 1.58, which exceeded the threshold value (m + 2σ) by 85%. A similar increase in the YZG was also observed in this plot (Figure 2b). The Dst index and a reference station of CNH were selected for comparisons, as shown in Figure 2c–e. Figure 2e shows that the absolute value of the Dst index is small and almost always less than 30 nT over the period that YZH and YZG of the JYG station abnormally increase. The calculation results yield correlation coefficients between YZH, YZG, and Dst index of 0.32 and 0.43, respectively, which implies no correlation between these polarization ratios enhancements and Dst or geomagnetic activities. To further confirm these findings, we obtained YZH and YZG of CNH observatory as a reference station, which is 2185 km from the epicenter. No significant enhancements of YZH and YZG were detected in the CNH station (Figure 2c,d), which implies that the enhancements of YZH and YZG in JYG station may be regional and associated with the Jinta Ms 5.4 earthquake.

3.2. Polarization Results of Haixi Earthquake

On 5 June 2013 at 00:43 UT an Ms 5.0 earthquake occurred in the Haixi region, China. The focal depth of this earthquake was 4 km and the closest station (about 155 km) was GLM observatory in western China (Figure 1c). According to the skin effect (Equation (3)), the possible seismic-electromagnetic emission frequency originating from this earthquake source was approximately 0.1 Hz. The polarization ratios of YZH and YZG of the geomagnetic data at approximately 0.1 Hz in GLM station were thus obtained. Figure 3a,b show the temporal evolution of YZH and YZG in the GLM observatory during 2013 through five-day moving average.
In this case, significant YZH and YZG enhancements occurred nearly 2 months prior to the Haixi earthquake and lasted for approximately 1 month (started on 17 April 2013 and ended on 14 May 2013). The maximum polarization values of YZH and YZG during that period were approximately 1.15 and 0.85, which exceeded the threshold value (m + 2σ) by 72% and 57%, respectively. The Dst index and CNH station were also selected for comparisons (Figure 3c–e). The results yield correlation coefficients between YZH, YZG, and the Dst index were 0.36 and 0.42, respectively, which also implies that the YZH and YZG variations are generally not in accordance with the Dst index. Figure 3e shows that the absolute values of the Dst index is small and almost always less than 20 nT when the significant YZH and YZG enhancements occur in the GLM station. The primary results indicate that the YZH and YZG enhancements in the GLM station show no correlation with Dst or geomagnetic activities. To further illustrate this conclusion, we also obtained YZH and YZG in the CNH observatory as a reference station, which is nearly 2530 km from the epicenter. Figure 3c,d show that some minor enhancements of YZH and YZG occurred at the CNH station in phase with the significant enhancements of the GLM station. However, the amplitude of enhancements at CNH station is very small and does not even reach the annual average. Yao et al. found that the variation amplitude of the H component within 0.02–0.1 Hz increases with increasing latitude, but the variation amplitude of the Z component does not [25]. The CNH observatory is located at a higher latitude (44.08 °N) than the GLM station (36.43 °N). According to Yao’s study, the amplitude of SH in the CNH station may be greater than that in the GLM station. As the result, the amplitudes of YZH and YZG in the CNH station are greater than those in the GLM observatory. This means that the synchronized enhancements of GLM and CNH stations may be related to normal geomagnetic field variations.
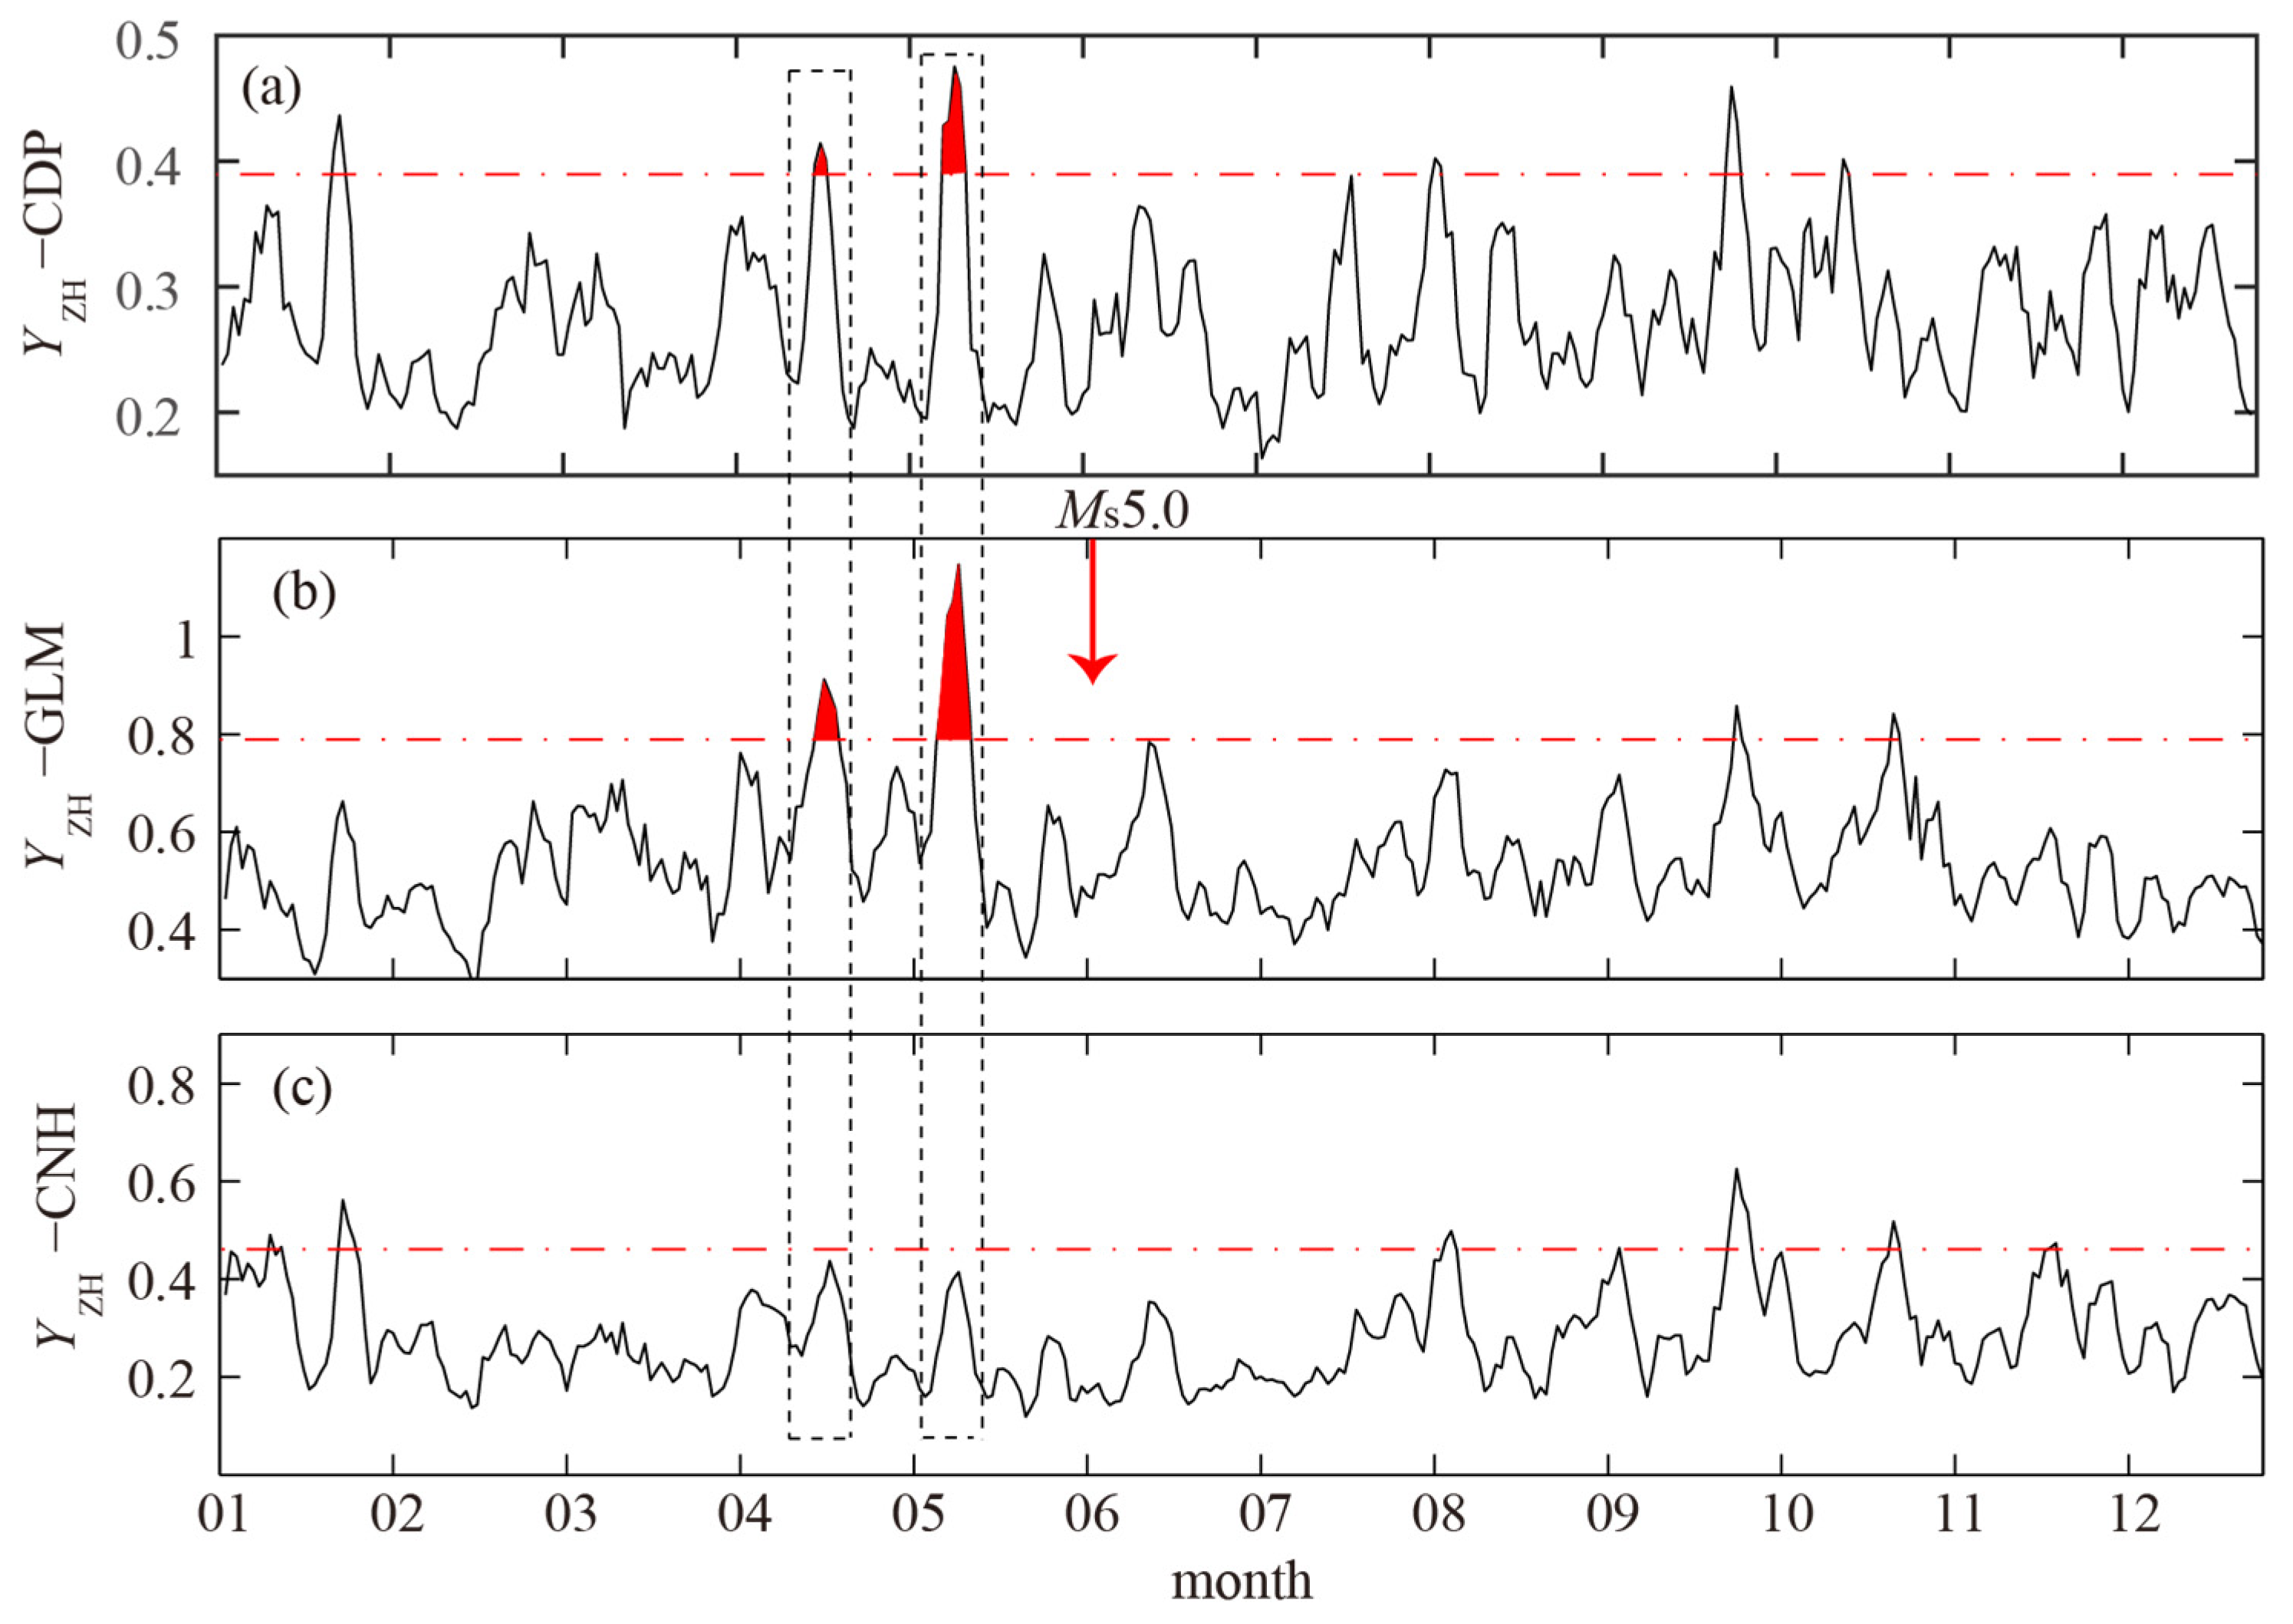
In order to further explore the source of significant enhancements before Haixi Ms 5.4 earthquake at the GLM station, the polarization values of YZH and YZG at CDP station were obtained. The latitude of CDP station is 30.95 °N, which is lower than that of GLM station. According to the variation characteristics of different components with latitude, if these significant enhancements are caused by normal geomagnetic field variations, a similar increase in polarization value will also occur at the CDP station. Figure 4 takes the YZH as an example to show the synchronized changes in the polarization values at CDP, GLM, and CNH stations during 2013. Obviously, some significant enhancements of YZH occurred at the CDP station in phase with that of the GLM station. Moreover, the polarization ratio value of YZH at CDP station was very high and also exceeded the threshold line. According to Yao et al., the synchronized enhancements of GLM and CDP stations are related to normal geomagnetic field variations [25]. The variation of the horizontal component (SH) increases with increasing latitude (near the equator). If the variation of the vertical component is small throughout different latitudes, then stations in low latitudes are more likely to have high polarization values. As shown in Figure 4, the enhancements appeared in CDP and GLM stations, but not in CNH station. However, the CDP station was 1036 km away from the epicenter of the earthquake, so these high polarization values had nothing to do with the earthquake.

3.3. Polarization Results of the KSH Station

The KSH observatory is located in northwestern China, as shown in Figure 1a. Three geomagnetic components of D/H/Z were observed through fluxgate sensors. The geomagnetic data from 2014 to 2017 were used for polarization analysis. A series of earthquakes were recorded near the KSH observatory during this time (Table 1). Three earthquakes may have been preceded by seismic electromagnetic signals. The first earthquake (Ms 7.4) occurred on 7 December 2015 in Tajikistan. The focal depth of this earthquake was 30 km with an epicenter of 291 km from the KSH station. The second earthquake (Ms 6.7) occurred on 26 June 2016 in Kyrgyzstan with the focal depth of 10 km, nearly 207 km from the KSH station. The final earthquake (Ms 6.7) occurred on 2 November 2016 in the Aketao region of China with a focal depth of 10 km, 155 km from the KSH station. The KSH observatory and distribution of earthquakes are shown in Figure 1b.
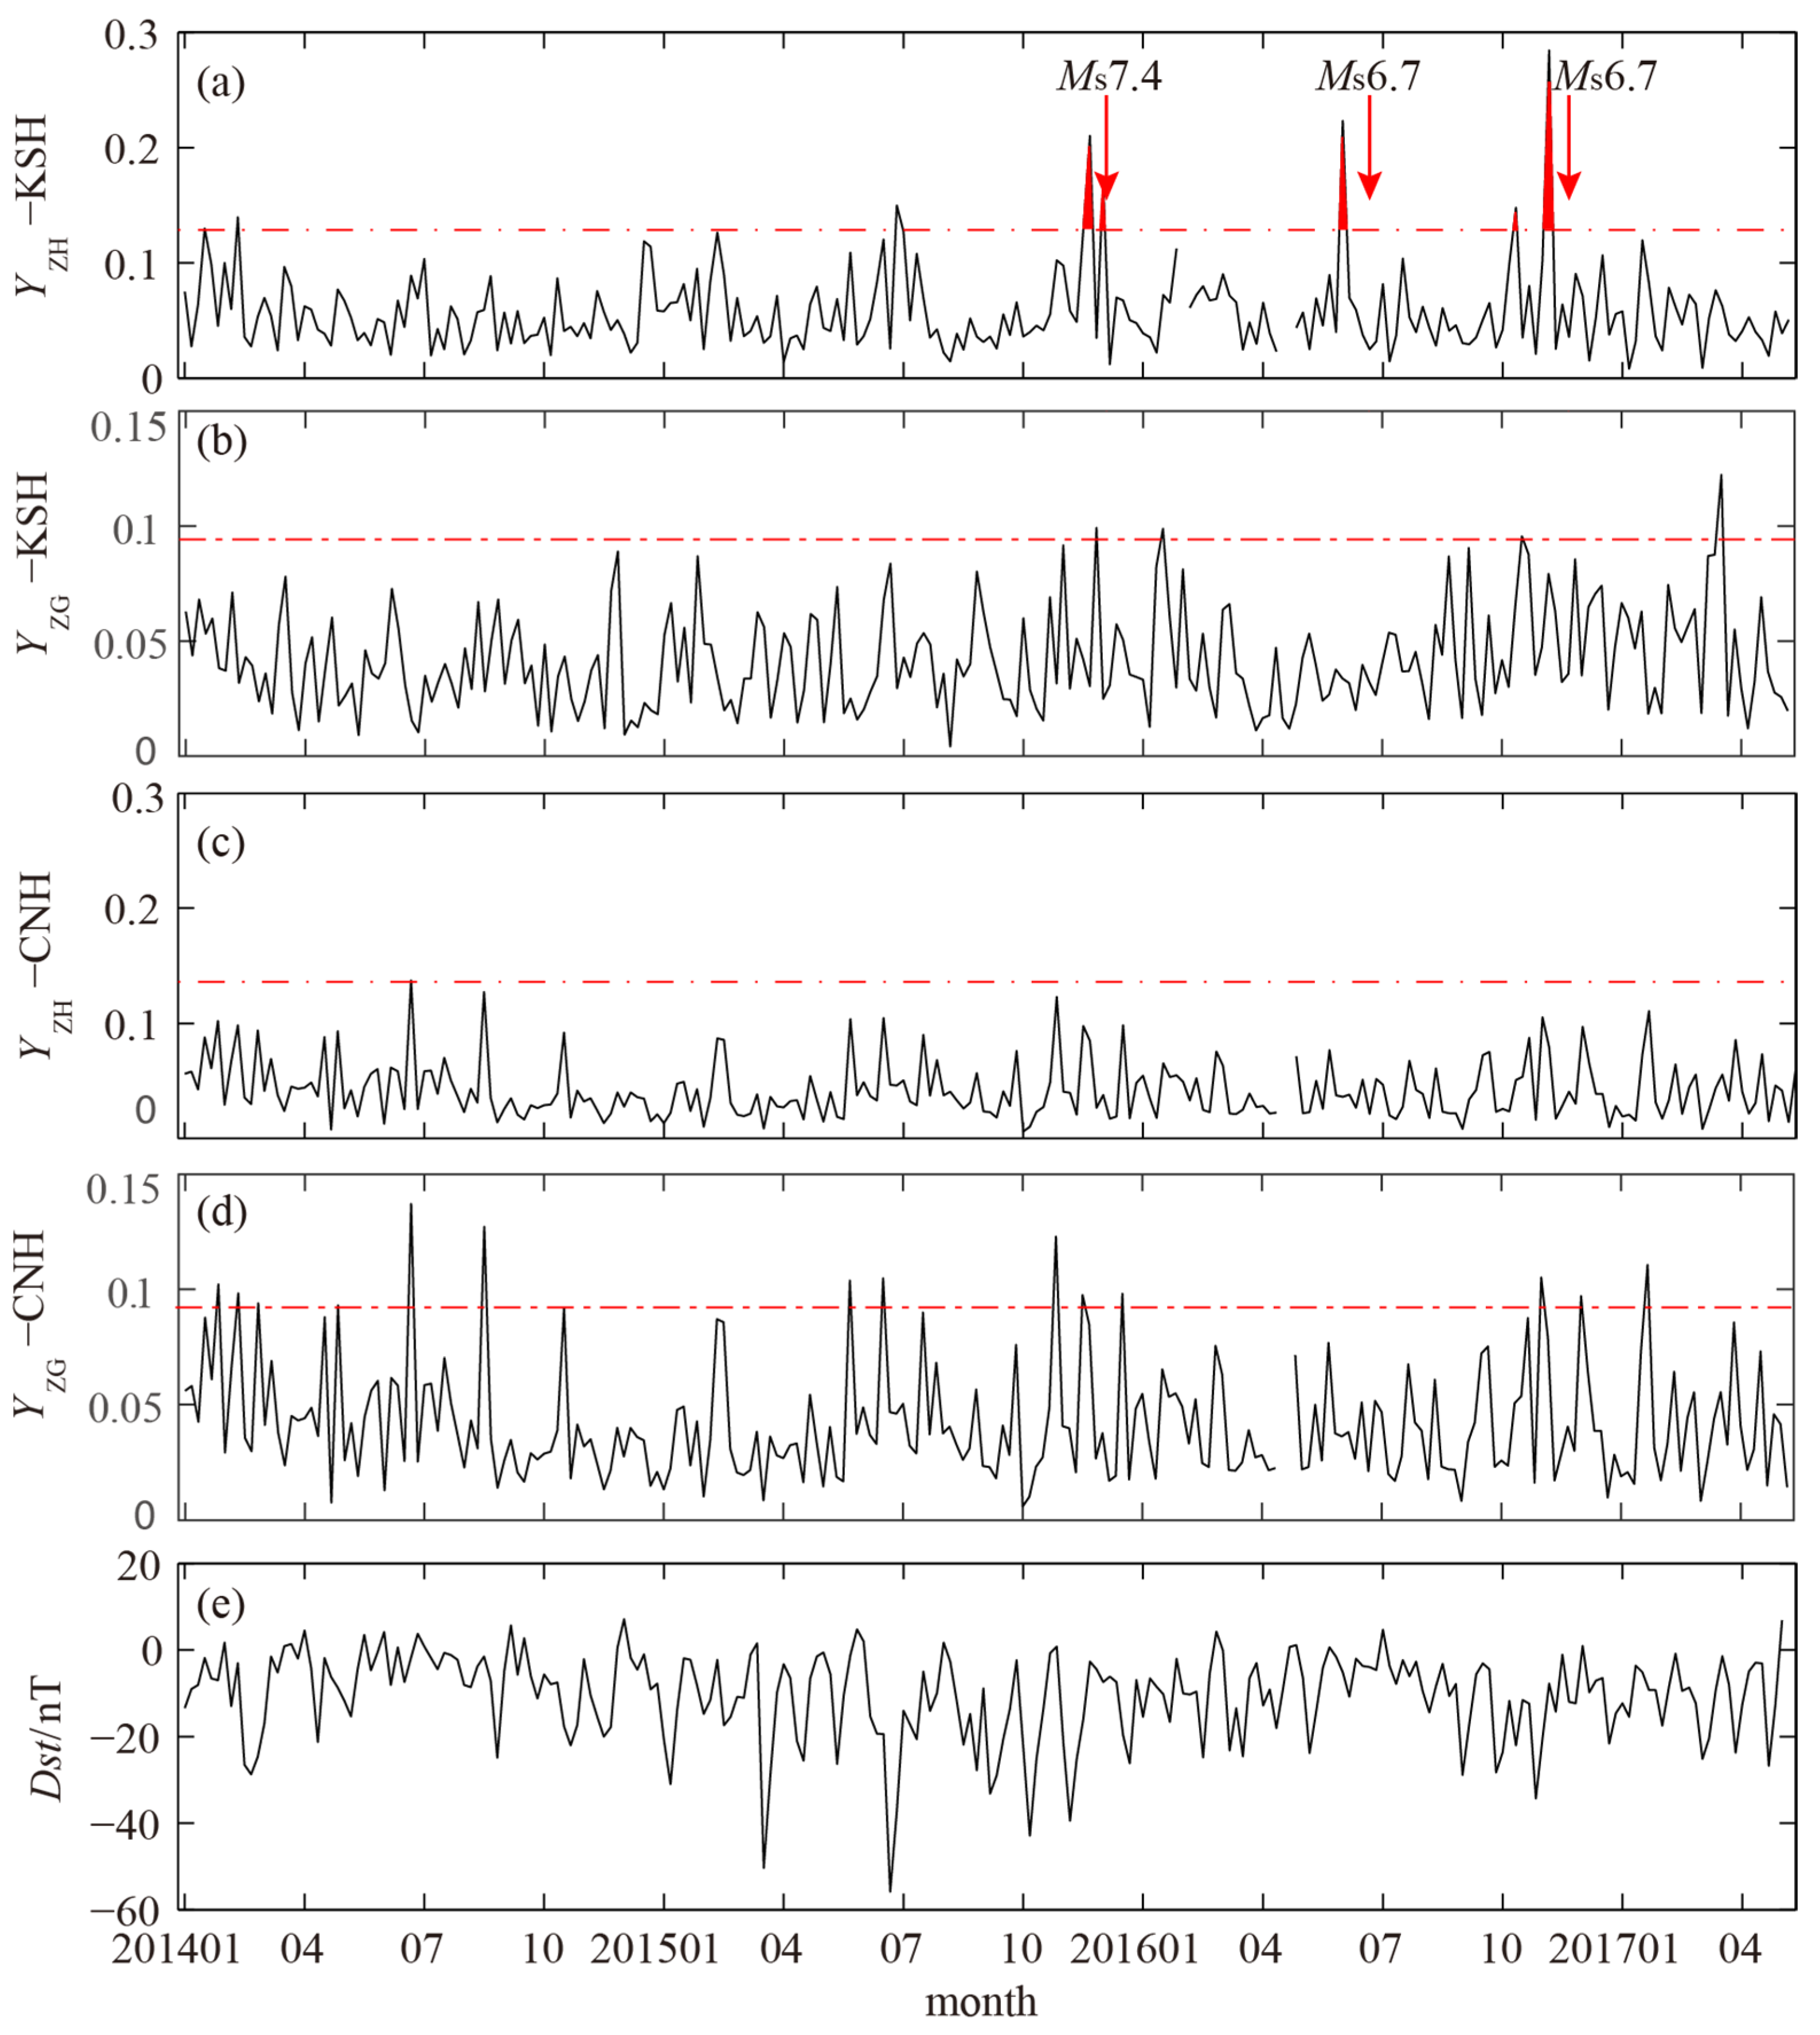
According to the skin effect (Equation (3)), the possible seismic-electromagnetic emission frequencies originating from the source of these three earthquakes are 0.003, 0.02, and 0.02 Hz, respectively. We analyzed the polarization ratios of YZH and YZG of the geomagnetic data within 0.003–0.02 Hz in the KSH station. Figure 5a illustrates the temporal evolution of YZH during 2014–2017 through five-day moving average.
Some significant enhancements (exceeded the threshold value of m + 2σ by 62%, 69%, and 119%, respectively) of YZH clearly occurred about 1 month prior to each earthquake and lasted for about half a month. However, similar changes were not found in YZG, in contrast with the Jinta and Haixi earthquake results. Similarly, Figure 5c,d show the YZH and YZG in the CNH observatory, which was nearly 4000 km from the earthquake epicenters. The calculated correlation coefficient between the YZH in the KSH station and the Dst index is 0.01, which implies that the YZH variation is generally not in accordance with the Dst index. Figure 5c shows the YZH in the CNH observatory as a reference station, which does not show significant enhancements as in the KSH station, meaning that the increased YZH of the KSH station are regional and may be closely related with the series of earthquakes.

4. Discussion

Hayakawa et al. asserted that 0.01 Hz is the most useful frequency to detect seismogenic ultralow-frequency emissions [12,21]. Our results indicate that the frequency inferred from the depth according to the skin effect was also a good candidate to detect ULF anomalies prior to earthquakes.
Many researchers have considered the investigation of ULF geomagnetic polarization ratio to be a key parameter to detect possible seismogenic signals and provided many references in this study [3,4,12,14,16,18,26,27]. Some researchers have used the polarization method to study the characteristics of geomagnetic anomalies before the Guam earthquake (8 August 1993; Mw 7.7), the Biak earthquake (17 February 1996; Mw 8.2), the Izu earthquake swarm (June–August 2000; Ms > 6.0), the Kagoshimaken-Hokuseibu earthquake (26 March 1997; Ms 6.5), and the Nias earthquake (6 September 2018; Ms 5.3). Their study results showed that some significant enhancements in polarization ratios occurred 1–3 months prior to earthquakes like the case of earthquakes near KSH station in this paper. Hattori, Kopytenko and some researchers also have applied the polarization method to obtained seismo-electromagnetic emissions before the Iwateken Nairiku Hokubu earthquake (3 September 1998; Ms 6.3), the Izu earthquake swarm (April–May 1998; Ms 4.7, Ms 5.7), the Chi-Chi earthquake (21 September 1999; Mw 7.7), and the Kamchatka earthquakes (June 2000–September 2001; Ms = 4.0–6.2). In their studies, the abnormal enhancements of polarization ratios started at a shorter time before the earthquake, about a few days to half a month. Those findings were similar to the result of the Jinta earthquake in this paper. It is worth noting that in the results of previous studies, most of the seismogenic anomalies ended before the earthquake occurred [5,28,29,30], whereas in this paper, the seismomagnetic anomalies continued until two months after the Jinta Ms 5.4 earthquake occurrence.
In the earthquake case studies of KSH station, three earthquakes had magnitudes of Ms 7.4, Ms 6.7, and Ms 6.7 with corresponding epicentral distances of 291 km, 207 km, and 155km, respectively. In terms of anomalous amplitudes of polarization ratios, the maximum amplitudes of YZH of these three earthquakes were 62%, 69%, and 119%, respectively, indicating that the anomalous amplitude increases with decreasing epicenter distance, which may suggest that seismo-electromagnetic emissions are more strongly influenced by distance than magnitude. However, this preliminary conclusion requires further verification due to the limited number of earthquakes studied here.
Hattori et al. counted all the published earthquake cases in the world and found that when the earthquake magnitude (M) and epicentral distance (R) satisfy the relationship of 0.025RM–4, 90% of the earthquakes had seismomagnetic anomalies before them [4]. According to the statistical results of Hattori et al., the geomagnetic radiation energy generated by a M5.0 earthquake can only affect stations within 40 km from the epicenter, and the influence range of a M6.0 earthquake is only 80 km. This is inconsistent with our results in this paper. Moreover, only 5 out of 37 earthquakes were found to have probable signals of seismo-magnetic anomalies in our studies. This indicates that not all earthquakes are preceded by seismo-electromagnetic anomaly signals. In order to study the characteristics of abnormal earthquakes, we analyzed 37 earthquakes according to their magnitude and epicentral distance. Figure 6a shows all 37 earthquakes in this paper, and red points indicate the four earthquakes with seismogenic anomalies before them. An important phenomenon is that when the relationship between magnitude and epicentral distance satisfy the relationship of M ≥ 0.011R + 4.175, some seismomagnetic anomaly signals are more likely to appear before an earthquake. Statistical results showed that 50% of the earthquakes have seismomagnetic signals before them among the earthquake samples that meet the condition of M ≥ 0.011R + 4.175 in Figure 6a. We also noticed that most earthquakes which met the condition of M ≥ 0.011R + 4.175 but did not show pre-earthquake magnetic anomaly occurred near the GLM station. Figure 6b shows that some earthquakes near GLM station were removed, and 67% of the earthquakes that met the condition of M ≥ 0.011R + 4.175 had seismomagnetic signals before them. Therefore, we preliminarily believe that earthquakes near GLM stations do not easily generate pre-earthquake magnetic signals, which may be related to the geological structure or earthquake types of the observatory. This preliminary conclusion is only based on the results given by the 37 earthquakes in the paper, and more detailed relationships and causes require more samples in future work.
In terms of the seismo-electromagnetic emissions mechanism, some researchers have proposed many mechanisms for the generation of seismo-electromagnetic emissions, such as induced magnetic effect, piezomagnetic effect, electrokinetic effect, thermomagnetic effect, and micro-rupture mechanism. Merzer and Klemperer proposed a quasi-static model, in which the conductive fault zone acts as an antenna to couple with the external geomagnetic field to generate the observed geomagnetic anomalies [7,31]. Precursory changes in fault-zone conductivity lead to precursory changes in observed geomagnetic field.

5. Conclusions

We applied polarization analysis to geomagnetic data recorded in the JYG, GLM, and KSH observatories, and obtained the evolution of polarization ratios of YZH and YZG in these stations. The results showed that some significant enhancements (exceeded the threshold value m + 2σ by 85%) of YZH and YZG in JYG station occurred a few days prior to the Jinta Ms 5.4 earthquake and lasted for about 2 months. In the case of the Haixi Ms 5.0 earthquake, the polarization ratios of YZH and YZG in GLM station reached an abnormally high value (exceeded the threshold value m + 2σ by 72% and 57%, respectively) about half a month before the earthquake and lasted for about 1 month. For the last case, some enhancements (exceeded the threshold value m + 2σ by 62%, 69%, and 119%, respectively) of polarization ratio YZH of KSH station occurred 1 month prior to the Ms 7.4, Ms 6.7, and Ms 6.7 earthquakes and lasted for half a month. Compared with the Dst index and reference stations, our preliminary conclusions suggested a close relationship between the enhancements prior to the Jinta earthquake and a series of earthquakes near the KSH station. Nonetheless, the enhancements are not related to the Haixi earthquake.

Supplementary Materials

The following are available online at https://susy.mdpi.com/user/manuscripts/resubmit/4d4454a76326d7936fbb5a64c5a17cdc, Figure S1: Distribution of geomagnetic stations and earthquakes at (a) the national scale, (b) KSH area, (c) JYG and GLM area. Figure S2: Polarization ratios of YZH at (a) JYG, (c) CNH observatories and YZG at (b) JYG, (d) CNH stations about 0.04 Hz from 2011 to 2012 and (e) Dst index. Figure S3: Polarization ratios of YZH at (a) GLM, (c) CNH stations and YZG at (b) GLM, (d) CNH observatories about 0.1 Hz during 2013 and (e) Dst index. Figure S4: Polarization ratios of YZH at (a) CDP, (b) GLM, and (c) CNH stations at approximately 0.1 Hz during 2013. Figure S5: Polarization ratios of YZH at (a) KSH, (c) CNH stations and YZG at (b) KSH, (d) CNH observatories within 0.003–0.02 from 2014 to 2017 and (e) Dst index. Figure S6: Scatter diagrams of magnitude and epicentral distance for (a) 37 and (b) 30 earthquakes.

Author Contributions

Data collection and processing, X.Y. and W.W.; funding acquisition, Y.T.; writing—original draft, X.Y. and W.W.; writing—review and editing, Y.T. All authors have read and agreed to the published version of the manuscript.

Funding

This research is financially supported by the National Natural Science Foundation of China (Grant No. 42164004).

Institutional Review Board Statement

Not applicable.

Informed Consent Statement

Not applicable.

Data Availability Statement

The data presented in this study are available within the article and its Supplementary Materials.

Acknowledgments

The authors would like to thank the Geomagnetic Network of China for providing the geomagnetic data.

Conflicts of Interest

The authors declare no conflict of interest.

References

  1. Nagao, T.; Enomoto, Y.; Fujinawa, Y.; Hata, M.; Hayakawa, M.; Huang, Q.; Izutsu, J.; Kushida, Y.; Maeda, K.; Oike, K.; et al. Electromagnetic anomalies associated with 1995 Kobe earthquake. J. Geodyn. 2002, 33, 401. [Google Scholar] [CrossRef]
  2. Akinaga, K.; Tanaka, H. Electric and magnetic phenomena observed before the volcano-seismic activity in 2000 in the Izu island region, Japan. Proc. Natl. Acad. Sci. USA 2002, 99, 7352–7355. [Google Scholar]
  3. Hattori, K. ULF geomagnetic changes associated with large earthquakes. Terr. Atmos. Ocean. Sci. 2004, 15, 329–360. [Google Scholar] [CrossRef] [Green Version]
  4. Hattori, K.; Serita, A.; Gotoh, K.; Yoshinoa, C.; Haradab, M.; Isezakid, N.; Hayakawa, M. ULF geomagnetic anomaly associated with 2000 Izu islands earthquakes swarm, Japan. Phys. Chem. Earth 2004, 29, 425–435. [Google Scholar] [CrossRef]
  5. Li, Q.; Zhu, P.Y.; Alimjian, M.; Xu, G.X. Detection of ULF electromagnetic emissions as a precursor to two earthquakes in China. Earthq. Sci. 2011, 24, 601–607. [Google Scholar] [CrossRef] [Green Version]
  6. Pride, S.R. Governing equations for the coupled electromagnetics and acoustics of porous-media. Phys. Rev. B 1994, 50, 15678–15696. [Google Scholar] [CrossRef]
  7. Merzer, M.; Klemperer, S.L. Modeling low-frequency magnetic-field precursors to the Loma Prietaearthquzke with a precursory increase in fault-zone conductivity. Pure Appl. Geophys. 1997, 150, 217–248. [Google Scholar] [CrossRef]
  8. Hunt, A.G. Comment on “Modeling low-frequency magnetic-field precursors to the Loma Prietaearthquzke with a precursory increase in fault-zone conductivity” by M. Merzer and S. L. Klemperer. Pure Appl. Geophys. 2005, 162, 2573–2575. [Google Scholar] [CrossRef]
  9. Ren, H.X.; Wen, J.; Huang, Q.H.; Chen, X.F. Electrokinetic effect combined with surface-charge assumption: A possible generation mechanism of coseismic EM signals. Geophys. J. Int. 2015, 200, 835–848. [Google Scholar] [CrossRef] [Green Version]
  10. Thomas, J.N.; Love, J.J.; Johnston, M.J.S.; Yumoto, K. On the reported magnetic precursor of the 1993 Guam earthquake. Geophys. Res. Lett. 2009, 36, L16301. [Google Scholar]
  11. Masci, F. On the seismogenic increase of the ratio of the ULF geomagnetic field components. Phys. Earth Planet. Inter. 2011, 187, 19–32. [Google Scholar] [CrossRef] [Green Version]
  12. Hayakawa, M.; Kawate, R.; Molchanov, O.A.; Yumoto, K. Results of ultra-low-frequency magnetic field measurements during the Guam earthquake of 8 August 1993. Geophys. Res. Lett. 1996, 23, 241–244. [Google Scholar] [CrossRef]
  13. Gladychev, V.; Baransky, L.; Schekotov, A. Study of electromagnetic emissions associated with seismic activity in Kamchatka region. Hazards Earth Syst. Sci. 2001, 1, 127–136. [Google Scholar] [CrossRef] [Green Version]
  14. Molchanov, O.; Schekotov, A.; Fedorov, E.; Belyaev, G.; Gordeev, E. Preseismic ULF electromagnetic effect from observation at Kamchatka. Nat. Hazards Earth Syst. Sci. 2003, 3, 203–209. [Google Scholar] [CrossRef]
  15. Kopytenko, Y.; Ismagilov, V.; Hayakawa, M.; Smirnova, N.; Troyan, V.; Peterson, T. Investigation of the ULFelectromagnetic phenomena related toearthquakes: Contemporary achievementsand the perspectives. Ann. Geophys. 2009, 44, 325–334. [Google Scholar] [CrossRef]
  16. Prattes, G.; Schwingenschuh, K.; Eichelberger, H.U.; Magnes, W.; Boudjada, M.; Stachel, M.; Vellante, M.; Wesztergom, V.; Nenovski, P. Multi-point ground-based ULF magnetic field observations in Europe during seismic active periods in 2004 and 2005. Nat. Hazards Earth Syst. Sci. 2008, 8, 501–507. [Google Scholar] [CrossRef] [Green Version]
  17. Rawat, G.; Chauhan, V.; Dhamodharan, S. Fractal dimension variability in ULF magnetic field with reference to local earthquake at MPGO, Ghuttu. Geomat. Nat. Hazards Risk 2016, 7, 1937–1947. [Google Scholar] [CrossRef] [Green Version]
  18. Dewi, C.N.; Febriani, F.; Anggono, T.; Syuhada; Soedjatmiko, B.; Prasetio, A.D.; Ahadi, S. The ULF geomagnetic anomalous signal associated with Nias earthquake M 5.3 North Sumatra Indonesia on 6 September 2018. J. Phys. Conf. Ser. 2020, 1568, 012027. [Google Scholar] [CrossRef]
  19. Yusof, K.A.; Abdul, H.N.S.; Abdullah, M.; Ahadi, S.; Yoshikawa, A. Assessment of signal processing methods for geomagnetic precursor of the 2012 M6.9 Visayas, Philippines earthquake. Acta Geophys. 2019, 67, 1297–1306. [Google Scholar] [CrossRef]
  20. Ida, Y.; Yang, D.; Li, Q.; Sun, H.; Hayakawa, M. Detection of ULF electromagnetic emissions as a precursor to an earthquake in China with an improved polarization analysis. Nat. Hazards Earth Syst. Sci. 2008, 8, 775–777. [Google Scholar] [CrossRef]
  21. Yusof, K.A.; Abdullah, M.; Hamid, N.S.A.; Ahadi, S.; Yoshikawa, A. Correlations between Earthquake Properties and Characteristics of Possible ULF Geomagnetic Precursor over Multiple Earthquakes. Universe 2021, 7, 20. [Google Scholar] [CrossRef]
  22. Haines, C.; Owens, M.J.; Barnard, L.; Lockwood, M.; Ruffenach, A. The Variation of Geomagnetic Storm Duration with Intensity. Sol. Phys. 2021, 29, 154. [Google Scholar] [CrossRef] [Green Version]
  23. Heyns, M.J.; Lotz, S.I.; Gaunt, C.T. Geomagnetic Pulsations Driving Geomagnetically Induced Currents. Space Weather 2021, 19, 1–42. [Google Scholar] [CrossRef]
  24. Kotsarenko, A.; Enríquez, R.P.; Cruz-Abeyro, J.A.L.; Koshevaya, S.; Grimalsky, V.; Zúñiga, F.R. Analysis of the ULF electromagnetic emission related to seismic activity, Teoloyucan geomagnetic station, 1998–2001. Nat. Hazards Earth Syst. Sci. 2004, 4, 679–684. [Google Scholar] [CrossRef] [Green Version]
  25. Yao, X.Y.; Yang, D.M.; Chen, H.R.; He, Y.F.; Gao, D.P. Analysis on temporal-spatial distribution of the short-period geomagnetic activities. Chin. J. Geophys. 2012, 55, 2660–2668. [Google Scholar] [CrossRef]
  26. Hayakawa, M.; Itoh, T.; Hattori, K.; Yumoto, K. ULF electromagnetic precursors for an earthquake at Biak, Indonesia on 17 February 1996. Geophys. Res. Lett. 2000, 27, 1531–1534. [Google Scholar] [CrossRef]
  27. Hattori, K.; Han, P.; Yoshino, C.; Febriani, F.; Yamaguchi, H.; Chen, C.H. Investigation of ULF seismo-magnetic phenomena in Kanto, Japan during 2000-2010: Case studies and statistical studies. Surv. Geophys. 2013, 34, 293–316. [Google Scholar] [CrossRef]
  28. Surkov, V.V.; Molchanov, O.A.; Hayakawa, M. Pre-earthquake ULF electromagnetic perturbations as a result of inductive seismomagnetic phenomena during microfracturing. J. Atmos. Sol.-Terr. Phys. 2003, 65, 31–46. [Google Scholar] [CrossRef]
  29. Dey, C.; Baruah, S.; Rawat, G.; Chetia, T.; Baruah, S.; Sharma, S. Appraisal of contemporaneous application of polarization ratio and fractal analysis for studying possible seismo-electromagnetic emissions during an intense phase of seismicity in and around Assam Valley and the Eastern Himalayas, India. Phys. Earth Planet. Inter. 2021, 318, 106759. [Google Scholar] [CrossRef]
  30. Hayakawa, M.; Hattori, K.; Ohta, K. Monitoring of ULF (ultra-low-frequency) Geomagnetic Variations Associated with Earthquakes. Sensors 2007, 7, 1108–1122. [Google Scholar] [CrossRef] [Green Version]
  31. Robert, J.J.; Duba, A.G.; Mathez, E.A.; Shankland, T.J.; Kinzler, R. Carbon-enhanced Electrical Conductivity During Fracture of Rocks. J. Geophys. Res. 1999, 104, 737–747. [Google Scholar] [CrossRef]
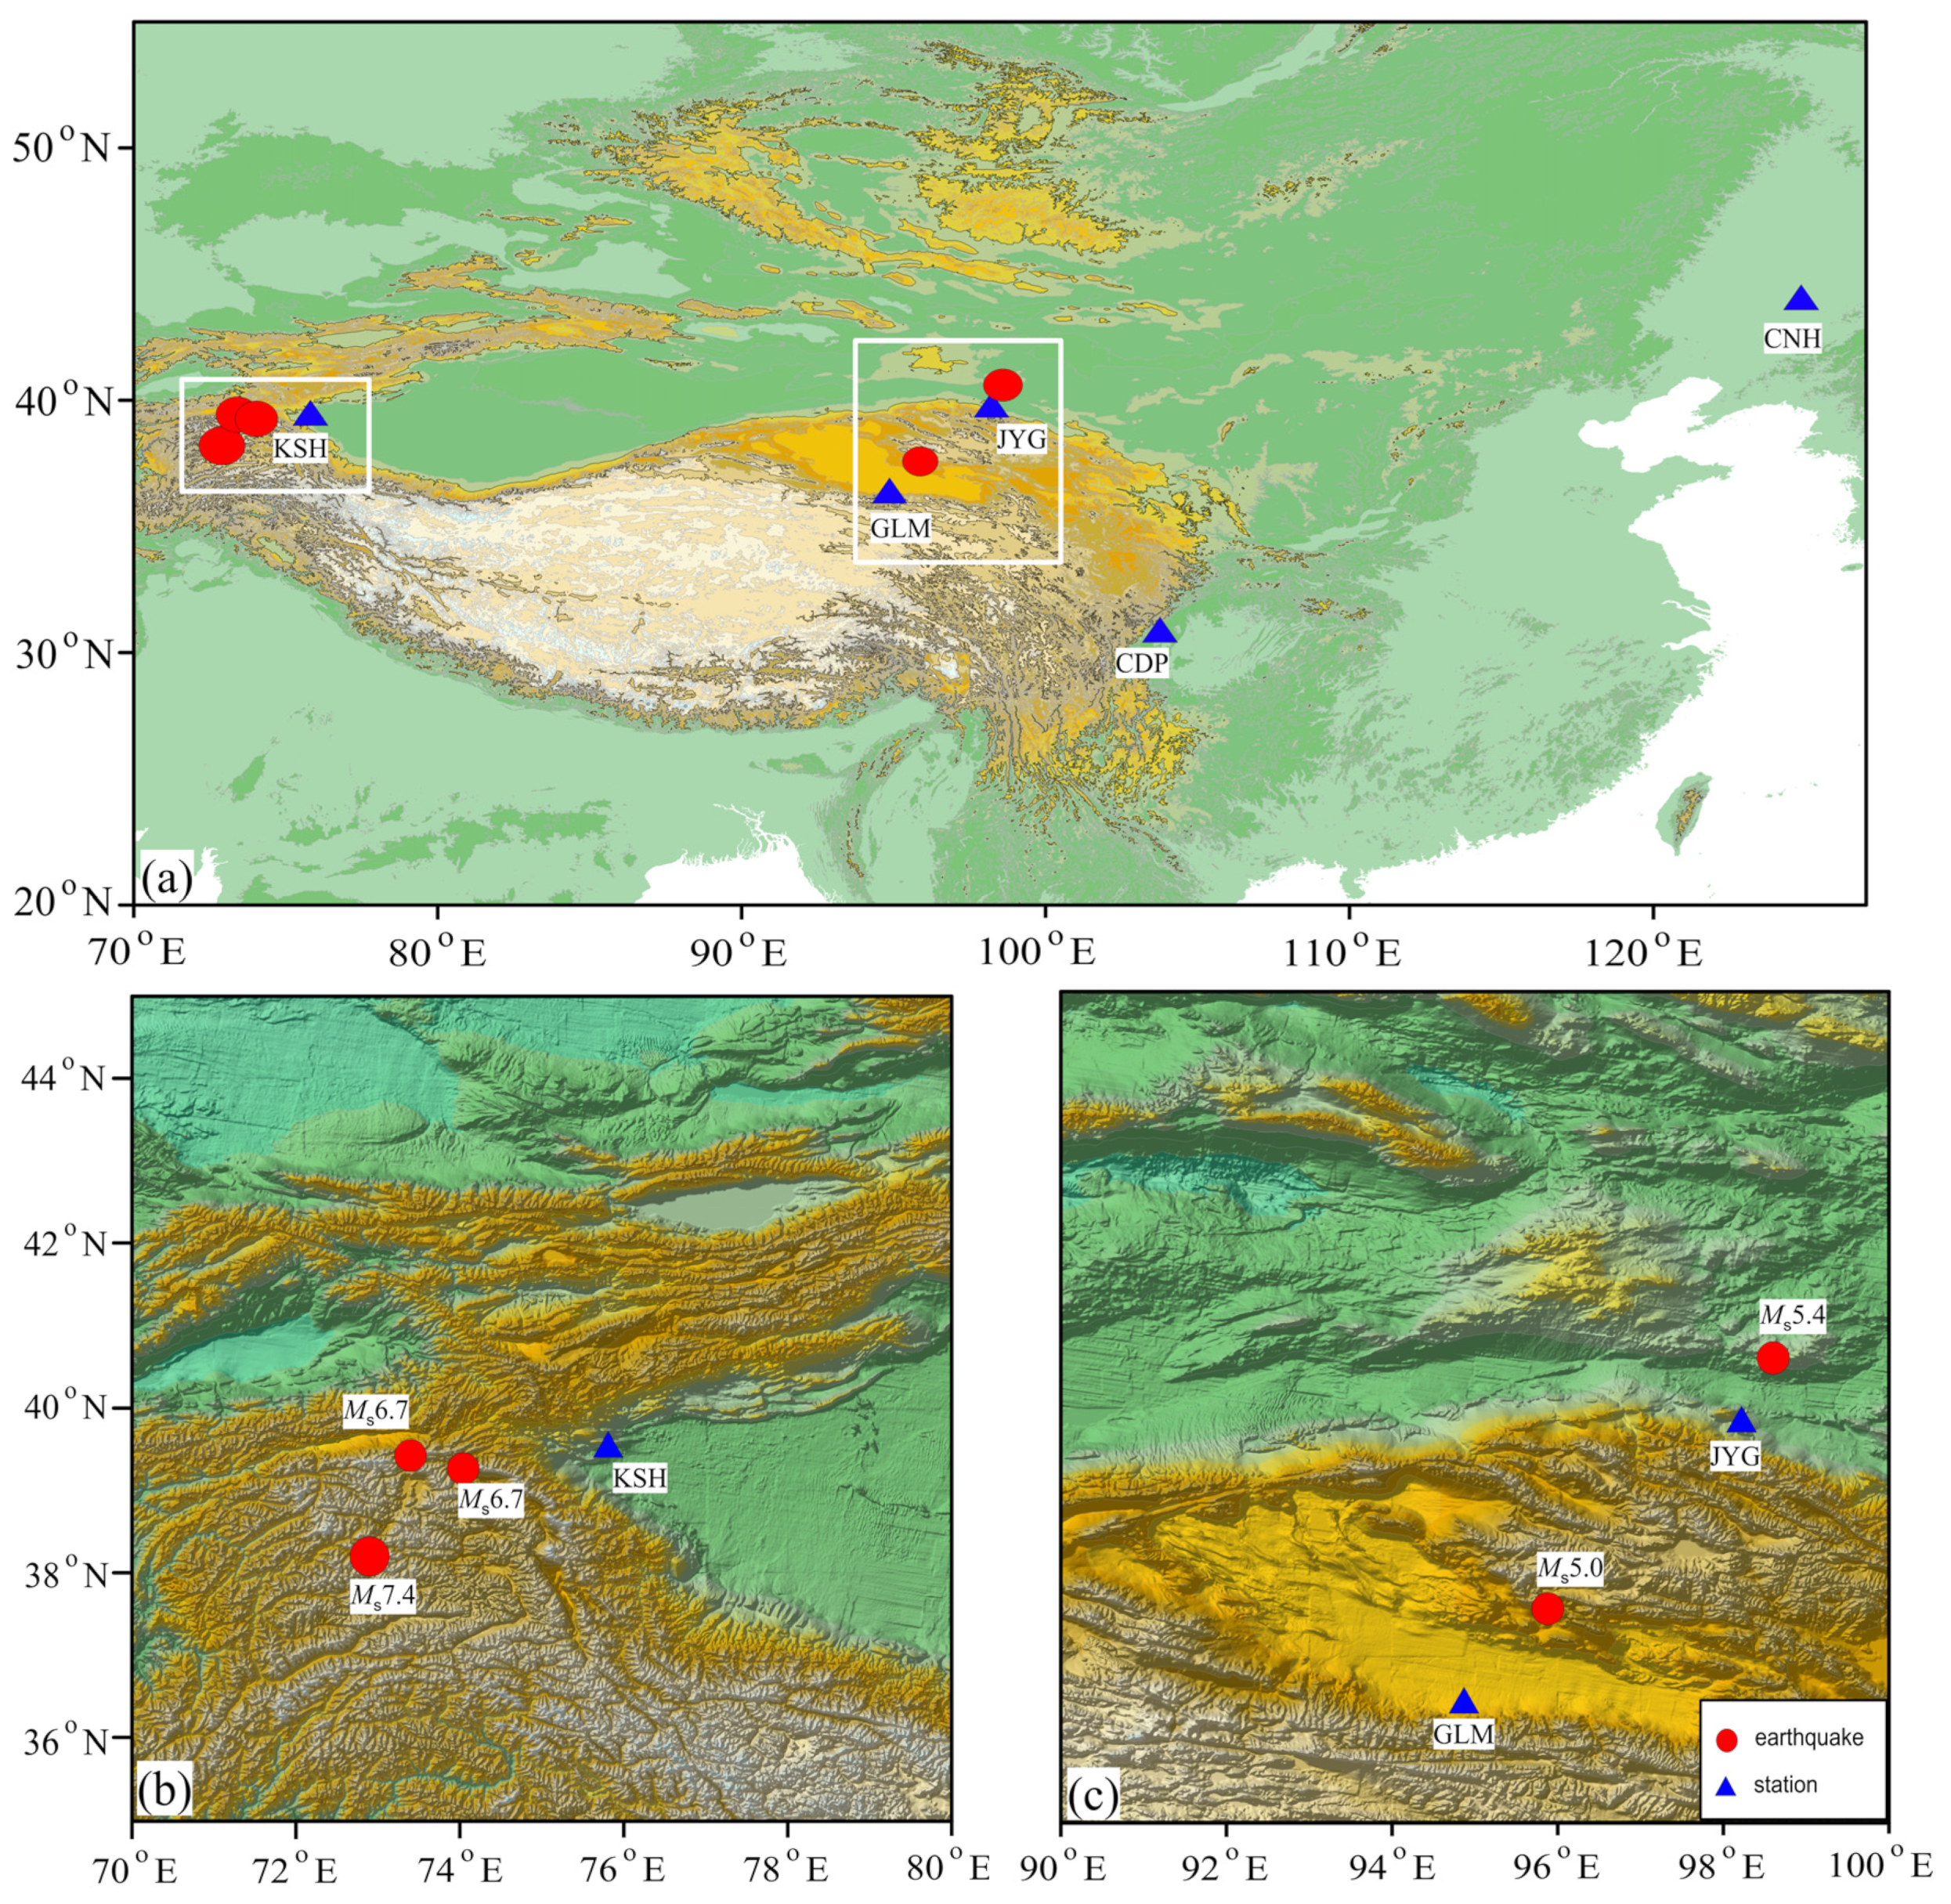
Figure 1. Distribution of geomagnetic stations and earthquakes at (a) the national scale, (b) KSH area, (c) JYG and GLM area.
Applsci 12 01680 g001
Figure 2. Polarization ratios of YZH at (a) JYG, (c) CNH observatories and YZG at (b) JYG, (d) CNH stations about 0.04 Hz from 2011 to 2012 and (e) Dst index.
Applsci 12 01680 g002
Figure 3. Polarization ratios of YZH at (a) GLM, (c) CNH stations and YZG at (b) GLM, (d) CNH observatories about 0.1 Hz during 2013 and (e) Dst index.
Applsci 12 01680 g003
Figure 4. Polarization ratios of YZH at (a) CDP, (b) GLM, and (c) CNH stations at approximately 0.1 Hz during 2013.
Applsci 12 01680 g004
Figure 5. Polarization ratios of YZH at (a) KSH, (c) CNH stations and YZG at (b) KSH, (d) CNH observatories within 0.003–0.02 from 2014 to 2017 and (e) Dst index.
Applsci 12 01680 g005
Figure 6. Scatter diagrams of magnitude and epicentral distance for (a) 37 and (b) 30 earthquakes.
Applsci 12 01680 g006
Table 1. Information of earthquakes and stations.
DateLon/oLat/oEpicenterMagnitude/MsDepth/kmStationDistance/km
18 June 200891.2035.30Zhiduo5.410GLM360
13 October 200873.9039.50Tajikistan5.38KSH164
10 November 200895.9037.60Haixi6.310GLM140
20 February 200978.6040.80Aheqi5.213KSH249
19 April 200978.3041.30Aheqi5.430KSH290
22 April 200977.3040.10Artush5.025KSH140
28 August 200995.9037.60Haixi6.610GLM160
7 September 201073.9039.50Uqia5.530KSH300
11 August 201177.2039.90Artush5.810KSH127
1 December 201177.0038.40Shache5.030KSH160
9 March 201281.4039.50Luopu5.930KSH480
3 May 201298.6040.60Jinta5.48JYG100
31 May 201278.8243.52Kazakhstan5.98KSH520
1 June 201275.1039.90Uqia5.07KSH75
11 August 201278.2040.00Artush5.29KSH210
29 January 201379.7042.60Kazakhstan6.120KSH480
30 January 201394.7032.90Zaduo5.120GLM390
12 February 201392.4038.50Haixi5.110GLM320
11 March 201377.5040.20Artush5.28KSH165
5 June 201395.8837.58Haixi5.04GLM155
30 June 201373.4139.22Tajikistan5.010KSH209
23 November 201375.7142.53Kazakhstan5.29KSH340
21 October 201376.9035.30Kashmir5.530KSH470
23 November 201375.7142.53Kyrgyzstan5.29KSH340
1 December 201378.9840.26Keping5.39KSH280
9 July 201478.2739.31Maigaiti5.18KSH220
14 November 201477.2742.16Kyrgyzstan5.710KSH330
10 January 201577.2740.21Artush5.010KSH150
3 July 201578.2037.60Pishan6.510KSH300
18 November 201573.0440.38Kyrgyzstan6.07KSH256
7 December 201572.9038.20Tajikistan7.430KSH291
26 June 201673.4039.43Kyrgyzstan6.710KSH207
17 October 201694.9332.81Zaduo6.29GLM400
25 November 201674.0439.27Aketao6.710KSH155
3 May 201771.5839.42Tajikistan6.230KSH380
5 May 201771.5039.45Tajikistan6.020KSH380
11 May 201775.2537.58Taxkorgan5.58KSH220
Publisher’s Note: MDPI stays neutral with regard to jurisdictional claims in published maps and institutional affiliations.