Abstract
Crowdsourced software engineering (CSE) is an emerging area that has been gaining much attention in the last few years. It refers to the use of crowdsourcing techniques in software engineering activities, including requirements engineering, implementation, design, testing, and verification. CSE is an alternative to traditional software engineering and uses an open call to which online developers can respond to and obtain work on various tasks, as opposed to the assigning of tasks to in-house developers. The great benefits of CSE have attracted the attention of many researchers, and many studies have recently been carried out in the field. This research aims to analyze publications on CSE using social network analysis (SNA). A total of 509 CSE publications from six popular databases were analyzed to determine the characteristics of the collaborative networks of co-authorship of the research (i.e., the co-authors, institutions involved in co-authorship, and countries involved in co-authorship) and of the citation networks on which the publications of the studies are listed. The findings help identify CSE research productivity, trends, performances, community structures, and relationships between various collaborative patterns to provide a more complete picture of CSE research.
1. Introduction
Crowdsourced software engineering (CSE) refers to the use of crowdsourcing techniques in software engineering [1,2]. Crowdsourcing can be used in different types of software engineering activities, including requirements, design, implementation, testing, and verification. It is performed by posting an open call to which online developers can respond and be hired to work on various tasks; it is an alternative to assigning tasks to in-house developers. Different crowdsourcing platforms have been designed to support and manage CSE tasks, including TopCoder, AppStori, and uTest. CSE reduces the time spent on an activity and its cost while enhancing the quality of software development.
Companies use crowdsourcing as an alternative to in-house development or outsourcing for different reasons. They may not have enough resources or expertise to develop a certain type of software. They may want to reduce the cost and duration of the software development process. They may also want to obtain the best solution from experts in a certain area or different solutions based on ideas from different people.
CSE generally includes three actors: requesters (clients), workers, and platforms. Requesters are the ones that need the software development task to be done, workers participate in the actual development and are responsible for performing the work, and platforms provide an online marketplace where requesters and workers can meet.
Although CSE is an emerging research area, it has been gaining increasing interest across the globe, and much research has already been published in this field [1,2,3]. However, there are a limited number of studies that outline and visualize the research trends in CSE, and these few studies simply evaluate and determine challenges for and potential improvements to CSE research [2,4].
This study aims to visualize and analyze CSE research using social network analysis (SNA) in order to understand research productivity, trends, performances, community structures, and relationships between various collaborative patterns and thus provide a more complete picture of the CSE research community. In particular, we aimed to study the social networks of co-authorship and citation of CSE research.
SNA is the process of investigating the social structure of relationships in networks and its impact on the behavior, attitudes, and performance of the individual actors or groups affected by this social structure [5,6]. SNA has been successfully used to better understand research in various fields, including medicine, sociology, information sciences, geography, and biology [7,8,9,10]. SNA has also been used to analyze the publications of researchers in the software engineering field to better understand research collaborations and trends [11,12].
This study contributes to the improvement of research in the field of CSE and promotes collaborative research among researchers in the field. It helps practitioners and researchers understand the current state of CSE research in the world and inspires them to conduct further research.
The study helps researchers to identify the most important authors in the field of CSE and the extent of their collaborations. This can encourage them to expand their network of contacts and collaborate with others from different institutions to improve their CSE research performance. In addition, it helps to identify the most important institutions and countries that have contributed significantly to CSE research and, therefore, improve the status of international collaboration. It also contributes to the field by presenting the most prominent and also the least interesting CSE research.
This paper is organized as follows: Section 2 presents a literature review of studies on the use of SNA in research and in the software engineering area in particular. Our research data and method are presented in Section 3, and Section 4 explains our research results. A discussion about the results and conclusions is provided in Section 5.
2. Literature Review
The use of social networks in scientific research has increased because of the growing interest in understanding the determinants of scientific production and to gain insights into collaborative patterns [13]. In this section, a literature review describes representative studies on the use of social networks in understanding scientific research in general and software engineering research in particular. For this purpose, we selected studies representing the application of SNA for visualizing and analyzing research in different fields, such as biology, tourism and hospitality, management and accounting, and software engineering, and for providing different types of research contributions, such as co-authorship networks and citation networks.
One study [14] analyzed the co-authorship network of parasitologists in terms of their research performance. It showed that the number of publications in the field of parasitology was high and increasing and that the network had a medium density, meaning that authors collaborated with each other to a moderate extent. Centrality metrics of SNA were used to measure authors’ centrality and the importance of author positioning within a network.
Khalid et al. [7] used SNA to analyze research collaborative patterns among UTM (i.e., university) researchers. SNA measures were used to find the most influential and reliable researchers. They found that some researchers preferred to work with their colleagues in the same department rather than other departments, and this resulted in fewer interdepartmental collaborations. Therefore, they suggested that researchers increase the rate of collaboration with other departments to improve their publication productivity and performance. SNA offered important insights on collaborative patterns at both the individual and institutional levels that could motivate the growth of academic disciplines, institutions, and regions [7].
Ye et al. [15] used SNA to analyze the six top tourism and hospitality journals to determine their cross-institutional collaborative networks. They concluded that there were important relationships between research performance and a university’s centricity position in networks. Bian et al. [8] used SNA to analyze biomedical research collaborative networks and gained an understanding of the generative techniques of research collaboration and identified collaborations that would be beneficial to researchers in the biomedical research community.
Dias et al. [16] examined the social network of co-authorship publications in management and accounting sciences in Brazil to determine how researchers’ importance was related to their research experience, gender, and geography. They found that male authors dominated prominent positions of the collaboration network. They occupied central positions more than women based on the number of direct links and collaborations. The research experience of authors was important in terms of establishing collaboration links, and academic degrees had a positive relationship with strong network centrality. Regarding geography, the author’s location was not important in terms of occupying a central position.
SNA has also been used in new research areas to determine the ways in which research collaboration advances the main research goals and to identify the leading groups in this new research area. For instance, Maia et al. [17] used SNA to analyze the co-authorship network of those researching the Zika virus. Their goal was to understand how scientists collaborated on research about this new disease and identify the leading Zika research groups and most influential researchers. The study revealed that the number of publications, diversified types of collaboration, and links established with the research area’s pioneers determined the influence of the researcher.
The other common model of using SNA is to understand citation networks. Citation networks are information networks in which nodes (publications, authors, or journals) are linked in citation-based relationships [18]. Citation networks can be used for analyzing the quality and development of research in a specific field, examining the literature on a research subject by identifying publications that have closely connected citation relationships and discovering how the publications of one researcher have influenced the publications of other researchers [19].
SNA was used also to identify influential literature cited by multiple publications; this identified the papers that were most central to the citation network. It offered a more accurate picture of the influential papers than counting the total number of citations of papers [20]. Kasurinena and Knutas [20] used SNA to find the core literature in gamification research by calculating centrality measures for the citation network.
Sugishita and Asakura [21] analyzed the citation network of vulnerability publications in the fields of transportation and complex networks. They proposed a framework for analyzing a citation network and applied it in their study. The study concluded that there was a lack of research in some transportation domains and that there were asymmetrical citation patterns and a lack of citation collaborations between publications in these fields.
There are plenty of research studies on applying SNA in software engineering research. Hassan and Holt [11] studied publications of researchers involved in the Working Conference on Reverse Engineering (WCRE) through co-authorship collaborative networks. They found that these networks had small world properties, which means that information and knowledge flowed easily in these communities. Bird et al. [22] built a collaborative network of research in 14 subareas of computer science, including software engineering, and analyzed collaborative patterns and applied network analysis metrics to determine how they were interrelated. They concluded that data mining and software engineering had many interdisciplinary aspects. Sarkar and Datta [12] studied the characteristics of research collaboration in software engineering publications using SNA. They found that collaboration in software engineering research increased from 1975 to 2010 and that research collaborations decreased when a research topic attracted researchers with similar backgrounds of publication.
Due to the remarkable interest in crowdsourced software engineering (CSE), there are currently many CSE studies from different authors, different countries, and different perspectives [1,2,4]. CSE research has increased and expanded in recent years owing to the growing interest in this field. Although several research papers have been published on CSE publications with the goal of determining potential improvements and challenges in the field [1,4], there are no current studies that use SNA to study CSE publications and author collaborations in this field.
3. Data and Methods
The main objective of this research was to study the social networks of co-authorship and citation in the field of CSE. The study analyzed collaborative networks of co-authorship (in terms of co-authors, institutional co-authorship, and country co-authorship networks) in the field of CSE in an attempt to understand their collaborative patterns and overall performance, examine their publication productivity, and identify the most important authors, institutions, and countries involved in CSE research. The citation network analysis helped to identify the most important works cited by publications found in a literature review.
This section presents the proposed approach, which involves a description of the SNA elements with which we were concerned in this paper along with the activities of data collection and data preparation.
3.1. Social Network Analysis
A social network is a network of relationships with two basic elements: nodes (actors or participants within the network) and the edges (ties, or links) connecting them [6]. In the network model, a node is represented by a circle, and the relationship between nodes is represented by an arrow or a line from the source node to the target node. Nodes can be people or whole organizations, and relationships can be collaborations, friendships, or links based on the exchange of information or knowledge [6]. Links can be directional, with the direction represented by an arrow, or nondirectional.
Social network analysis (SNA) is the process of investigating the social structure of relationships within networks and studying the impact of the structure on the behaviors, attitudes, and performances of individual actors or groups. Analyzing the structural characteristics of social networks using a set of metrics and theories leads to network analysis, which is used to understand the patterns of relationships between nodes to confirm an underlying social structure [5]. There are several implementations for SNA in different fields, including business, communications, information science, economics, physics, and biology.
Social networks have different properties and metrics that can be described as structural, rational, or functional properties [23,24,25]. Structural properties depend on the nodes and the relationships between the nodes. It includes factors such as the density and size of the social network. The rational characteristics are the links between pairs of nodes and can be described in terms of intensity, reciprocity, and multiplexity. Functional properties are transactional meanings, such as how two actors might deal with each other. Some of the most important social network properties are:
- Size: The number of nodes in a network.
- Density: The number of direct links in a network in proportion to the total number of possible links. It is a number between 0 and 1.0, and it indicates greater density if it is close to 1.0 and sparsity otherwise. It is 2 g/N (N − 1) where g is the number of links and N is the number of nodes in the network.
- Diameter: The shortest distance in a network.
- Tie strength: The strength of the link between nodes in a network. Nodes that are linked with each other will have high intensity, and intense ties tend to be situated within network clusters.
- Community detection: To help us to discover the communities that are collaborating the most in a network.
- Centrality: This includes a number of metrics that aim to determine the importance or influence of a given node in a social network. Centrality can be evaluated at both the individual level and the network level. At the individual level, it measures the proportion of individual relationships to other nodes in the network. At the network level, it measures the degree to which network links are concentrated in one, a few, or several nodes [26]. Some important centrality metrics are:
- Degree centrality: This is the simplest and most used metric. The degree centrality of a node is the number of direct links or ties from a node to other nodes [13]. The most popular and important node in the social network tends to have a high degree centrality because it has many ties to other nodes in the network.
- Closeness centrality: This is the sum of the length of the shortest paths of a given node to all other nodes in the network. The node with the fewest steps to all other nodes in the network will be the most central node with the highest metric of closeness centrality.
- Betweenness centrality: This is the number of shortest paths that pass through a given node. Nodes with high betweenness centrality have more control between the nodes in the network; that is, they have more influence over the flow of information within a network.
- Eigenvector centrality: This measures the importance of a given node based on its connections.
3.2. Data Collection
To extract relevant publications, we used electronic databases and conducted a keyword-based search. Data on CSE publications were collected from the six most popular databases: IEEE Xplore, ACM Digital Library, SpringerLink, ScienceDirect, Web of Science, and Scopus. Only scientific publications were considered.
The search extracted CSE publications until the end of 2020, with no specified start date. A list of search terms that had been used in previous studies [4] was also used in this research to extract all the publications from the above databases (Table 1). In order to reduce potential bias, two researchers judged the quality of papers and their resulting discussions. Three cycles of review and refinement were carried out by both researchers. After each cycle, both researchers met to discuss the results. The stages of the selection process and numbers of publications found are presented in Table 2.

Table 1.
Search terms.
Table 2.
Stages of the data collection process and numbers of publications found.
We searched the above strings in the fields of titles, abstracts, and index terms. We used Google Scholar to extract the citation count and to record which publications cited which articles so we could determine which articles to use in our citation network. Compared with the other databases, Google Scholar provides greater access to citation information [27] and, therefore, it has been used as a citation reference in a wide range of literature where the creation of citation networks was needed (e.g., [28,29]).
The search of the six databases returned 3430 publications. We screened these results by examining the metainformation on the publications and then manually filtered out publications not related to the field of CSE, resulting in 924 publications. Then, we removed duplicated publications that were indexed in multiple databases, resulting in 484 publications.
Finally, we conducted snowballing to identify any missing publications by searching the references of the included publications. We found 25 new publications and added them to our publication list. This stage resulted in 509 publications, each of which was given an identification (ID) designation (P1, P2, P3, …). They can be accessed using the link https://github.com/salyahya99/CSE-Publications/ (accessed on 1 February 2022).
3.3. Data Preparation
After collecting the data on publications, we prepared our data repository, which contained information on the collected publications (metadata). The data included the publication ID, title, authors, author affiliations, year of publication, author keywords, citation count, topic within the broad field of software engineering (e.g., software testing or coding), and type of publication (e.g., conference paper, journal article, book, or thesis). Data in our repository were then formatted for completion by filling in any missing data. Some authors had different names in different publications; for example, some of them included their middle name in some of their papers and not in other papers; therefore, authors’ names were consolidated, as this is critical for accurate linkage. We standardized keywords to remove different spellings of the same keyword, and the co-occurrence relationships between two keywords were identified. We retrieved the citation count of each work and manually checked that the publications from our repository cited this work. We identified citation relationships between each pair of publications. A publication category was assigned for each publication by reading the abstract and content when necessary. We defined publication categories based on how CSE was applied in the various software engineering phases [1]. Missing information regarding an author, an institution, or a country was found and added. We defined the collaborative relationships between each pair of authors, institutions, and countries, and the number of publications was calculated for each.
After that, we built two lists for each network, a node list and an edge list, by using the data repository. Each row in the node list represents a node in the network, and each row in the edge list represents the link between two nodes in the network. The node list contains the ID, label, and attributes of the nodes. The edge list contains the source node, target node, type of relationship (directed or undirected), and/or weight of relationship.
In a co-authorship network, the nodes represent authors and the links represent collaborations between authors of CSE publications. The nodes in an institutional co-authorship network represent authors’ institutions, and the links represent co-authorship collaborations between institutions. The country co-authorship network nodes represent authors’ countries, and the links represent CSE co-authorship collaborations between countries. In the CSE citation network, each node represents a CSE publication, and the link is directed because it represents the citation relationship direction between two publications.
After the social network lists had been prepared, we converted them into comma-separated values (CSV) files and imported them into the Gephi platform as input data for visualizing the CSE networks. Gephi [30] is an open source software that allows for network visualization and analysis as well as the calculation of network measures.
4. Results
In this section, networks of CSE publications were visualized and analyzed using the most important SNA metrics. This section includes an overview on the publications covered in this research, co-authorship network analysis, and citation network analysis.
4.1. Overview of Publications
The field of CSE was launched in 2008 by two publications, P178 and P311. Since then, the number of publications has increased rapidly, reaching 74 in 2019. The number of publications without international collaboration is nearly double the number with international collaboration. International collaborations for CSE publications has gradually increased over the years until 2015, when there were 26 such publications. Then, it fluctuated until 2020, when there were 19 publications. Although the number of publications in 2014 was not the highest of all years, the number of citations of CSE publications was the highest, at 405 citations. Table 3 and Figure 1 and Figure 2 summarize the statistics on the numbers of publications and citations.
Table 3.
Summary of the numbers of publications and citations from 2008 to 2020.
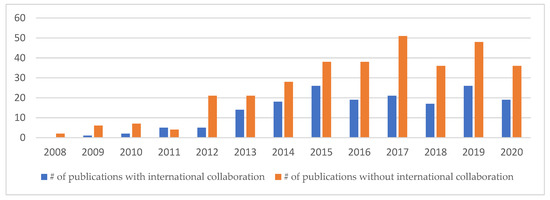
Figure 1.
Numbers of publications with and without international collaboration from 2008 to 2020.
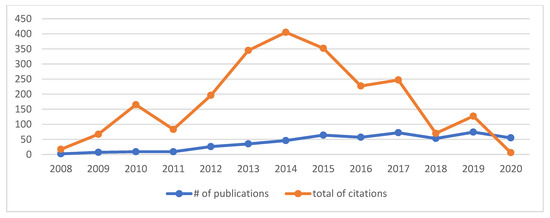
Figure 2.
Total numbers of publications and citations from 2008 to 2020.
4.2. Co-Authorship Network Analysis
4.2.1. Co-Authorship Network
The co-authorship network of CSE authors is shown in Figure 3. In this network, each node represents an individual author, and the undirected link that connects two authors represents the collaborative or co-author relationships in publications. The size of the network was 1081; there were 1081 nodes and 2391 links in the co-authorship network. The node size represents the number of publications, and thicker links indicate a higher frequency of research collaborations among authors. We used a force-directed layout to visualize the network and a label-adjusted layout to avoid overlaps and to make all labels legible. A force-directed layout visualizes the network by attracting the linked nodes to each other and pushing apart nonlinked nodes to the boundary of the network. Therefore, the most connected authors tend to be in the center of the network.
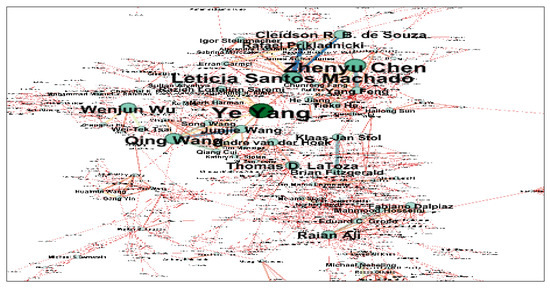
Figure 3.
Co-authorship network, https://github.com/Aalabduljabbar/CSE-Publications (accessed on 1 February 2022).
The density of the network is based on the percentage of links compared with the total possible links in the network. The degree of density of the co-authorship network was 0.004, which shows that the network contains only 0.4% of the total potential and possible relationships. This is a very small percentage considering the network size. The possibility for authors to connect and collaborate with every other author in the network is limited; thus, the speed of information and co-authorship is decreased.
Thicker and darker links in the network (Figure 4) represent the tie strength, which indicates the level of trust and the strength of the collaboration between authors. The most frequent collaborative authors of CSE co-authorship publications are shown in Table 4. Leticia Santos Machado had the darkest links with Rafael Prikladnicki and Cleidson R. B. de Souza, which means they were the authors that collaborated most frequently on CSE publications.
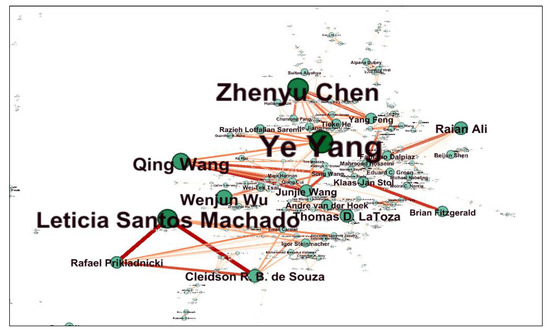
Figure 4.
Tie strength in CSE co-authorship networks.
Table 4.
The most frequently occurring co-author pairs.
Community detection helped us to discover the collaborative communities that worked together most frequently in the CSE co-authorship network. This was based on modularity, where authors were highly collaborative within these communities. Gephi supports Blondel’s algorithm for calculating modularity [31]. We used “resolution = 1.0” and “randomize” as parameters for modularity function. There were 137 communities in the CSE co-authorship network. Several of these research communities are identified in Figure 5, indicating that the authors in these communities had established a strong collaboration. Many authors worked with one or more highly productive authors, such as the communities of Raian Ali, Zhenyu Chen, Ye Yang, and Andre van der Hoek, where they were the central authors of their communities. Table 5 summarizes CSE author communities.
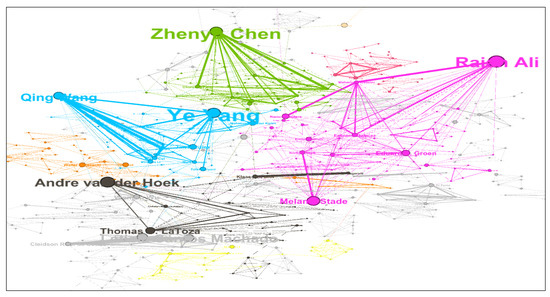
Figure 5.
Community detection in the co-authorship network.
Table 5.
Most frequent co-authorship network clusters.
We used the centrality measure to assess the collaborative patterns of individual authors. The degree centrality in the co-authorship network was used to identify the most popular and prominent authors. The authors with the most connections to different authors in the network were the most central authors and the most active collaborators in the field of CSE. According to the degree centrality (Table 6), Raian Ali (degree centrality = 32) had the highest co-authorship frequency with others, followed by Zhenyu Chen (degree centrality = 29) and Norbert Seyff (degree centrality = 28). They were the most popular authors in the field of CSE and had more opportunities for co-author publications because of the number of direct links they had. Notably, the most productive author (Ye Yang) was not the author with the most collaborations. This may have been due to her tendency to be a co-author with the same authors.
Table 6.
Degree of centrality of authors in the CSE co-authorship network.
The author with the highest betweenness centrality usually connects two or more large groups of authors. If the network does not have a high betweenness centrality, the connections in the network are interrupted. Raian Ali had the highest betweenness centrality (Table 7), which means he was a broker or mediator in the CSE co-authorship network, and he was followed by Andre van der Hoek and then Ye Yang.
Table 7.
Betweenness centrality of authors in the CSE co-authorship network.
Closeness centrality indicates that the author has short links to other authors in the network. The author with the highest closeness centrality in the CSE co-authorship network was Christoph Treude (Table 8). He was linked to the other authors by a low number of paths. Norbert Seyff had the highest eigenvector centrality, which means he had the highest level of importance and influence in the network, as shown in Table 9.
Table 8.
Closeness centrality of authors in the CSE co-authorship network.
Table 9.
Eigenvector centrality of authors in the CSE co-authorship network.
Finally, the SNA of the authors showed that the co-authorship network consisted of 1081 authors. Although the network clustering coefficient—which indicates the probability of any two researchers collaborating with each other—was 0.79, pointing to a relatively high willingness to collaborate with other authors of the network, the network had a low density, indicating low cohesion in the network. Only 0.04% of the total potential relationships in the network were actualized.
4.2.2. Institutional Co-Authorship Network
An institutional co-authorship network was produced based on the contributions of institutions in the CSE domain. This network included 324 nodes and 1362 links. The node size represents the total number of publications published by the institution, and the link represents collaborations on CSE publications. A thicker link is an indication of a higher frequency of research collaboration among institutions.
A total of 324 institutions published papers in the field of CSE. The CSE institutional co-authorship network is shown in Figure 6. Most of the nodes have self-loops, or links, that connect a node to itself, which means that authors from the same institution have collaborated. The link that connects different institutions indicates the presence of collaboration between these institutions. Notably, self-loops are the thickest links in the CSE institutional network, which implies that authors from the same institution tend to collaborate more among themselves than with authors from different institutions. Regarding collaborations between institutions, Table 10 shows that Passo Fundo University and Pontifical Catholic University, both in Brazil, were the most collaborative institutions in CSE publication co-authorships (frequency = 17), followed by the University of Chinese Academy of Sciences in China and York University in Canada (frequency = 13). Nanjing University in China and Bournemouth University in the United Kingdom had a co-authorship frequency of 12. Figure 7 shows the institutions with the most co-authorships on CSE publications.
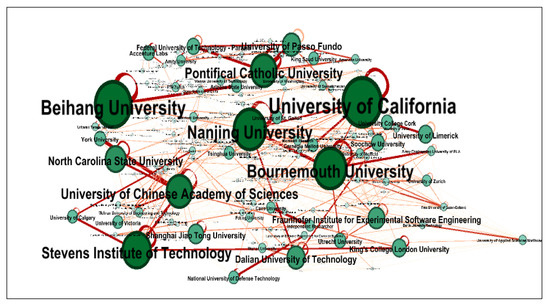
Figure 6.
Institutional co-authorship network.
Table 10.
Institutions involved most frequently in co-authorships.
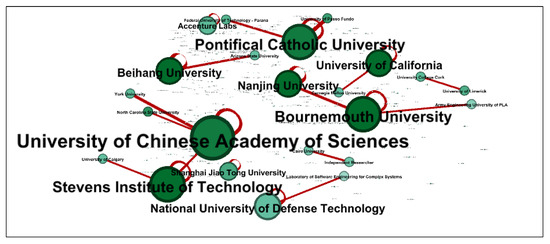
Figure 7.
Institutions most frequently involved in co-authorships.
We discovered the communities with the most collaborations in the CSE institutional co-authorship network by using a community detection algorithm in which institutions in the same cluster had established strong collaborations between them. There are several research clusters in the institutional co-authorship network, as shown in Figure 8. There were four core clusters, designated by the purple, green, blue, and gray clusters. Table 11 summarizes these clusters.
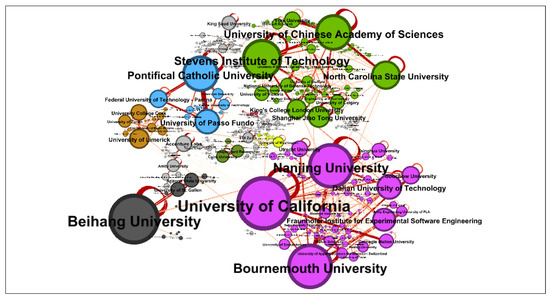
Figure 8.
Clustering of institutions involved in CSE co-authorships.
Table 11.
Clusters of institutions involved in co-authorships.
Centrality measures (Table 12) revealed that Bournemouth University in the United Kingdom had the highest numbers of collaboration degrees with different institutions (degree centrality = 24). Therefore, it was the most popular and prominent institution in CSE publications. It also had the highest betweenness centrality; thus, it occupied a key position in the network and may have connected research activities between different institutions. The second most popular institution in CSE research was the University of California in the United States, with a centrality degree of 22 and betweenness centrality of 0.07. The University of Applied Sciences in Northwestern Switzerland had the highest eigenvector centrality, indicating that it had a high influence on CSE publications (eigenvector centrality = 1). This institution collaborated efficiently with other institutions of the same collaboration level. It was followed closely by Bournemouth University, with an eigenvector centrality of 0.95.
Table 12.
Centrality measures of institutions in co-authorship networks.
4.2.3. Countries Involved in Co-Authorship Networks
Researchers from a total of 47 countries have published papers in the field of CSE. The country co-authorship network is shown in Figure 9. In this network, each node represents a country, and the undirected link between countries represents a collaboration in CSE publications. There were 47 nodes and 904 links in the country co-authorship network. The node size represents the number of publications, and thicker links indicate a higher frequency of research collaborations between countries.
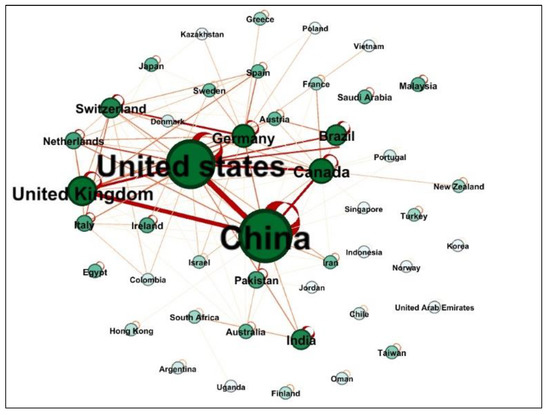
Figure 9.
Countries involved in co-authorship networks.
Figure 9 shows that most nodes have self-loops, which means there was co-author collaborations between authors of the same country. The link that connects different countries indicates the presence of an international collaboration. The thickest links in the CSE country network were self-loops, which implies that authors from the same country had a higher frequency of collaborations (national collaborations) in CSE publications than did authors from different countries. As seen in Table 4, most co-authors collaborated with another author from the same country; for example, Leticia Santos Machado from Brazil collaborated with Rafael Prikladnicki and Cleidson R. B. de Souza, who were also from Brazil.
Regarding international collaborations, authors from China have widely collaborated with those from the United States, with a co-authorship frequency of 53. This was followed by China and the United Kingdom, with a co-authorship frequency of 39. The countries that collaborated most frequently on CSE co-authored publications are listed in Table 13, and Figure 10 shows the links among the most collaborative countries.
Table 13.
Countries with the most co-authorships of CSE publications.
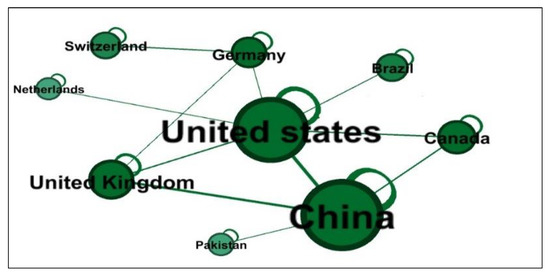
Figure 10.
Countries that collaborated most frequently on CSE authorships.
We used community detection to discover the countries that collaborated the most in the CSE co-authorship network. Countries in the same cluster were highly collaborative. Figure 11 shows the co-authorship clusters in the network. The largest clusters were the purple and green clusters. The purple cluster contained 20 countries, 3 of which were the most productive countries in CSE research (China, United States, and United Kingdom). The green cluster contained 12 countries, which were also highly collaborative, with Switzerland and Germany as the centers of this cluster.
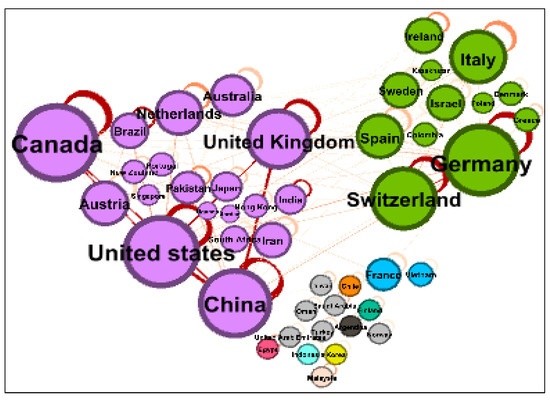
Figure 11.
Clustering of countries involved in CSE co-authorships.
Regarding centrality measures, China had the highest number of collaborations (degree = 398) (Table 14). Thus, China was the most popular and prominent country in CSE publications. The second most prominent country in CSE co-authorship was the United States (degree = 310), followed by the United Kingdom (degree = 156). These three countries, in addition to having a high productivity, were the most collaborative countries in CSE publications. They played a key role in the CSE research field. They were also the most influential countries in CSE research based on their eigenvector centrality. This means they collaborated efficiently with countries that had the same collaboration levels. China had the highest eigenvector centrality (1.00).
Table 14.
Centrality measures of countries involved in co-authorship networks.
In addition, China had the highest betweenness centrality (0.13), and it occupied a key position in the network and connected research activities between different countries. China was closely followed by the United States (betweenness centrality = 0.12) and Canada (betweenness centrality = 0.10). China also had the highest closeness centrality, meaning the authors in this country collaborated directly with authors from other countries. Figure 12 shows the country co-authorship network with the top co-author in each country.
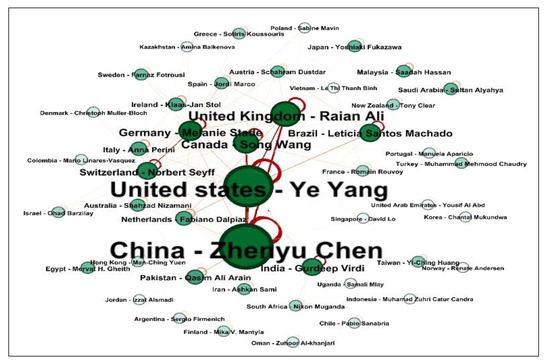
Figure 12.
Most frequently cited co-authorship networks showing the top co-author in each country.
4.3. Citation Network Analysis
We analyzed the citation network in the field of CSE to identify the most important publications cited by other publications in addition to the quantity and authority of references cited by publications. References to various publications may indicate the researchers’ performance. The citation network was also used to discover how the publication of one author could influence the publications of other authors in the field of CSE.
A total of 509 publications in the field of CSE were identified in our study. The top 10 most cited publications, according to the Google Scholar citation metric, are listed in Table 15. With regard to the citation frequency of publications, we included only the 509 retrieved publications.
Table 15.
The 10 most frequently cited CSE publications.
The CSE citation network is shown in Figure 13. Each node in this network represents a publication, and the type of link in this network is a direct link because it represents the citation relationship between publications, which connects a source citing a publication to the cited publication. Figure 14 shows the outgoing and ingoing links. There were 509 nodes and 2304 links in the citation network. The node size represents the citation frequency of the node publication. We filtered our network by using the filtering feature in Gephi to remove nodes that did not have any links. Thus, the number of nodes in the network decreased to 475 nodes, which means there were 36 publications that did not have any citation relationships, i.e., were not cited or cited by other publications. In addition, we identified 201 papers that were not cited by any publication from our dataset.
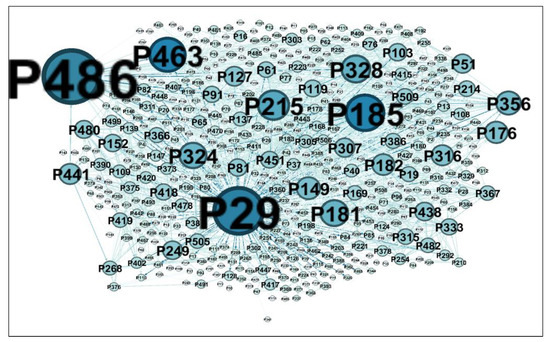
Figure 13.
The CSE citation network.
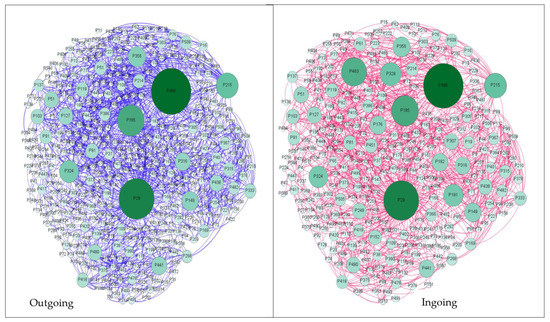
Figure 14.
Outgoing and ingoing links.
We used community detection to discover the clusters with the most collaborations in terms of citations in the CSE citation network; that is, publications that were often cited in other publications were in the same cluster. Several citation clusters in the CSE citation network are identified in Figure 15. These publications were highly cited in these clusters, and many publications in these clusters were cited by one or more of the top cited publications, which were central to these clusters, such as the clusters of publications P486, P29, and P181. Table 16 summarizes the CSE citation network clusters.
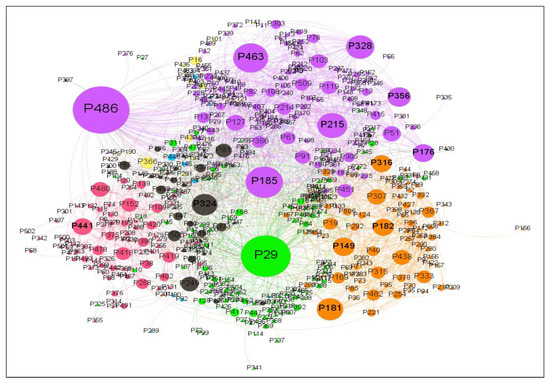
Figure 15.
Community detection of citation networks.
Table 16.
Clusters of citation networks.
P29 had the highest degree centrality (degree centrality = 197, ingoing links = 75, outgoing links = 122). This means it had the highest citation relationship with other publications in the network, indicating that it was frequently cited by other publications and that it cited many other publications. This was followed by P486 (degree centrality = 99) and P185 (degree centrality = 63). These publications were among the most cited publications. They were the most influential publications in the research field of CSE and had more opportunities to be cited. Betweenness centrality measures the frequency with which a given publication is cited to create a bridge between other publications. We inferred that P29 had the best position in the CSE research network because it had the highest betweenness centrality, as shown in Table 17. Eigenvector centrality computes the importance of a publication by determining how frequently it is cited in other important publications. The publications that cited the important publication could benefit from that citation and become more popular. P463 had the highest eigenvector centrality, followed by P328.
Table 17.
Centrality measures of citation networks.
Regarding publication categories, the most prominent category in our collection of CSE publications was the general category (42%). In it, publications mentioned the other categories, crowdsourcing platforms, CSE challenges, or other topics that were not unique to CSE categories (Figure 16). Seven of the top 10 most cited publications were in software engineering crowdsourcing in general. The second most popular category was testing (23%), followed by requirements (15%), coding (6%), maintenance (4%), and evolution (3%). There were few publications in the design and verification categories. Figure 17 and Table 18 show the number of publications in each category.
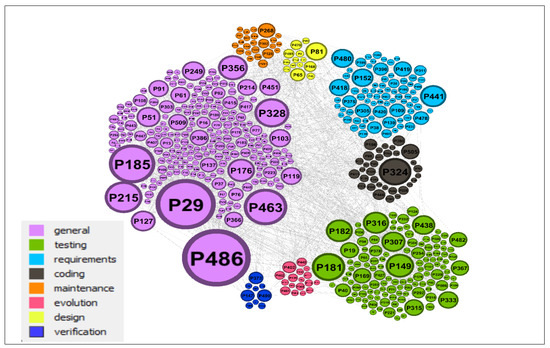
Figure 16.
Clustering of citation networks based on publication category.
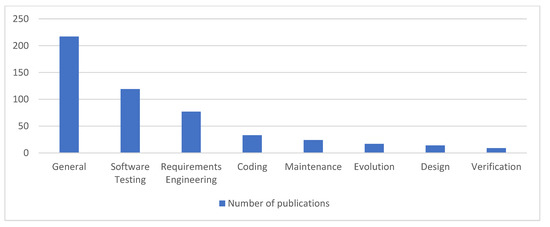
Figure 17.
Number of publications in each category.
Table 18.
Summary of clusters of categories.
5. Discussion and Conclusions
This study collected, cleaned, and analyzed two network datasets: co-authorship networks and citation networks for CSE publications. A total of 509 publications reporting on CSE research were retrieved. This study further examined the co-authorship network in terms of the author, country, and institution to investigate co-authorship collaborations and their impact on CSE research performance.
We also examined author performance in the co-authorship network of CSE using productivity and centrality measures. Ye Yang, Zhenyu Chen, and Leticia Santos Machado were the three most productive authors based on their number of publications. They were affiliated with the Stevens Institute of Technology in the United States, Nanjing University in China, and Pontifical Catholic University of Rio Grande do Sul in Brazil, respectively. In the degree centrality index, Raian Ali, Zhenyu Chen, and Norbert Seyff had the highest numbers of co-authorships with other authors. They were active authors in the network and used various collaborations to meet their research needs. We noted that not all of the highly productive authors were also the authors with the most collaborations. This may have been due to their tendency to co-author with the same authors. The degree centrality showed how authors who were linked to many others had a better performance than those with fewer links and had more opportunities to co-author CSE publications owing to the number of direct links they had.
Researchers can benefit from this study; they can expand their collaborative research in CSE by contacting people with the highest betweenness centrality because they are likely to be in the shortest path between two other authors. They also play an important role in controlling the flow of information in the network. Additionally, researchers can learn about the most important and influential authors from this study by looking at the findings on the highest closeness centrality and eigenvector centrality.
There were 324 institutions contributing to CSE-based research. The University of California, which published 30 papers involving 22 authors, was ranked as the most productive among all the identified universities/institutions. Its authors preferred to work with their colleagues from the same institution more than with those from other institutions. Therefore, it may be appropriate to suggest that authors expand their network of contacts and collaborate with others from different institutions to have an opportunity to improve their CSE research performance. Based on the centrality degree, Bournemouth University in the United Kingdom had the highest degree of collaboration. Its authors collaborated with authors from different institutions for CSE publications. However, we noted that the highest number of co-authoring collaborative institutions was in China, and most of these institutions cooperated with those in the United States. This may have been due to the number of Chinese authors affiliated with these institutions. For example, the most productive author, Ye Yang, who is of Chinese origin, is affiliated with the Stevens Institute of Technology in the United States.
To assess the international co-authorship of countries, the co-authorship network of countries was studied. There were 47 countries participating in publishing research on CSE. With respect to the distribution of CSE publications, most of them originated in China. We conclude that China is the leading country in CSE research, and it had made advancements in this field. Chinese authors play a dominant role in the field, followed closely by those from the United States. This may have been due to the fact that most of the CSE platforms are created in these two countries. China and the United States also had the highest numbers of international collaborations in CSE research between them, indicating that most Chinese authors collaborated in the field of CSE with US authors. They were the two core sources of CSE publications. International collaboration in the co-authoring of publications has a positive effect on the research performance. Based on centrality measures, China was a key node in this network and played an important role in forming a country co-authorship network.
Regarding national collaboration, we noted that authors from the same country tended to work together more than with those from other countries (international collaboration). Therefore, it may be appropriate to suggest that authors expand their network of contacts and collaborate with others from the leading countries to improve international collaboration and CSE research performance.
With regard to the CSE citation network, this study identified the top cited publications. Citations were adopted as the key indicator for measuring the impact of papers, However, the ranking of publications based on citations might not reflect the real citations of publications because of their variance in publication time, especially for publications that were recently published (the citation frequency of publications included only the 509 retrieved publications). We noted that the reason for frequent citation was the topic of the publication itself, and that comprehensive studies usually had more citations than other studies. We concluded that the most frequently cited publications were comprehensive studies that mainly discussed the basic concepts, definitions, advantages, challenges, and applications of CSE; therefore, they were basic and important publications in the field of CSE research. Authors who want to conduct basic research in the CSE field may need to read these references. Notably, most of the top cited publications were authored by multiple authors, and this reveals the importance of co-authorship and its effect on the quality of a publication.
Regarding publication categories, the most prominent category of CSE publications was publications on general topics in the field; this type of publication mentioned the other CSE categories, crowdsourcing platforms, CSE challenges, or other topics that did not focus on a specific CSE category. The second most prominent category was software testing, followed by requirements engineering. There were only a few publications in the design and verification categories; we encourage doing research on these least researched topics. In addition, based on publications from the last couple of years, we conclude that crowdsourcing software testing has recently been the most prevalent topic. This may have been due to the major use of crowdsourcing in software testing.
The number of publications in the field of CSE has increased rapidly over the years, but it decreased in 2018. In 2019, it increased again but dropped again in 2020; this may have been due to the COVID-19 pandemic, which began in that year and caused most conferences to be cancelled. As we mentioned earlier, although the number of publications in 2014 was lower than many other years, the publications from 2014 received the highest citation numbers (405 citations), and this indicates that the most important and prominent publications, such as P486, were published in this year.
It is widely believed that the main limitations in the use of SNA are the potential time and resources associated with data collection [32]. In our case, the data collection and preparation took a considerable amount of time. Compared with other types of SNA research that require data collection from surveys or exhaustive interviews, collecting data on publications was reasonably faster due to the capabilities of search engines included in the websites of the databases used in this study. The obstacles we encountered in our collection were mainly associated with cleaning the publication data and collecting the citation data.
Another limitation of applying SNA in this research is that citation measures show the impact of research rather than judging its quality [19]. Although quality affects the impact, this can also be affected by other factors [33,34,35] (e.g., review papers are likely to have a higher impact because they normally cover a larger number of topics).
Nevertheless, this study provides useful information for those interested in performing more research in the field of CSE. The findings will help researchers enhance their future research in this field and help them collaborate with the most important authors to utilize research resources.
In terms of future work, because research collaborative networks are dynamic and can quickly evolve over time, this study could be expanded by involving more databases, extracting more publications, and expanding our work by using other attributes, such as gender or academic degree of the authors, to study their effects on the collaborative relationship between authors in CSE. Moreover, expanding our work to construct different types of networks, such as publication funding networks, journal citation networks, author citation networks, and networks of publications that focus on specific categories of software engineering, can provide richer information.
Author Contributions
A.A. and S.A. have contributed equally to all the research elements involved in this study. All authors have read and agreed to the published version of the manuscript.
Funding
This research was funded by the Deanship of Scientific Research at King Saud University, grant number (RG-1436-039).
Institutional Review Board Statement
Not applicable.
Informed Consent Statement
Not applicable.
Data Availability Statement
Not applicable.
Acknowledgments
The authors would like to extend their sincere appreciation to the Deanship of Scientific Research at King Saud University for its funding this research-Group No (RG-1436-039).
Conflicts of Interest
The authors declare no conflict of interest.
References
- Tsai, W.T.; Wu, W.; Huhns, M.N. Cloud-based software crowdsourcing. IEEE Internet Comput. 2014, 2014, 78–83. [Google Scholar] [CrossRef]
- Mao, K.; Capra, L.; Harman, M.; Jia, Y. A Survey of the Use of Crowdsourcing in Software Engineering. J. Syst. Softw. 2017, 15, 1. [Google Scholar] [CrossRef]
- Alyahya, S.; Alsayyari, M. Towards better crowdsourced software testing process. Int. J. Coop. Inf. Syst. 2020, 29, 2040009. [Google Scholar] [CrossRef]
- Alyahya, S. Crowdsourced software testing: A systematic literature review. Inf. Softw. Technol. 2020, 127, 106363. [Google Scholar] [CrossRef]
- Qi, X.; Fuller, E.; Wu, Q.; Wu, Y.; Zhang, C.Q. Laplacian centrality: A new centrality measure for weighted networks. Inf. Sci. 2012, 194, 240–253. [Google Scholar] [CrossRef]
- Borgatti, S.P.; Mehra, A.; Brass, D.J.; Labianca, G. Network analysis in the social sciences. Science 2009, 323, 892–895. [Google Scholar] [CrossRef]
- Khalid, N.H.; Ibrahim, R.; Selamat, A.; Kadir, M.R.A. Collaboration patterns of researchers using Social Network Analysis approach. In Proceedings of the 2016 IEEE International Conference on Systems, Man, and Cybernetics (SMC), Budapest, Hungary, 9–12 October 2016. [Google Scholar] [CrossRef]
- Bian, J.; Xie, M.; Topaloglu, U.; Hudson, T.; Eswaran, H.; Hogan, W. Social network analysis of biomedical research collaboration networks in a CTSA institution. J. Biomed. Inform. 2014, 52, 130–140. [Google Scholar] [CrossRef][Green Version]
- Vasudevan, R.K.; Ziatdinov, M.; Chen, C.; Kalinin, S.V. Analysis of citation networks as a new tool for scientific research. MRS Bull. 2016, 41, 1009–1016. [Google Scholar] [CrossRef]
- Zhao, X. A scientometric review of global BIM research: Analysis and visualization. Autom. Constr. 2017, 80, 37–47. [Google Scholar] [CrossRef]
- Hassan, A.E.; Holt, R.C. The small world of software reverse engineering. In Proceedings of the 11th Working Conference on Reverse Engineering, Delft, The Netherlands, 8–12 November 2004. [Google Scholar] [CrossRef]
- Sarkar, S.; Datta, S. Inferring the untold: Mining software engineering research publication networks. Infosys Lab Brief. 2014, 12, 88. [Google Scholar]
- Scott, J. Social Network Analysis; SAGE Publications Ltd.: London, UK, 2017. [Google Scholar]
- Sadoughi, F.; Valinejadi, A.; Shirazi, M.S.; Khademi, R. Social network analysis of Iranian researchers on medical parasitology: A 41 year co-authorship survey. Iran. J. Parasitol. 2016, 11, 204. [Google Scholar] [PubMed]
- Ye, Q.; Song, H.; Li, T. Cross-institutional collaboration networks in tourism and hospitality research. Tour. Manag. Perspect. 2012, 2, 55–64. [Google Scholar] [CrossRef]
- Dias, A.; Ruthes, S.; Lima, L.; Campra, E.; Silva, M.; Bragança de Sousa, M.; Porto, G. Network centrality analysis in management and accounting sciences. RAUSP Manag. J. 2020, 55, 207–226. [Google Scholar] [CrossRef]
- Maia, L.F.M.P.; Lenzi, M.; Rabello, E.T.; Oliveira, J. Scientific collaboration in Zika: Identification of the leading research groups and researchers via social network analysis. Cad. Saude Publica 2019, 35, 1–21. [Google Scholar] [CrossRef]
- Popp, J.; Balogh, P.; Oláh, J.; Kot, S.; Rákos, M.H.; Lengyel, P. Social network analysis of scientific articles published by food policy. Sustainability 2018, 10, 577. [Google Scholar] [CrossRef]
- Zhao, D.; Strotmann, A. Analysis and Visualization of Citation Networks. Synth. Lect. Inf. Concepts Retr. Serv. 2015, 7, 1–207. [Google Scholar] [CrossRef]
- Kasurinen, J.; Knutas, A. Publication trends in gamification: A systematic mapping study. Comput. Sci. Rev. 2018, 27, 33–44. [Google Scholar] [CrossRef]
- Sugishita, K.; Asakura, Y. Citation network analysis of vulnerability studies in the fields of transportation and complex networks. Transp. Res. Procedia 2020, 47, 369–376. [Google Scholar] [CrossRef]
- Bird, C.; Barr, E.; Nash, A.; Devanbu, P.; Filkov, V.; Su, Z. Structure and dynamics of research collaboration in computer science. In Society for Industrial and Applied Mathematics, Proceedings of the 9th SIAM International Conference on Data Mining, Proceedings in Applied Mathematics; Society for Industrial and Applied Mathematics: Sparks, NV, USA, 2009. [Google Scholar] [CrossRef]
- Schreiber, R.R.; Zylka, M.P. Social Network Analysis in Software Development Projects: A Systematic Literature Review. Int. J. Softw. Eng. Knowl. Eng. 2020, 30, 321–362. [Google Scholar] [CrossRef]
- Wasserman, S. Social Network Analysis: Methods and Applications: Social Network Analysis: Methods and Applications; Cambridge University Press: Cambridge, UK, 1994; Volume 24. [Google Scholar]
- Freeman, L.C. Centrality in social networks conceptual clarification. Soc. Netw. 1978, 1, 215–239. [Google Scholar] [CrossRef]
- Newman, M. Networks: An Introduction; Springer: Berlin/Heidelberg, Germany, 2010. [Google Scholar]
- Dawson, S.; Gašević, D.; Siemens, G.; Joksimovic, S. Current state and future trends: A citation network analysis of the learning analytics field. In Proceedings of the Fourth International Conference on Learning Analytics and Knowledge, Indianapolis, IN, USA, 24–28 March 2014; pp. 231–240. [Google Scholar]
- Lecy, J.D.; Beatty, K.E. Representative literature reviews using constrained snowball sampling and citation network analysis. SSRN Electron. J. 1992, 1–15. [Google Scholar] [CrossRef]
- Martín-Martín, A.; Orduna-Malea, E.; Thelwall, M.; López-Cózar, E.D. Google Scholar, Web of Science, Scopus: A systematic comparison of citations in 252 subject categories. J. Informetr. 2018, 12, 1160–1177. [Google Scholar] [CrossRef]
- Bastian, M.; Heymann, S.; Jacomy, M. Gephi: An Open Source Software for Exploring and Manipulating Networks. In Proceedings of the Third International AAAI Conference on Weblogs and Social Media, San Jose, CA, USA, 17–20 May 2009. [Google Scholar] [CrossRef]
- Blondel, V.; Guillaume, J.; Lambiotte, R.; Lefebvre, E. Fast unfolding of communities in large networks. J. Stat. Mech. Theory Exp. 2008, 2008, P1000. [Google Scholar] [CrossRef]
- Carter, C.R.; Ellram, L.M.; Tate, W. The use of social network analysis in logistics research. J. Bus. Logist. 2007, 28, 137–168. [Google Scholar] [CrossRef]
- Didegah, F.; Thelwall, M. Which factors help authors produce the highest impact research? Collaboration, Journal and document properties. J. Informetr. 2013, 7, 861–873. [Google Scholar] [CrossRef]
- Frenken, K.; Hölzl, W.; de Vor, F. The citation impact of research collaborations: The case of European biotechnology and applied microbiology (1988–2002). J. Eng. Technol. Manag. 2005, 22, 9–30. [Google Scholar] [CrossRef]
- Lee, S.; Bozeman, B. The impact of research collaboration on scientific productivity. Soc. Stud. Sci. 2005, 35, 673–702. [Google Scholar] [CrossRef]


Publisher’s Note: MDPI stays neutral with regard to jurisdictional claims in published maps and institutional affiliations. |
© 2022 by the authors. Licensee MDPI, Basel, Switzerland. This article is an open access article distributed under the terms and conditions of the Creative Commons Attribution (CC BY) license (https://creativecommons.org/licenses/by/4.0/).