Article

The Usefulness and Limitations of Ultrasonic Lamb Waves in Preventing the Failure of the Wind Turbine Blades

by
Lina Draudvilienė
1,
Asta Meškuotienė
2,
Renaldas Raišutis
1,3,*,
Paulius Griškevičius
4,
Žaneta Stasiškienė
5 and
Egidijus Žukauskas
1
1
Ultrasound Research Institute, Kaunas University of Technology, K. Baršausko St. 59, LT-51423 Kaunas, Lithuania
2
Metrology Institute, Kaunas University of Technology, Studentų St. 50, LT-51368 Kaunas, Lithuania
3
Department of Electrical Power Systems, Faculty of Electrical and Electronics Engineering, Kaunas University of Technology, Studentų˛ St. 48, LT-51367 Kaunas, Lithuania
4
Department of Mechanical Engineering, Kaunas University of Technology, Studentų˛ St. 56, LT-51424 Kaunas, Lithuania
5
Institute of Environmental Engineering, Kaunas University of Technology, Gedimino St. 50, LT-44239 Kaunas, Lithuania
*
Author to whom correspondence should be addressed.
Appl. Sci. 2022, 12(4), 1773; https://doi.org/10.3390/app12041773
Submission received: 27 December 2021 / Revised: 4 February 2022 / Accepted: 7 February 2022 / Published: 9 February 2022

Abstract

:
The Lamb waves are named one of the promising solutions for future wind turbine blade (WTB) failure prevention. The compliance with safety assurance of WTBs by detecting structural changes during the manufacture and performing their monitoring during the service life are effective tools for environmental sustainability. This work presents the basic characteristics of Lamb waves and highlights two main unusual limitations—the dispersion and an infinite number of modes—as a great challenge that complicates the application of such waves. This requires the investigation and development of new signal processing methods (SPMs) for conducting accuracy assessments according to the requirements of ISO 17025. The general principles for the accuracy assessment of the signal processing methods applied to evaluate the dispersion of Lamb waves are presented here, and a suitable procedure for estimation of errors and uncertainties is proposed. These should facilitate the verification analysis of any signal processing method used for the dispersion evaluation of Lamb waves. This information allows determining parameters that define the measurement reliability and facilitates the application and utilisation of the proposed methods and their choice. Moreover, it is a necessary prerequisite for setting reliable testing, inspecting, and monitoring standards for WTBs certification.

1. Introduction

Wider use of clean and renewable energy resources, which ensure near-zero greenhouse gas emissions, as opposed to burning fossil fuels, is a way to ensure future sustainability worldwide. The European Union (EU) has approved policies that aim to raise the total energy generation from renewables across the EU by 2030 to 27%, and many governments and corporations have pledged to use only clean energy by 2050 [1,2,3,4]. Recently, wind energy has been identified as one of the most sustainable, mature, environmentally friendly, cheapest, and commercially developed renewable energy sources. Based on the technical, economic, social, and environmental criteria, the evaluation index system of a wind farm was established [5,6]. As a result, a large number of wind farms are being installed, and their number is constantly growing [7,8,9]. The wind farms in Europe have generated 458 TWh of electricity and covered 16% of the electricity demand in 2020. Approximately 220 GW of wind power capacity are installed in Europe, but it is expected that Europe will be able to use 105 GW of the new wind power capacity installed over the next five years [10]. In addition, the rapid development of technology is changing the geometry and capacity of wind turbines. Combining a bigger rotor, longer blades, and higher capacity factor allows generating more power. Thus, the blade length has been prolonged from 18 m in a 0.1 MW turbine in the year 1985 to around 107 m in a 12 MW offshore turbine in the year 2017 [11,12]. However, this development means that the world faces an environmental challenge due to the increasing number of WTBs being replaced and the mass of decommissioned WTB composite material.
In recent decades, since 1958, when the WTB was first made of glass fibre-reinforced plastic (GFRP), composite materials have become widely used in the manufacture of WTB [13,14]. Glass fibre plastics (GFRPs) and carbon fibre-reinforced plastics (CFRPs) are commonly used in the manufacture of WTBs and constitute the majority of the blade material [15]. Due to the specific stiffness and strength, superior fatigue and corrosion resistance, and flexibility in design and manufacturing, the utilisation of these materials has increased significantly and keeps constantly increasing [13,14,15]. Such properties were achieved by curing composites. Then the polymers became cross-linked; however, this process is irreversible and complicates recycling such material [13]. Typically, the service life of the WTBs is approximately 20–25 years; after this term passes, they should be renewed, or their service life expires [16]. Various factors influence the expiration of the service life of WTB, for instance, defects occurring during the manufacture of WTBs and their operating service life. About 85% of turbine components such as steel, copper wire, electronics, and gearing can be recycled or reused [3]. However, the WTBs consist of different materials and elements: the complex fibre composites with multilayer structures bonded by an adhesive. Separating such materials is an extremely difficult task [17,18]. The study conducted in Sweden shows that significant waste amounts of WTBs will arise in the future [19]. The waste of blade material is expected to grow, with ~12% increase per year until around 2026, and then 41% per year until 2034, reaching 28,100 tons [19]. With the number of WTBs disposal increasing, most of them are left to accumulate in landfills or some blades are burned [3,17]. According to the ‘Waste Framework Directive’ of the European Union, waste prevention is a preferred option, and sending waste to landfills should be the last resort [20]. The waste hierarchy according to the ‘Waste Framework Directive’ of the European Union [7] is presented in Figure 1.
For this reason, inspection and maintenance activities should be applied to extend the service life of turbines. [9]. During the production, it is necessary to carry out tests, inspections, and monitoring, as well as to install the service phase [21]. The prevention maintenance should be realised on a regular basis for a reliability-and-risk inspection strategy [17]. Thus, the long-term goal is to develop reliable methods for testing, verification, and monitoring, which could estimate the severity of damage to the residual life of WTBs [11].
However, due to the very complex WTB construction, which consists of different layers with different thicknesses and the anisotropic materials used in their manufacturing, the WTBs are difficult to monitor. Generally, the research in WTB is based on nondestructive testing (NDT), which is used for fault detection and diagnosis. Because NDTs can detect both surface and internal faults in WTBs, it is applied in structural health monitoring (SHM) systems for solving the preventive maintenance tasks for safety and failures [22]. Therefore, numerous different techniques, algorithms, and structural health monitoring devices for damage detection and identification of potential failure of WTBs have been developed over the last decades. The SHM of blades can be performed applying strain measurements (strain gauges, fibre optic cables, photogrammetry with full-field strain measurement), fatigue and modal properties monitoring, ultrasonic methods, acoustic emissions, thermography, impedance techniques, embedded conductive nanoscale particles, etc. [23,24,25].
Acoustic emission (AE) can be a very informative diagnostic tool for detecting early damage events but requires a high number of distributed sensors and has a high sensitivity to background noise. However, embedded at the root of the blades can be an effective tool to monitor the overall structural integrity of the blades [26]. Even though active thermography is fast and cost effective, using it for large structures is impractical due to active external heating. The passive thermography under lab conditions under fatigue testing can be very effective to detect various types of progressive damage remotely, but incorporating such external factors as solar radiation, variation of environment temperatures, wind, etc., in real conditions [27] is still challenging. Strain measurements can reflect the overall accumulated damage of the blade due to the stiffness loss, but it limits the possibility to indicate critical structural failure [28].
The ultrasonic technique is mostly used in NDT, and one of the promising tools of the ultrasonic technology is based on Lamb waves and applied in both NDT and SHM task solutions [11,22]. Lamb waves are used for detecting structural changes during WTB production and applied in monitoring structural changes during the service life of WTB [22,29]. Such a wide range of Lamb wave applications lies in their unusual properties and behaviour. Properties such as an infinite number of modes and the ability to propagate long distances extend the application areas of such waves. One of the key points of the proposed approach is the property of Lamb waves to propagate large distances with a small attenuation. Leakage losses of Lamb waves in WTB structures are very low as well; therefore, it is possible to investigate large areas of structures in a quick and reliable way. On the other hand, such properties as dispersion, infinite number of modes, the convergence of modes, and interlaced modes affect the changes in propagating signal and complicate the use of such waves. As a result, the common signal processing methods (SPMs) are not suitable for the analysis of Lamb wave signals. In order to acquire the required information, specific algorithms should be developed [22], which could recognise and separate different modes of Lamb waves in the whole wave train of the signals. That is why developing new signal processing methods is an important and necessary task. However, the development and implementation of new signal methods is an ambitious task, as it should include not only the creation of an algorithm and its study using different types of objects but also evaluation of their reliability. In accordance with the protocols and requirements specified in [30,31], each measurement method must be reliable, accurate, and precisely tailored to the intended purpose. Thus, the feasibility of the proposed method should be executed after its development to determine the performance characteristics [32]. The basic characteristics developed for assessing the reliability of the SPMs and the influence factors of the combined uncertainty should be indicated. The presentation of such information would facilitate the application and utilisation of the proposed methods and their choice for completing a certain task.
The main goal of this work is to present Lamb waves as one of the most promising tools for safety assurance of WTBs that detect defects during manufacture and perform monitoring of structural changes during the WBTs service life. In addition, to demonstrate that the special SPMs are used for the analysis of Lamb waves signals only in the investigation stage in order to develop standards for WTBs certification.
The work aims to:
-
Highlighting the main shortcomings of the SPMs used for the analysis of Lamb waves that complicate the preparation process of reliable testing, inspection, and monitoring standards for WTBs certification.
-
Present the main conditions and impact factors of the combined uncertainty, which are necessary to be performed for the verification and accuracy assessment of the SPMs according to the requirements of ISO 17025.
The arrangement of the article is organised as follows. Typical defects in the construction of the WTB and methods for safety and quality assurance based on ultrasonic Lamb waves are presented in Section 2. Section 3 presents the results related to limitations of Lamb waves application and reliability evaluation of SPMs. The concluding remarks are presented in the Section 4.

2. Materials and Methods

2.1. Defects of WTBs and Detection Methods
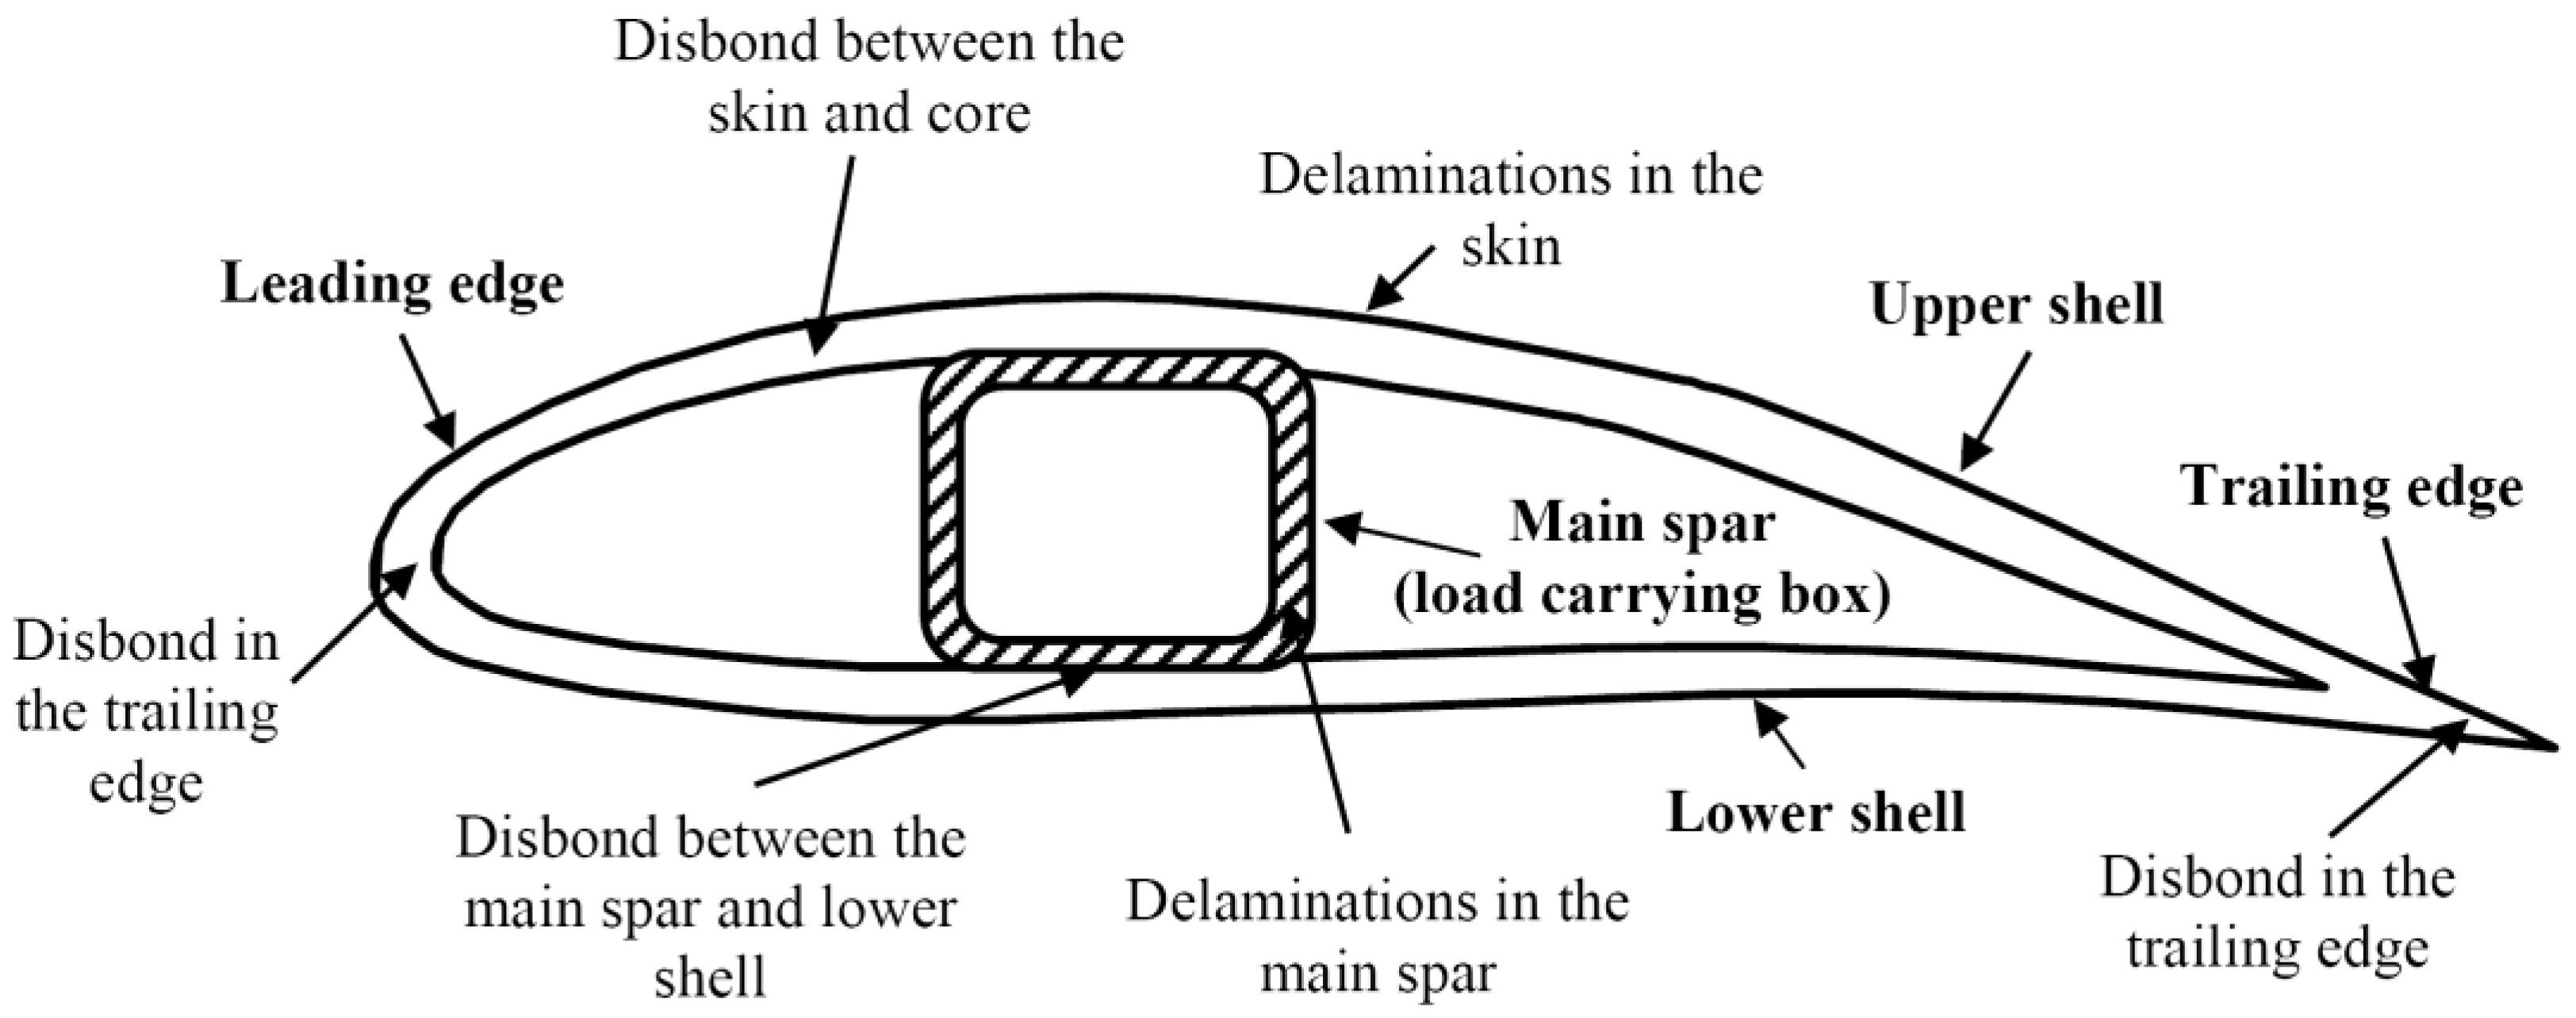
2.1.1. Defects

The main requirement for WTBs is the long fatigue life. Therefore, the structure has to sustain 108–109 load cycles before failure if the turbine is designed for 25 years of operation [33]. Taking that into account, the polymer composites, which are made of strong, stiff, lightweight, corrosion-resistant, dielectric materials, are the most practical and prevalent choice for the manufacture of the WTBs [33]. However, due to the ever-increasing WT dimensions of blades, the gravity and inertia loads keep dominating against aerodynamic loads. The gravity loads being reversible per each rotation cycle are significant sources of WTBs fatigue damage, while the aerodynamic loads are responsible for the generated energy. Therefore, to reduce the weight of the WTBs, the complex design from fibre composites with sandwich structures joined by adhesive bonding is used. Usually, WTBs are made from glass fibres/epoxy composites and polymer foams or balsa wood sandwich structures [17,19,33]. Natural composites and hybrid composites adding carbon, aramid, or basalt fibres are also possible [34]. Another important aspect worth paying attention to when choosing materials for blades is sustainability which affects the new trend to use more easily recyclable thermoplastic resins [35,36]. Production defects, transportation and installation damages, and irregular loading, including cyclic stresses, moisture and temperature variations, lighting strikes, and bird impact, cause complex processes of damage formation and an increasing number of damages and a variety of failure mechanisms [37,38]. Different degrees of blade failures take about 5% of total wind turbine faults [39]. Debel [37] identified different types of damage of WTBs: skin/adhesive debonding, adhesive joint failure between skins, sandwich debonding, delamination driven by buckling, splitting along fibres, gelcoat cracking, and gelcoat/skin debonding. The damages of composite materials can be classified as surface erosion, nonstructural damages, and delamination; structural damages as adhesive layers debonding and fibre failure [33]. The common damage modes in WTBs are shown in Figure 2.
Production defects such as wrinkles, fibre misalignments, and voids can cause independent or interactive damage growth and initiation of failure mechanisms such as matrix cracking with fibre bridging, interface cracking, fibre fractures, translaminar cracking, delamination, debonding, micro buckling, etc. [40]. Not all defects proceed with failure problems during the estimated lifetime; thus, the ability to reliably predict the damage growth mechanism remains important. Prediction of the damage accumulation and fatigue life can be based on different approaches such as empirical or micromechanical modelling, while the degradation depends on the stress–strain state at the defect zone.

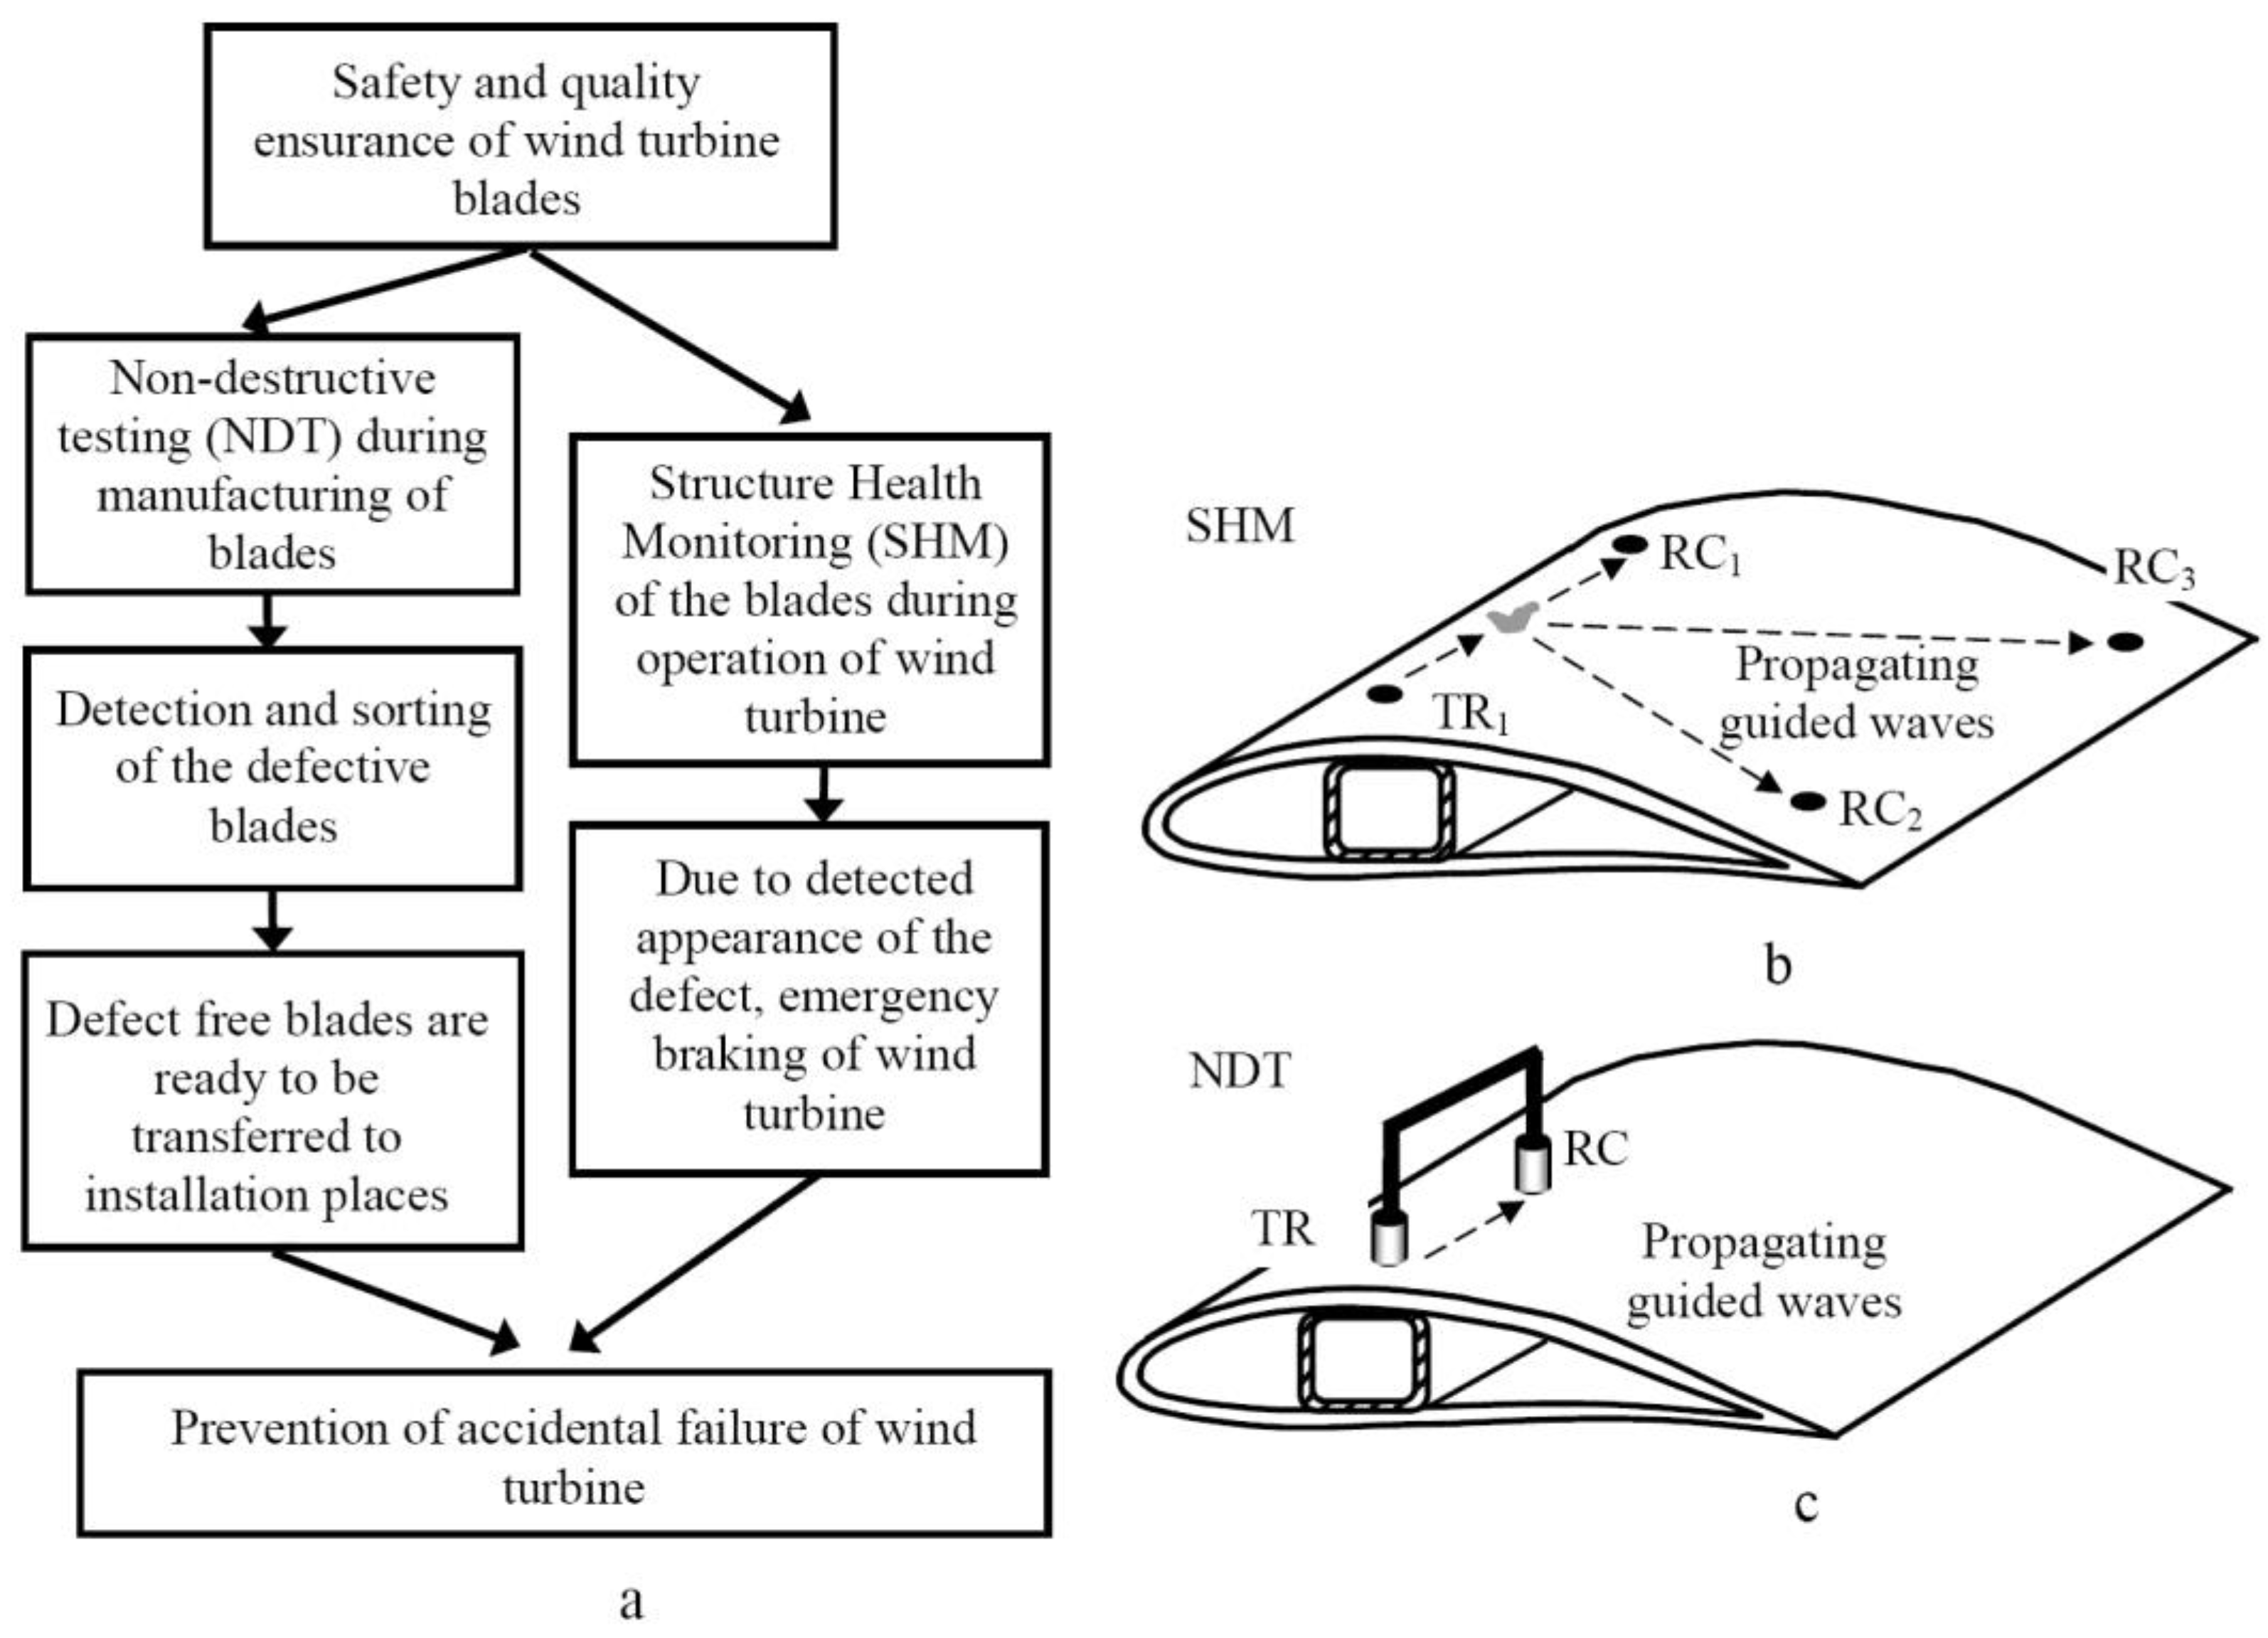
2.1.2. Methods for Safety and Quality Assurance

During the manufacture of the WTBs, it is very important to ensure quality control and avoid various internal defects. Such flaws can be revealed quickly, reliably, and effectively using the Ultrasonic NDT [11,41,42]. The Ultrasonic Testing (UT) is named one of the most versatile techniques directly related to mechanical properties of the object, sensitive to any changes, enabling extraction of detailed information (e.g., the determination of the depth of the defect) and leading to certification [43,44,45]. Moreover, it is important to identify the structural or mechanical problems in real time to avoid any blade failures and to ensure the safety of on-site operating WTs, extend the service life, and reduce the number of temporary suspensions of WTs during the inspection by NDT personnel [11]. For that purpose, the SHM technique with permanently installed transducers is being effectively exploited to perform continuous monitoring and data acquisition, informing a remotely located operator in case of defect appearance [11,46]. The mentioned advantage of SHM significantly reduces the risk of the overall turbine failure, which could occur between the regular intervals of conventional NDT and undetected evolving critical defects. The schematic diagram of the safety and quality assurance of WTBs during manufacturing (application of NDT) and on-site operation (application of SHM) is presented in Figure 3a. In the case of SHM application, the transmitting ultrasonic transducer TR1 and three receiving ultrasonic transducers RC1, RC2, RC3 are presented in Figure 3b. All transducers are permanently fixed on the surface of the sample. In the case of NDT application, the attached and mechanically scanned pair of transmitting (TR) and receiving (RC) ultrasonic transducers are presented in Figure 3c.
During the last decade, the WTBs geometry and materials were changed; the blade shapes are significantly increasing in size, and the complex design from fibre composites with sandwich structures joined by adhesive bonding is used for their manufacturing. These changes create new challenges for the WBTs quality control. Regarding that, new testing, inspecting, and monitoring methods are essential in all manufacturing, installation, and service stages [11].
Thus, ultrasonic Lamb waves are identified as one of the promising tools to address the quality control tasks of WTB by NDT, and SHM as the potential prevention tool.

2.2. Lamb Waves

The Lamb waves are one of the types of Ultrasonic Guided Waves (UGW), and they have been known for over a hundred years since H. Lamb discovered them [47]. The Lamb waves propagate in a solid plate with traction-free boundaries, which refers to the elastic displacements [48]. There are two distinct dispersive types of guided waves in a plate with traction-free boundaries: longitudinal waves having symmetric displacements to the centre of the plate and transverse waves having antisymmetric displacements [48]. Compared to traditional ultrasonic technologies, the following useful properties of Lamb waves propagated in solid media can be distinguished, such as:
  • The high sensitivity to the properties of the material. Due to this, such waves are used for the inspection of objects of various types, materials, and geometry to determine the changes in the structure, such as defects, delaminations, fatigue cracks, disbonding, corrosion, and others [49,50].
  • Sensitive to cracks at different depths. Depending on the selected mode wavelength, which should be less than the spatial dimensions of the internal defect, the defects are then detected [49]. Using such waves in the lower frequency range, the symmetric S0 mode possesses sensitivity to deep subsurface defects and the A0 mode to surface cracks.
  • The ability to propagate over the entire thickness of the object in a relatively long distance (up to 100 m) with low attenuation and fast propagation speed [51].
  • The early degradation of materials, the evaluation, and detection of early damage inside the structure are obtained faster, more economically, and more sensitively by using such waves [52]. Due to these properties, the usefulness of the Lamb waves in NDT and SHM is actively discussed, and their applicability is constantly being explored.
Despite the valuable properties, the Lamb waves have unusual limitations: dispersion phenomenon (the velocity as a function of frequency), infinite number of modes, the convergence of modes, modes interlaced, mode splitting due to edges, scattering, and others that make their application difficult.
In order to more accurately explain the properties of the Lamb waves, the dispersion curves obtained by the semianalytical finite element (SAFE) method and the experimentally obtained Lamb wave signals are used.

2.2.1. Calculation of the Dispersion Curves

The WTB example is used to better understand and explain the unusual limitations of Lamb waves and show the difficulties encountered in performing defect measurements. First, in order to understand the structure of the analysed object and its complexity, the geometry parameters of the WTB should be presented. The cross-sectional view of the WTB structure is sown in Figure 4a, the simplified model of the structure in Figure 4b.
The whole WTB is made of a composite structure, which consists of several material layers with different geometry and material properties. Generally, the WTB consists of the surface layer, epoxy, and unidirectional GFRP. Each main layer is of a different thickness Figure 4b. Other features: the WTB skin and main spar consist of several GFRP plies, with orientations of 0°/90°/+45°/−45°/0° and +45°/−45°, respectively. Thus, the second parameter that is especially important and is used in the study of WTB is the elastic properties of the whole object. The elastic properties are used to describe the theoretical dispersion curves, which are used to obtain comparable results. The main parameters are density (ρ) and elastic constants as Young’s modulus (E) and Poisson’s ratio (υ). Generally, the manufacturers provide the elastic properties of the individual layers, as presented in Table 1 [53]. Then, using the analytical or semianalytical methods, the Lamb waves dispersion features of the whole object are obtained.
The dispersion curves of the phase and group velocities of Lamb waves propagating in the WTB are theoretically calculated by the SAFE method according to the given elastic properties (Table 1) and geometry parameters (Figure 4b). The SAFE method, in more detail, is presented by other authors [54,55] and is based on the plane wave propagation in a plate using one-dimensional discretisation.
The plate is divided into a finite number of layers, each of which is described by three nodes in the one axis direction. In the second axis direction, it is assumed that the plate is infinite. The calculation is carried out up to 250 kHz for both phase and group velocities and presented in Figure 5a,b accordingly.
The calculated dispersion curves clearly show the dispersion phenomenon (the velocity is a function of frequency) and the existence of an infinite number of Lamb wave modes. At the lower frequency, two dispersive modes A0 and S0 are clearly visible and distinguishable, as seen in Figure 5a,b. However, other modes are difficult to identify.
In order to better understand the dispersion influence for the measurements, the signals of the Lamb waves need to be presented. The experimental study is conducted, and the obtained results are presented in the next section.

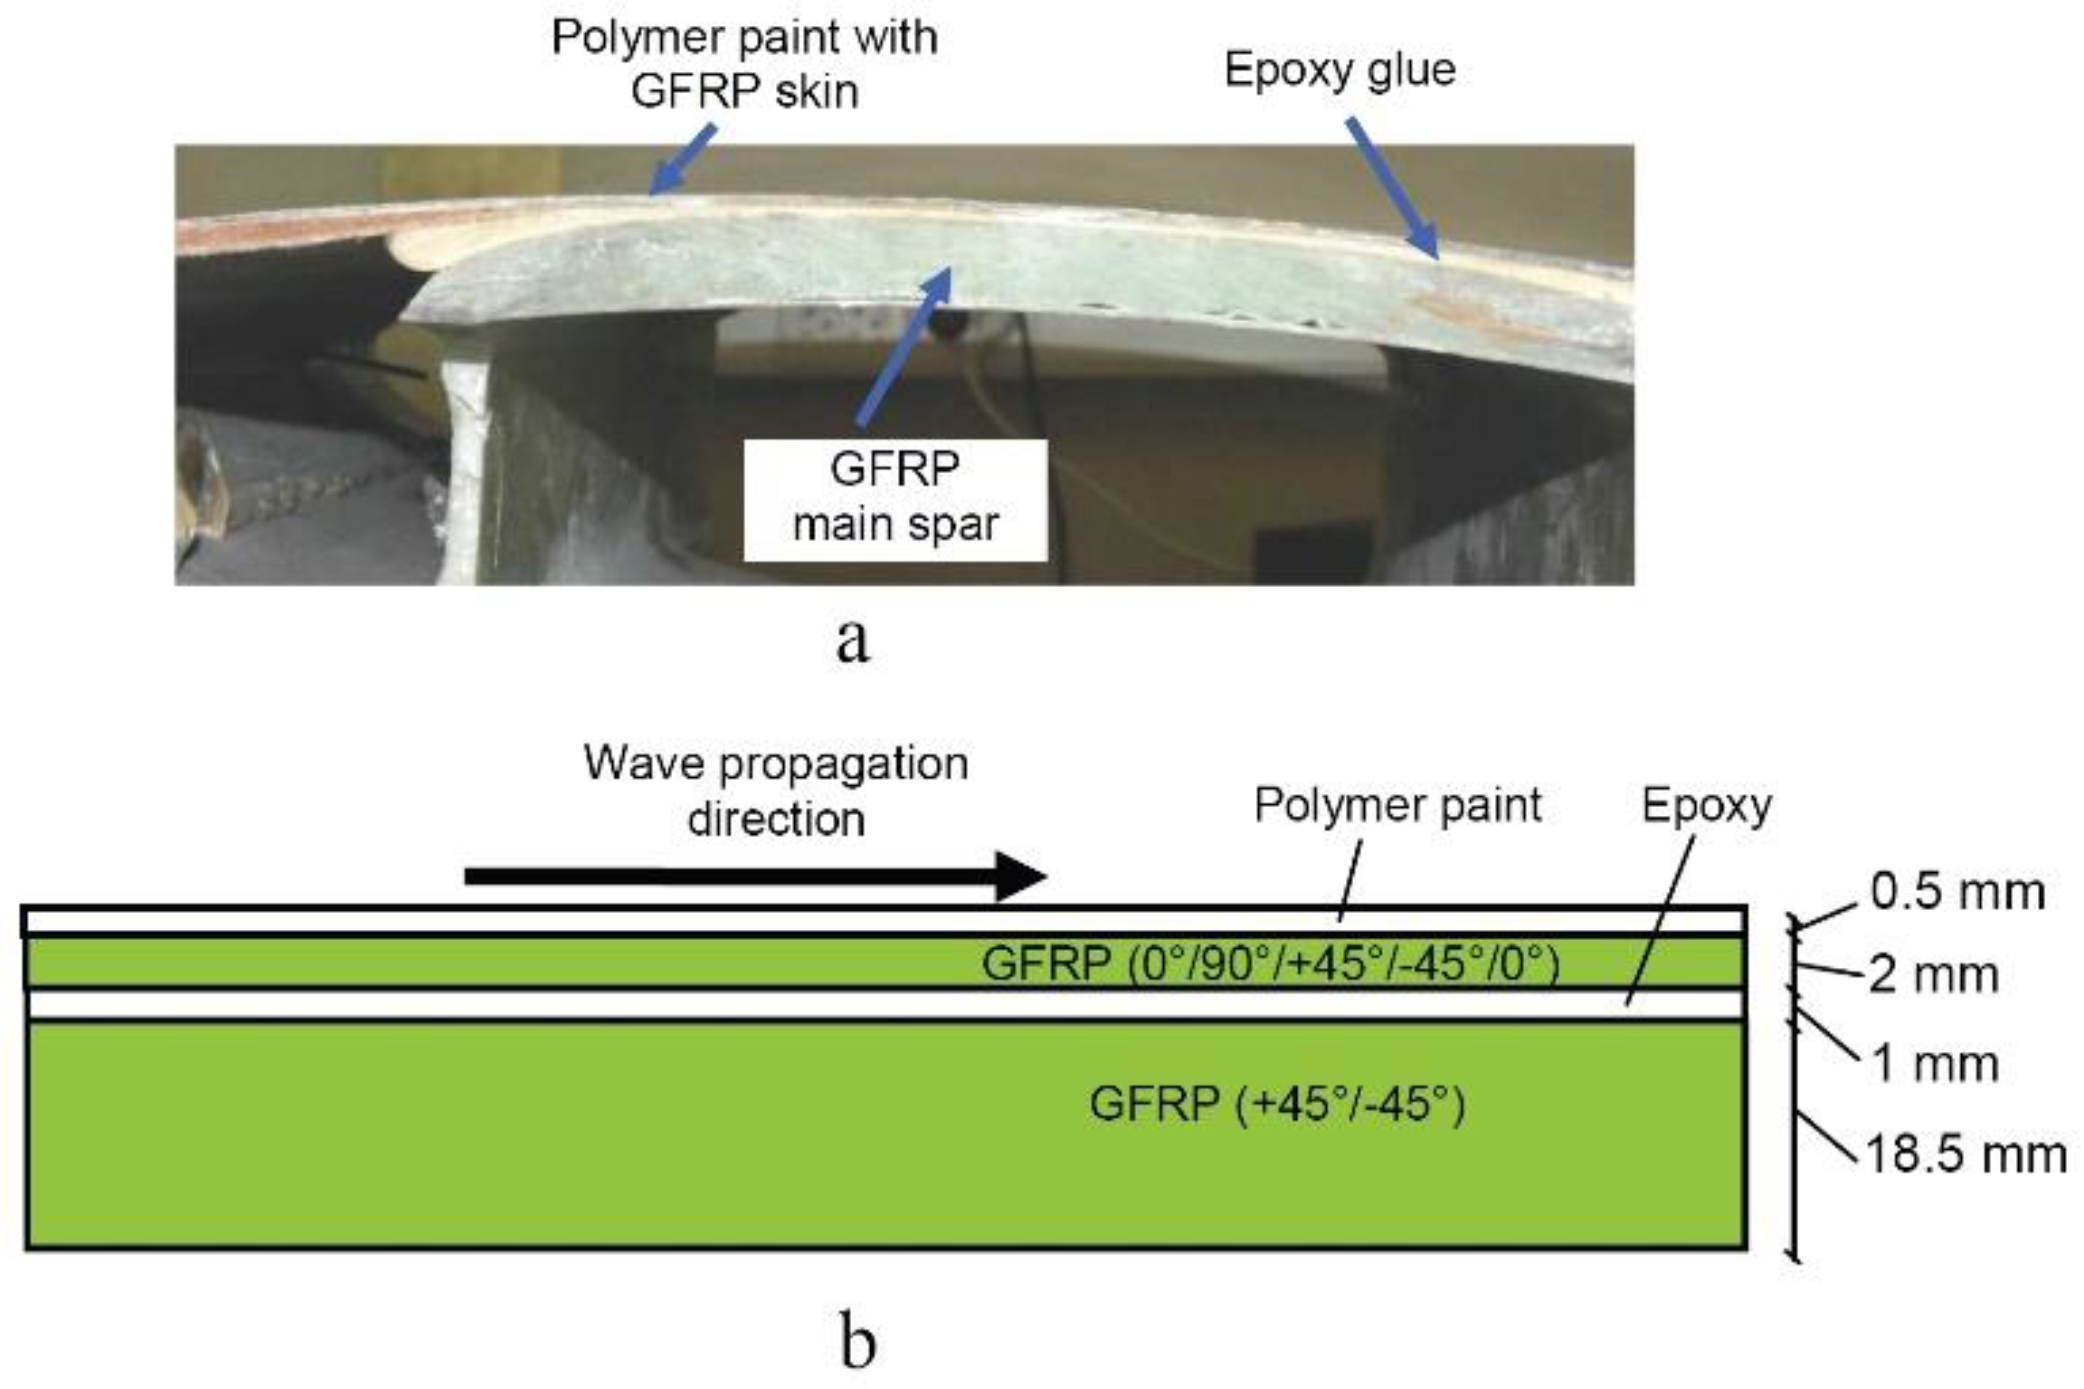
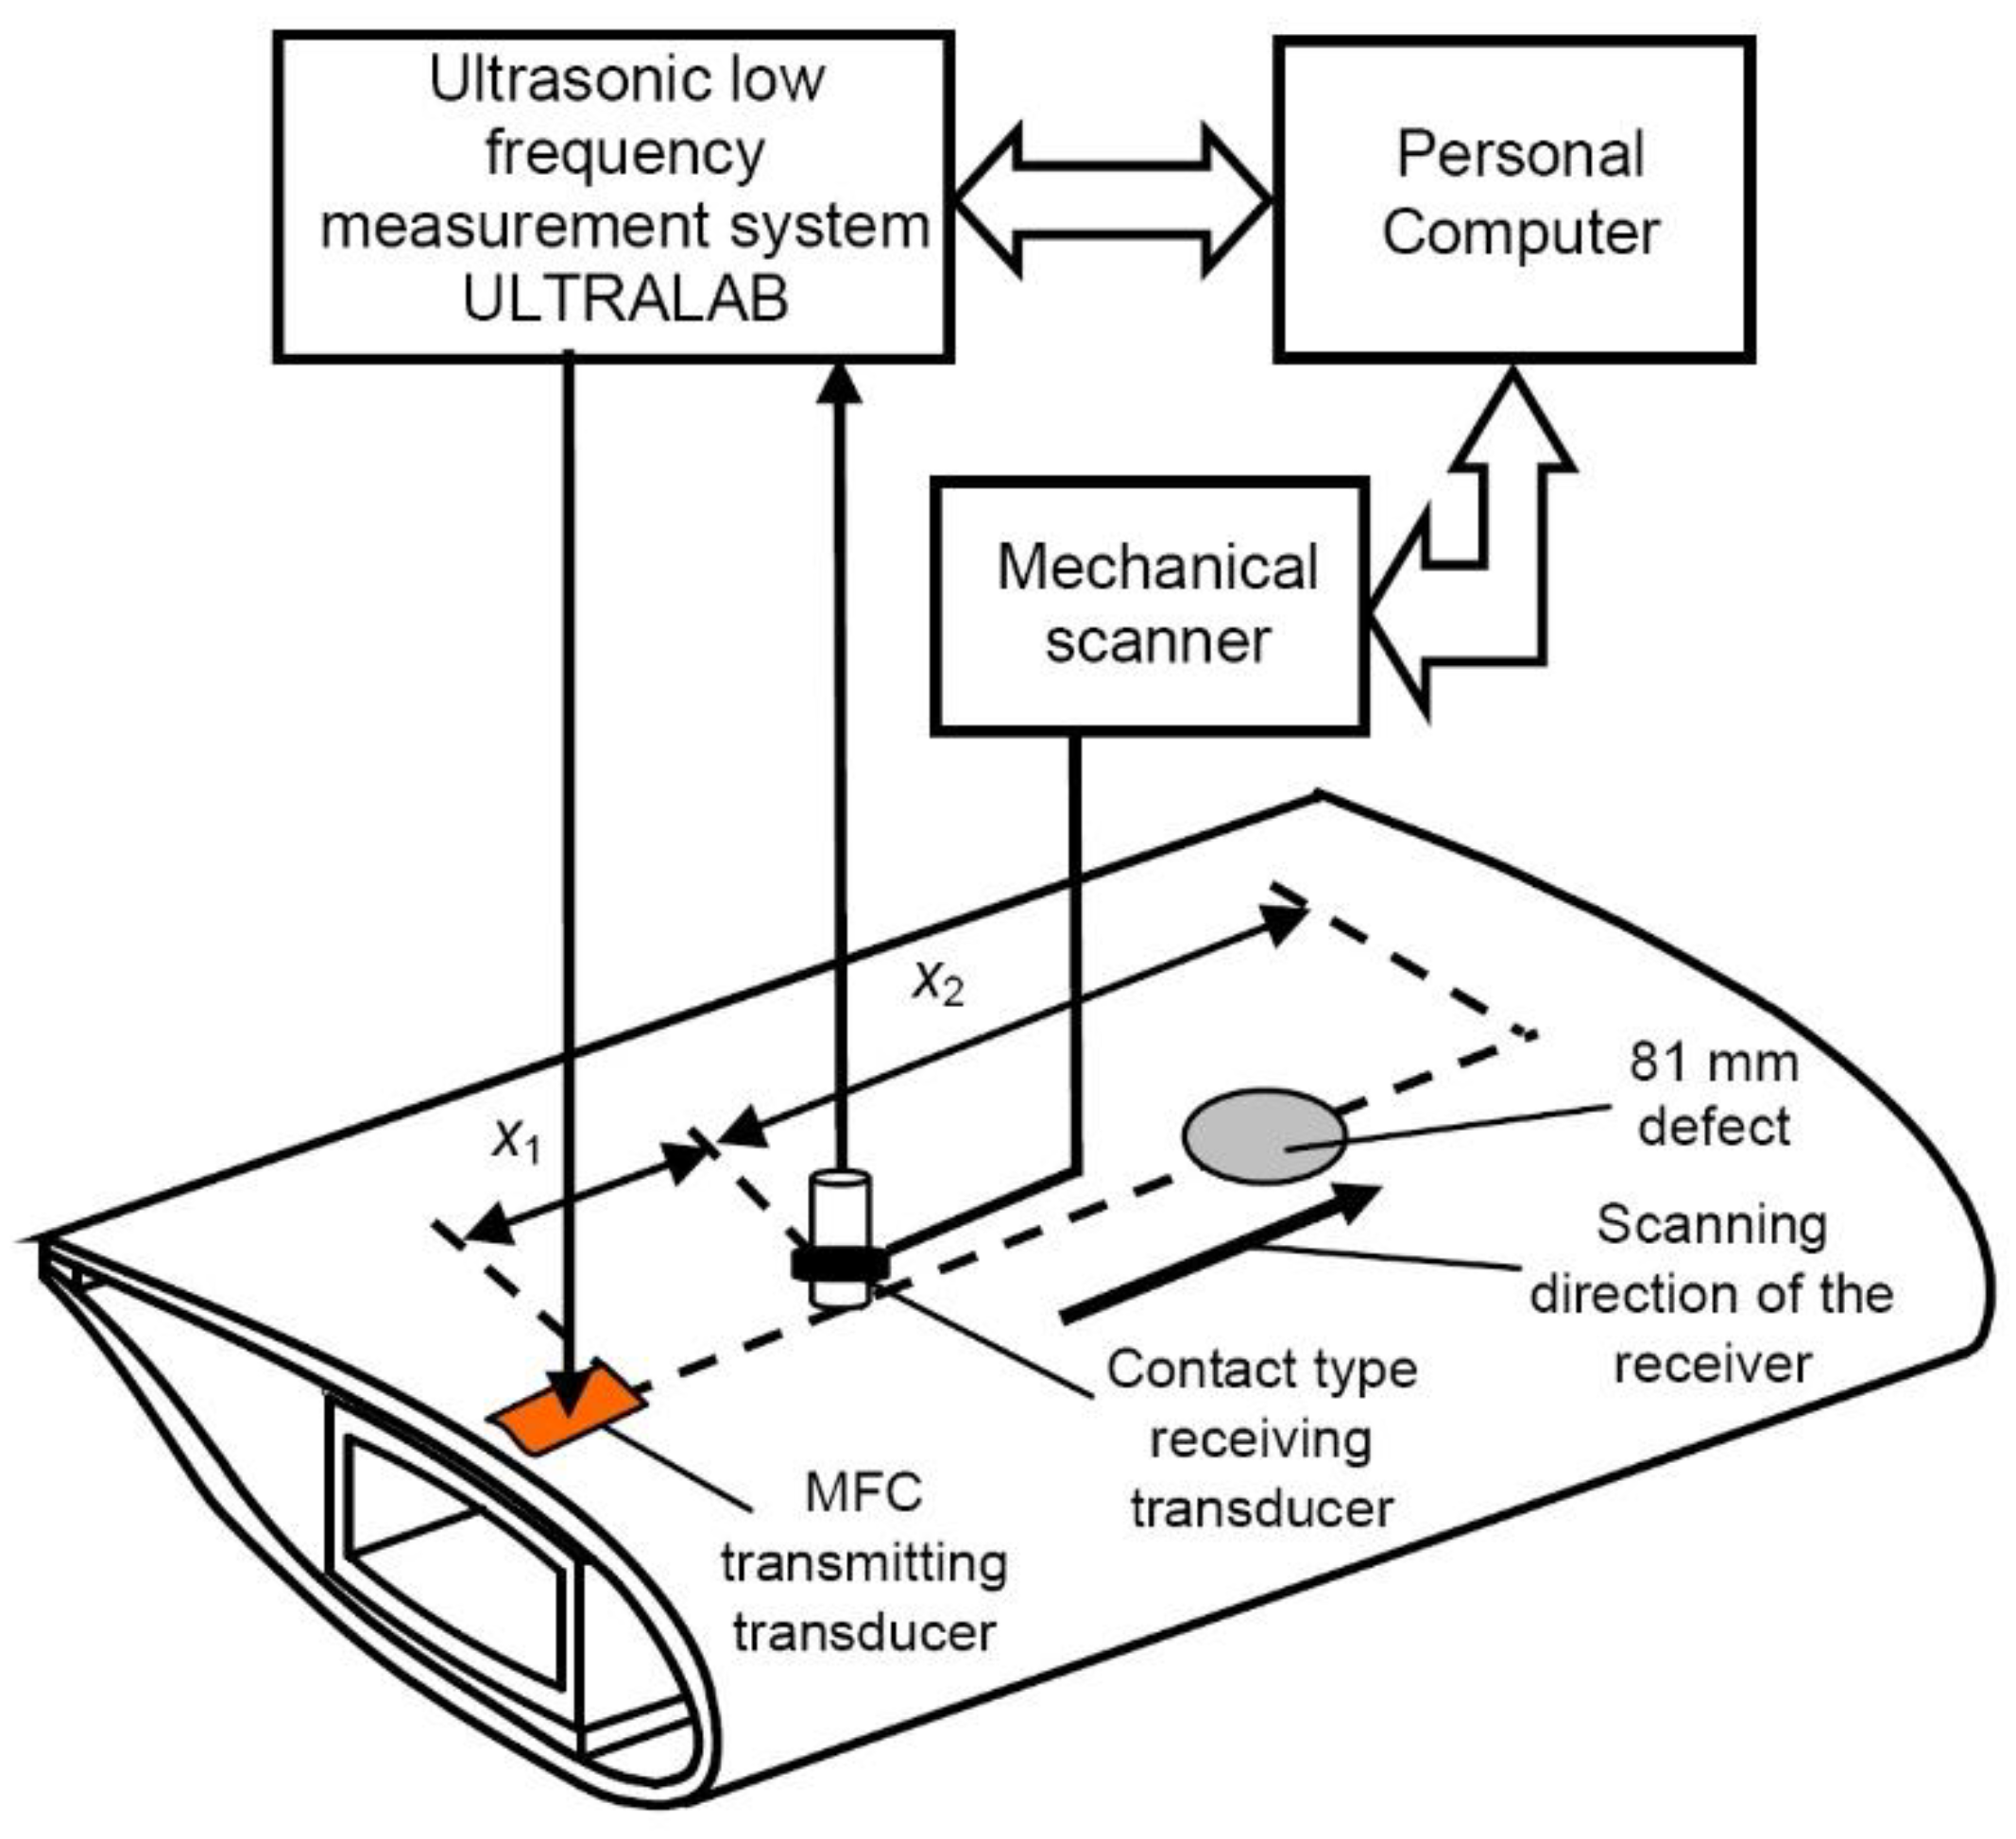
2.2.2. Experimental Investigation

To show the signals of the Lamb waves and their waveform changes, the signals of Lamb waves propagating in the WTB obtained during an experiment are registered. The artificial defect having a diameter of 81 mm was made by drilling out the region of the main spar, simulating the real disbond type defect between the main spar and covering shell. The typical measurement systems used in the SHM and NDT are presented in Figure 3b,c respectively. The more accurate hybrid experimental measurement setup for the WTB testing using SHM and NDT techniques is presented in Figure 6. The low-frequency ultrasonic measurement system ‘Ultralab’ developed and manufactured at Ultrasound Institute, Kaunas University of Technology, consists of the high voltage generator, the low noise amplifier and an analogue to digital converter. The maximum output voltage of the generator is 750 V. Gain of the amplifier can be changed from 10 dB to 50 dB. The low noise 13 dB preamplifier is connected directly to the receiver in order to improve the signal-to-noise ratio. The ultrasonic transmitter was excited by a single rectangular pulse with a duration of 11.6 ms (it corresponds to half of the period of frequency 43 kHz), and the voltage of 120 V. Scanning was performed with 0.1 mm scanning step along x direction. The permanently fixed macrofibre composite (MFC) transmitting transducer was used as a transmitter in order to generate the A0 mode of 43 kHz. The contact type receiving transducer was scanned away from the transmitter from x1 = 30 mm up to x2 = 160 mm in order to obtain the B-scan image. The B-scan image and waveforms of the experimental signals (mainly the A0 mode) of Lamb waves (before the defect, in the region of the defect, and behind the defect) are presented in Figure 7.
Waveforms of the presented Lamb wave signals, propagating along the complicated structure, are distorted due to frequency flicker of the interfering multiple modes, from an overlapping of directly propagating, scattered, and converted modes at edges of the defect, etc. The phenomenon of dispersion and relatively elongated waveforms of the signals in the time domain significantly complicate the applicability of conventional SPMs (windowing, threshold detection of amplitude, etc.) in the analysis of time or frequency parameters of the mentioned signals. So to identify and characterise faults using these types of waves, specific signal analysis algorithms are required [22]. That is why specific signal processing techniques are necessary to be developed, investigated, and used.

3. Results

3.1. Limitations of the Lamb Wave Application

Based on the presented dispersion curves (Figure 5a,b) and the waveform of the signals at different distances (Figure 7b–d), two main limitations can be distinguished, which significantly aggravate the application of the Lamb waves.
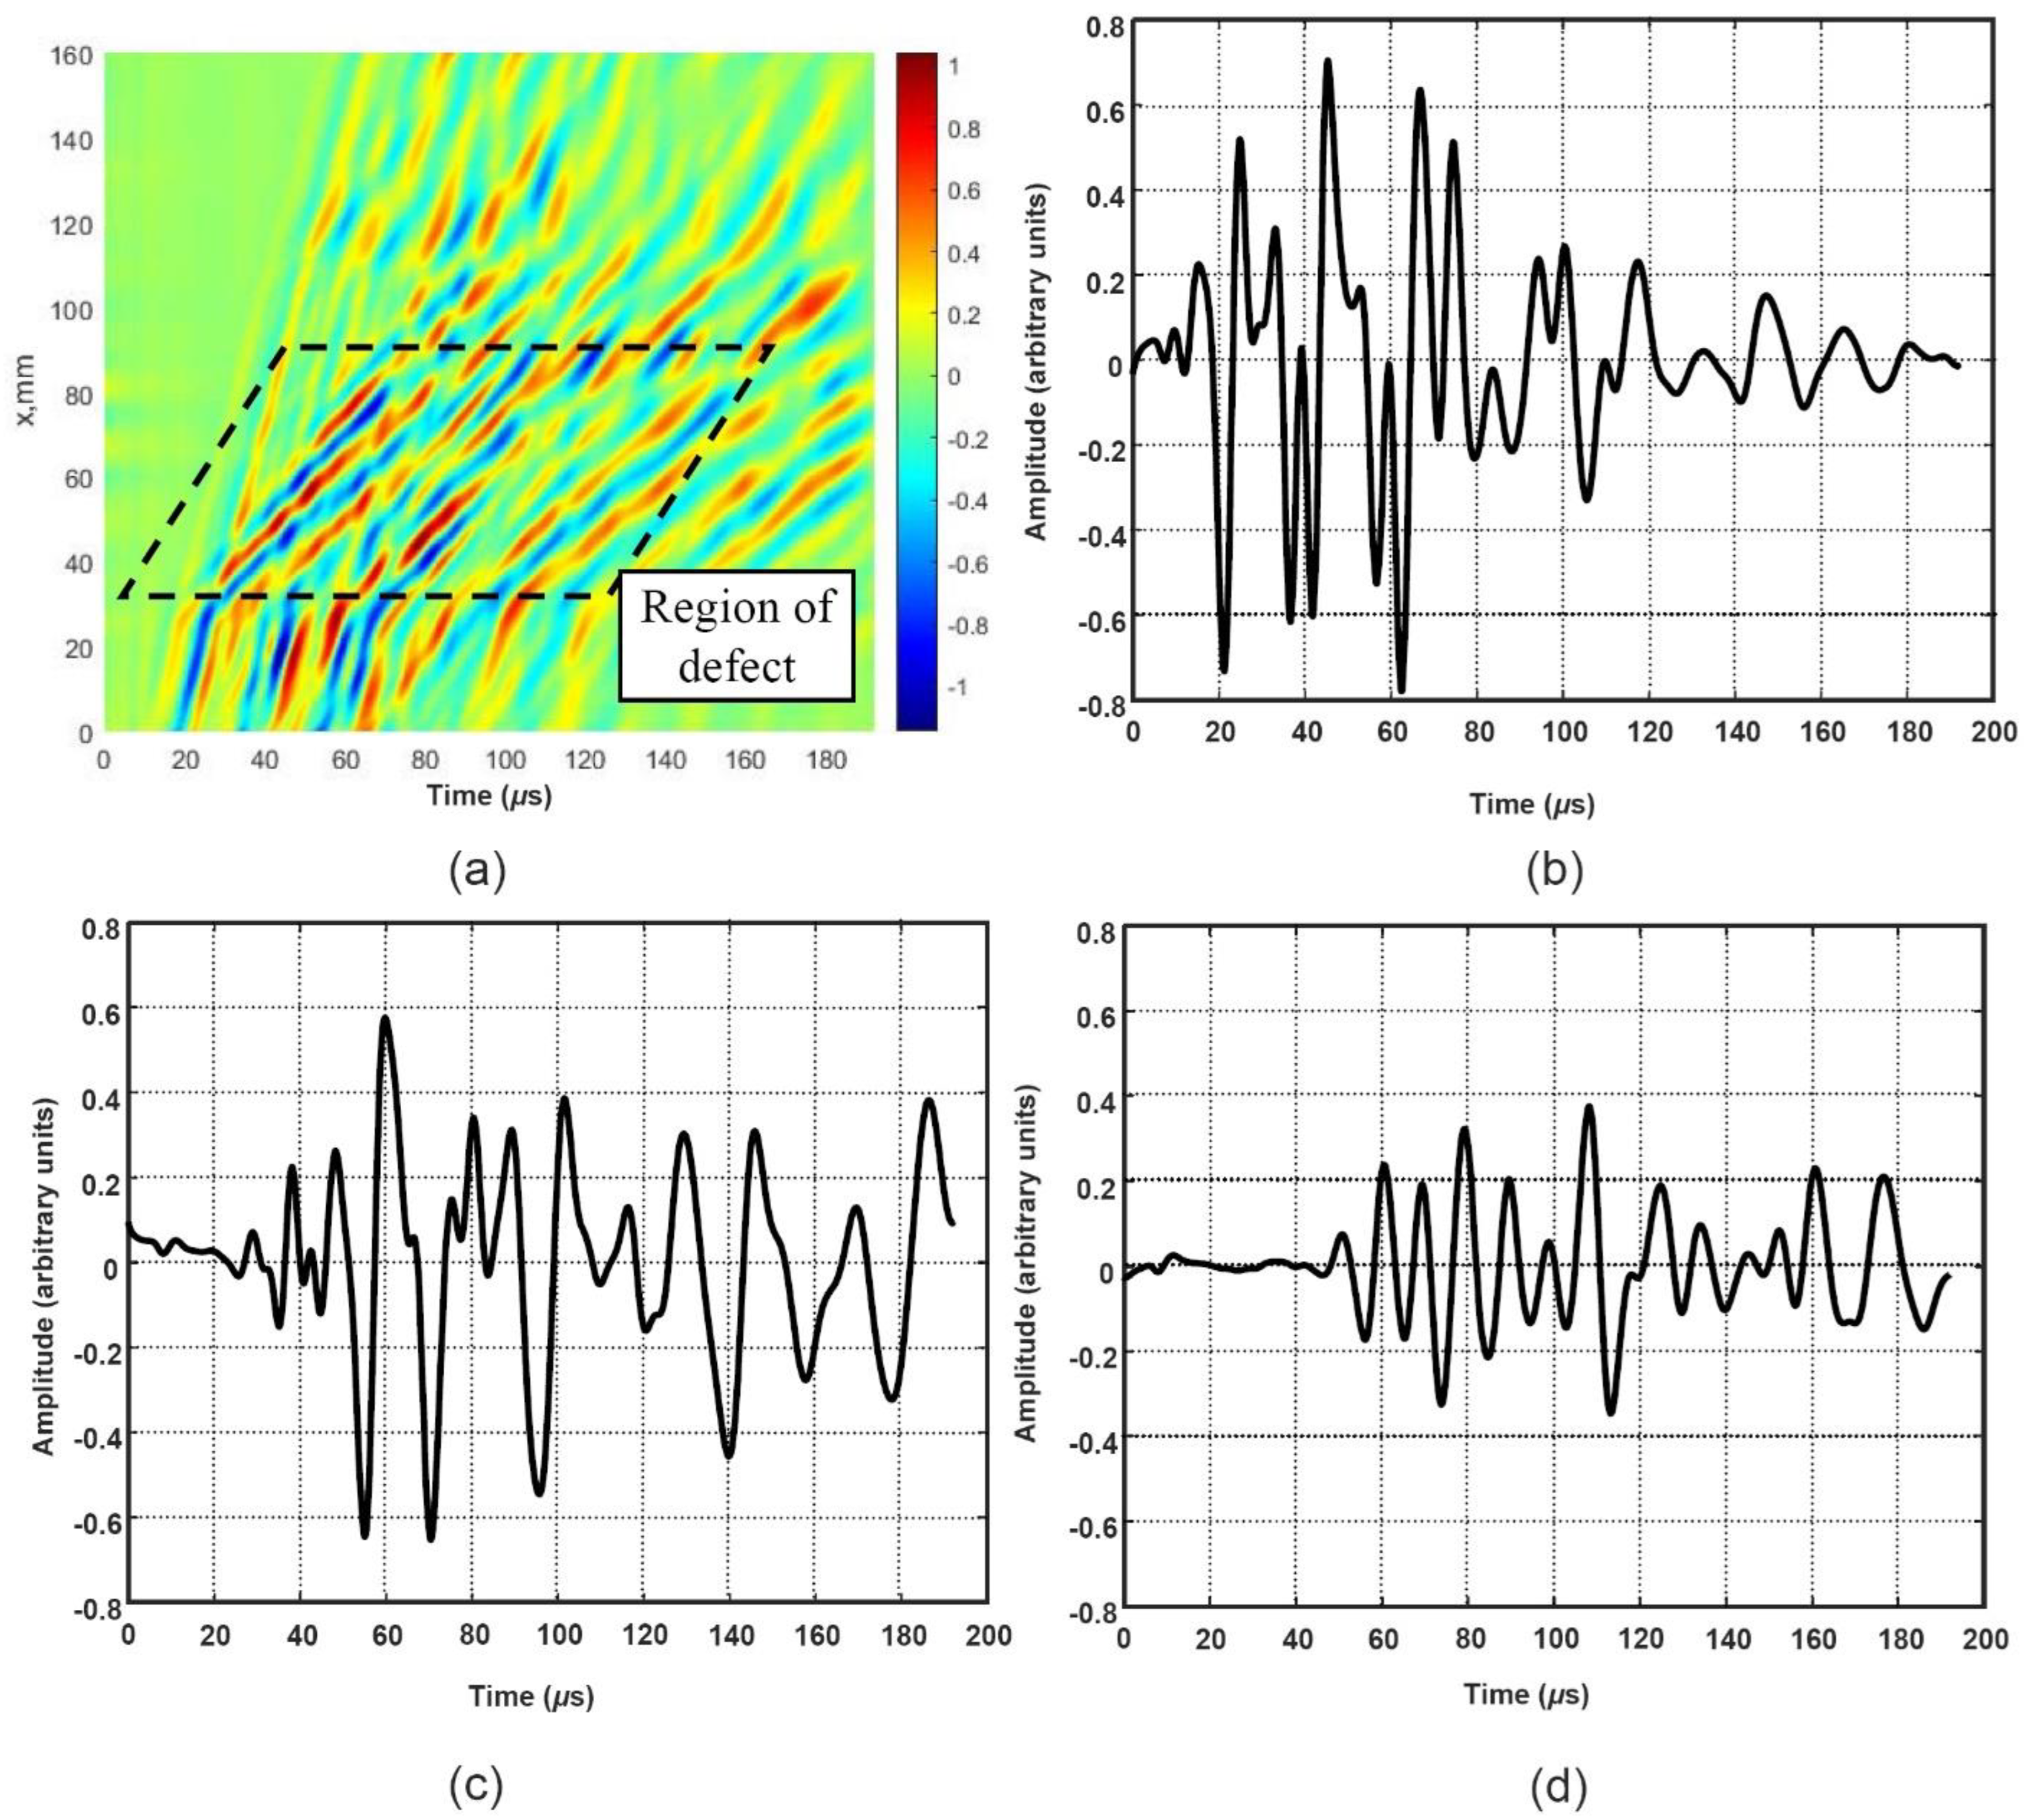
  • Dispersion. As the signals of the dispersing modes consist of different frequency components that propagate with different velocities depending on the distance, it influences the waveform distortion: the signal is elongated, and the peak amplitude is decreased (Figure 7b–d). This phenomenon complicates the analysis of the received signals and detection of defects [56,57,58]. The halving effect of the signal amplitude (at a level of 0.5 or −6 dB) is one of the main parameters in estimating the location and size of the defect in ultrasonic NDT. Due to the effect of dispersion, the signal waveform is changed (Figure 7b–d), and the application of the conventional criterion is not appropriate. In spite of that, the Lamb wave velocity variation can be used to indicate a defect [53]. Taking that into account, the specific SPMs for the reconstruction of the dispersion curves and new criteria for the evaluation of the velocity variations should be developed, investigated, and proposed.
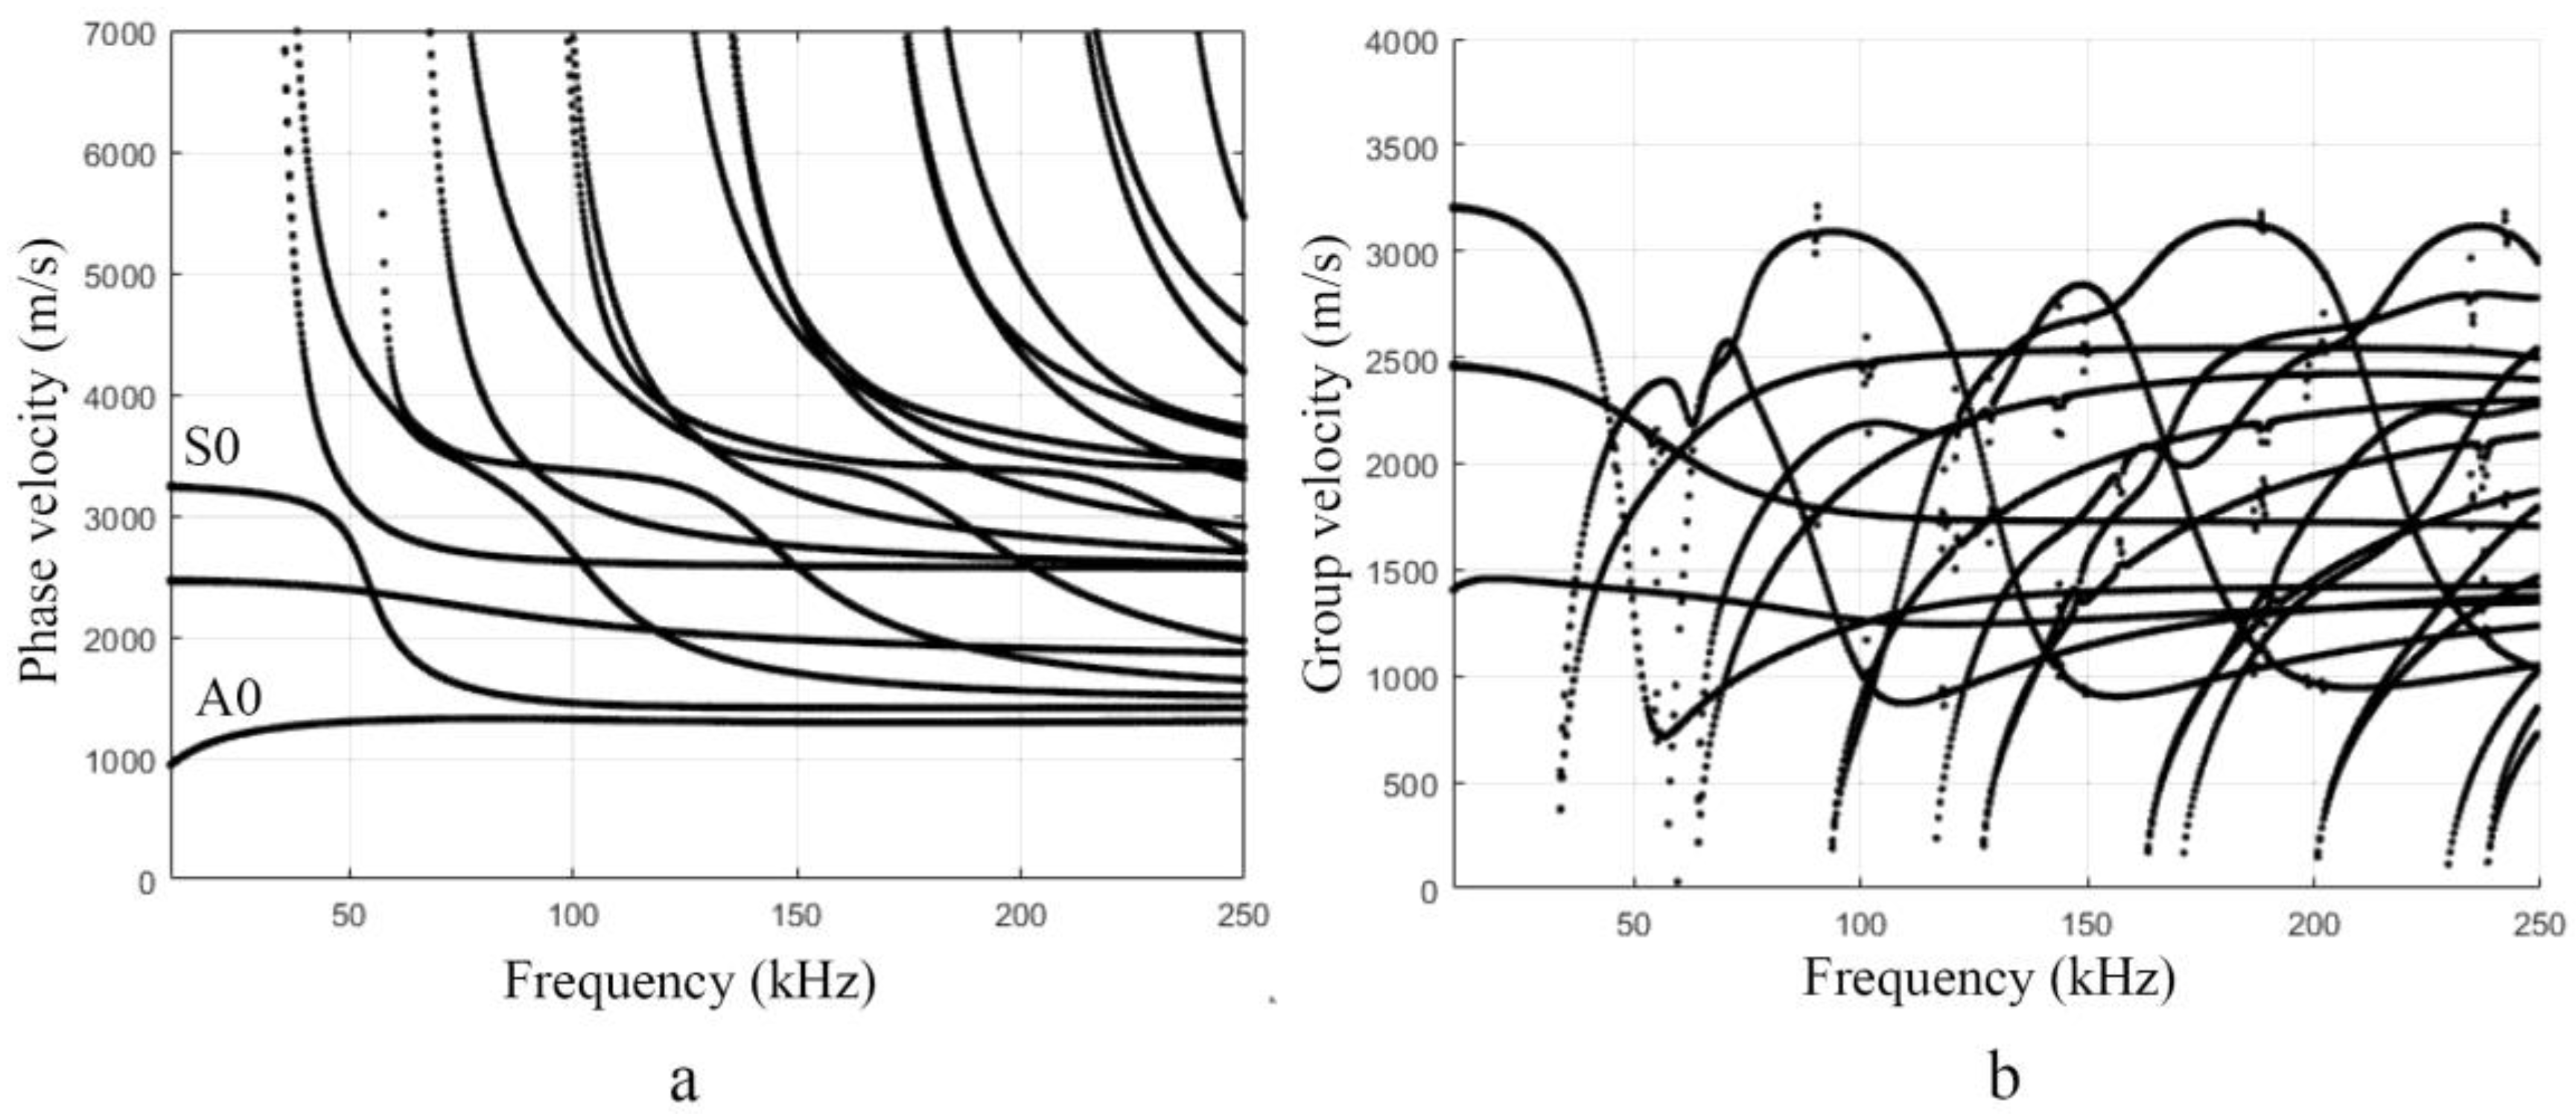
  • An infinite number of modes. As presented in Figure 5a,b, the Lamb waves possess an infinite number of dispersive modes. Depending on the thickness of the object, the material under investigation, and the frequency, other higher-order symmetric and asymmetric modes emerge [59,60], and each of them is described by two velocities: phase and group. Even at a low frequency of 50 kHz, higher-order dispersive modes appear (Figure 5a,b). In the higher frequency range (Figure 5a,b), there is a forest of them with visible effects of converging, interlacing, and splitting. So, using higher-order modes in the application, separating signals of the different modes, extracting a useful signal, and obtaining the required information in the whole trail of the signals is a difficult task [59,61]. Thus, in many cases, only fundamental A0 and S0 modes of the Lamb waves are used in various application cases. The fact that the wavelength is directly proportional to the velocity and inversely proportional to the frequency [47] must be emphasised. This fact is crucial for the application of higher-order modes, as by using different wavelengths, defects of different spatial dimensions can be detected. Thus, the algorithms that could identify the different modes, separate them, and obtain the required information need to be developed.
The two main unusual properties of Lamb waves named here indicate that the specific SPMs need to be used.

3.2. Methods Reliability Evaluation

Multiple SPMs have been created and applied for signal analysis of Lamb waves. Two-dimensional Fast Fourier Transform (2D-FFT), Short-Time Fourier Transform (STFT), Wavelets Transform (WT) and its variations, Wigner-Ville Distribution (WVD) and its variations, etc. [49,58,62] have been used for dispersion evaluation of Lamb waves. In many cases, the reliability of the method is not conducted and presented. It is a significant disadvantage for the application of Lamb waves, which makes it difficult to choose a suitable method for solving different problems. The accuracy assessment according to the requirements of ISO 17025 should be applied for the verification of the SPMs used to analyse the signals of Lamb waves because it is a necessary condition for setting reliable testing, inspecting, and monitoring standards for WTBs certification. The reliability evaluation of the SPMs for the dispersion estimation and reconstruction of the dispersion curves of the Lamb waves can be used as an example.
Based on the presented methodology [63], three main steps should be taken in order to evaluate the main characteristics of the proposed SPMs used for the reconstruction of the dispersion curves.
First, the mathematical verification of the proposed SPMs is used for the estimation of the Lamb wave dispersion. For that purpose, the dispersion curves using mathematical simulation and results obtained by analytical methods are compared. The techniques based on analytical and semianalytical finite element methods should be used as a reference method. Furthermore, the errors of the phase or group velocities at the informative points of the obtained dispersion curves and the average error can be calculated. The standard deviation of the velocity errors can be evaluated according to this parameter, as the uncertainty of the measurement model σ Δ c m a t can be included in the budget of the combined standard uncertainty:
σ Δ c m a t = i = 1 N ( ( Δ c m a t , i ) Δ ¯ c m a t ) 2 ( N 1 ) ,
where N is the number of points in a segment of the mathematical reconstructed dispersion curve, ith is the point of the segment, Δ c m a t , i are the errors of velocities of the reconstructed dispersion curve from the simulated signals, Δ ¯ c m a t is the average of errors of velocities. The absolute error and the average of absolute errors can be calculated as follows:
Δ c m a t , i = c m a t , i ( f ) c r e f , i ( f ) ,
Δ ¯ c m a t = 1 N i = 1 N Δ c m a t , i ,
where c m a t , i ( f ) are the velocities of the reconstructed dispersion curve from the simulated signals, c r e f ,   i ( f ) are the velocities obtained according to the reference dispersion curve.
Second, a comparison of the analytical and experimental results of the proposed SPMs [64,65]. The same characteristics as in the first step can be obtained. The systematic errors at different points are calculated by comparing the segments of the dispersion curves reconstructed in both experimental and analytical ways in the same frequency range. The average error of the velocity Δ ¯ c is one of the main characteristics of the dispersion curves reconstruction. The systematic error and the average of the errors can be calculated accordingly:
Δ c n = c e x , n ( f ) c r e f , n ( f ) ,
Δ ¯ c = 1 K i = 1 K Δ c n ,
where K is the number of points in a segment of experimentally reconstructed dispersion curve, nth point of the segment is given by n = 1, …, K, c e x , n ( f )   are the velocities of the reconstructed dispersion curve from the experimental signals, c r e f ,   n ( f ) are the velocities obtained according to the reference dispersion curve. The standard deviation of the velocity errors:
σ Δ c = i = 1 K ( ( Δ c n ) Δ ¯ c ) 2 ( K 1 ) .
where Δ c n are the errors of velocities of the reconstructed dispersion curve from the experimental signals, Δ ¯ c   is the average of errors of velocities.
The standard deviation of the velocity errors σ Δ c is a component of the combined standard uncertainty.
Third, an analysis of the complex factors influencing the measurement results, quantification of the selected uncertainty components, and an expanded uncertainty calculation. Components of combined uncertainty can be measured or estimated and added according to general rules for uncertainty and error calculation [66]. When calculating individual uncertainty components, it can be assumed that the investigated object is homogeneous. The combined uncertainty over SPMs stems from the reconstruction of dispersion curves; in addition to the already discussed components, it consists of components generated by the following sources of errors [64,65]:
  • Specimen. The mechanical and geometric parameters of the object under investigation and environmental conditions such as density ρ, elastic constants (Young modulus E, Poisson‘s ratio υ) specimen thickness d, temperature, and humidity;
  • Measuring equipment. Measuring systems with specific software, instruments, and tools (transducers).
It is crucial to have software for estimating measurement uncertainty. The combined uncertainty can be processed and analysed using GUM Workbench software (Metrodata GmbH) or similar. GUM stands for Guide to the Expression of Uncertainty in Measurement. This software allows comparing the results obtained with the simulated data and evaluating whether a correct number of measurement points has been selected [67]. The results calculated by GUM are compared with the simulated results when using 2 million trials, as presented in the example of phase velocity estimation of a particular UGW (Figure 8). The difference between results from the two methods does not have a significant influence on the relative uncertainty.
The expanded uncertainty U( Δ ¯ c ) is calculated by multiplying the combined standard uncertainty with the coverage factor k = 2, which provides a confidence level of 95% [66].
Thus, to sum up, it can be said that the development of methods and their reliability and suitability evaluation is a complex, multidiscipline, time-consuming task demanding great effort.

4. Conclusions

The main conditions that are required to be confirmed for the verification of the special SPMs according to the requirements of ISO 17025 are presented, and the main shortcomings complicating the preparation of reliable testing, inspection, and monitoring standards for WTBs certification are demonstrated.
Lamb waves were proved to be one of the most promising tools for failure prevention and safety assurance of WTBs and an effective tool for environmental sustainability by using signals of Lamb waves. However, the limitations of Lamb waves, such as a dispersion phenomenon and an infinite number of modes, are identified as great obstacles for the application of these waves. The limitations of the Lamb waves approach are related to defining the necessary minimum number of transducers to perform SHM of the WTB structure and the minimal number of spatial measurement points for NDT as well. Therefore, future work will be dedicated to the related research.
Moreover, two different tests that use simulated and experimental parameters must be performed to verify the accuracy of the SPM. In both cases, the results obtained must be compared with the values calculated by the reference method. When reproducing the sections of the dispersion curve, a complex analysis of the uncertainty components must be performed. For this purpose, the minimum scanning step is selected, and if necessary, the material properties of the object are identified, the average of the measurements at each point is obtained, and constant environmental conditions are ensured. This allows obtaining a sufficient amount of data for reliable estimation of the dispersion and uncertainty of the results. While analysing the metrological parameters of the method, the goal is to achieve the value of the uncertainty adequate to the required measurement accuracy. The measurement accuracy is considered an important factor in developing national and international standards for the prevention of WTB failure in the future. The general principles should expand the understanding of the measurement reliability, peculiarities of method validation, and verification. Such information facilitates the application and utilisation of the proposed methods and their choice for completing a given task

Author Contributions

Conceptualization, L.D.; methodology, L.D., A.M., R.R., and P.G.; software, E.Ž.; validation, R.R., and L.D.; formal analysis, L.D.; investigation, L.D., R.R., and E.Ž.; resources, L.D., A.M., R.R., and P.G.; data curation, R.R.; writing—original draft preparation, L.D.; writing—review and editing, L.D., A.M., R.R., P.G., and Ž.S.; visualization, E.Ž., R.R.; supervision, L.D. All authors have read and agreed to the published version of the manuscript.

Funding

This research was funded by the Research Foundation of the Research Council of Lithuania under the project UNITE ‘Ultrasonic tomography for the spatial reconstruction of material properties from a limited number of positions for NDT and monitoring applications’, No. MIP2048.

Institutional Review Board Statement

Not applicable.

Informed Consent Statement

Not applicable.

Data Availability Statement

The data presented in this study are available on request from the corresponding author.

Conflicts of Interest

The authors declare no conflict of interest.

References

  1. European Parliament. Directive (EU) 2018/2001 of the European Parliament and of the Council of 11 December 2018 on the Promotion of the Use of Energy from Renewable Sources (Text with EEA Relevance; European Parliament: Bruxelles, Belgium, 2018. Available online: https://eur-lex.europa.eu/legal-content/EN/TXT/?uri=CELEX%3A32018L2001 (accessed on 7 December 2021).
  2. Segreto, M.; Principe, L.; Desormeaux, A.; Torre, M.; Tomassetti, L.; Tratzi, P.; Paolini, V.; Petracchini, F. Trends in Social Acceptance of Renewable Energy Across Europe—A Literature Review. Int. J. Environ. Res. Public Health 2020, 17, 9161. [Google Scholar] [CrossRef]
  3. Martin, C. Wind turbine Blades can’t be recycled, so they’re piling up in landfills. Bloomberg Green, 8 February 2020. [Google Scholar]
  4. Villate, J.L.; Ruiz-Minguela, P.; Berque, J.; Pirttimaa, L.; Cagney, D.; Cochrane, C.; Jeffrey, H. Strategic Research and Innovation Agenda for Ocean Energy. Etipocean 2020, 64, 18. [Google Scholar]
  5. Latinopoulos, D.; Kechagia, K. A GIS-based multi-criteria evaluation for wind farm site selection. A regional scale application in Greece. Renew. Energy 2015, 78, 550–560. [Google Scholar] [CrossRef]
  6. Feng, J. Wind farm site selection from the perspective of sustainability: A novel satisfaction degree-based fuzzy axiomatic design approach. Int. J. Energy Res. 2021, 45, 1097–1127. [Google Scholar] [CrossRef]
  7. Wind Europe. Wind Energy in Europe: 2020 Statistics and the Outlook for 2021–2025. Statistics 2021. Available online: https://windeurope.org/intelligence-platform/product/wind-energy-in-europe-in-2020-trends-and-statistics/ (accessed on 7 December 2021).
  8. Chipindula, J.; Botlaguduru, V.S.V.; Du, H.; Kommalapati, R.R.; Huque, Z. Life Cycle Environmental Impact of Onshore and Offshore Wind Farms in Texas. Sustainability 2018, 10, 2022. [Google Scholar] [CrossRef] [Green Version]
  9. Roeleke, M.; Blohm, T.; Kramer-Schadt, S.; Yovel, Y.; Voigt, C.C. Habitat use of bats in relation to wind turbines revealed by GPS tracking. Sci. Rep. 2016, 6, 28961. [Google Scholar] [CrossRef]
  10. Ribeiro, A.; Costoya, X.; De Castro, M.; Carvalho, D.; Dias, J.M.; Rocha, A.; Gomez-Gesteira, M. Assessment of Hybrid Wind-Wave Energy Resource for the NW Coast of Iberian Peninsula in a Climate Change Context. Appl. Sci. 2020, 10, 7395. [Google Scholar] [CrossRef]
  11. Yang, B.; Sun, D. Testing, inspecting and monitoring technologies for wind turbine blades: A survey. Renew. Sustain. Energy Rev. 2013, 22, 515–526. [Google Scholar] [CrossRef]
  12. Kellner, T. Making Waves: GE Unveils Plans to Build an Offshore Wind Turbine the Size of a Skyscraper, the World’s Most Powerful. GE Reports, Renewables. 2018. Available online: https://www.ge.com/news/reports/making-waves-ge-unveils-plans-build-offshore-wind-turbine-size-skyscraper-worlds-powerful (accessed on 7 December 2021).
  13. Jensen, J.P.; Skelton, K. Wind turbine blade recycling: Experiences, challenges and possibilities in a circular economy. Renew. Sustain. Energy Rev. 2018, 97, 165–176. [Google Scholar] [CrossRef]
  14. Dorigato, A. Recycling of thermosetting composites for wind blade application. Adv. Ind. Eng. Polym. Res. 2021, 4, 116–132. [Google Scholar] [CrossRef]
  15. Wind Europe. Accelerating Wind Turbine Blade Circularity. 2020. Available online: https://windeurope.org/intelligence-platform/product/accelerating-wind-turbine-blade-circularity (accessed on 7 December 2021).
  16. Beauson, J.; Madsen, B.; Toncelli, C.; Brøndsted, P.; Ilsted Bech, J. Recycling of shredded composites from wind turbine blades in new thermoset polymer composites. Compos. Part A Appl. Sci. Manuf. 2016, 90, 390–399. [Google Scholar] [CrossRef]
  17. Mishnaevsky, L. Sustainable End-of-Life Management of Wind Turbine Blades: Overview of Current and Coming Solutions. Materials 2021, 14, 1124. [Google Scholar] [CrossRef] [PubMed]
  18. Jensen, P.D.; Purnell, P.; Velenturf, A.P. Highlighting the need to embed circular economy in low carbon infrastructure decommissioning: The case of offshore wind. Sustain. Prod. Consum. 2020, 24, 266–280. [Google Scholar] [CrossRef]
  19. Andersen, N.; Eriksson, O.; Hillman, K.; Wallhagen, M. Wind Turbines’ End-of-Life: Quantification and Characterisation of Future Waste Materials on a National Level. Energies 2016, 9, 999. [Google Scholar] [CrossRef] [Green Version]
  20. European Commission. Waste Framework Directive. Available online: https://ec.europa.eu/environment/topics/waste-and-recycling/waste-framework-directive_en#ecl-inpage-769 (accessed on 7 December 2021).
  21. Kolios, A.; Martínez-Luengo, M. The end of the line for today’s wind turbines. Renew. Energy Focus 2016, 17, 109–111. [Google Scholar] [CrossRef]
  22. García Márquez, F.P.; Peco Chacón, A.M. A review of non-destructive testing on wind turbines blades. Renew. Energy 2020, 161, 998–1010. [Google Scholar] [CrossRef]
  23. Martinez-Luengo, M.; Kolios, A.; Wang, L. Structural health monitoring of offshore wind turbines: A review through the Statistical Pattern Recognition Paradigm. Renew. Sustain. Energy Rev. 2016, 64, 91–105. [Google Scholar] [CrossRef] [Green Version]
  24. McGugan, M.; Mishnaevsky, J.L. Damage Mechanism Based Approach to the Structural Health Monitoring of Wind Turbine Blades. Coatings 2020, 10, 1223. [Google Scholar] [CrossRef]
  25. Rumsey, M.A.; Paquette, J.A. Structural health monitoring of wind turbine blades. In Smart Sensor Phenomena, Technology, Networks, and Systems 2008; SPIE: Bellingham, WA, USA, 2008. [Google Scholar]
  26. Bouzid, O.M.; Tian, G.Y.; Cumanan, K.; Moore, D. Structural Health Monitoring of Wind Turbine Blades: Acoustic Source Localization Using Wireless Sensor Networks. J. Sensors 2015, 2015, 139695. [Google Scholar] [CrossRef]
  27. Niezrecki, C.; Avitabile, P.; Chen, J.; Sherwood, J.A.; Lundstrom, T.; Leblanc, B.; Hughes, S.A.; Desmond, M.; Beattie, A.; Rumsey, M.; et al. Inspection and monitoring of wind turbine blade-embedded wave defects during fatigue testing. Struct. Heal. Monit. 2014, 13, 629–643. [Google Scholar] [CrossRef]
  28. Chen, X.; Semenov, S.; McGugan, M.; Madsen, S.H.; Yeniceli, S.C.; Berring, P.; Branner, K. Fatigue testing of a 14.3 m composite blade embedded with artificial defects—Damage growth and structural health monitoring. Compos. Part A Appl. Sci. Manuf. 2021, 140, 106189. [Google Scholar] [CrossRef]
  29. Gómez Muñoz, C.Q.; Arcos Jiménez, A.; García Márquez, F.P. Wavelet transforms and pattern recognition on ultrasonic guides waves for frozen surface state diagnosis. Renew. Energy 2018, 116, 42–54. [Google Scholar] [CrossRef]
  30. EURL-FA Guide: Protocol for Verification Studies of Single Laboratory/In-House Validated Methods; European Union Reference Laboratory for Feed Additives of European Commission-Joint Research Centre: Brussels, Belgium, 2014; pp. 1–26. Available online: https://ec.europa.eu/jrc/sites/default/files/EURLFA-technical%20guide%20for%20validation%20and%20verification%20v2014.pdf (accessed on 7 December 2021).
  31. AOAC International. ALACC Guide How to Meet ISO 17025 Requirements for Acknowledgments Method Verification. 2007. Available online: https://fdocuments.net/reader/full/how-to-meet-iso-17025-requirements-for-method-verification (accessed on 7 December 2021).
  32. Magnusson, B.; Örnemark, U. (Eds.) Eurachem Guide: The Fitness for Purpose of Analytical Methods—A Laboratory Guide to Method Validation and Related Topics. In Eurachem, 2nd ed.; EURACHEM: London, UK, 2014; p. 64. Available online: https://www.eurachem.org/images/stories/Guides/pdf/MV_guide_2nd_ed_EN.pdf (accessed on 7 December 2021).
  33. Mishnaevsky, L.; Branner, K.; Petersen, H.N.; Beauson, J.; McGugan, M.; Sørensen, B.F. Materials for Wind Turbine Blades: An Overview. Materials 2017, 10, 1285. [Google Scholar] [CrossRef] [PubMed] [Green Version]
  34. Boria, S.; Santulli, C.; Raponi, E.; Sarasini, F.; Tirillò, J. Evaluation of a new green composite solution for wind turbine blades. Multiscale Multidiscip. Model. Exp. Des. 2019, 2, 141–150. [Google Scholar] [CrossRef]
  35. Subadra, S.P.; Griskevicius, P. Sustainability of polymer composites and its critical role in revolutionising wind power for green future. Sustain. Technol. Green Econ. 2021, 1, 1–7. [Google Scholar] [CrossRef]
  36. Katnam, K.B.; Comer, A.J.; Roy, D.; da Silva, L.; Young, T. Composite Repair in Wind Turbine Blades: An Overview. J. Adhes. 2014, 91, 113–139. [Google Scholar] [CrossRef]
  37. Debel, C.P. Identification of damage types in wind turbine blades tested to failure. In Materialeopførsel og skadesanalyse; Somers, M.A.J., Ed.; Dansk Metallurgisk Selskab: Lyngby, Denmark, 2004; pp. 123–127. [Google Scholar]
  38. Mishnaevsky, L.; Hasager, C.B.; Bak, C.; Tilg, A.-M.; Bech, J.I.; Rad, S.D.; Fæster, S. Leading edge erosion of wind turbine blades: Understanding, prevention and protection. Renew. Energy 2021, 169, 953–969. [Google Scholar] [CrossRef]
  39. Lau, B.C.P.; Ma, E.W.M.; Pecht, M. Review of offshore wind turbine failures and fault prognostic methods. In Proceedings of the IEEE 2012 Prognostics and System Health Management Conference, Beijing, China, 23–25 May 2012. [Google Scholar]
  40. Sørensen, B.F.; Joergensen, E.; Debel, C.P.; Jensen, F.M.; Jensen, H.M.; Jacobsen, T.; Halling, K.M. Improved Design of Large Wind Turbine Blades of Fibre Composites (Phase 2)—Summary Report; Risø National Laboratory: Roskilde, Denmark, 2005; ISBN 8755034624. [Google Scholar]
  41. Jasinien, E.; Raiutis, R.; Literis, R.; Voleiis, A.; Vladiauskas, A.; Mitchard, D.; Amos, M. NDT of wind turbine blades using adapted ultrasonic and radiographic techniques. Insight Non-Destructive Test. Cond. Monit. 2009, 51, 477–483. [Google Scholar] [CrossRef] [Green Version]
  42. Tiwari, K.A.; Raisutis, R. Post-processing of ultrasonic signals for the analysis of defects in wind turbine blade using guided waves. J. Strain Anal. Eng. Des. 2018, 53, 546–555. [Google Scholar] [CrossRef]
  43. Bar-Cohen, Y. Emerging NDE Technologies and Challenges at the Beginning of the 3rd Millennium. NDT.net. 2000. Available online: https://www.ndt.net/article/v05n02/barcohen/barcohen.htm. (accessed on 7 December 2021).
  44. Garnier, C.; Pastor, M.-L.; Eyma, F.; Lorrain, B. The detection of aeronautical defects in situ on composite structures using Non Destructive Testing. Compos. Struct. 2011, 93, 1328–1336. [Google Scholar] [CrossRef] [Green Version]
  45. Oliveira, M.A.; Filho, E.F.S.; Albuquerque, M.C.; Santos, Y.T.; da Silva, I.C.; Farias, C.T. Ultrasound-based identification of damage in wind turbine blades using novelty detection. Ultrasonics 2020, 108, 106166. [Google Scholar] [CrossRef] [PubMed]
  46. Muñoz, C.Q.G.; Marquez, F.P.G.; Crespo, B.H.; Makaya, K. Structural health monitoring for delamination detection and location in wind turbine blades employing guided waves. Wind Energy 2019, 22, 698–711. [Google Scholar] [CrossRef] [Green Version]
  47. Lamb, H. On waves in an elastic plate. Proc. R. Soc. London. Ser. A Math. Phys. Sci. 1917, 93, 114–128. [Google Scholar] [CrossRef] [Green Version]
  48. Rogers, W.P. Elastic property measurement using Rayleigh-Lamb waves. Res. Nondestruct. Evaluation 1995, 6, 185–208. [Google Scholar] [CrossRef]
  49. Su, Z.; Ye, L.; Lu, Y. Guided Lamb waves for identification of damage in composite structures: A review. J. Sound Vib. 2006, 295, 753–780. [Google Scholar] [CrossRef]
  50. Bingham, J.; Hinders, M. Lamb Wave Detection of Delaminations in Large Diameter Pipe Coatings. Open Acoust. J. 2009, 2, 75–86. [Google Scholar] [CrossRef] [Green Version]
  51. Cawley, P.; Lowe, M.J.S.; Alleyne, D.N.; Pavlakovic, B.; Wilcox, P. Practical long range guided wave testing: Applications to pipes and rail. Mater. Eval. 2003, 61, 66–74. [Google Scholar]
  52. Chen, H.; Zhang, G.; Fan, D.; Fang, L.; Huang, L. Nonlinear Lamb wave analysis for microdefect identification in mechanical structural health assessment. Measurement 2020, 164, 108026. [Google Scholar] [CrossRef]
  53. Raišutis, R.; Tiwari, K.; Žukauskas, E.; Tumšys, O.; Draudvilienė, L. A Novel Defect Estimation Approach in Wind Turbine Blades Based on Phase Velocity Variation of Ultrasonic Guided Waves. Sensors 2021, 21, 4879. [Google Scholar] [CrossRef]
  54. Hayashi, T.; Song, W.-J.; Rose, J.L. Guided wave dispersion curves for a bar with an arbitrary cross-section, a rod and rail example. Ultrasonics 2003, 41, 175–183. [Google Scholar] [CrossRef]
  55. Bartoli, I.; Marzani, A.; di Scalea, F.L.; Viola, E. Modeling wave propagation in damped waveguides of arbitrary cross-section. J. Sound Vib. 2006, 295, 685–707. [Google Scholar] [CrossRef]
  56. Wilcox, P.D. A rapid signal processing technique to remove the effect of dispersion from guided wave signals. IEEE Trans. Ultrason. Ferroelectr. Freq. Control 2003, 50, 419–427. [Google Scholar] [CrossRef]
  57. Wilcox, P.; Lowe, M.; Cawley, P. The effect of dispersion on long-range inspection using ultrasonic guided waves. NDT E Int. 2001, 34, 1–9. [Google Scholar] [CrossRef]
  58. Yu, T.-H. Plate Waves Scattering Analysis and Active Damage Detection. Sensors 2021, 21, 5458. [Google Scholar] [CrossRef] [PubMed]
  59. Hu, Y.; Zhu, Y.; Tu, X.; Lu, J.; Li, F. Dispersion curve analysis method for Lamb wave mode separation. Struct. Heal. Monit. 2019, 19, 1590–1601. [Google Scholar] [CrossRef]
  60. Pai, P.F.; Deng, H.; Sundaresan, M.J. Time-frequency characterization of lamb waves for material evaluation and damage inspection of plates. Mech. Syst. Signal Process. 2015, 62–63, 183–206. [Google Scholar] [CrossRef]
  61. Jia, H.; Zhang, Z.; Liu, H.; Dai, F.; Liu, Y.; Leng, J. An approach based on expectation-maximization algorithm for parameter estimation of Lamb wave signals. Mech. Syst. Signal Process. 2019, 120, 341–355. [Google Scholar] [CrossRef]
  62. Dai, D.; He, Q. Structure damage localization with ultrasonic guided waves based on a time–frequency method. Signal Process. 2014, 96, 21–28. [Google Scholar] [CrossRef]
  63. Draudviliene, L.; Meskuotiene, A. The methodology for the reliability evaluation of the signal processing methods used for the dispersion estimation of Lamb waves. IEEE Trans. Instrum. Meas. 2021. [Google Scholar] [CrossRef]
  64. Crespo, B.H.; Courtney, C.R.P.; Engineer, B. Calculation of Guided Wave Dispersion Characteristics Using a Three-Transducer Measurement System. Appl. Sci. 2018, 8, 1253. [Google Scholar] [CrossRef] [Green Version]
  65. Kalashnikov, A.N.; Challis, R.E. Errors and uncertainties in the measurement of ultrasonic wave attenuation and phase velocity. IEEE Trans. Ultrason. Ferroelectr. Freq. Control 2005, 52, 1754–1768. [Google Scholar] [CrossRef] [PubMed]
  66. JCGM 101 JCGM 101:2008; Evaluation of measurement data—Supplement 1 to the “Guide to the expression of uncertainty in measurement”—Propagation of distributions using a Monte Carlo method. Evaluation 2008. The JCGM Member Organizations: Sèvres, France, 2008.
  67. Draudviliene, L.; Meskuotiene, A.; Tumsys, O.; Mazeika, L.; Samaitis, V. Metrological Performance of Hybrid Measurement Technique Applied for the Lamb Waves Phase Velocity Dispersion Evaluation. IEEE Access 2020, 8, 45985–45995. [Google Scholar] [CrossRef]
Figure 1. The waste hierarchy according to ‘the Waste Framework Directive’ of the European Union [7].
Applsci 12 01773 g001
Figure 2. The common damage modes in wind turbine blades.
Applsci 12 01773 g002
Figure 3. The schematic diagram of the safety and quality assurance of wind turbine blades (a), SHM example (b), NDT example (c).
Applsci 12 01773 g003
Figure 4. The real WTB sample (a) and graphical representation of the composite structure (b).
Applsci 12 01773 g004
Figure 5. Dispersion curves of the phase (a) and group (b) velocities up to 250 kHz calculated by the SAFE method.
Applsci 12 01773 g005
Figure 6. The hybrid experimental setup of WTB inspection using embedded MFC transmitter and mechanically scanned receiver (contact type transducer).
Applsci 12 01773 g006
Figure 7. The B-scan image and waveforms of the experimental signals of Lamb waves (the A0 mode). Distance from transmitter (a) 40 mm (position in the B-scan before the defect: x = 10 mm), (b) 95 mm (position in the B-scan, in the region of the defect: x = 65 mm), (c) 170 mm (position in the B-scan, (d) behind the defect: x = 140 mm).
Applsci 12 01773 g007
Figure 8. The example of expanded uncertainty of reconstructed frequency range for phase velocity mode.
Applsci 12 01773 g008
Table 1. GFRP material properties used in modelling.
ParametersNumerical Value
Paint (Surface layer):
Density (ρ)1270 kg/m3
Young’s modulus (E)4.2 GPa
Poisson’s ratio (υ)0.35
Unidirectional GFRP layer:
Density (ρ)1828 kg/m3
Young’s modulus (E1)42.5 GPa
Young’s modulus (E2)10 GPa
Poisson’s ratio (υ12)0.26
Poisson’s ratio (υ23)0.4
In-plane shear modulus (G12)4.3 GPa
Epoxy:
Density (ρ)1260 kg/m3
Young’s modulus (E)3.6 GPa
Poisson’s ratio (υ)0.35
Publisher’s Note: MDPI stays neutral with regard to jurisdictional claims in published maps and institutional affiliations.

