Article

Development of a FBG Stress Sensor for Geostress Measurement Using RSR Method in Deep Soft Fractured Rock Mass

1
State Key Laboratory of Geomechanics and Geotechnical Engineering, Institute of Rock and Soil Mechanics, Chinese Academy of Sciences, Wuhan 430071, China
2
College of Energy and Mining Engineering, Shandong University of Science and Technology, Qingdao 266590, China
3
State Key Laboratory of Coking Coal Resources Development and Comprehensive Utilization, Pingdingshan 467000, China
*
Author to whom correspondence should be addressed.
Appl. Sci. 2022, 12(4), 1781; https://doi.org/10.3390/app12041781
Submission received: 6 January 2022 / Revised: 31 January 2022 / Accepted: 4 February 2022 / Published: 9 February 2022
(This article belongs to the Special Issue Structural Mechanics of Rocks and Rock Masses)

Abstract

:
The rheological stress recovery (RSR) method was proposed to obtain measurements of in-situ stress. Rock stress can be evaluated by monitoring the recovery process of stress sensors embedded in rock mass. In order to achieve this application, a novel stress sensor employing the fiber Bragg grating (FBG) technique was designed and manufactured. This stress sensor consisted of three parts: A sensing spherical head, connecting rod, and coupler box. In the sensing spherical head, six independent pressure sensing units were assembled together with a temperature compensation unit. In addition, wavelength division multiplexing (WDM) technology was adopted to ensure that only one fiber splice for each stress sensor is output. The fiber splicing of the sensing units was assembled in the coupler box. The transformation equations from the six pressure sensing units to the stress sensor were established. Furthermore, a calibrating device for the stress sensor was designed, and the general calibration and long-term stability tests were carried out to investigate the characteristic indexes (maximum range, full-range output, and sensitivity) and measurement error (zero drift index, hysteresis index, and repeatability index). Measurement errors showed that the degrees of linearity, zero drift, hysteresis, and repeatability were all below 1.5%. The stability test indicated that the creep of the stress sensor can gradually stabilize in 24 days, and the errors were less than 1.5%. As a result, the stress sensor developed here satisfies the requirements for the RSR method and can be used in field.

1. Introduction

With the increase in mining depth, coal mine disasters are increasing, such as coal and gas outburst [1,2,3], rock burst [4,5,6], and large deformation of surrounding rock [7,8,9,10,11,12], which bring severe challenges to the safe and efficient mining of deep coal resources. The in-situ stress is one of the most critical factors, as it is not only the fundamental force leading to the disasters, but also has great impacts on gas pressure, rock burst degree, rock mass deformation, and strength characteristics. Therefore, in order to achieve the effective control of coal mine disasters, accurate and reliable in-situ stress data must be obtained through field measurement.
Hydraulic fracturing and overcoring are the two most widely used in-situ stress measurement methods at present [13,14,
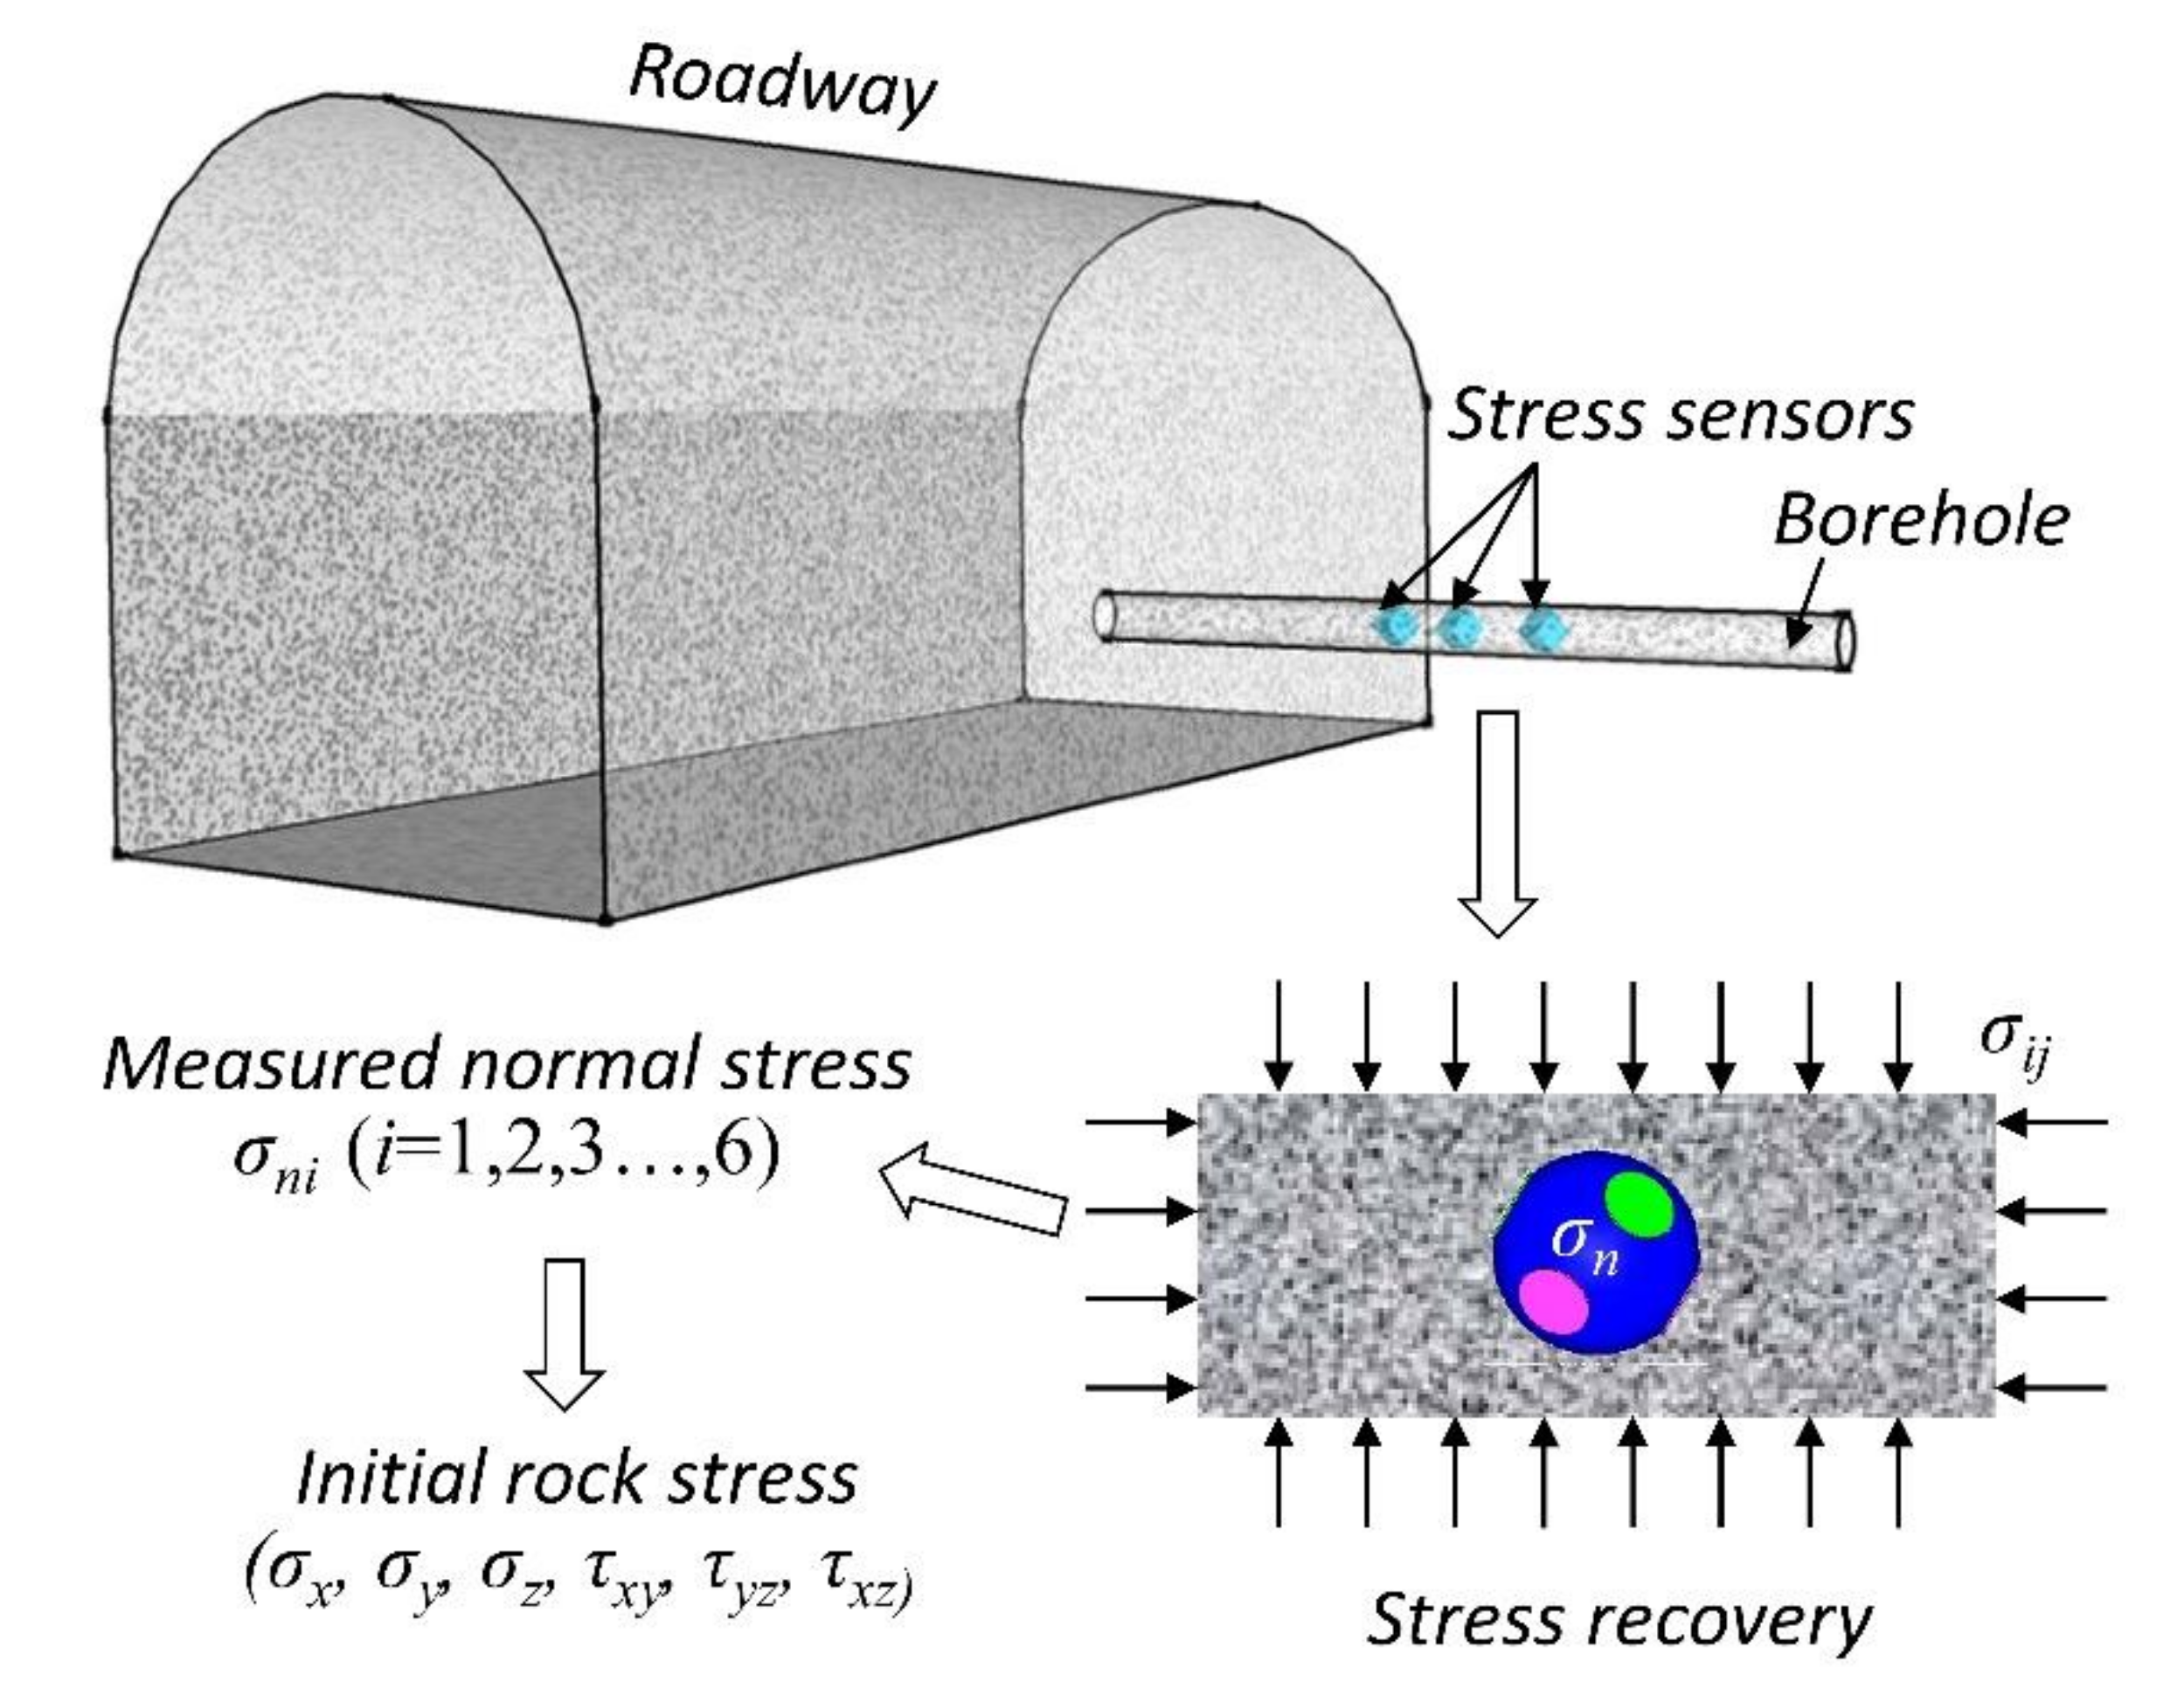
15]. Both of them are suitable for rock masses of substantial hardness and integrity. However, due to the influence of the sedimentary environment and tectonic movements, the deep rock masses of coal mines are usually weak and/or broken, which often leads to measurement failure. For this reason, a novel in-situ stress measurement technique, specialized for deep fractured rock masses, was put forward as the rheological stress recovery (RSR) method [16,17,18]. It is based on the strong rheological characteristics of fractured rock masses under high stress, and carried out by embedding the stress sensors into the drilling holes filled with grout. Due to the strong rheology of rock masses, the stress near the sensors gradually recovers. Meanwhile, the measured stress of the sensors increases and eventually stabilizes. The initial rock stress was finally evaluated via the recovery data obtained from the stress sensors (Figure 1).
According to the measuring principle of the RSR method, since the stress state of a point contains six stress components, the sensor needs to obtain six normal stresses in different directions to calculate the rock stress. However, in the field of geotechnical engineering, the commonly used pressure sensors are unidirectional and can only obtain one normal stress, such as the various pressure boxes used for measuring earth pressure, lining pressure, and pulling pressure of the anchor rod and cable [19,20,21]. In order to achieve multidirectional normal stress measurements, a three-direction vibrating wire pressure sensor was developed [22]. It resembles a cube, and contains three orthogonal pressure sensing units with a maximum range of 30 MPa (Figure 2). Based on the three-direction pressure sensor, the RSR method has been successfully applied to obtain in-situ stress measurements in Pingdingshan No.1 and No.11 coal mines [17,22,23]. At the same time, several problems have been found in the field. Firstly, the sensor is bulky and inconvenient to install. Secondly, it is difficult to determine the three-dimensional attitude of the sensor in the borehole. Thirdly, the proximity of the two sensors to each other can easily cause stress field disturbance, which is difficult to evaluate.
In recent years, due to the outstanding advantages of anti-electromagnetic interference, electrical insulation, and intrinsic safety, fiber optic sensing technology has been widely applied in coal mines. Many coal mines in China have established a sound optical fiber communication system, laying the foundation for the monitoring and early warning of deep coal mine disasters and the construction of smart mines. Meanwhile, in the field of sensor development, which includes such instruments as the fiber Bragg grating (FBG) sensor [24,25,26], distributed fiber optic sensors and fiber optic gas sensors have been developed and widely applied due to their high measurement accuracy and stability. Based on the testing principle of the RSR method and fiber optic sensing technology, this paper developed a new FBG stress sensor to solve the problems existing in the current three-direction pressure sensor, and provides support for the application of the RSR method for use on fractured rock masses in deep coal mines.

2. Development of FBG Stress Sensor

2.1. Basic theory of FBG

The FBG sensor is a wavelength-modulated fiber sensor. The sensing information of external parameters is obtained by modulating FBG center wavelength. The mathematical expression is:
λ B = 2 n e f f Λ
where λB is FBG center wavelength, neff is the effective refractive index of the fiber core, and Λ is the grating period. Equation (1) shows that the parameter λB depends on parameters neff and Λ. As a result, any physical processes that can change these two parameters will cause FBG wavelength drift (Figure 3).
When the FBG is subjected to uniform axial stress, the relationship between its change in wavelength, ΔλB, and axial strain, ε, can be expressed as follows:
Δ λ B λ B = ( 1 P e ) ε
where Pe is effective elastic coefficient and can be defined as:
P e = n e f f 2 2 [ ( P 11 + P 12 ) ν P 12 }
where P11 and P12 are elasto-optical coefficients, and ν is Poisson’s ratio. For specific fiber materials, the parameters P11, P12, and ν are constant. Equation (2) indicates that there is a linear relationship between FBG wavelength drift and strain change under uniform axial stress.
The temperature change, ΔλB, can also cause the change of FBG wavelength, and the relationship can be expressed as:
Δ λ B λ B = ( α + ζ ) Δ T
where α and ζ are coefficients of thermal expansion and thermal light, respectively, which as generally constant. Equation (4) indicates that there is also a linear relationship between FBG wavelength drift and temperature change.

2.2. Design of Sensing Units

The pressure sensing unit is the key component of the sensor, and its design is directly related to the measurement accuracy of the sensor. After comparison and selection of various schemes, the final design scheme for the sensing unit is shown in Figure 4. The upper part of the sensing unit is a cylindrical pressure head and the lower part is an elliptic strain ring. A rectangular cantilever beam is arranged on both sides of the long axis of the strain ring. A groove, which is used to set optical fiber installation, is arranged at the bottom of the cantilever beam. The FBG passes through the elliptic strain ring in the direction of the long axis and is then fixed by the fiber installation groove. The bottom of the elliptic strain ring is provided with a square base to maintain the stability of the sensing unit. When the top of the pressure head is subjected to an external pressure, the force will be transferred to the strain ring, resulting in tensile deformation along the long axis and contraction deformation along the short axis. The FBG fixed on the cantilever beam at both ends of the strain ring will produce synchronous stretching deformation, which will finally cause the wavelength change of the FBG.
Due to the three-dimensional geometric structure of the sensing unit, it is difficult to directly establish the relationship between the external pressure and the FBG strain through analytical solution. Therefore, numerical simulation is a preferable option. The finite element calculation model is consistent with the design scheme of the sensing unit (Figure 5). The material of the sensing unit is elastic stainless steel, with an elastic modulus and Poisson’s ratio of 192 GPa and 0.3, respectively. During the simulation, the bottom of the sensing unit was restrained, and the top was subjected to uniform pressure, P, with values of 5, 10, 15, 20, 25, and 30 MPa, respectively.
The simulation results are shown in Figure 6. It was found that within the design range of 0 to 30 MPa, there was a strong linear relationship between the FBG strain and the external pressure. As shown in Equation(2), the wavelength shift also increased linearly as strain increases. Therefore, there is also a linear relationship between the external pressure and the wavelength shift.

2.3. Measuring Directions of Sensing Units

According to the measurement principle of the RSR method, the buried sensor needs to measure six normal stresses in different directions to determine the stress state of the measuring point. Therefore, the sensor design needs to consider the angle arrangement of the sensing unit.
In the oxyz coordinate system, the stress state of a point can be represented by three normal stress components (σx, σy, σz) and three shear stress components (τxy, τyz, τzx). If the stress state is known, the normal stress, σn, in any direction in the coordinate system can be expressed as follows:
σ n = l 2 σ x + m 2 σ y + n 2 σ z + 2 l m τ x y + 2 m n τ y z + 2 n l τ z x
where l, m, and n are the direction cosines of the angle between the normal stress direction and the x, y, and z axis, respectively. Based on Equation (5), conversely, the stress state of a point can be calculated from the six normal stresses, σni, (i = 1,2,3,…6) measured by the sensor. The mathematical expression is:
{ σ x , σ y , σ z , τ x y , τ y z , τ z x } T = [ K ] 1 { σ n 1 , σ n 2 , σ n 3 , σ n 4 , σ n 5 , σ n 6 } T
where [K] is defined as:
[ K ] = l 1 2 m 1 2 n 1 2 2 l 1 m 1 2 m 1 n 1 2 n 1 l 1 l 2 2 m 2 2 n 2 2 2 l 2 m 2 2 m 2 n 2 2 n 2 l 2 l 3 2 m 3 2 n 3 2 2 l 3 m 3 2 m 3 n 3 2 n 3 l 3 l 4 2 m 4 2 n 4 2 2 l 4 m 4 2 m 4 n 4 2 n 4 l 4 l 5 2 m 5 2 n 5 2 2 l 5 m 5 2 m 5 n 5 2 n 5 l 5 l 6 2 m 6 2 n 6 2 2 l 6 m 6 2 m 6 n 6 2 n 6 l 6
where li, mi, ni (i = 1,2,3,…6) are the direction cosines of the angle between σni direction and the x, y, and z axis, respectively. It is worth emphasizing here that since we have to compute [K]−1, the determinant of [K] cannot be zero. If |K| = 0, it indicates that the six normal stresses measured by the sensor are not independent, and the stress state of the measuring point cannot be calculated. For example, the determinant of [K] is zero when two sensing units measure in opposite directions. As the normal stress measured in opposite directions should be equal, they are not independent. In addition, if three of the six measurement directions are orthogonal to each other, and the other three are also orthogonal to each other, then the determinant is also zero. According to the elastic theory, the sum of the normal stress in the three orthogonal directions is the first principal stress invariant, that is, the following relationship exists:
I 1 = σ n 1 + σ n 2 + σ n 3 = σ n 4 + σ n 5 + σ n 6
Equation (8) means that at least one of the six measuring directions is not independent, and the stress state of the measuring point cannot be completely determined.

2.4. Design of Structure of FBG Sensor

The whole structure of the stress sensor (Figure 7) mainly includes a spherical sensing head (a), connecting rod (b) and coupler box (c). Six sensing units are arranged into the sensing head to obtain the six normal stresses. In order to reduce the disturbance of the coupler box to the rock stress of the measuring point, the slender connecting rod is designed to connect the sensing head and the coupler, and act as the channel of the optical fiber. The coupler box is used for fusing the fibers derived from the sensing units and the temperature compensation unit, so that the sensor can output only one fiber, that is, one stress sensor only needs one FBG demodulator channel.
The spherical sensing head includes a solid sphere, sensing units, sealing cover, and hemispherical shell. The solid sphere is the supporting structure of the sensing head (Figure 8). The surface of the sphere is arranged with six cylindrical holes along different directions to install the sensing units. The fiber wiring groove and the fiber outlet hole are also arranged in this manner. The fiber outlet hole and the connecting rod are connected by a threaded joint (Figure 9). After the sensing units and seal cover are installed into the solid sphere, two hemispherical shells are used to wrap them inside by screw fixation. As is shown in Figure 10, the included angles of the three measured directions in the upper hemisphere and the horizontal plane are all 45°, and the included angles of their projections on the horizontal plane are all 120°. In the lower hemisphere, the included angles of the three measured directions and the horizontal plane are all 30°, while their projections on the horizontal plane are all 120°. According to the measurement direction of each sensing unit, the specific expression of [K] in Equation (7) under the oxyz coordinate system can be calculated as follows:
[ K ] 1 = 2.155 0.577 0.577 2.770 0.385 0.385   1.488 1.244 1.244 1.436 1.718 1.718   1.000 1.000 1.000 0.667 0.667 0.667   0.000 1.578 1.578 0.000 1.822 1.822   0.000 1.366 1.366 0.000 0.911 0.911   1.577 0.789 0.789 1.052 0.526 0.526
Due to the embedding effect, the rock mass stress will be disturbed when the sensor is embedded. In order to reduce the secondary disturbance of the coupler box to the surrounding rock mass stress of the sensing head, a slender connecting rod is set between the sensing head and the coupler box (Figure 11). The coupler box is fitted with a wire plate inside, which is used to fix the fused fiber. The bottom of the box is fitted with a connecting hole and an outlet hole for the cable. The connection hole is used to connect the installation and positioning device of the sensor, so as to determine the three-dimensional attitude of the sensor during sensor installing.

2.5. Sensor Manufacturing

The manufacturing materials of each component need to be selected by comparison to ensure that the sensor performance can meet the expected requirements. The final manufacturing materials of sensor components are shown in Table 1, which mainly include stainless steel 304, stainless steel 630 (heat treatment), aluminum alloy 2A12, and polyformaldehyde (POM) plastics. Stainless steel 304 is the most widely used chromium–nickel stainless steel, with high anti-corrosion properties, heat resistance, and processing performance. It is suitable for processing the hemispherical shell, coupler box, connecting rod, and the sealed cover, all of which have requirements for high corrosion resistance, despite having low mechanical performance. Stainless steel 630 is martensitic precipitation-hardened stainless steel, with high strength, hardness, and corrosion resistance. It is suitable for processing a sensing unit that has high corrosion resistance and strength. Aluminum alloy 2A12 is strong, and is approximately one third of the density of stainless steel. It is suitable for machining large volume parts, such as solid spheres, which have to meet lightweight design requirements. POM plastic has the characteristics of high rigidity and wear resistance, and is widely used in the production of internal instruments. Therefore, it was chosen as the processing material of the wire plate. In fact, the selection of sensor materials requires the comprehensive consideration of performance, reliability, cost, and other factors, which need to be constantly optimized and improved in applications. For example, if the solid sphere initially uses 304 stainless steel, the sensor will be "top-heavy" due to its high density, which is prone to cause the bending of the connecting rod and deformation of the screw joint. Therefore, an aluminum alloy with a lower density was selected to reduce the weight of the sensing head.
According to the sensor design and materials, the sensor parts were processed. The assembly process and final appearance of sensor parts are shown in Figure 12.

3. Calibration Equipment and Tests

3.1. Calibration Equipment

Due to the novel structure of the developed FBG sensor, it is inconvenient to calibrate it with traditional calibration test equipment. Therefore, a simple calibration device specifically for the FBG sensor was designed and manufactured (Figure 13). The device consists of support frame, guide, and load components. The support frame includes four adjustable bases, a bearing plate, and a sensor base. The guide component includes four guide bars that are fixed onto the bearing plate. The load component includes a loading plate, a loading bar, and some weights. The weights are placed onto the loading plate and the forces are transferred to the sensing unit via the loading bar.

3.2. Calibration Test

The calibration test aimed to check and verify the measurement performance of the sensor. According to the applicable fields of the FBG sensor, the national standards of China (JJG860-2015), and the common calibration methods for fiber optic sensors described in the literature, the calibration test program for the developed FBG sensor was formulated.
(1) Sensor preloading: Temperature will have an influence on the sensor. Based on previous experience in field stress testing, we decided to set 20 °C as the calibration temperature. Firstly, put the sensor in the laboratory for more than 2 hours at room temperature, 20 °C, to eliminate the effect of temperature change. Then, place the sensor in the calibration device for preloading. Each sensing unit preload is divided into three levels: 80, 160, and 240 kg, respectively, which correspond to the loading pressures 10, 20, and 30 MPa, respectively. For each preloading level, the loading stability time is set as 5 min. After loading, unload the sensing unit to a zero pressure state, and adjust the sensor position for the next preloading of the sensing unit. The purpose of preloading is to make close contact between the sensor parts to ensure that the sensing units will be of strong working condition and that the wavelength output will be more stable. At the same time, check whether the calibration device and related test instruments are working properly, and whether the test data output are accurate.
(2) Sensor cyclic loading: After preloading, the cyclic loading tests are carried out for each sensing unit. The specific steps are as follows:
① Place the sensor into the sensor base of the calibration device, adjust the senor unit and dowel bar to ensure they are coaxial, and record the initial output wavelength of the sensing unit. ② Put weights onto the loading plate of the calibration device with successive loading steps of 20 kg. After stabilizing for 2 mins, record the wavelength of the FBG demodulator under the corresponding load. Unload the weights when loading reaches 240 kg and the unloading path is consistent with the loading process. ③ Repeat step ②three times so that each sensing unit has three loading and unloading cycles. ④ Repeat steps ①–③ until all sensing units are calibrated. ⑤ Remove the sensor from the calibration device and end the calibration test.
The process of the calibration test is shown in Figure 14. As FBG is a temperature-sensitive material, temperature changes will affect the accuracy of calibration data. Therefore, during the test, the temperature change should be kept within ±5 °C, and the current temperature should be recorded every 30 mins. If the temperature change exceeds ±5 °C, the test data will be invalid and will need to be re-calibrated.
In order to check the test performance of the sensor under long-term working conditions, the stability test was carried out. The stability test can obtain the long-term stability of the sensor by applying long-term stability load to the sensing units and observing the change in the output wavelength of the sensing units with time. The test load was set to the full range, i.e., 30 MPa. The loading time was 24 days and the data recording time interval was 24 h.

4. Results and Discussion

The calibration curves of the sensor are shown in Figure 15. According to the calibration test data and the standard National Metrological Verification Regulation JJG860-2015 Pressure Sensor (Static) of China, the sensing characteristic index and measurement error index of the sensor were investigated. The sensing characteristic indexes include the maximum working range, the output value of the full range, and the sensitivity, etc., whereas the measurement error indexes include the linearity index, the zero drift index, the hysteresis index, and the repeatability index, etc. The specific definitions of each index are as follows.
The output value of the full range is defined as:
λ f = 1 n i = 1 n ( λ i max λ i min )
where λf is the output value of the full range, n is the total number of calibration loading and unloading cycles, and λimax (λimin) is the wavelength output value at the upper (lower) limit of the measurement when the sensing unit is under the ith cycle.
Zero drift refers to the fluctuation of the output value of the calibrated sensor in the absence of external load, which is defined as:
d = d i d 1 max λ f × 100 %
where d is zero drift, di is the ith zero output record, and d1 is the first zero output record.
The linear fitting formula of the sensing unit can be obtained by fitting the calibration test curve with the least square method:
y = kx + λB
where y is the output wavelength, x represents the external load, k is the slope of the fitting curve, and λB is the initial wavelength of the sensor. Then, the linearity is defined as:
ξ L = y ¯ i y i max λ f × 100 %
where y ¯ i is the average value of the output wavelength at the ith calibration point and yi is the corresponding value of the calibration point on the fitted line.
Repeatability refers to the repetition degree of the output data of the calibrated sensor. It is used to investigate the reliability and stability of the sensor, and is defined as:
ξ K = 3 K λ f × 100 %
where K is the standard deviation over the entire range, and is defined as:
K = 1 2 m i = 1 m ( K L i 2 + K U i 2 ) K L i = 1 n 1 j = 1 n ( y L i j y ¯ L i ) 2 K U i = 1 n 1 j = 1 n ( y U i j y ¯ U i ) 2
where KLi is the standard deviation for ith calibration point during loading, KUi is the standard deviation for ith calibration point during unloading, n is the number of calibration cycles, i is the sequence number of the calibration point, j is the sequence number of the calibration cycles, yLij is the output wavelength for the jth cycle at the ith calibration point during loading, y ¯ L i is the average wavelength at the ith calibration point during loading, yUij is the output wavelength for the jth cycle at the ith calibration point during unloading, y ¯ U i is the average wavelength at the ith calibration point during unloading, and m is the number of calibration points.
Hysteresis refers to the difference between the output wavelength of the sensor at the calibration point, which mainly reflects the accuracy and assembly performance of the sensor. It is defined as:
ξ Z = y ¯ L i y ¯ U i max λ f × 100 %
Sensitivity refers to the change in the FBG wavelength per MPa, and is defined as:
α = λ f / P max
where Pmax is the maximum working range.
According to the above definitions and calculation formulae, the characteristic indexes of the sensor are calculated. As can be seen in Table 2, the maximum working range of the sensor calibration is 30 MPa, the output wavelength of the full range is 2688 to 2900 pm, and the sensitivity ranges from 89.600 to 96.656 pm/MPa. According to Equation (2), there is a linear relationship between wavelength drift and fiber strain. Considering the elastic-optic coefficient, Pe, is 0.216 for common fiber materials, the strain of full-range fiber grating can be calculated as 2238.273 to 2390.323. Table 3 reveals that the zero drift index of the sensor ranges from 0.035 to 1.158%, the linearity index ranges from 0.392 to 1.225%, the repeatability index ranges from 0.139 to 0.833%, the hysteresis index ranges from 0.281 to 1.166%, and the error index is within the range of 1.5%.
The stability test results for 1#, 3#, and 5# pressure sensing units are shown in Figure 16. It indicates that there is a creep phenomenon in the sensing unit under the long-term load, and the creep drift changes rapidly during the first few days, which gradually slows down in the later period, and finally stabilizes. According to the calibration coefficient and wavelength variation, the long-term measurement errors of the 1#, 3#, and 5# sensing units were calculated as 1.51, 1.50, and 1.45%, respectively.
Fiber wavelength division multiplexing (WDM) technology was adopted for the sensor to ensure that only one channel of the optical fiber demodulation instrument was occupied for a single sensor. That is, each sensing unit took up a different wavelength range, and then the optical fibers for each sensor were welded into the coupler box. As a result, only one optical fiber connector of the sensor was outputted. In order to achieve the use of the sensor in the coal mine, an intrinsically safe optical fiber demodulator was developed. The wavelength demodulator range is 1,525 to 1,565 nm. Based on this, the wavelength range of each sensing unit was designed to be 5 nm (-1 to 4 nm), that is, the wavelength change of each sensing unit under tension was no more than 1 nm, and the wavelength change under pressure was no more than 4 nm.
According to the calibration test data, the initial wavelength of sensing units 1# to 6# are: 1,531.80; 1,537.05; 1,542.44; 1,547.35; 1,552.51; 1,557.43 nm, respectively. It was calculated that the initial wavelength interval of sensing units 1# to 6# is 4.91–5.25 nm, basically consistent with the wavelength design range of the sensing unit. According to Table 2, the wavelength varies from 2,688 to 2,900 pm when the sensing unit is subjected to 30 MPa, which is approximately 67.2 to 72.5% of the designed wavelength range (4 nm), indicating that the design range of the sensor has sufficient redundancy.
In general, the performance of the sensor developed in this paper reaches the level of accuracy index 2.0, which meets the test requirements for engineering applications. However, due to the limitations of processing conditions and cost, the precision and assembly level of the sensor parts still require improvement, and the accuracy level could also be further improved. In addition, the sensor test used in this paper is limited to the routine calibration and stability tests, and the calibration results cannot be directly applied to the practical engineering environment. In order to apply the sensor in field, more numerical and/or physical simulation studies are needed to master the test performance of the sensor under different working conditions.

5. Conclusions

(1) According to the principle of the RSR method, an FBG-type compressive stress sensor was designed and developed. The sensor consists of six pressure sensing units and one temperature compensation unit, which can achieve the measurement of stress state at a point.
(2) The stress sensor adopts fiber WDM and fusion technology. Each sensing unit occupies a 5 nm wavelength, and the maximum range is designed to be 30 MPa. A single stress sensor only occupies one FBG demodulation channel.
(3) The calibration results show the maximum calibration range of the sensor is 30 MPa, the maximum output wavelength of the full range is 2900 pm, and the maximum sensitivity is 96.656 pm/MPa. The stress sensor designed here shows a strong test performance and a high long-term stable performance, with a maximum error of 1.51%. Test results also indicate that all of the zero drift, linearity, repeatability, and hysteresis indexes are lower than 1.5%.

Author Contributions

Conceptualization, Y.Z.; methodology, Y.Z.; software, Y.Z.; validation, B.L. and S.W.; data curation, Z.Y.; writing-original draft preparation, Y.Z. and S.W.; writing-review and editing, Y.Z., S.W. and Z.Y.; funding acquisition, Y.Z., B.L. All authors have read and agreed to the published version of the manuscript.

Funding

National Natural Science Foundation of China (Grant No. 51874275, 51974289).

Institutional Review Board Statement

Not applicable.

Informed Consent Statement

Not applicable.

Data Availability Statement

All data used to support the findings of this study are included within the article, and there are no restrictions on data access.

Conflicts of Interest

The authors declare no conflict of interest.

References

  1. Hu, Q.; Zhou, S.; Zhou, X. Mechanical mechanism of coal and gas outburst process. J. Chin. Coal Soc. 2008, 33, 1368–1372. [Google Scholar]
  2. Liang, Y.; Sheng, X.; Jun, X. Study and Application of Gas Content to Prediction of Coal and Gas Outburst. Coal Sci. Technol. 2011, 47, 162–168. [Google Scholar]
  3. Liu, X.; Liu, Q.; Liu, B.; Kang, Y. A Modified Bursting Energy Index for Evaluating Coal Burst Proneness and Its Application in Ordos Coalfield, China. Energies 2020, 13, 1729. [Google Scholar] [CrossRef] [Green Version]
  4. Meng, F.; Wong, L.; Zhou, H.; Wang, Z.; Zhang, L. Asperity degradation characteristics of soft rock-like fractures under shearing based on acoustic emission monitoring. Eng. Geol. 2020, 266, 1–14. [Google Scholar] [CrossRef]
  5. Cai, M.; Ji, D.; Guo, Q. Study of rockburst prediction based on in-situ stress measurement and theory of energy accumulation caused by mining disturbance. Chin. J. Rock Mech. Eng. 2013, 32, 1973–1980. [Google Scholar]
  6. Xu, J.; Jiang, J.; Xu, N.; Liu, Q.; Gao, Y. A new energy index for evaluating the tendency of rockburst and its engineering application. Eng. Geol. 2017, 230, 46–54. [Google Scholar] [CrossRef]
  7. Guo, P.; He, M.; Wang, J. Study on Coupling Support Technique in the Roadway of Hecaogou No. 2 Coal Mine with Soft Roadway of Large Deformation. Geotech. Geol. Eng. 2017, 36, 1–13. [Google Scholar] [CrossRef]
  8. He, M.; Xie, H.; Peng, S.P. Study on rock mechanics in deep mining engineering. Rock Mech. Eng. 2005, 24, 2803–2813. [Google Scholar]
  9. Kang, K.; Liu, Q.; Gong, G. Application of a combined support system to the weak floor reinforcement in deep underground coal mine. Int. J. Rock Mech. Min. Sci. 2014, 74, 143–150. [Google Scholar] [CrossRef]
  10. Liu, X.; Liu, Q.; He, J. Numerical simulation of cracking process in rock mass under the coupled thermo-mechanical condition. Int. J. Comput. Methods 2020, 17, 1950065. [Google Scholar] [CrossRef]
  11. Liu, X.; Liu, Q.; Liu, B. Failure Behavior for Rocklike Material with Cross Crack under Biaxial Compression. J. Mater. Civ. Eng. (ASCE) 2019, 31, 06018025. [Google Scholar] [CrossRef]
  12. Liu, X.; Liu, Q.; Kang, Y. Investigation on relationship of the burial depth and mechanical properties for sedimentary rock. Arab. J. Geosci. 2020, 13, 760. [Google Scholar] [CrossRef]
  13. Ljunggren, C.; Chang, Y.; Janson, T. An overview of rock stress measurement methods. Int. J. Rock Mech. Min. Sci. 2003, 40, 975–989. [Google Scholar] [CrossRef]
  14. Fairhurst, C. Stress estimation in rock: A brief history and review. Int. J. Rock Mech. Min. Sci. 2003, 40, 957–973. [Google Scholar] [CrossRef]
  15. Ge, X.R.; Hou, M.X. A new 3D in-situ rock stress measuring method: Borehole wall stress relief method (BWSRM) and development of geostress measuring instrument based on BWSRM and its primary applications to engineering. Chin. J. Rock Mech. Eng. 2011, 30, 2161–2180. [Google Scholar]
  16. Jiang, J.J.; Liu, Q.S.; Xu, J. Analytical investigation for stress measurement with the rheological stress recovery method in deep soft rock. Int. J. Min. Sci. Technol. 2016, 26, 1003–1009. [Google Scholar] [CrossRef]
  17. Liu, B.; Zhu, Y.; Liu, Q. A Novel in Situ Stress Monitoring Technique for Fracture Rock Mass and Its Application in Deep Coal Mines. Appl. Sci. 2019, 9, 3742. [Google Scholar] [CrossRef] [Green Version]
  18. Zhu, Y.G.; Liu, Q.S. A new three-dimensional pressure transducer for measuring soft rock stress. Geotech. Test. J. 2016, 39, 703–711. [Google Scholar] [CrossRef]
  19. Finno, R.J. Geotechnical instrumentation for monitoring field performance. Eng. Geol. 1988, 30, 237–238. [Google Scholar] [CrossRef]
  20. Talesnick, M. Measuring soil contact pressure on a soil boundary and quantifying soil arching. Geotech. Test. J. 2005, 28, 171–179. [Google Scholar]
  21. Chen, W.; Randolph, M.F. Measuring radial total stresses on model suction caissons in clay. Geotech. Test. J. 2006, 30, 1–9. [Google Scholar]
  22. Zhang, F.; Liu, Q.S.; Zhang, C.Y. Measurement of geostress and sensor about rheological stress recovery method. Rock Soil Mech. 2014, 35, 3273–3279. [Google Scholar]
  23. Zhu, Y.; Liu, Q.; Liu, X.; Yang, Z. Analytical Solutions for the Circular Stress Transducer Embedded in Rheological Rock Mass. Appl. Math. Model. 2020, 81, 538–558. [Google Scholar] [CrossRef]
  24. Jin, L.; Zhang, W.; Zhang, H. An embedded FBG sensor for simultaneous measurement of stress and temperature. IEEE Photonic. Technol. L. 2006, 18, 154–156. [Google Scholar] [CrossRef]
  25. Peng, P.; Huang, K. Fiber Bragg Grating Sensor System with Two-Level Ring Architecture. IEEE Sens. J. 2009, 9, 309–313. [Google Scholar] [CrossRef]
  26. Xu, W.; Wang, J.; Zhao, J. Reflective Liquid Level Sensor Based on Parallel Connection of Cascaded FBG and SNCS Structure. IEEE Sens. J. 2017, 17, 1347–1352. [Google Scholar] [CrossRef]
Figure 1. Schematic diagram of RSR method.
Applsci 12 01781 g001
Figure 2. Three-directional vibrating wire pressure sensor: (a) sensor face; (b) clipped corner; (c) sealed washer; (d) cable.
Applsci 12 01781 g002
Figure 3. Schematic diagram of FBG sensor principle.
Applsci 12 01781 g003
Figure 4. Design of sensing unit: a, cylindrical pressure head; b, elliptic strain ring; c, rectangular cantilever beam; d, fiber installing groove; e, square base; f, FBG.
Applsci 12 01781 g004
Figure 5. Finite element modeling of sensing unit.
Applsci 12 01781 g005
Figure 6. Variation of FBG strain with loading pressure.
Applsci 12 01781 g006
Figure 7. FBG sensor structure: a, spherical sensing head; b, connecting rod; c, coupler box.
Applsci 12 01781 g007
Figure 8. Three-dimensional perspective of spherical head: a, solid sphere; b, sensing unit; c, sealed cover; d, hemispherical shell; e, threaded hole.
Applsci 12 01781 g008
Figure 9. Structure of solid sphere: a, mounting hole; b, fiber groove; c, fiber exit hole.
Applsci 12 01781 g009
Figure 10. Design of measuring direction of sensor head.
Applsci 12 01781 g010
Figure 11. Design of measuring direction of sensor head: a, connector; b, connecting rod; c, coupler box; d, optical fiber plate; e, outlet hole; f, connecting hole.
Applsci 12 01781 g011
Figure 12. Diagram of the FBG sensor: (a), assembled sensing unit; (b), assembled hemispherical shell; (c), assembled connecting rod; (d), fiber splicing; (e), optical cable outlet.
Applsci 12 01781 g012
Figure 13. Schematic diagram of calibration device: 1, adjustable base; 2, bearing plate; 3, guide bar; 4, loading plat; 5, sensor base; 6, sensor; 7, loading bar; 8, weights.
Applsci 12 01781 g013
Figure 14. Calibration test of the sensor: a, calibration device; b, sensor; c, FBG demodulation; d, weights.
Applsci 12 01781 g014
Figure 15. Stability testing curves of the sensor.
Applsci 12 01781 g015
Figure 16. Calibration curves of the sensor.
Applsci 12 01781 g016aApplsci 12 01781 g016b
Table 1. Manufacturing material of sensor parts.
Material TypePart Name
Stainless steel (304)Hemispherical shell, connecting rod, coupler box, sealed cover
Aluminum alloy (2A12)Solid sphere
Stainless steel (630, heat treatment)Sensing unit
POM plasticOptical fiber plate
Table 2. Characteristics index of sensing units.
Unit No.Maximum Working Range/MPaOutput Wavelength of the Full Range (nm)Sensitivity
(pm/MPa)
1302.68889.600
2302.84594.833
3302.89096.333
4302.90096.656
5302.76492.144
6302.75391.767
Table 3. Error index of sensing units.
Unit No.Zero Drift
(%)
Linearity
(%)
Repeatability
(%)
Hysteresis
(%)
10.5211.2250.4031.166
20.0351.1440.1590.281
30.0690.9500.2530.542
40.4830.6020.3750.586
51.1580.8600.8330.941
60.2540.3920.1390.545
Publisher’s Note: MDPI stays neutral with regard to jurisdictional claims in published maps and institutional affiliations.

