
The Effect of Back Pressure Change on Exhaust Emissions According to the Confluence Geometry of a Dual Exhaust System in Idling


Abstract
:1. Introduction
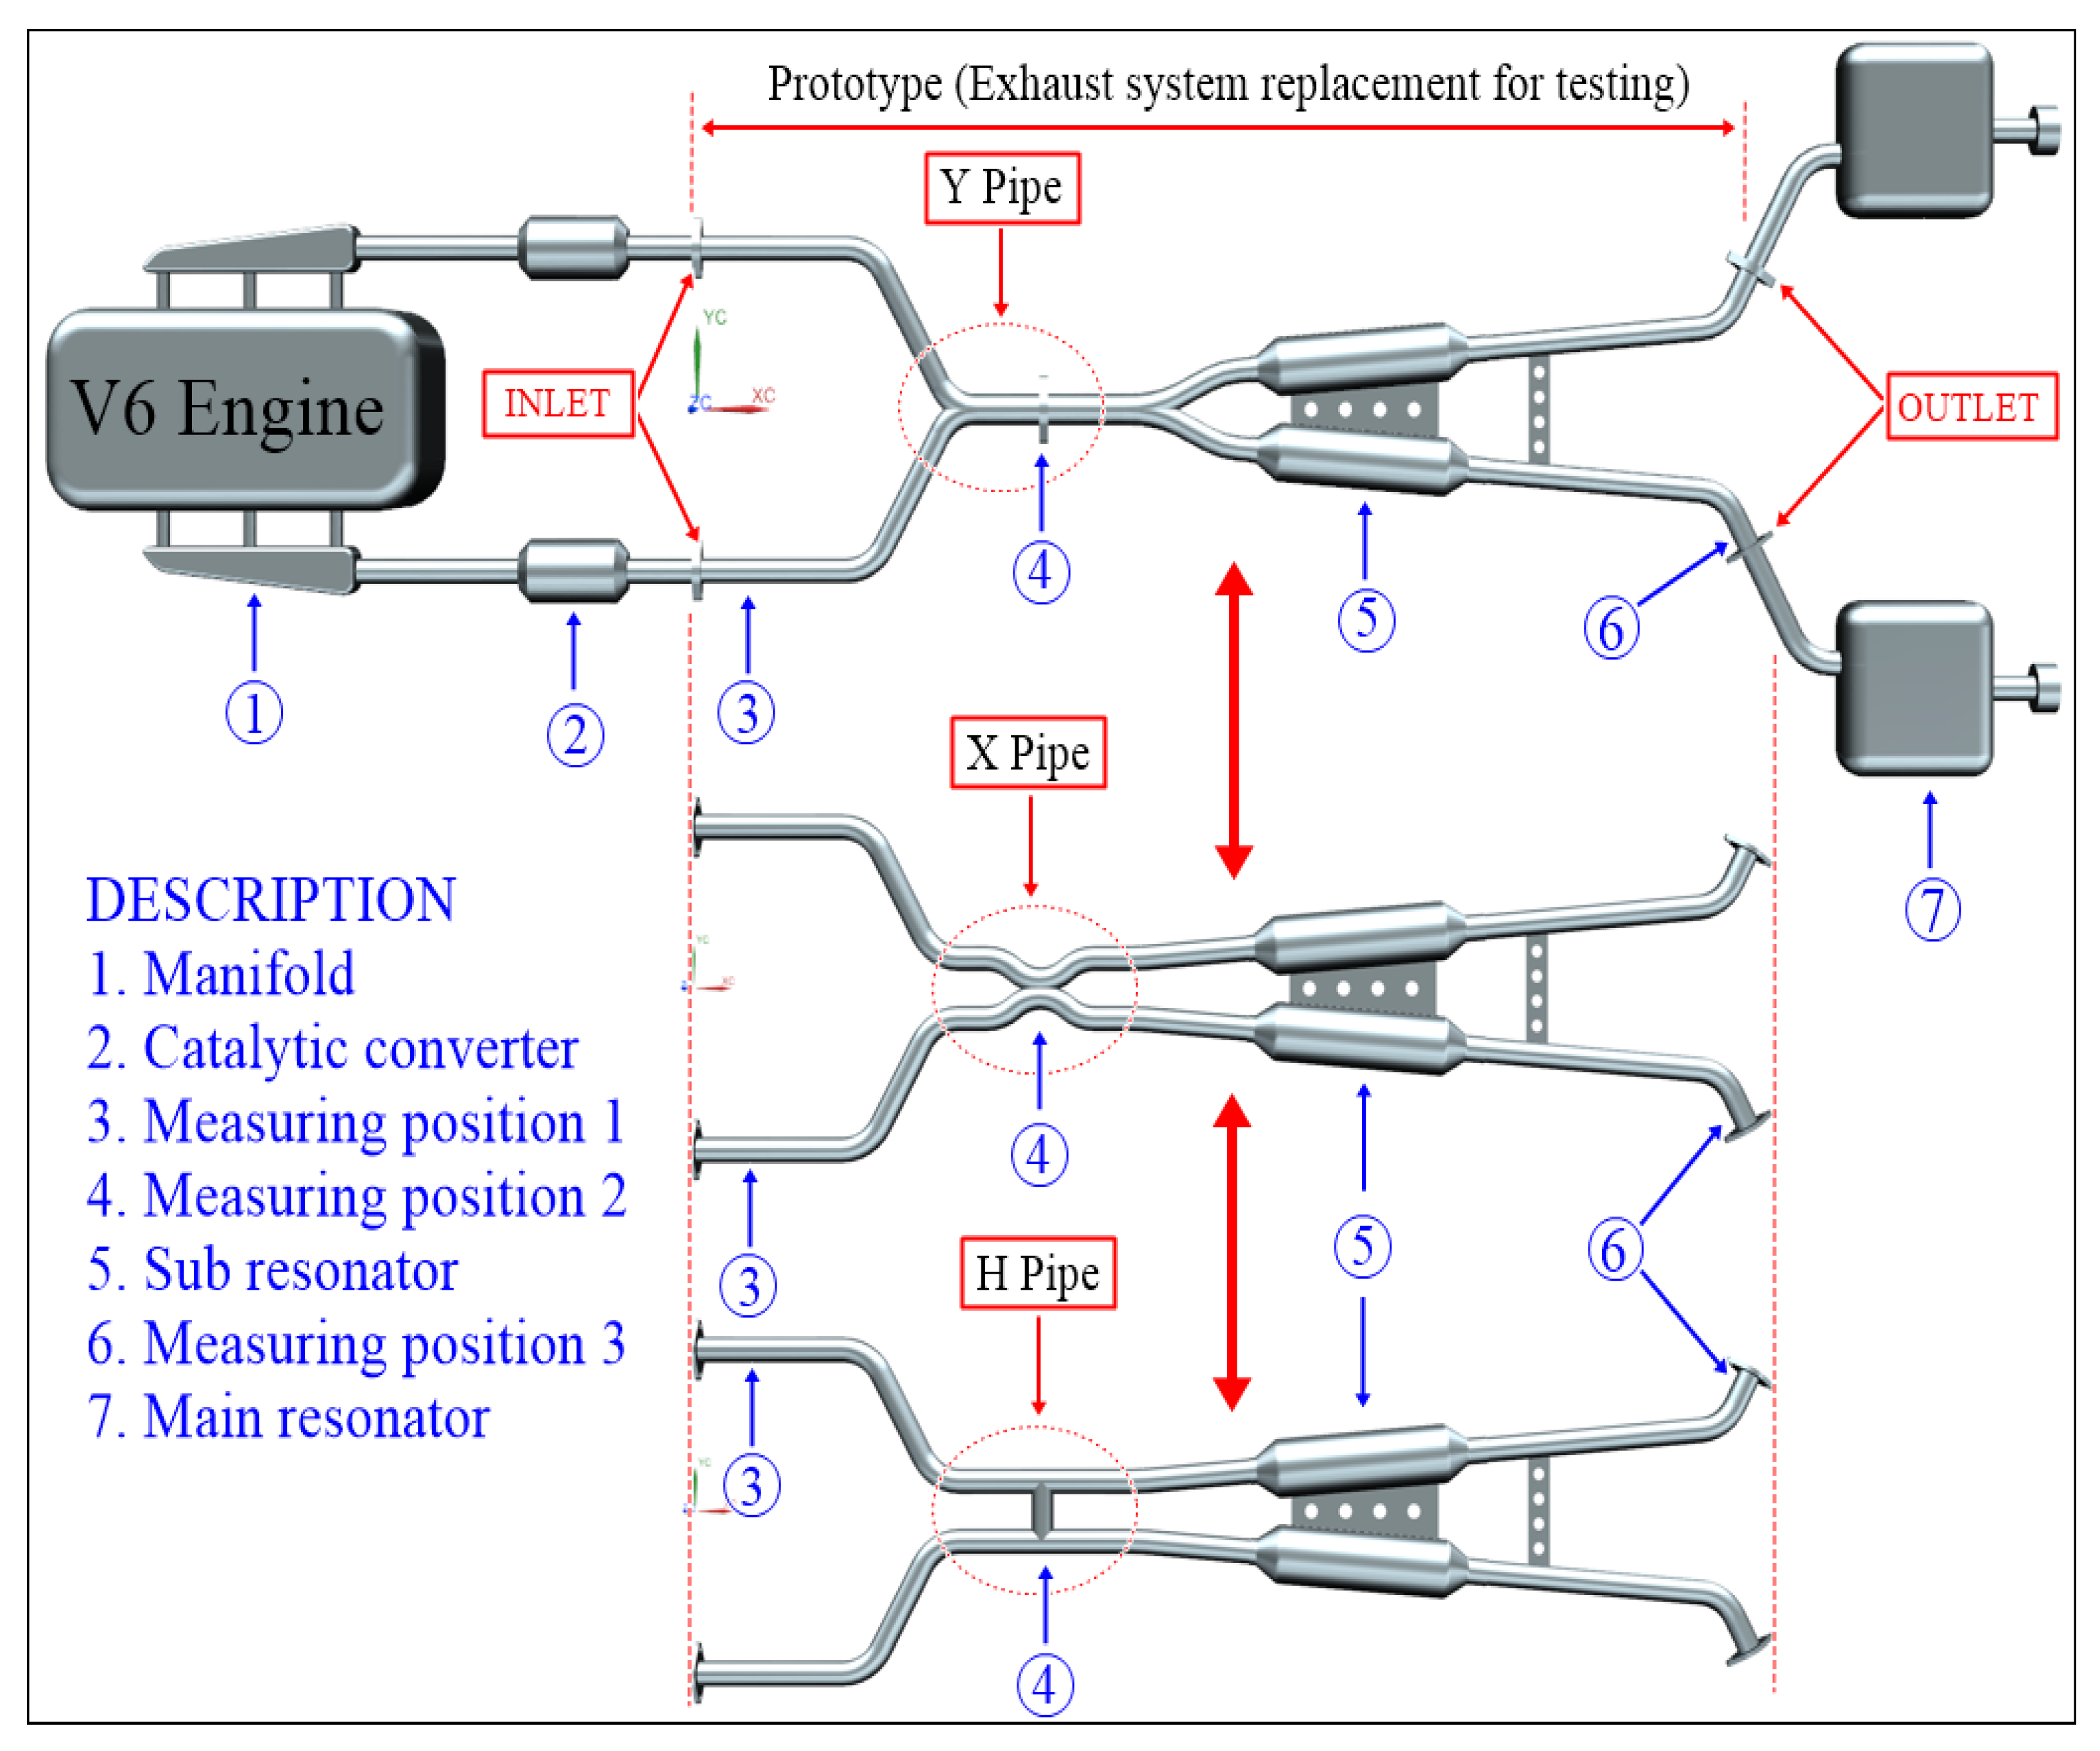
2. Prototype Design
3. Experiment Method
3.1. Back Pressure Measurement
3.2. Exhaust Emission Measurement
4. Results and Discussion
4.1. Analysis of the Measured Back Pressure
4.2. Analysis of the Measured Exhaust Emissions
5. Conclusions
Author Contributions
Funding
Institutional Review Board Statement
Informed Consent Statement
Data Availability Statement
Conflicts of Interest
References
- Kang, I.S.; Yang, S.M. Effect of Confluence Geometry of Dual Exhaust System on Quietness and Power. Int. J. Automot. Technol. 2021, 22, 27–36. [Google Scholar] [CrossRef]
- Reitz, R.D.; Ogawa, H.; Payri, R. The future of the internal combustion engine. Int. J. Engine Res. 2020, 21, 3–10. [Google Scholar] [CrossRef] [Green Version]
- Baidya, S.; Borken-Kleefeld, J. Atmospheric emissions from road transportation in India. Energy Policy 2009, 37, 3812–3822. [Google Scholar] [CrossRef] [Green Version]
- Kang, I.S. A Study on Confluence Chamber Shape and Variable Device of Exhaust System to Improve Gasoline Engine Performance. Ph.D. Thesis, Chonbuk National University, Jeonju-si, Korea, 2020. [Google Scholar]
- Pulkrabek, W.W. Engineering Fundamentals of the Internal Combution Engine, 2nd ed.; Prentice Hall: Hoboken, NJ, USA, 1997; pp. 262–268. [Google Scholar]
- Cikanek, H.A.; Haghgooie, M.; Newman, C.E.; Davis, G.C. The Effect of Valve Overlap on Idle Operation: Comparison of Model and Experiment. SAE Tech. Pap. 1993, 102, 1462–1469. [Google Scholar]
- Cairns, A.; Zhao, H.; Todd, A.; Aleiferis, P. A study of mechanical variable valve operation with gasoline–alcohol fuels in a spark ignition engine. Fuel 2012, 106, 802–813. [Google Scholar] [CrossRef]
- Kramer, U.; Phlips, P. Phasing Strategy for an Engine with Twin Variable Cam Timing. SAE Trans. 2002, 111, 1751–1759. [Google Scholar]
- Hatat, N.I.; Chalet, D.; Lormier, F.; Chesse, P. Influence of the combustion chamber geometry on the scavenging of a four-stroke internal combustion engine during the valve overlap period. J. Automob. Eng. 2016, 230, 1873–1890. [Google Scholar] [CrossRef]
- Ojapah, M.M.; Zhao, H.; Zhang, Y. Effects of ethanol on combustion and emissions of a gasoline engine operating with different combustion modes. Int. J. Engine Res. 2016, 17, 998–1011. [Google Scholar] [CrossRef]
- Yun, H.; Idicheria, C.; Najt, P. The effect of advanced ignition system on gasoline low temperature combustion. Int. J. Engine Res. 2021, 22, 417–429. [Google Scholar] [CrossRef]
- Myung, C.L.; Kwak, H.; Hwang, I.G.; Park, S. Theoretical Flow Analysis and Experimental Study on Time Resolved THC Formation with Residual Gas in a Dual CVVT Engine. Int. J. Automot. Technol. 2007, 8, 697–704. [Google Scholar]
- Cho, M.; Lee, K.; Lee, J.; Yoo, J.; Min, K. Measurements and Modeling of Residual Gas Fraction in SI Engines. SAE Tech. Pap. 2001, 113, 860–869. [Google Scholar]
- Giansetti, P.; Perrier, C.; Higelin, P.; Chamaillard, Y.; Charlet, A.; Couet, S. A Model for Residual Gas Fraction Prediction in Spark Ignition Engines. SAE Tech. Pap. 2002, 111, 2272–2283. [Google Scholar]
- Giansetti, P.; Colin, G.; Higelin, P.; Chamaillard, Y. Residual gas fraction measurement and computation. Int. J. Engine Res. 2007, 8, 347–364. [Google Scholar] [CrossRef]
- Jang, J.Y.; Park, Y.G.; Bae, C.S.; Kim, W.T. Effect of Operating Condition on the Residual Gas Fraction in an SI Engine. Trans. Korean Soc. Automot. Eng. 2002, 10, 11–18. [Google Scholar]
- Kang, I.S.; Yang, S.M. Influence of Back Pressure of an Exhaust System on Quietness at Low-Speed Rotation. J. Korean Soc. Manuf. Process Eng. 2019, 18, 69–75. [Google Scholar] [CrossRef]
- Kang, I.S.; Yang, S.M. Effect of Junction Chamber Shape of an Exhaust System on Noise and Vibration during Idling. J. Korean Soc. Mech. Technol. 2019, 21, 491–498. [Google Scholar]
- Kim, D.S.; Kim, S.C.; Hwang, S.H.; Cho, Y.S.; Ohm, I.Y. Estimation of Exhaust Gas Recirculation using In-Cylinder Residual Gas Fraction in an SI Engine. Trans. Korean Soc. Automot. Eng. 2004, 12, 55–60. [Google Scholar]
- Senecal, P.K.; Xin, J.; Reitz, R.D. Predictions of residual gas fraction in ic engines. SAE Tech. Trans. 1996, 105, 2243–2254. [Google Scholar]
- Sandquist, H.; Wallesten, J.; Enwald, K.; Stromberg, S. Influence of Valve Overlap Strategies on Residual Gas Fraction and Combustion in a Spark Ignition Engine at Idle. SAE Tech. Trans. 1997, 106, 1375–1386. [Google Scholar]
- Yang, C.; Zhao, H. Naturally aspirated and boosted controlled auto-ignition combustion with positive valve overlap in a four stroke gasoline engine. Int. J. Engine Res. 2013, 14, 3–10. [Google Scholar] [CrossRef]
- Kim, J.H.; Bae, C.S. Emission reduction through internal and low-pressure loop exhaust gas recirculation configuration with negative valve overlap and late intake valve closing strategy in a compression ignition engine. Int. J. Engine Res. 2017, 18, 973–990. [Google Scholar] [CrossRef]
- Bae, M.W.; Ku, Y.J.; Park, H.S. A Study on Tuning Effects of Intake Manifold, Intake Pipe and Air Filter upon Performance and Exhaust Emissions of Driving Car. Trans. Korean Soc. Automot. Eng. 2016, 24, 538–548. [Google Scholar] [CrossRef] [Green Version]
- Bae, M.W.; Ku, Y.J.; Park, H.S. A Study on Effects of Tuning Intake and Exhaust Systems upon Engine Performance in a Driving Gasoline Car. Trans. Korean Soc. Mech. Eng. B 2017, 41, 775–784. [Google Scholar] [CrossRef]
- Cho, J.U.; Han, M.S. Study on Thermal Stress and Flow Analysis at Exhaust Manifold of Car. Trans. Korean Soc. Automot. Eng. 2014, 22, 23–28. [Google Scholar] [CrossRef]
- Shah, S.; Kuppili, S.; Hatti, K.; Thombare, D. A Practical Approach towards Muffler Design Development and Prototype Validation. SAE Tech. Pap. 2010, 21, 1–16. [Google Scholar]
- Taylor, W. CFD Prediction and Experimental Validation of High-Temperature Thermal Behavior in Catalytic Converters. SAE Tech. Pap. 1999, 1455, 29–42. [Google Scholar]
- Ruzal-Mendelevich, M.; Katoshevski, D.; Sher, E. Controlling nanoparticles emission with particle-grouping exhaust-pipe. Fuel 2016, 166, 116–123. [Google Scholar] [CrossRef]


| Type (Unit) | Y-Type | X-Type | H-Type |
|---|---|---|---|
| Pipe size (mm) | 63.5 | 50.8 | 50.8 |
| Cross section (mm2) | 2874.75 | 3262.98 | 3589.02 |
| Description | Specification |
|---|---|
| Type of Engine | DOHC 24-valve |
| Cylinder Type | V6 |
| Bore, stroke | 95.5, 86.0 mm |
| Compression ratio(:1) | 11.0 |
| Maximum Power | 330 hp/7000 |
| Maximum Torque | 36.8 kgf∙m/5200 |
| Description | Specification |
|---|---|
| Transducer type | Piezo resistive |
| Measurable Range | −30~30 kPa |
| Accuracy | ±0.25 |
| Operating temperature range | −20~100 °C |
| Output type | 4~20 mA (2 wire) |
| Description | Specification |
|---|---|
| Number of input channels | 20 channels |
| Accuracy | Voltage ± 0.1% |
| Sampling interval | 10 ms (1 channel), 50 ms (4 channel) |
| Operating environment | 0 to 45 °C, 5 to 85% RH |
| Description | Specification |
|---|---|
| Measuring item | CO, THC, CO2, O2, λ, AFR, NOx |
| Measuring method | CO, THC, CO2: NDIR, O2, NOx: Electrochemical cell |
| Repeatability | Less than ±2% FS |
| Operating temperature range | 0~40 °C |
Publisher’s Note: MDPI stays neutral with regard to jurisdictional claims in published maps and institutional affiliations. |
© 2022 by the authors. Licensee MDPI, Basel, Switzerland. This article is an open access article distributed under the terms and conditions of the Creative Commons Attribution (CC BY) license (https://creativecommons.org/licenses/by/4.0/).
Share and Cite
Kang, I.-s.; Yang, S.-m. The Effect of Back Pressure Change on Exhaust Emissions According to the Confluence Geometry of a Dual Exhaust System in Idling. Appl. Sci. 2022, 12, 1855. https://doi.org/10.3390/app12041855
Kang I-s, Yang S-m. The Effect of Back Pressure Change on Exhaust Emissions According to the Confluence Geometry of a Dual Exhaust System in Idling. Applied Sciences. 2022; 12(4):1855. https://doi.org/10.3390/app12041855
Chicago/Turabian StyleKang, Il-seok, and Sung-mo Yang. 2022. "The Effect of Back Pressure Change on Exhaust Emissions According to the Confluence Geometry of a Dual Exhaust System in Idling" Applied Sciences 12, no. 4: 1855. https://doi.org/10.3390/app12041855
APA StyleKang, I.-s., & Yang, S.-m. (2022). The Effect of Back Pressure Change on Exhaust Emissions According to the Confluence Geometry of a Dual Exhaust System in Idling. Applied Sciences, 12(4), 1855. https://doi.org/10.3390/app12041855