Article

Pedestrian Counting Based on Piezoelectric Vibration Sensor

1
Distributed Systems Group, University of Duisburg-Essen, 47057 Duisburg, Germany
2
School of Information Engineering, Zhengzhou University, Zhengzhou 450001, China
3
Institute for Molecular Medicine Finland (FIMM), University of Helsinki, 00014 Helsinki, Finland
*
Author to whom correspondence should be addressed.
Appl. Sci. 2022, 12(4), 1920; https://doi.org/10.3390/app12041920
Submission received: 24 January 2022 / Revised: 9 February 2022 / Accepted: 10 February 2022 / Published: 12 February 2022
(This article belongs to the Special Issue Artificial Intelligence and Complex System)

Abstract

:
Pedestrian counting has attracted much interest of the academic and industry communities for its widespread application in many real-world scenarios. While many recent studies have focused on computer vision-based solutions for the problem, the deployment of cameras brings up concerns about privacy invasion. This paper proposes a novel indoor pedestrian counting approach, based on footstep-induced structural vibration signals with piezoelectric sensors. The approach is privacy-protecting because no audio or video data is acquired. Our approach analyzes the space-differential features from the vibration signals caused by pedestrian footsteps and outputs the number of pedestrians. The proposed approach supports multiple pedestrians walking together with signal mixture. Moreover, it makes no requirement about the number of groups of walking people in the detection area. The experimental results show that the averaged F1-score of our approach is over 0.98, which is better than the vibration signal-based state-of-the-art methods.

1. Introduction

Detecting the number of people in a specific area is of great importance in many real-world scenarios. It can support intelligent building and security monitoring applications, such as search and rescue after disasters, pedestrian traffic monitoring, energy-consuming optimization, indoor space management, marketing, and infection spread control for epidemic scenarios [1]. Meanwhile, people are very concerned about protecting their privacy when an intelligent monitoring system is deployed. Based on how the data is sensed, the existing approaches are categorized as device-based and device-free approaches (e.g., infrastructure-based approaches). The device-based approaches [2,3,4] require individuals in the monitored area to carry a special device or a smartphone. The infrastructure-based approaches [5,6,7,8,9,10,11,12,13,14,15,16] deploy sensors such as cameras, infrared sensors, and piezoelectric sensors where no requirement to carry any devices is needed.
However, previous studies have the following limitations. Firstly, the application scenarios of the device-based approaches are restricted, and such approaches are not appropriate to deploy in public places, such as shopping malls. As it is unrealistic to hand out a device to every individual in an open space or require everyone who enters the area to install a smartphone app. Secondly, although recently many studies have focused on camera-based crowd counting approaches (e.g., [17,18,19,20,21]), such approaches do not protect privacy and the deployed devices are easy to be destroyed. Besides that, the camera or infrared sensor-based approach will not work well in an extreme environment, such as areas with heavy smoke or low visibility. This greatly limits the deployment of the approach in certain real-life situations, such as rescue after disasters and security monitoring in a restricted area.
In this paper, we present a novel infrastructure-based approach based on piezoelectric sensors. The piezoelectric sensor is much cheaper than the geophone sensor [22] used in previous studies [14,15,23], which is advantageous from a cost perspective. Meanwhile, our approach does not require high-density sensor deployment [24]. Furthermore, different from the existing studies, our approach can be applied to many real-life scenarios where multiple people are in the same room.
While the identity authentication-based approaches [23,25,26] requires that the signals should not mix or there is only one person in the area, our approach can handle scenarios where signals from different people are mixed together. Our approach does not require that only one group of people should be in the monitored area [15]. Our system can detect the number of pedestrians in many possible cases where groups of people may walk with different walking speed, frequency, and directions. In this work, we consider the cases from 0 person to 4 persons in a 3 m by 3 m area. Our system can be treated as a minimal functional unit and be scaled out to support more people in a larger area. In future products, sensors can be embedded in floor tiles to unify the physical transmission characteristics of vibration signal.
The major contributions of our work are as follows:
  • We propose a novel approach that can count the number of people with vibration signals from the piezoelectric sensors while protecting privacy.
  • Our approach supports the situations where multiple people walk together with the signals mixed.
  • Our approach does not require that only one group of people should be in the detection area.
  • Different from the room-level approach [14], our approach is a step-level pedestrian counting approach, making it more appropriate for many real-world applications.
  • Our approach uses piezoelectric sensors, which are much cheaper than geophone sensors, making our solution economically viable.
  • Experimental evaluation shows that our approach outperforms the vibration signal based state-of-the-art methods in accuracy for similar pedestrian counting task.
This paper is structured as follows. In Section 2, we discuss previous works regarding infrastructure-based pedestrian counting approaches from different perspectives, which motivates our approach. In Section 3 and Section 4, we introduce and present our systematic approach and methodology. In Section 5, we present the experimental evaluation of our system. We conclude the work in Section 6 and discuss potential future directions.

2. Related Work

The vibration signal not only contains rich environmental information but also causes no invasion of privacy. Vibration signal-based device-free situation awareness detecting approaches have attracted much attention from the academic and industry community, which shows great potential in pervasive computing applications [27,28,29].

2.1. Sensor Selection

In general, recent studies regarding vibration signal-based ubiquitous computing applications mainly use geophones (triaxial seismic sensor) [14,15,23,29,30] and piezoelectric sensors [27,28,31,32].
A geophone [33] is deployed on the floor. It detects the velocity of movement of the floor and outputs a voltage signal. In contrast, the piezoelectric sensor measures changes in the pressure it bears. Although geophones can detect signals from three orthogonal axes in space, they are significantly larger than piezoelectric sensors in physical size. Furthermore, the price of a geophone [22] is 100 times higher than that of piezoelectric sensor [34]. In addition, the piezoelectric sensor has a simpler structure, higher sensitivity, wider frequency band, and larger dynamic range [35]. However, when it is used to detect floor vibration signals caused by pedestrian walking, there are issues with poor signal quality and low signal-to-noise ratio (SNR) [28]. The characteristics and physical parameters of different piezoelectric sensors are not strictly consistent and usually present significant individual-to-individual differences. The measurement error between different sensors is varied, and the SNR is not uniform. Furthermore, piezoelectric can only detect the signals perpendicular to the floor. Previous research [23] showed that using a triaxial seismometer can achieve an increased accuracy in a localization task by introducing signal arrive angle to a TDOA (time-difference-of-arrival) system. However, piezoelectric sensors provide less information than triaxial geophones sensors. Thus it is more challenging to achieve good results only with the signals perpendicular to the floor.
To summarize, from a cost perspective the piezoelectric sensors are advantageous, especially in scenarios that require large-scale sensor deployment. However, there are more considerable challenges to get good results with the piezoelectric sensor-based approach. Our approach uses the piezoelectric sensors with a novel system design to overcome the limitations of this kind of sensors.

2.2. Vibration Signal-Based Approaches

Although the approaches based on the vibration signal present the advantage of protecting privacy compared with camera-based approaches [18,19,21,36], there are significant challenges to detect the number of pedestrians.
The vibration signal pedestrian identification-based approaches for pedestrian counting [23,25,26] require that the step event (SE) signals must not be mixed. This means that the system can only work when a maximum of one person is walking at the same time. In indoor multi-person scenarios, it is quite common for multiple people to move together at the same time. Such approaches cannot handle the use cases of normal daily life and only work in a well-defined environment such as a lab experiment. This dramatically limits their practical applications.
The room-level pedestrian counting approach [14] requires that there is a maximum of one person in the detection area. When the person leaves the detected area and enters a room, the counter will increase by one. This kind of approach can count the number of pedestrians when people go into and leave the detection area one by one. This works well in experimental scenarios, but is not suitable for practical use cases such as pedestrian counting in a large shopping mall.
The studies [15,16] support multiple people walking simultaneously in the same area where the signals between people can be mixed. Nevertheless, these studies require that there is only one group of pedestrians in the detected area, and this group of people should walk close together. In addition, the distance between each individual in the group should not be too far. In Pan et al.’s work [15], the signal of interest (SoI) is defined as the ambient vibration signal induced by occupant footsteps. In other words, a SoI is a piece of signal from the sensor when someone passes the sensor. The four features used in [15] are given in Table 1.
However, in real-world scenarios such as shopping malls, it is more likely that more than one group of pedestrians walk with different walking patterns in the same area. Because the method proposed in [15] deployed the sensors sparsely in a room, the problem cannot be solved by deploying sensors with a different grid. Furthermore, when there is more than one group of people in the area, features (2) and (3) in Table 1 will not be available.

2.3. Overview of Our Approach

In this work, we propose a novel pedestrian counting approach based on footstep-induced structural vibration signals with piezoelectric sensors, which overcomes the limitations of previous approaches [16,23,26]. Specifically:
  • Our approach can detect the number of pedestrians in an area while making no strict requirement about the number of groups of walking people in the detected area.
  • Our approach supports the use cases where multiple people walk together with their signals mixed.
  • Our approach uses the piezoelectric sensor, which is much cheaper than the geophone sensor used in previous approaches, making our approach economically viable.
Overall, our approach shows better performance than the existing work. Table 2 compares the capabilities of our approach with previous approaches.

3. Problem Formulation

In this section, we first define the problem, then discuss the possible solution based on the observations made by Pan et al. [15], which further motivates our solution to the problem.

3.1. Problem Definition

This paper focuses on counting the number of people based on floor vibration signals from piezoelectric sensors. Our system is designed to detect up to four pedestrians in an area of 3 m by 3 m, which can cover most indoor scenarios where multiple pedestrians walk in parallel with different stepping patterns, frequency, and directions. The piezoelectric sensors are deployed in the area of 3 m by 3 m as shown in Figure 1. The layout of the sensor deployment should guarantee that the signal from any vibration source in this area could be detected by any of the sensors. Previous studies showed that this particular layout works with good performance [27,28]. Overall, our system can detect the number of walking pedestrians who step in this area. The system supports the real-life scenarios where multiple persons are walking together at the same time and different people may walk in different directions. Our system is designed to handle the following stepping patterns [15]:
  • Footsteps from different pedestrians are fully synchronized in terms of striking timing.
  • Footsteps from different pedestrians are off-sync, but induced vibration signals presents temporal overlapping.
  • Footsteps are temporally staggered.
Figure 1. Data acquisition devices and experiment setup.
Applsci 12 01920 g001

3.2. Problem Analysis
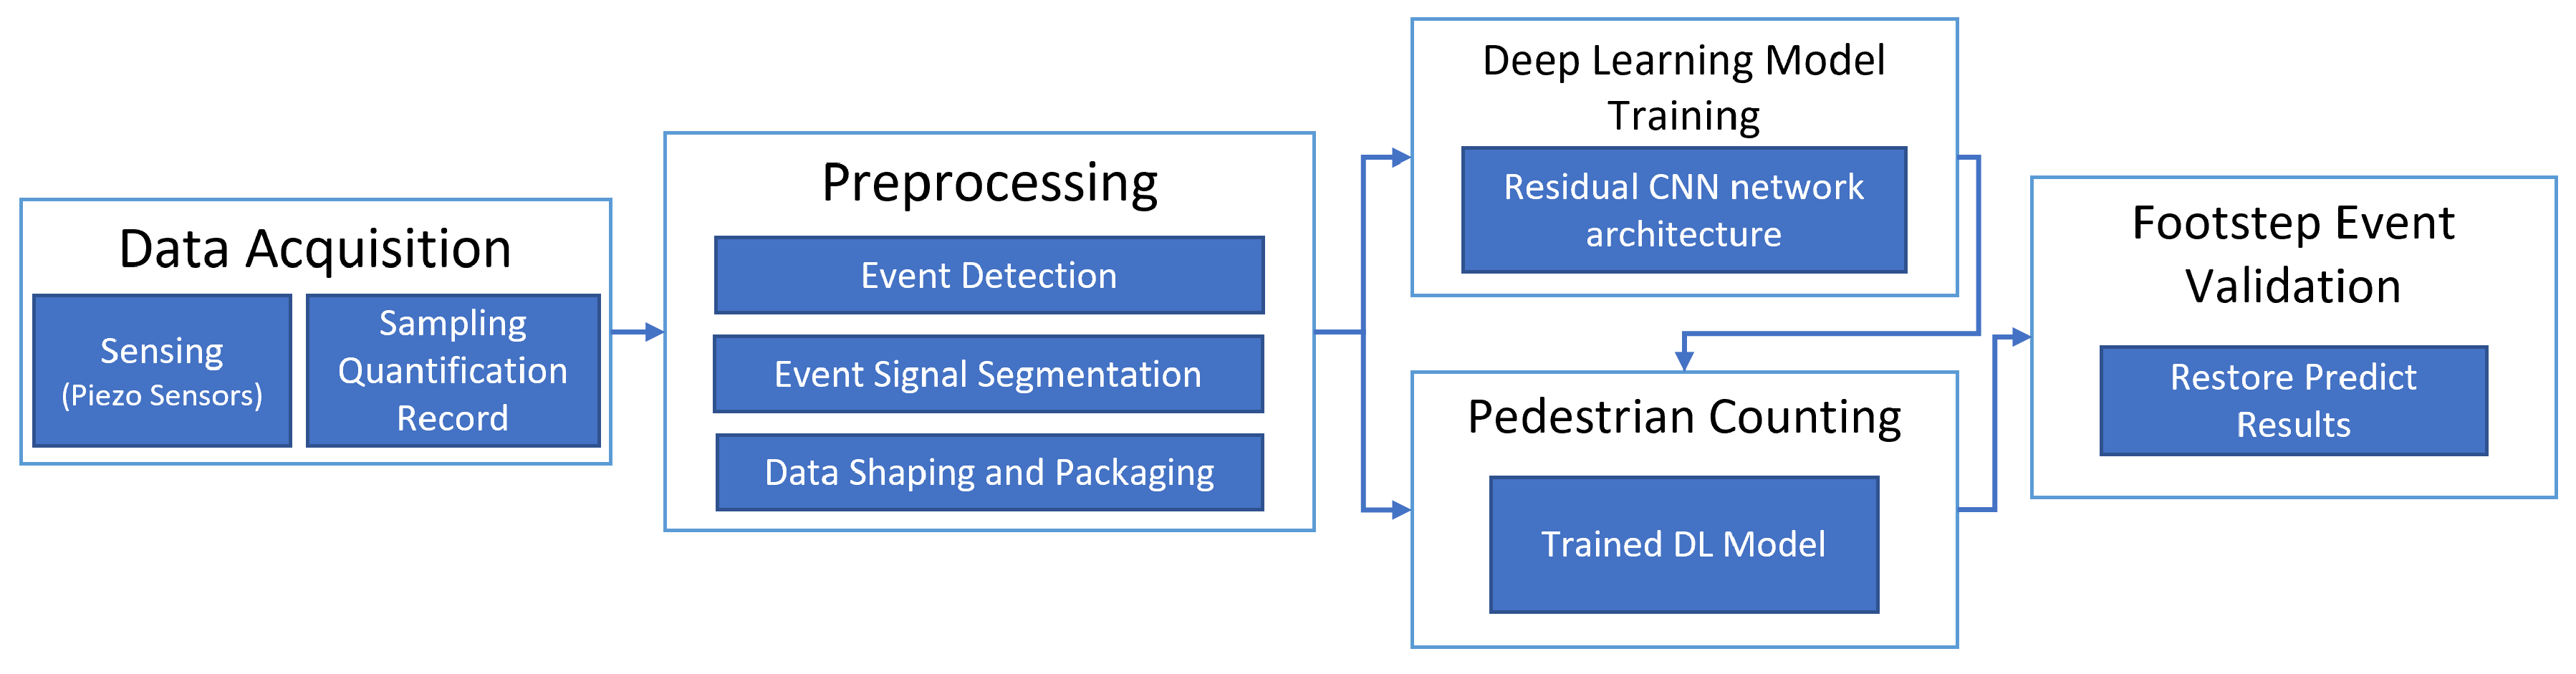
Figure 2 visualizes the original signals before denoising for the cases from 0 to 4 persons. These figures show the characteristics of time-specific signals captured by sensors. Intuitively, when the number of pedestrians is increased from 0 to 2, or from 3 to 4, the waveforms look different. However, it is not easy to differentiate whether the vibration signals are generated by 2 or 3 persons with only time domain information.
As discussed in Section 2.2, previous work [15] investigated the validation of the vibration features in Table 1 for counting the number of walking people. Figure 3 presents the results of the impulse load test experiment conducted in [15], where Figure 3a–d show the predictive capability of the vibration features in Table 1, respectively. Figure 3a shows the cross-correlation of the same SE from different sensors, representing the predictive capability of space-differential features. Figure 3b shows the cross-correlation of the same trace from the same sensor, representing the predictive capability of time-differential features. Figure 3c shows the step event duration. Figure 3d shows the step event signal entropy, representing the predictive capability of energy-specific features. Pan et al. [15] showed in Figure 3b,c that features (2) and (3) are only appropriate if the detection task is to distinguish whether the number of the pedestrians is 1 or more than 1, but they are uninformative to determine the exact number of pedestrians if there are 2 or more than 2 people. Similarly, feature (4) is only useful in the cases where there is more than one individual, making it difficult to distinguish the number of people when there are less than 2. Furthermore, the generation of features (2) and (3) required that there should be a maximum of one group of pedestrians in the detected area. Intuitively, when there are two groups of people, the signal from the first group of people may be mixed with the signal from the second group. The detected signal from the sensor is a mixture of both groups of people. As a result, it is challenging to differentiate whether the “SoI" is from the footsteps of the first or the second group of pedestrians. Similarly, the “SoI duration" is meaningless when the signals from two groups of pedestrians are mixed. Meanwhile, different groups of people may move at different speeds, where some groups may run while others walk at an average speed. These different moving events may occur simultaneously and the corresponding signals may be mixed up. On the other hand, when pedestrians walk in the monitored area, the spatial difference of the floor vibration signal source from each individual is clear, which can be captured and detected with multiple sensors. This information is encoded in the space-differential feature (1) in Table 1. To summarize, only feature (1) can be effectively used to predict the number of walking people in a more practical scenario.
Similar to cross correlation computing in [15], convolutional computation shares a similar symbolic calculation form. We assume that the convolutional computation of the same walking step event signal among different sensors will extract useful spatial features for pedestrian counting tasks. Our approach uses a deep neural network with convolutional layers to extract features from step event data and detect the number of pedestrians. The experimental results are presented in Section 5.

4. System Design

In this section, technical details about our approach are presented. The pedestrian counting architecture is shown in Figure 4. We regard the pedestrian counting task as a classification task. The vibration signal data with either none or up to four persons has been recorded and labeled. We used a deep neural network to extract features and perform the classification. Figure 5 shows the different steps our approach uses to determine the number of pedestrians.

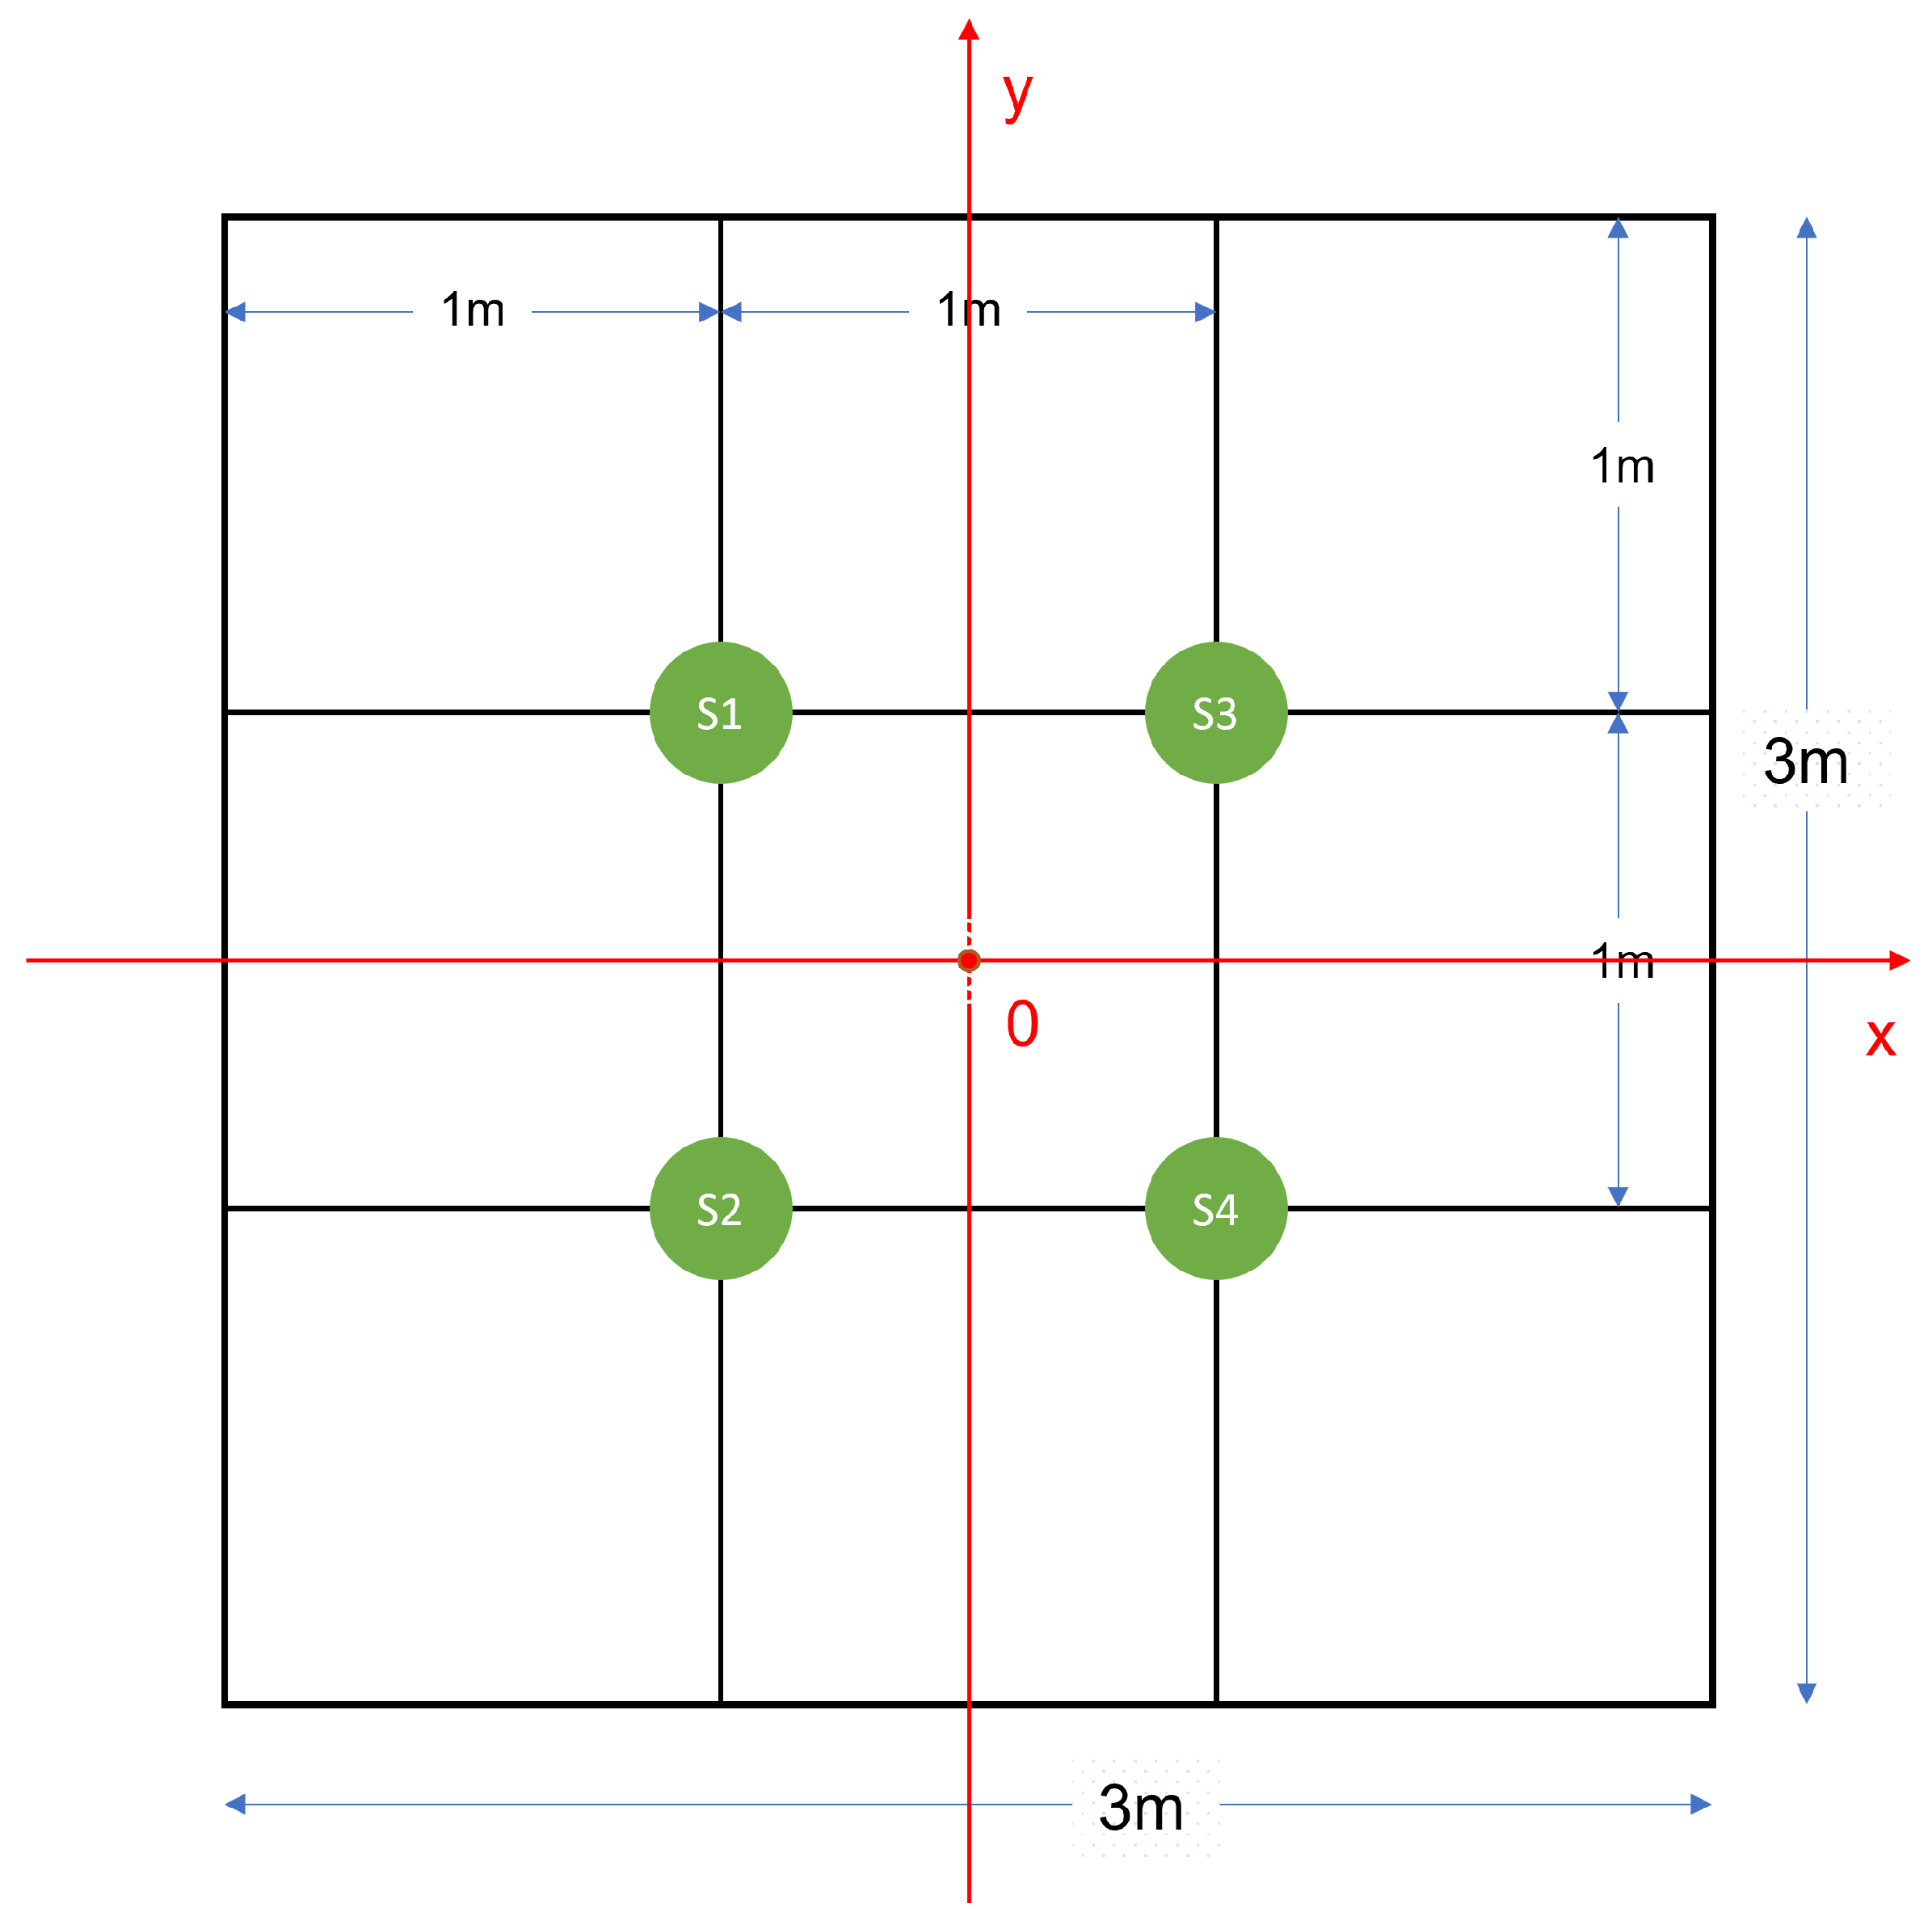
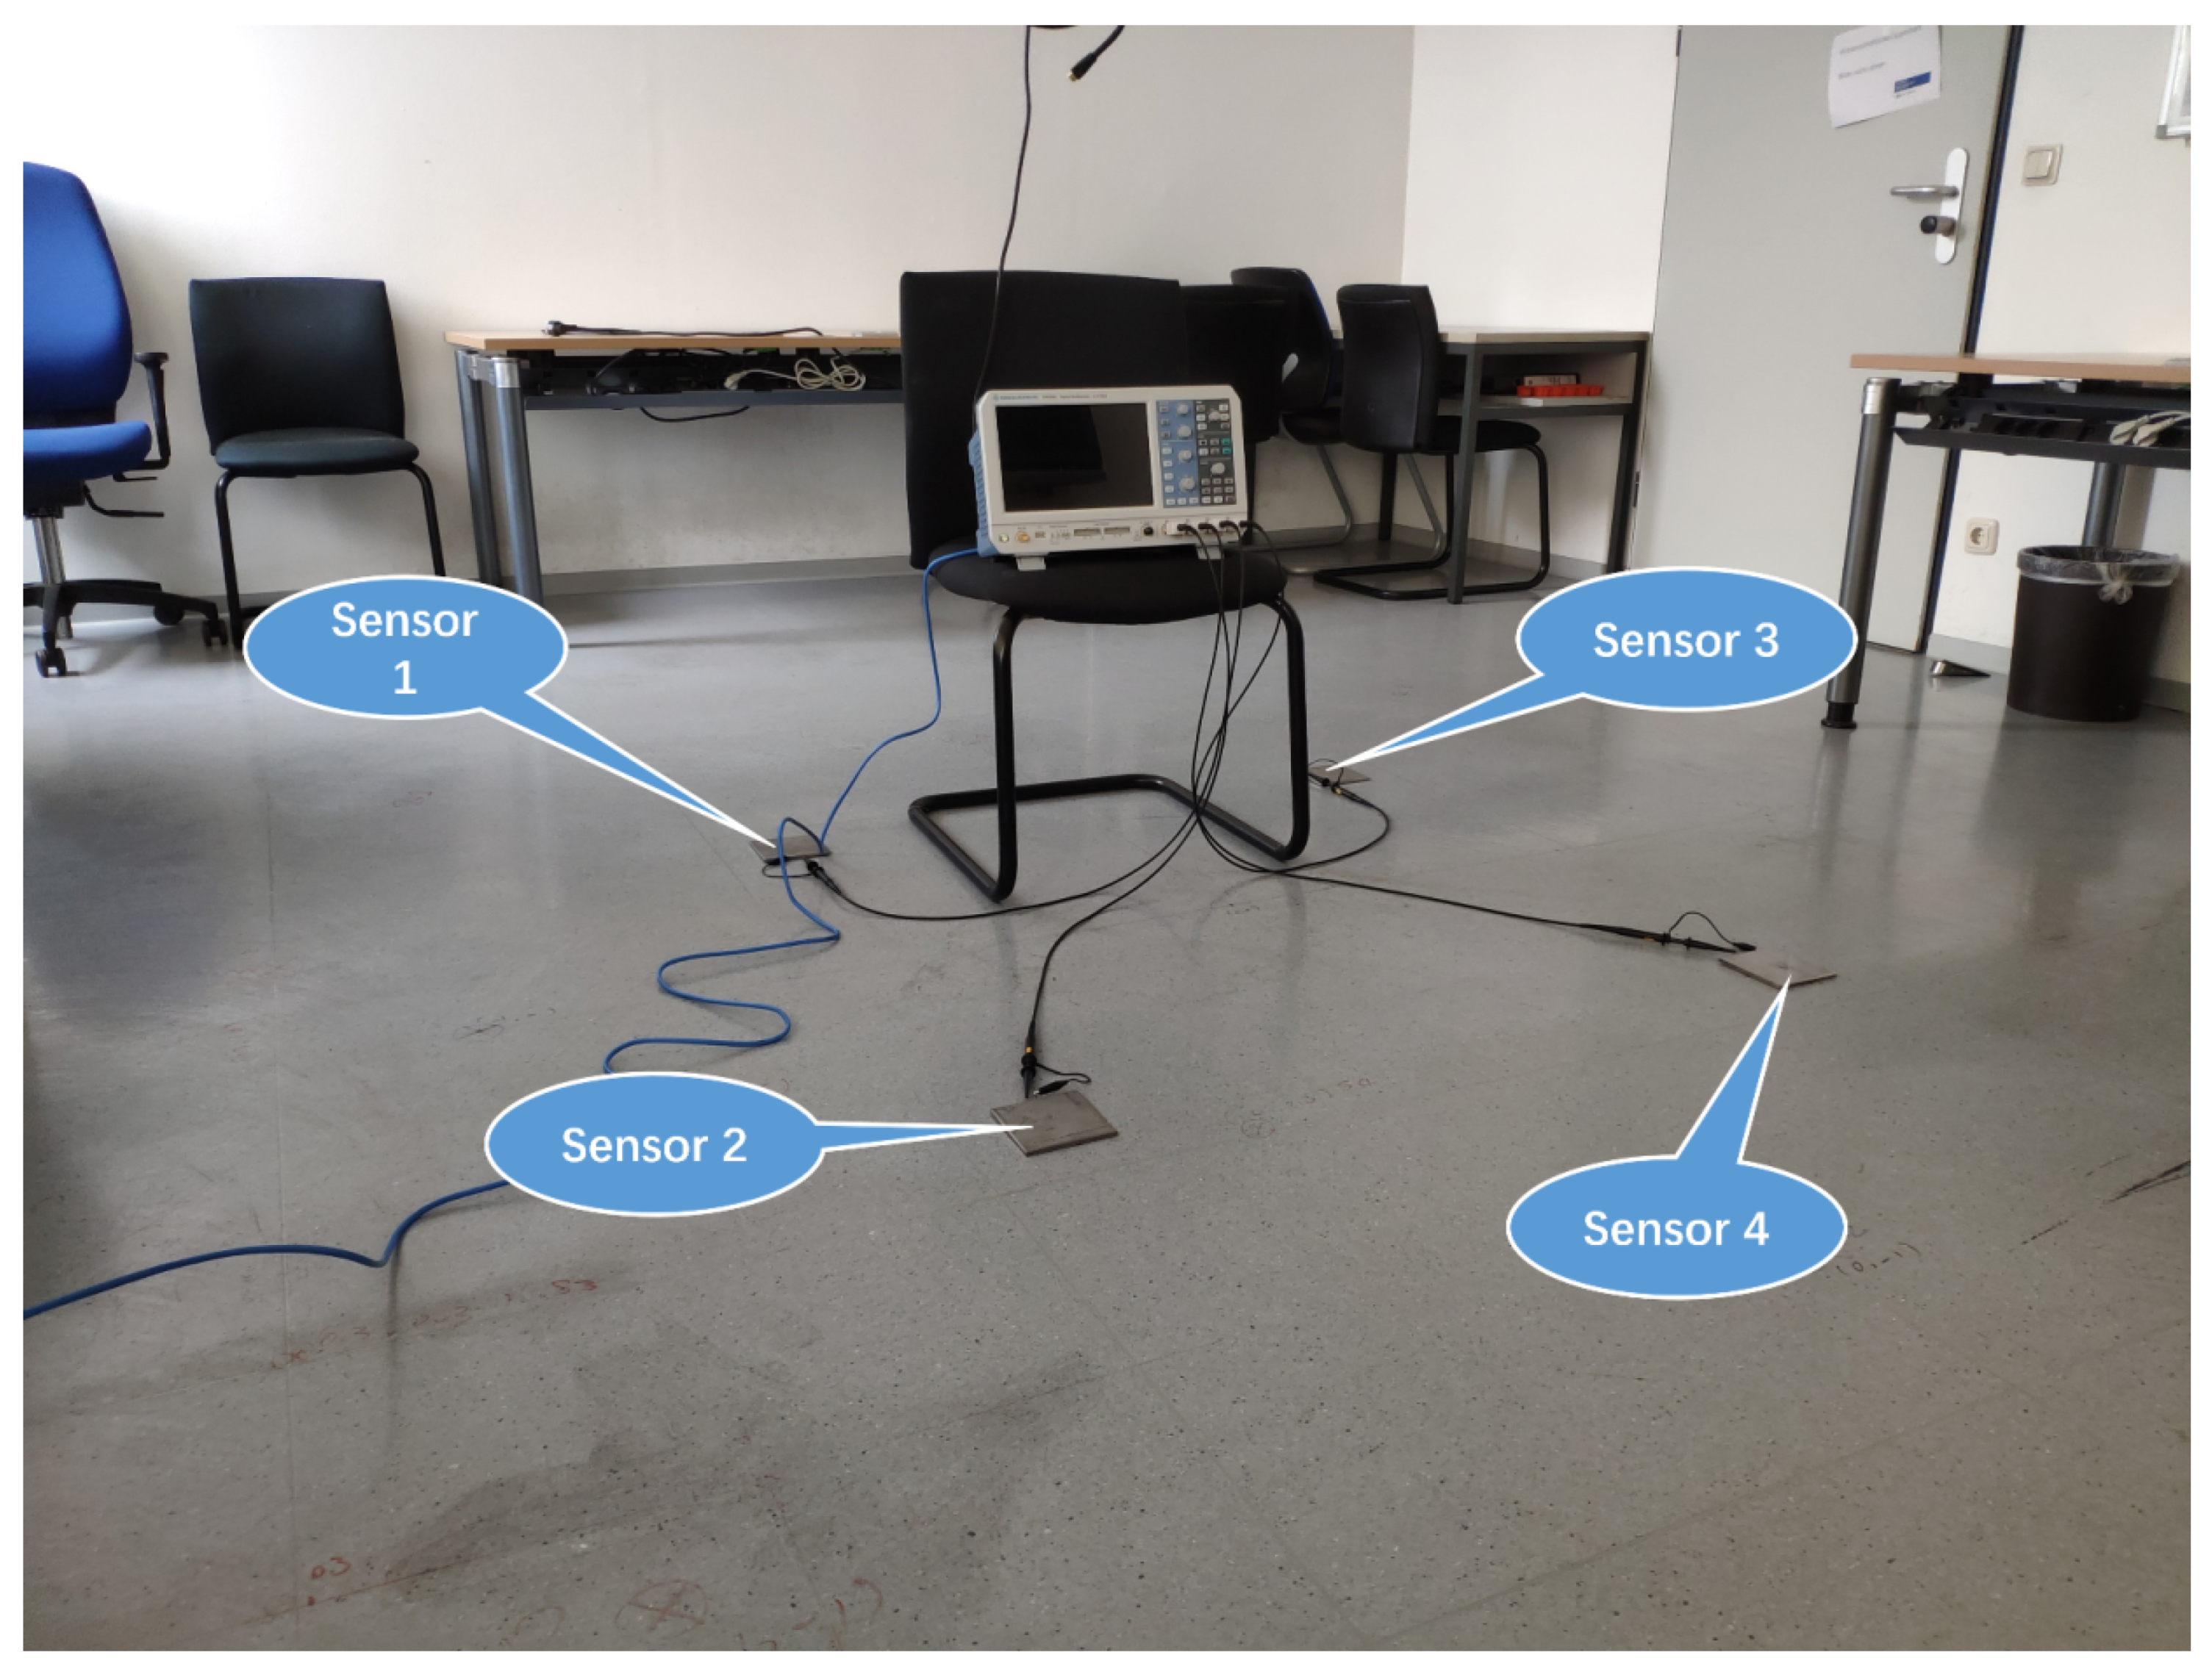
4.1. Data Acquisition

The previous works [27,28] showed that if four piezoelectric sensors (marked as S1, S2, S3, S4) are deployed spatially as shown in Figure 1 and Figure 6, the vibration event in this 3 m by 3 m area can be detected.
Although the piezoelectric sensors are not able to measure the signals statically over a long period of time, this feature will not have a real impact on the performance of the proposed approach. Intuitively, the proposed approach makes use of the space-differential and time-differential relationship features but not each sensor’s absolute signal amplitude value, to detect the number of people. Similarly, the poor signal quality from the piezoelectric sensor will not affect the approach’s feasibility.
Figure 6 shows the data acquisition devices and the experimental setup. Four EPZ-27MS44W piezoelectric sensors are deployed in the detected area to sense the vibration signals on the floor. The bandwidth of the sensor ranges from 0 Hz to 4400 Hz. The signal is amplified, sampled, quantize, and recorded with an R&S-RTB2000 oscilloscope. Time synchronization of the signals is handled by the oscilloscope. The sampling rate is set to 10 kHz. The maximum value of the sampling point amplitude is 0.1 V. Thus, the waveforms higher than 0.1 V or lower than −0.1 V will be cut off.

4.2. Preprocessing

Traditional signal-based pattern recognition tasks need to filter the signals and denoise them during preprocessing and extract features manually. However, we do not filter or denoise the signals manually. Intuitively, the number of walking people is related to the signal’s energy. Thus, filtering can lead to the loss of valuable information. Furthermore, we used an end-to-end deep learning-based approach in which feature extraction can be learned. Previous studies have shown that deep neural networks can tolerate modest amounts of noise in the training data [28,37]. Processing raw vibration data without denoising will not only avoid downgrading the accuracy of the deep neural network, but also increase its prediction performance, because valuable information in the data is preserved.
Overall, the preprocessing workflow of the system includes value normalization, event detection, event signal segmentation, and data shaping and packaging, as shown in Figure 4.

4.2.1. Normalization and Downsampling

Our approach is based on a deep neural network. The training procedure of deep neural network requires the values of training samples to range from 1 to + 1 . The ranges of the values of raw data are [ 0.1 , 0.1 ] . To make the data fitted into deep neural network, we divide the raw values by 0.1.
The signal data is downsampled to 2000 samples per second. The experiment shows that the informative signal is distributed in the frequency range of 0 to 1000 Hz. Thus, it is sufficient to provide data sampled at 2000 as the input of the neural network.

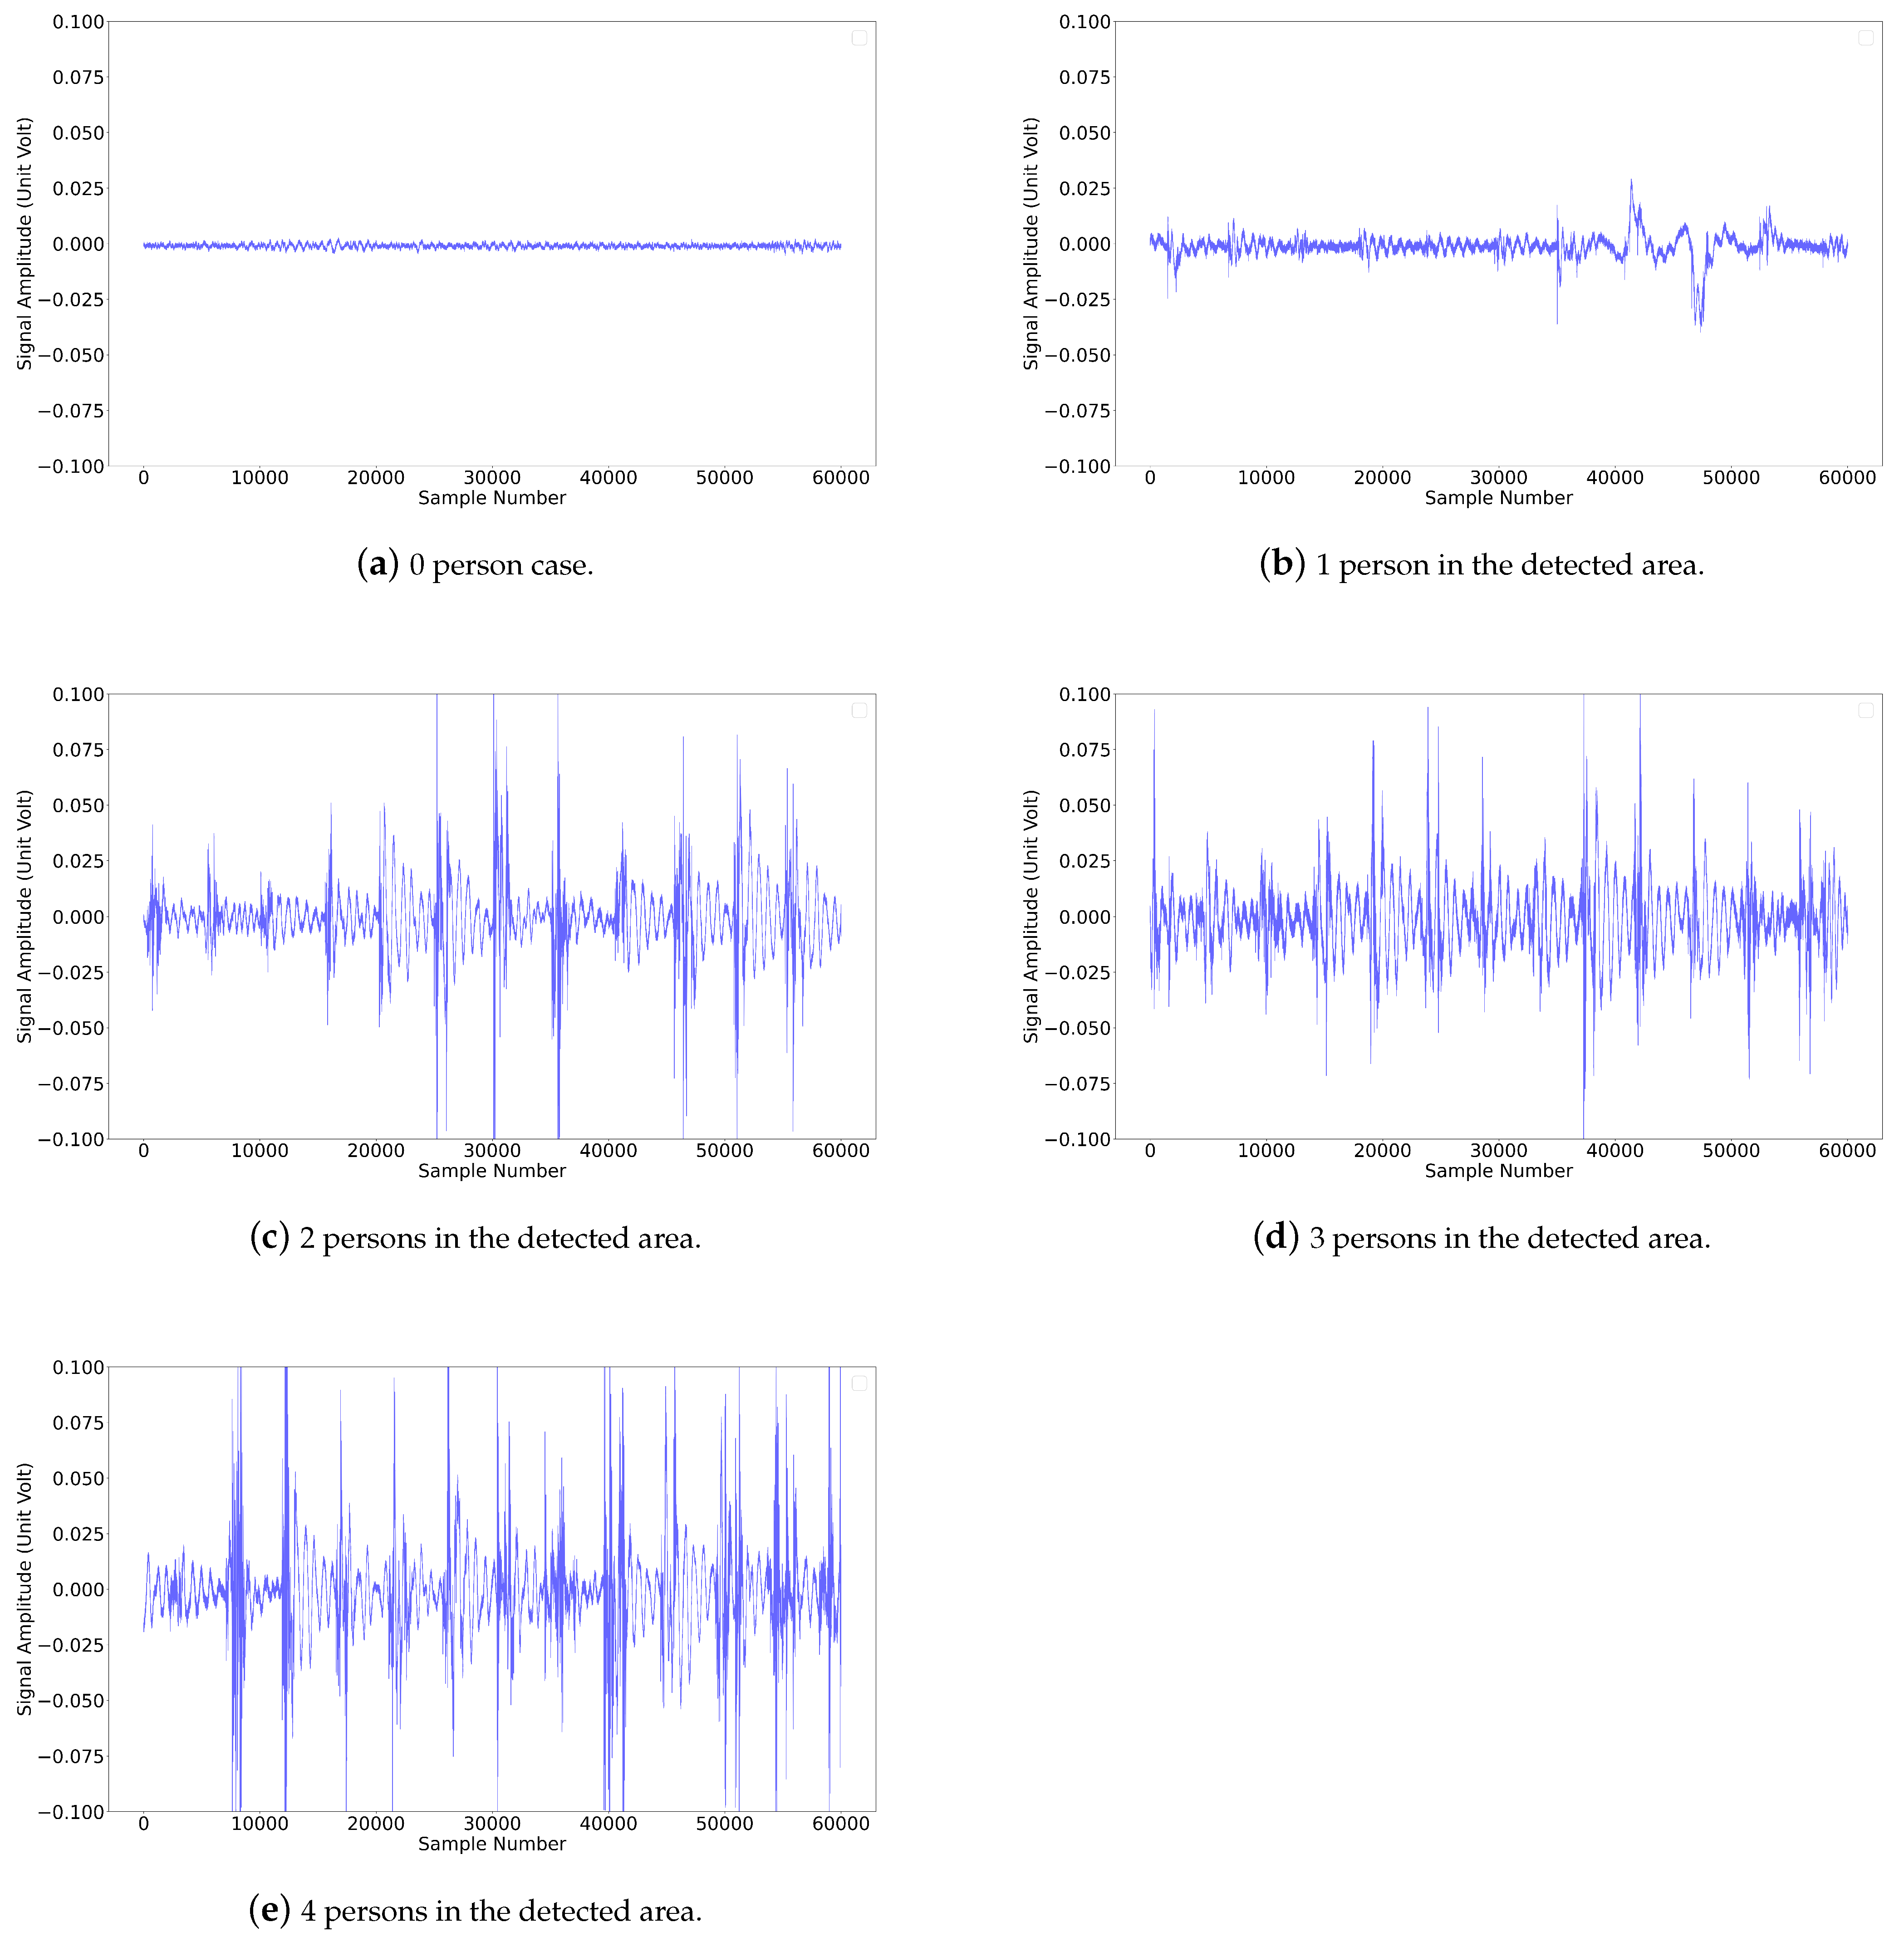
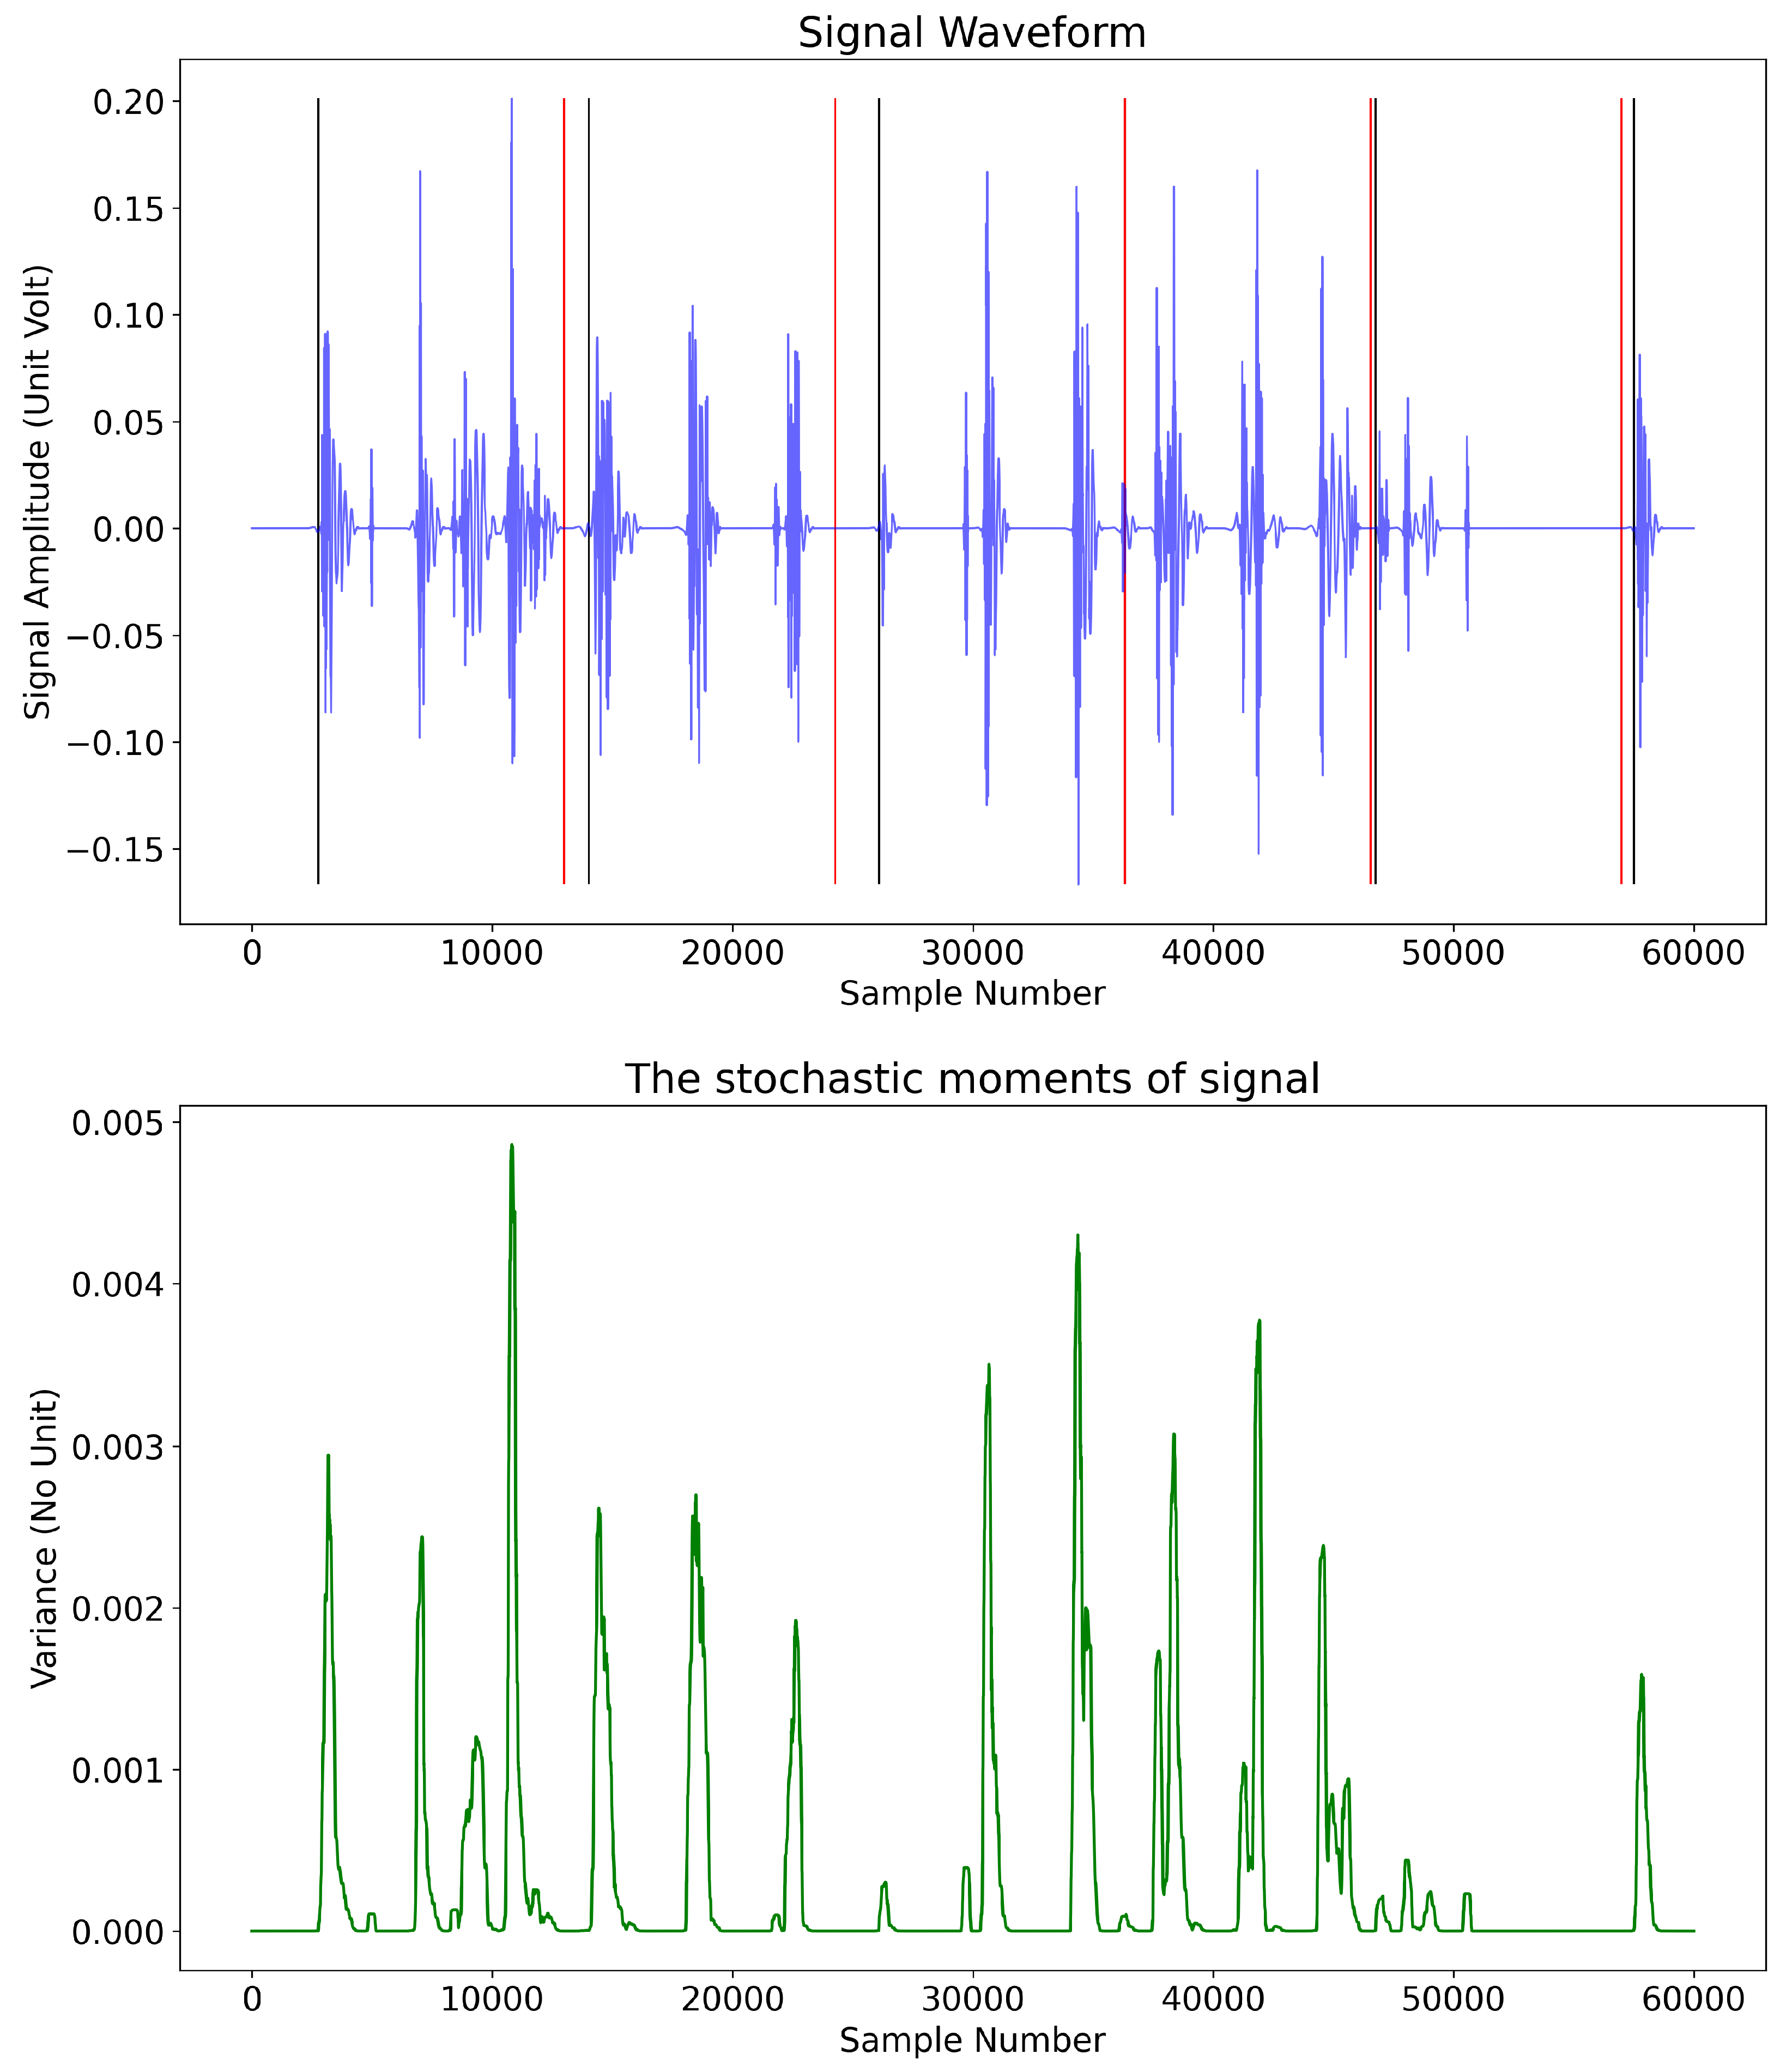
4.2.2. Signal Selection and Event Detection

A sliding window selects signal samples from the signal stream. The window size is 2048 samples. The sliding window shifts 64 samples each time. The data of the four sensors share the same sliding window.
We used the first-order second-moment method [38] to detect the beginning of a vibration event. By analyzing the change of Gaussianity, this method can be used to differentiate the vibration event from Gaussian noise. The first-order second-moment is defined in Equation (1), where N is the window length of the first-order second-moment method, μ is the mean of the values in this window, x i is each value in the window. Empirically we determined a window size of 64 samples, which equals 32 milliseconds of sampling. We set the variance of ambient background noise as the threshold. When the m 2 values are larger than the threshold, the system detected a vibration event. If a vibration event is detected, the window will shift 2048 samples. If the number of data values in the shift window is less than 2048, all the data in the window will be dropped.
m 2 = 1 N i = 1 N ( x i μ ) 2
We used the signal of Sensor 1 to detect vibration events. The layout of sensor deployment in Figure 1 guarantees that any sensor can detect even the weakest signal generated in its area. Regarding the isolation of step events, the choice of the reference sensor does not make any difference regarding the detection of vibration events. When a vibration event is detected, the data of four sensors in the sliding window will be recorded.
Figure 7 shows an example of vibration event segmentation from the signal stream. The data values between each solid black line and red line will be extracted and packaged as input samples. The solid black lines denote the beginnings of an input sample, and the red lines the corresponding ends. After each shift of the window, all the data in the shift window will be packaged as an input sample to the neural network for pedestrian counting.

4.3. Data Set Collection and Deep Learning Model

We used a deep learning model to extract features and detect the number of walking pedestrians. In Section 3, we discussed and analyzed the effectiveness of convolutional computing of data samples between different sensors for feature extraction. The extracted features are used as input for the deep learning model to predict the number of walking pedestrians. In this subsection, the data set collection and model architecture for training are presented.

4.3.1. Data Collection

We generated a vibration signal data set ranging from 0 to 4 persons in the experiment. Two males and two females participated in the data collection process. When there is no one in the area, the data acquired by our devices are labeled as “0 Person" or “P0". In each turn of the experiment, there is a known and fixed number of participants in the monitored area. The number of participants is marked as the label of each data sample, which is further used as class label for deep learning model. The data set includes cases that cover most practical scenarios, in which the participants may walk, walk fast, and run. After preprocessing, we collected a total of 20,955 data samples. The statistics about each class is presented in Table 3.

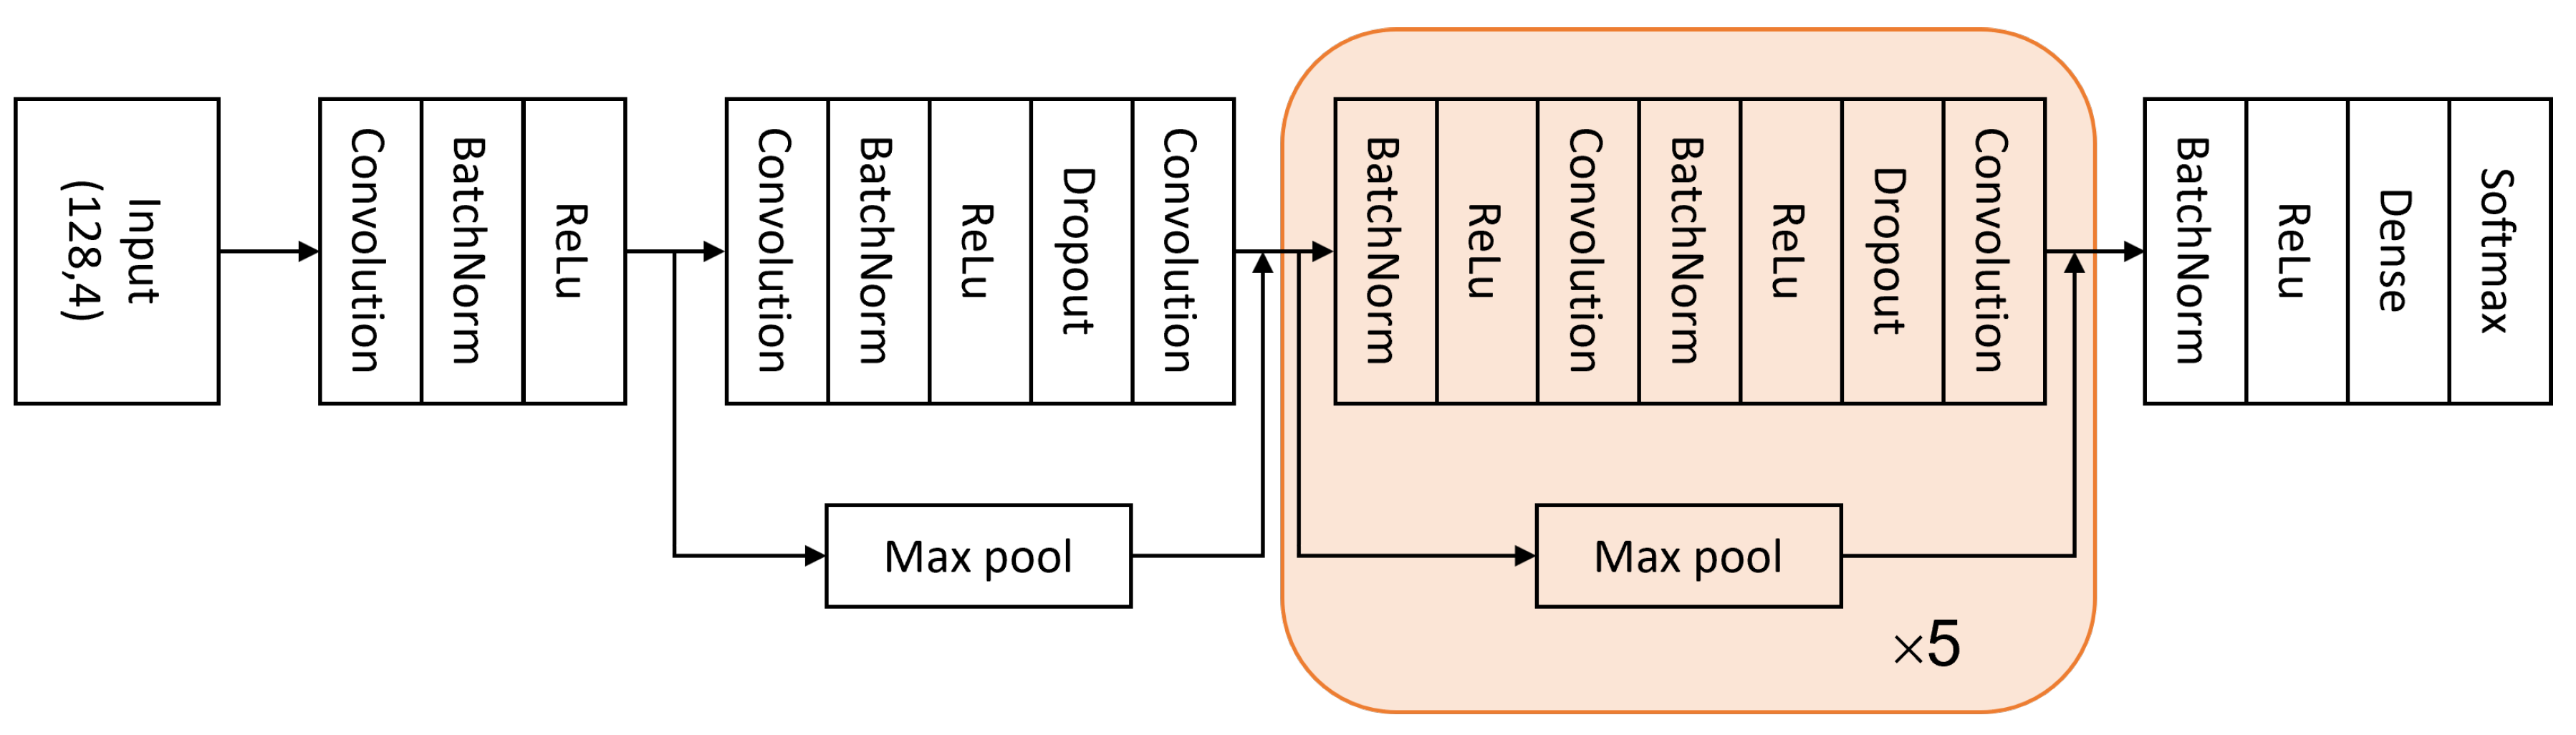
4.3.2. Deep Learning Model

As shown in Figure 8, our deep learning model has 13 one-dimensional convolutional layers with residual structure [39,40,41,42]. The dropout rate is 0.3. The learning rate is 0.001. The batch size is set to 32. The input size is 2048 rows and 4 columns.

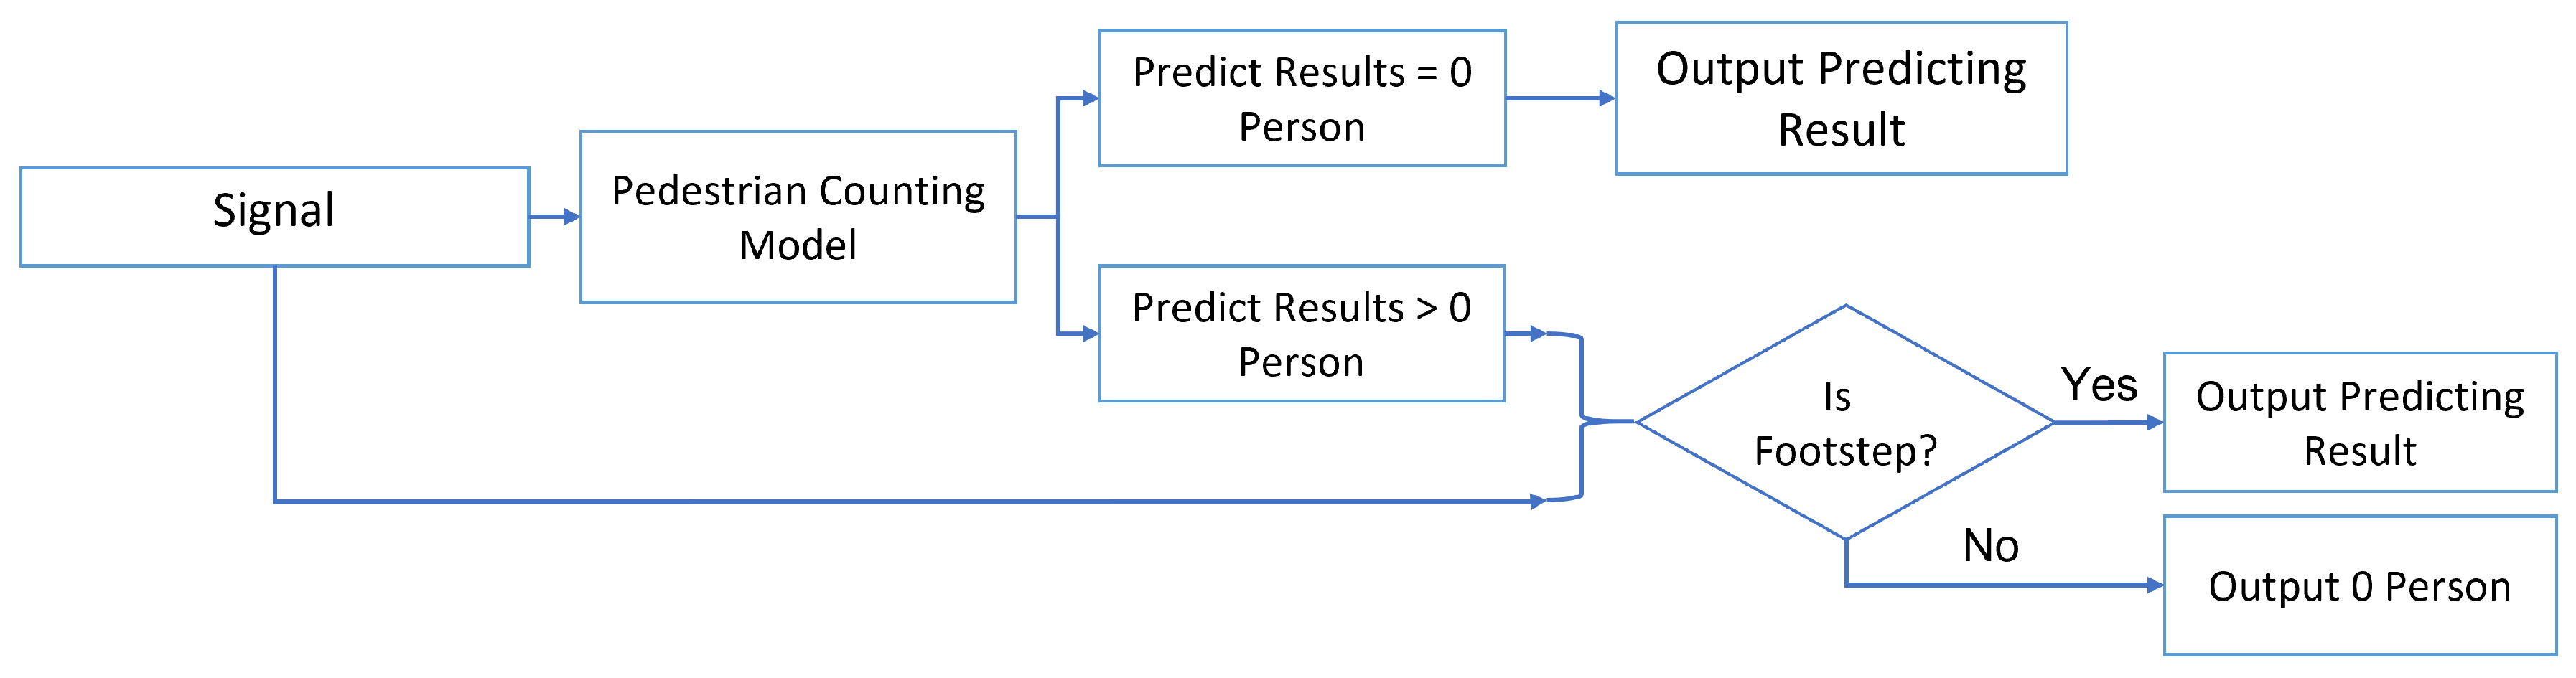
4.4. Prediction Output Judgment Logic

Sometimes a non-footstep vibration event [23] may trigger the model to output a result which makes no sense. Once the prediction result of deep learning model is not “0 Person", our system further validates whether the vibration event is a footstep event or not. Existing research regarding footstep detection [14,43] presents methods to judge whether a vibration event is caused by a footstep or some other events, for example a door closing or a bus driving outside the building. The entire detection logic including the mentioned footstep detection is shown in Figure 5.
If the input signal is a superposition of step vibrations and non-footsteps vibration, and if the non-footsteps signal is not too strong or does not persist too long, the system will treat the non-footsteps signal as noise. If the non-footsteps signal is very strong or persists for a long time, the risk will increase a lot that the footstep detecting module will block the proposed system. The current approach can only guarantee that the system will work in the most common scenarios, such as in an office building where the interference is not that strong or persist for a long time.

5. Evaluation

In this section, we present the performance of our system for the prediction task. We conducted a 5-fold cross-validation (CV) [44,45]. For our results we computed the average of all cross-validation folds.

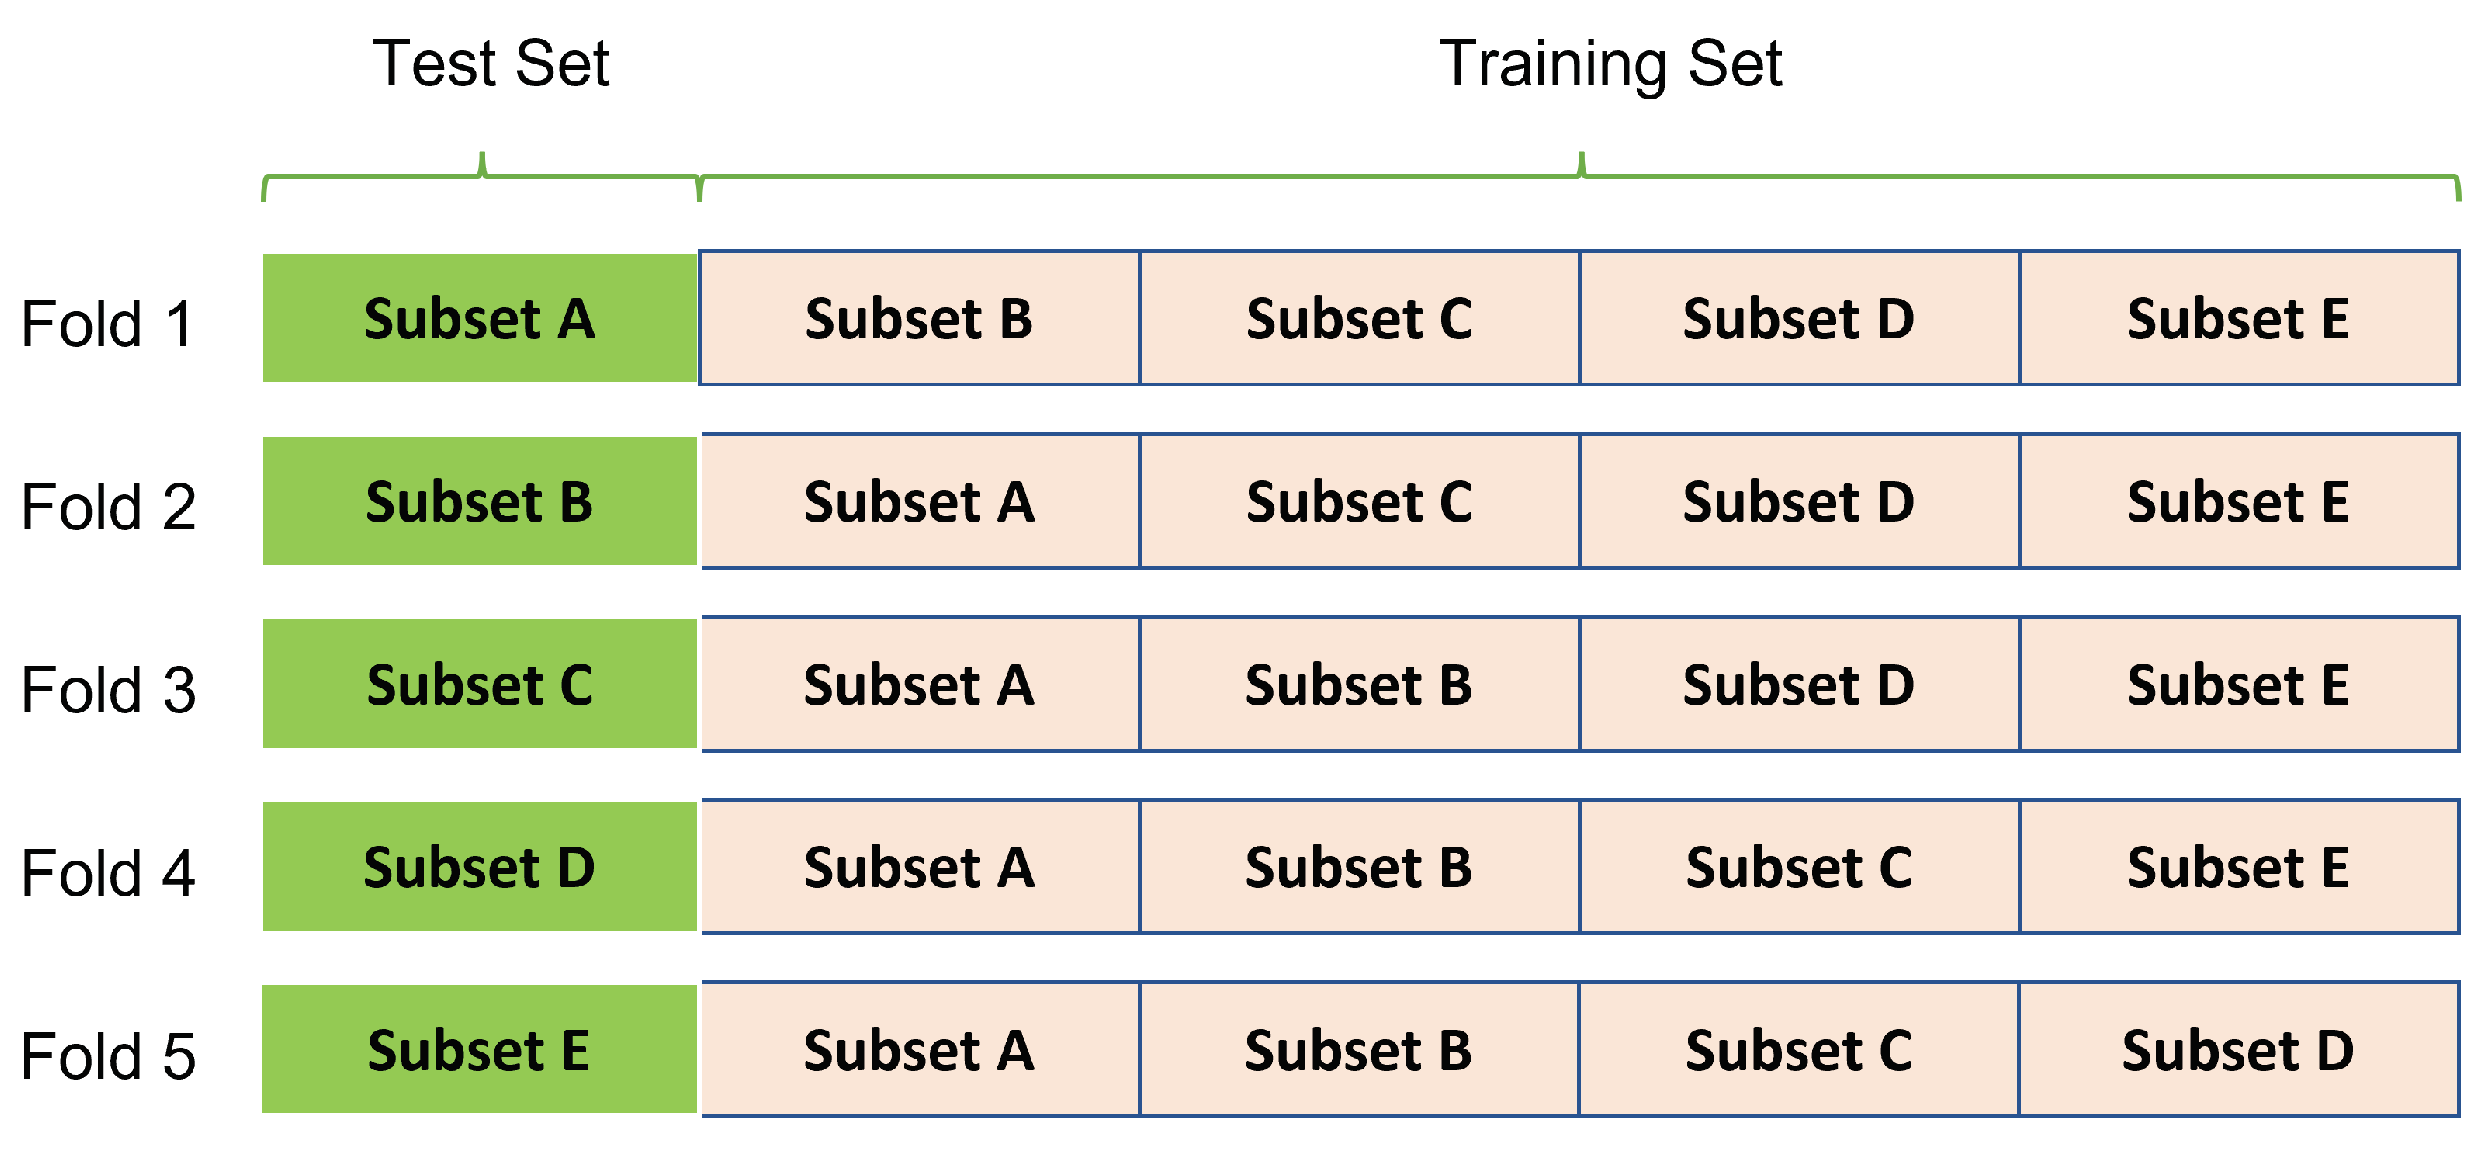
5.1. Data Preparation for K-Fold Cross-Validation
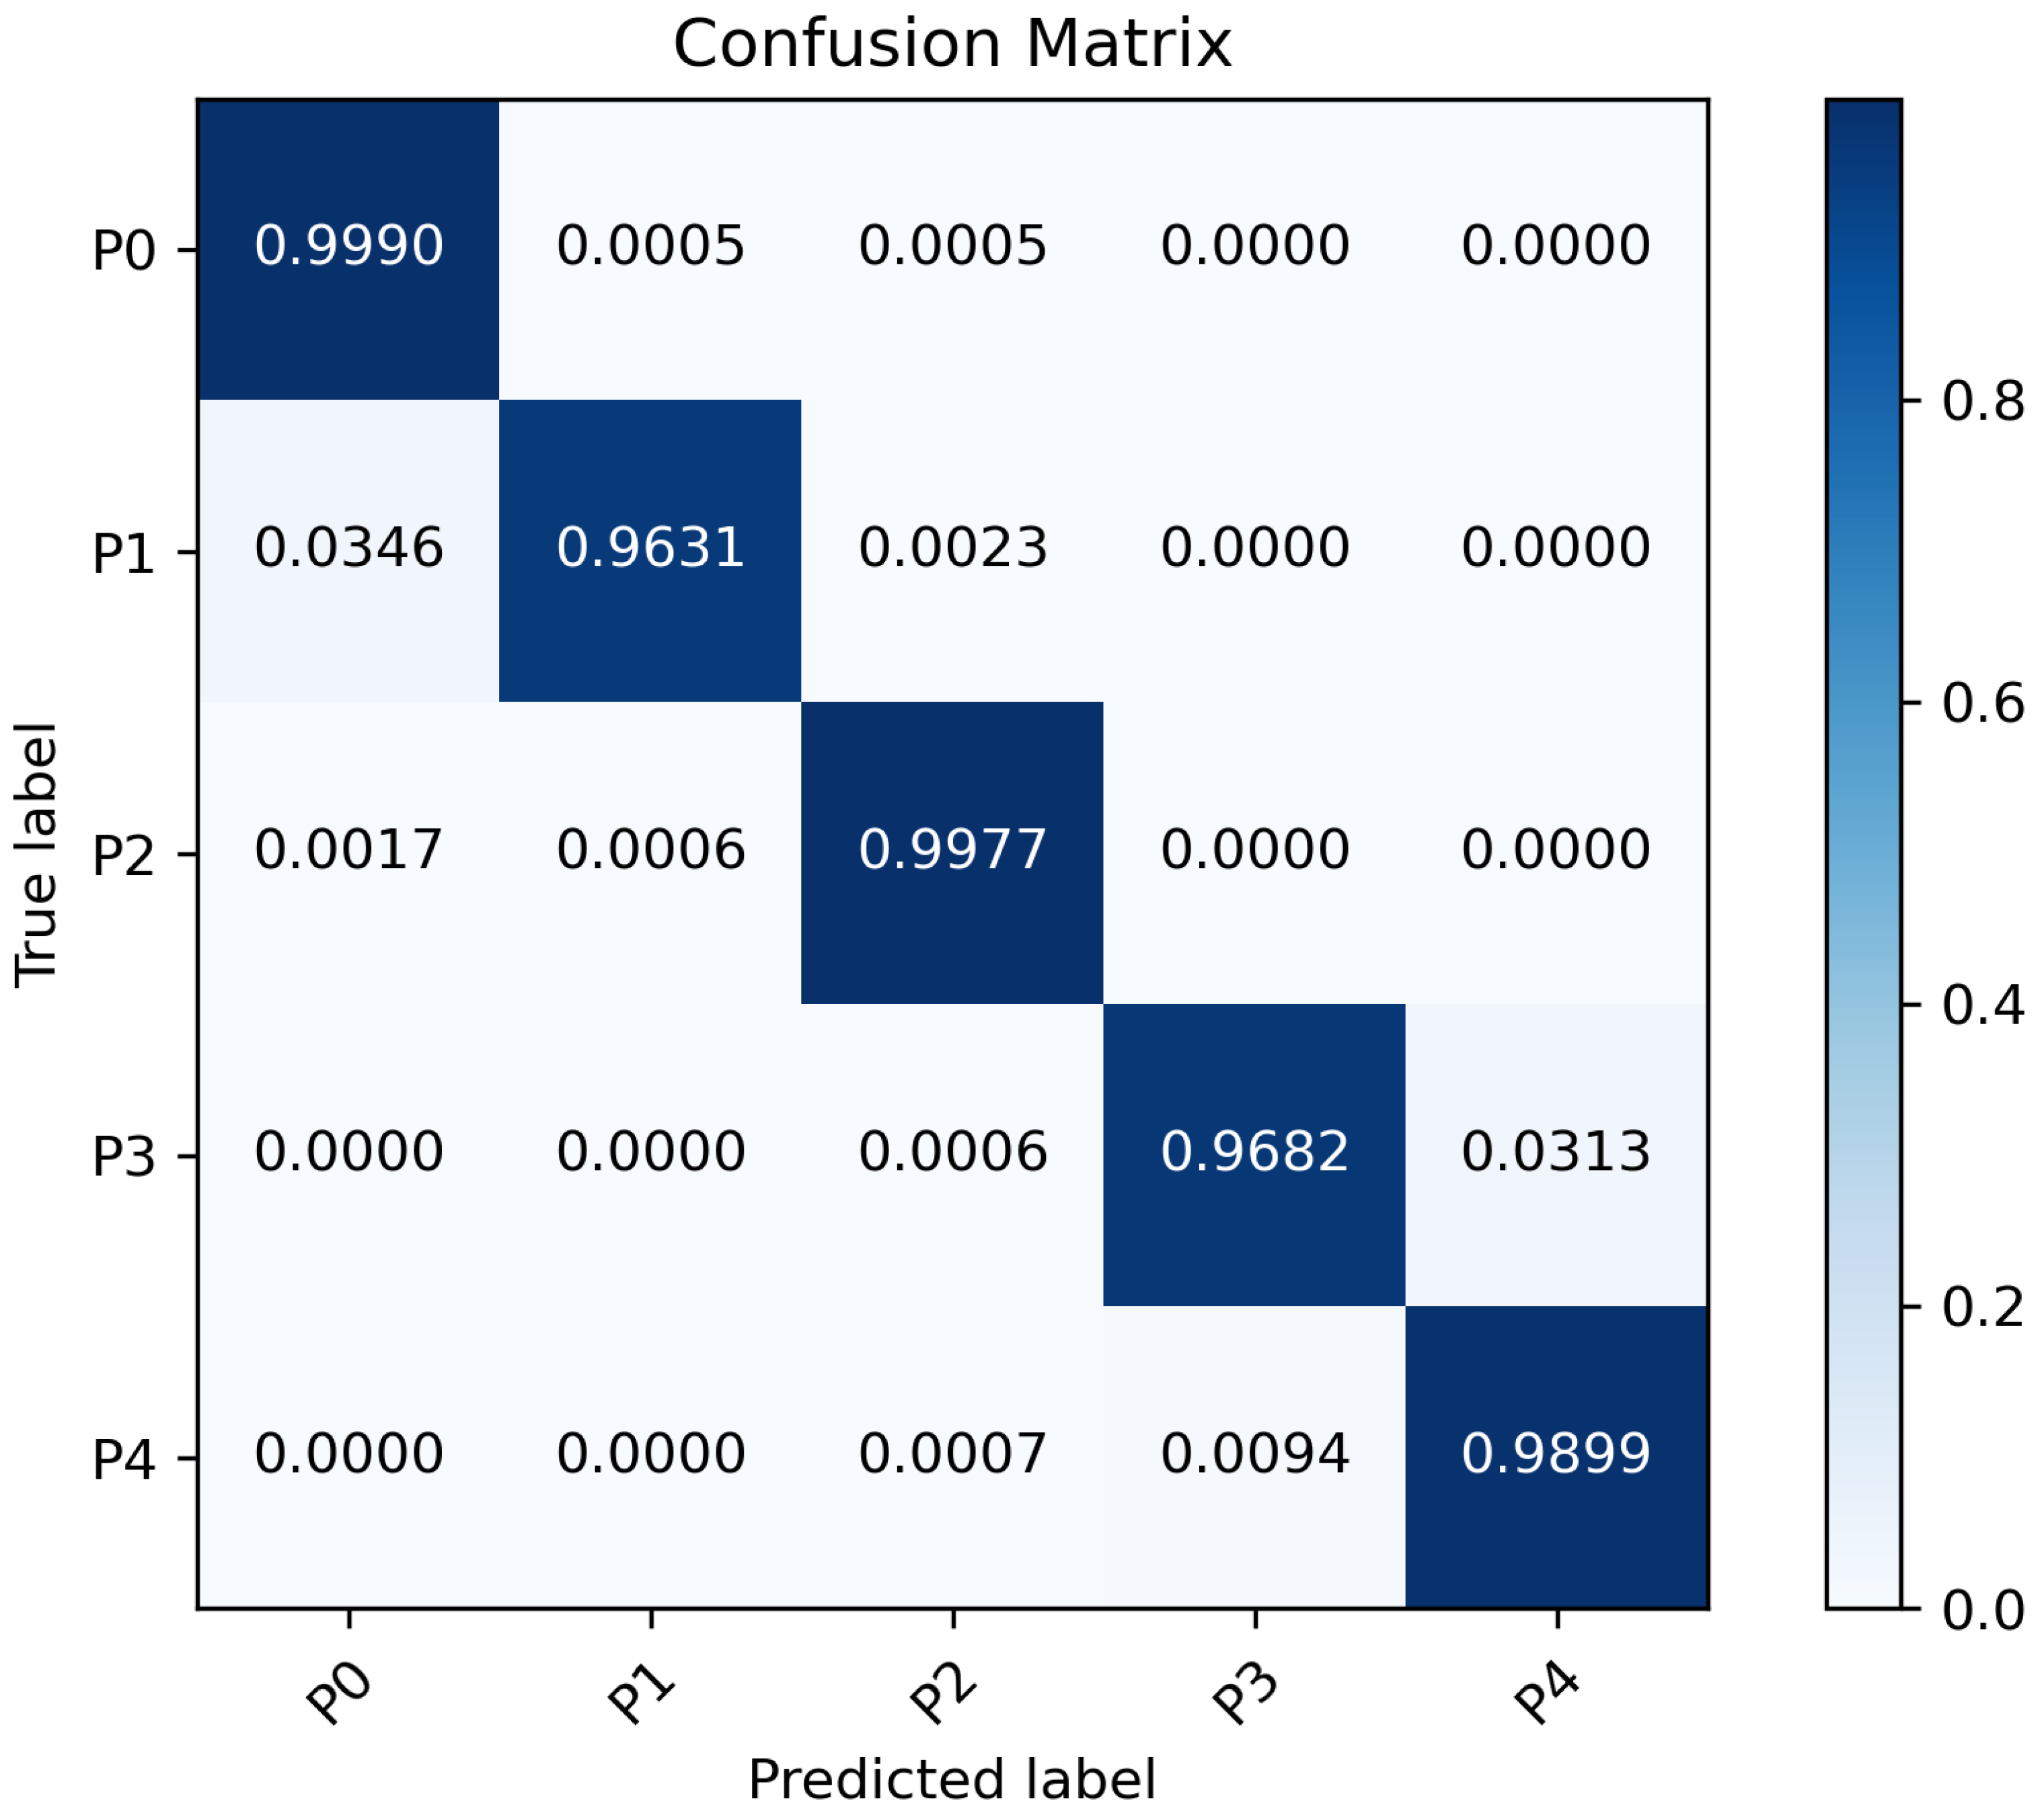
The data is divided evenly and randomly into five folds exclusively as shown in Figure 9. For each fold, we train the deep learning model with the training set and evaluate the performance of the model with the test set. We repeat this training and evaluation process five times for a 5-fold cross-validation. The deep neural network classifies the number of pedestrians according to the input samples.

5.2. Performance

Precision, recall, and F1-score are used as performance metrics. Intuitively, the precision quantifies the ability of the classifier not to label a sample as positive that is actually negative. The recall represents the ability of the classifier to retrieve all positive samples. The F1-score can be interpreted as a weighted harmonic mean of the precision and recall, which is useful to balance the trade-off between the two quantities and tends to give more weight to lower values [46]. An F1-score reaches its best value at 1 and the worst score at 0. The calculation of macro and micro average can refer to [28]. The larger the metric values, the better the classification of the system.
The averaged classification performance over the 5-fold cross-validation is presented in Table 4. The confusion matrix in Figure 10 is calculated and normalized according to the prediction for each test sample in the 5-fold cross-validation experiment. We observe from Table 4 that: (i) the averaged precision, recall, and F1-score for each of the 5 classes are over 0.95; (ii) the averaged macro and micro for the three metrics are over 0.98 for the 5-class classification task; (iii) except for the standard deviation of the precision for the 0 Person class, the standard deviation for all performance metrics are relatively low (less than 0.1). These observations suggest that our classifier presents outstanding performance for the prediction task. Moreover, the high values of macro and micro F1-score (over 0.98) indicate that the classifier shows excellent performance on all classes over the entire data set. Meanwhile, it can be observed from Figure 10 that most of the off-diagonal values in the confusion matrix are close to 0 and all the diagonal values are larger than 0.96, suggesting that our approach can predict the number of walking pedestrians with high accuracy. On the other hand, Pan et al. [15,16] performed a similar classification task, but only achieved an averaged accuracy of 0.6875 for a 4-class classification task. The averaged accuracy is obtained by calculating the arithmetic mean of the accuracy for the four classes from Table 1 in [15], i.e., (0.8333 + 0.6667 + 0.3333 + 0.9167)/4 = 0.6875. This suggests that our approach is significantly better than Pan et al.’s method [15,16].

6. Conclusions and Future Work

In this paper we presented a novel device-free walking pedestrian counting approach based on piezoelectric sensors. Our approach can protect the privacy of the pedestrians, because only vibration signals are acquired. The sensors used in our work are much cheaper than the geophone sensors used in previous studies, making our approach more economically viable. Furthermore, our approach does not require a high-density sensor deployment. This means that our system can be easily expanded to cover large areas. Our approach supports that multiple people are walking at the same time with the signals mixed together. Unlike previous approaches [15,16], it makes no strict requirement about the number of groups of walking people in the detection area. Our approach can detect the number of walking people (up to a maximum of four persons within a 3 m by 3 m area) with an averaged F1-score of over 0.98.
In the future, we will integrate all the vibration signal-based functional modules [27,28] into one system. As a whole, the vibration-based system, together with the audio and video-based system, will serve as a perception layer for a privacy-protecting smart city.

Author Contributions

Conceptualization, Y.Y. and T.W.; methodology, Y.Y.; software, Y.Y.; validation, Y.Y. and T.W.; formal analysis, Y.Y.; investigation, Y.Y.; resources, Y.Y.; data curation, Y.Y.; writing—original draft preparation, Y.Y. and T.W.; writing—review and editing, Y.Y., X.Q., S.H., W.H. and T.W.; visualization, Y.Y.; supervision, T.W. and W.H.; project administration, T.W.; funding acquisition, T.W. All authors have read and agreed to the published version of the manuscript.

Funding

This research was funded by Evonik Digital. The APC was funded by the Open Access Publication Fund of the University of Duisburg-Essen.

Acknowledgments

We acknowledge support by the Open Access Publication Fund of the University of Duisburg-Essen. We acknowledge and thank Evonik Digital for this research work’s financial support. We thank Hao Ma for his help in the experiment and data collection.

Conflicts of Interest

The authors declare no conflict of interest.

References

  1. Hussain, S.; Yu, Y.; Ayoub, M.; Khan, A.; Rehman, R.; Wahid, J.A.; Hou, W. IoT and Deep Learning Based Approach for Rapid Screening and Face Mask Detection for Infection Spread Control of COVID-19. Appl. Sci. 2021, 11, 3495. [Google Scholar] [CrossRef]
  2. Fierro, G.; Rehmane, O.; Krioukov, A.; Culler, D. Zone-Level Occupancy Counting with Existing Infrastructure. In BuildSys ’12: Proceedings of the Fourth ACM Workshop on Embedded Sensing Systems for Energy-Efficiency in Buildings, Toronto, ON, Canada, 6 November 2012; Association for Computing Machinery: New York, NY, USA, 2012; pp. 205–206. [Google Scholar] [CrossRef]
  3. Corna, A.; Fontana, L.; Nacci, A.A.; Sciuto, D. Occupancy Detection via iBeacon on Android Devices for Smart Building Management. In Proceedings of the 2015 Design, Automation Test in Europe Conference Exhibition (DATE), Grenoble, France, 9–13 March 2015; pp. 629–632. [Google Scholar] [CrossRef] [Green Version]
  4. Conte, G.; De Marchi, M.; Nacci, A.A.; Rana, V.; Sciuto, D. BlueSentinel: A First Approach Using iBeacon for an Energy Efficient Occupancy Detection System. In Proceedings of the BuildSys @ SenSys, Memphis, TN, USA, 3–6 November 2014; pp. 11–19. [Google Scholar]
  5. Krumm, J.; Harris, S.; Meyers, B.; Brumitt, B.; Hale, M.; Shafer, S. Multi-Camera Multi-Person Tracking for EasyLiving. In Proceedings of the Third IEEE International Workshop on Visual Surveillance, Dublin, Ireland, 1 July 2000; pp. 3–10. [Google Scholar] [CrossRef]
  6. Hnat, T.W.; Griffiths, E.; Dawson, R.; Whitehouse, K. Doorjamb: Unobtrusive Room-Level Tracking of People in Homes Using Doorway Sensors. In SenSys ’12: Proceedings of the 10th ACM Conference on Embedded Network Sensor Systems, Toronto, ON, Canada, 6–9 November 2012; ACM Press: Toronto, ON, Canada, 2012; p. 309. [Google Scholar] [CrossRef]
  7. Narayana, S.; Prasad, R.V.; Rao, V.S.; Prabhakar, T.V.; Kowshik, S.S.; Iyer, M.S. PIR Sensors: Characterization and Novel Localization Technique. In IPSN ’15: Proceedings of the 14th International Conference on Information Processing in Sensor Networks, Seattle, WA, USA, 13–16 April 2015; ACM: Seattle, DC, USA, 2015; pp. 142–153. [Google Scholar] [CrossRef]
  8. Song, J.; Dong, Y.F.; Yang, X.W.; Gu, J.H.; Fan, P.P. Infrared Passenger Flow Collection System Based on RBF Neural Net. In Proceedings of the 2008 International Conference on Machine Learning and Cybernetics, Kunming, China, 12–15 July 2008; Volume 3, pp. 1277–1281. [Google Scholar] [CrossRef]
  9. Xia, L.; Chen, C.C.; Aggarwal, J.K. Human Detection Using Depth Information by Kinect. In Proceedings of the CVPR 2011 WORKSHOPS, Colorado Springs, USA, 21–23 June 2011; pp. 15–22. [Google Scholar] [CrossRef] [Green Version]
  10. Xu, C.; Firner, B.; Moore, R.S.; Zhang, Y.; Trappe, W.; Howard, R.; Zhang, F.; An, N. SCPL: Indoor Device-Free Multi-Subject Counting and Localization Using Radio Signal Strength. In IPSN ’13: Proceedings of the 12th International Conference on Information Processing in Sensor Networks, Philadelphia, PA, USA, 8–11 April 2013; Association for Computing Machinery: New York, NY, USA, 2013; pp. 79–90. [Google Scholar] [CrossRef]
  11. Xu, C.; Firner, B.; Zhang, Y.; Howard, R.; Li, J.; Lin, X. Improving RF-Based Device-Free Passive Localization in Cluttered Indoor Environments through Probabilistic Classification Methods. In Proceedings of the 2012 ACM/IEEE 11th International Conference on Information Processing in Sensor Networks (IPSN), Beijing, China, 16–19 April 2012; pp. 209–220. [Google Scholar] [CrossRef]
  12. Zhang, D.; Liu, Y.; Guo, X.; Ni, L.M. RASS: A Real-Time, Accurate, and Scalable System for Tracking Transceiver-Free Objects. IEEE Trans. Parallel Distrib. Syst. 2013, 24, 996–1008. [Google Scholar] [CrossRef]
  13. Zhang, P.; Martonosi, M. LOCALE: Collaborative Localization Estimation for Sparse Mobile Sensor Networks. In Proceedings of the 2008 International Conference on Information Processing in Sensor Networks (Ipsn 2008), St. Louis, MI, USA, 22–24 April 2008; pp. 195–206. [Google Scholar] [CrossRef]
  14. Pan, S.; Bonde, A.; Jing, J.; Zhang, L.; Zhang, P.; Noh, H.Y. BOES: Building Occupancy Estimation System Using Sparse Ambient Vibration Monitoring. In Proceedings of the SPIE Smart Structures and Materials + Nondestructive Evaluation and Health Monitoring, San Diego, California, USA, 9–13 March 2014; Lynch, J.P., Wang, K.W., Sohn, H., Eds.; p. 90611O. [Google Scholar] [CrossRef]
  15. Pan, S.; Mirshekari, M.; Zhang, P.; Noh, H.Y. Occupant Traffic Estimation through Structural Vibration Sensing. In SPIE Smart Structures and Materials + Nondestructive Evaluation and Health Monitoring; Lynch, J.P., Ed.; 2016; p. 980306. [Google Scholar] [CrossRef]
  16. Pan, S.; Mirshekari, M.; Fagert, J.; Ruiz, C.; Noh, H.Y.; Zhang, P. Area Occupancy Counting Through Sparse Structural Vibration Sensing. IEEE Pervasive Comput. 2019, 18, 28–37. [Google Scholar] [CrossRef]
  17. Hafeezallah, A.; Al-Dhamari, A.; Abu-Bakar, S.A.R. U-ASD Net: Supervised Crowd Counting Based on Semantic Segmentation and Adaptive Scenario Discovery. IEEE Access 2021, 9, 127444–127459. [Google Scholar] [CrossRef]
  18. Liu, L.; Jiang, J.; Jia, W.; Amirgholipour, S.; Wang, Y.; Zeibots, M.; He, X. DENet: A Universal Network for Counting Crowd With Varying Densities and Scales. IEEE Trans. Multimed. 2021, 23, 1060–1068. [Google Scholar] [CrossRef]
  19. Hafeezallah, A.; Abu-Bakar, S. Crowd Counting Using Statistical Features Based on Curvelet Frame Change Detection. Multimed. Tools Appl. 2017, 76, 15777–15799. [Google Scholar] [CrossRef]
  20. Wang, Z.; Li, W.; Shen, Y.; Cai, B. 4-D SLAM: An Efficient Dynamic Bayes Network-Based Approach for Dynamic Scene Understanding. IEEE Access 2020, 8, 219996–220014. [Google Scholar] [CrossRef]
  21. Zhang, C.; Li, H.; Wang, X.; Yang, X. Cross-Scene Crowd Counting via Deep Convolutional Neural Networks. In Proceedings of the IEEE Conference on Computer Vision and Pattern Recognition, Boston, MA, USA, 7–12 June 2015; pp. 833–841. [Google Scholar]
  22. Geophone—SM-24—SEN-11744—SparkFun Electronics. Available online: https://www.sparkfun.com/products/11744 (accessed on 20 January 2022).
  23. Li, F.; Clemente, J.; Valero, M.; Tse, Z.; Li, S.; Song, W. Smart Home Monitoring System via Footstep-Induced Vibrations. IEEE Syst. J. 2020, 14, 3383–3389. [Google Scholar] [CrossRef]
  24. Al-Naimi, I.; Wong, C.B. Indoor Human Detection and Tracking Using Advanced Smart Floor. In Proceedings of the 2017 8th International Conference on Information and Communication Systems (ICICS), Irbid, Jordan, 4–6 April 2017; pp. 34–39. [Google Scholar] [CrossRef]
  25. Pan, S.; Yu, T.; Mirshekari, M.; Fagert, J.; Bonde, A.; Mengshoel, O.J.; Noh, H.Y.; Zhang, P. FootprintID: Indoor Pedestrian Identification through Ambient Structural Vibration Sensing. Proc. ACM Interact. Mob. Wearable Ubiquitous Technol. 2017, 1, 89:1–89:31. [Google Scholar] [CrossRef]
  26. Pan, S.; Wang, N.; Qian, Y.; Velibeyoglu, I.; Noh, H.Y.; Zhang, P. Indoor Person Identification through Footstep Induced Structural Vibration. In HotMobile ’15: 16th International Workshop on Mobile Computing Systems and Applications, Santa Fe, NM, USA, 12–13 February 2015; Association for Computing Machinery: New York, NY, USA, 2015; pp. 81–86. [Google Scholar] [CrossRef]
  27. Yu, Y.; Weis, T. A Privacy-Protecting Indoor Emergency Monitoring System Based on Floor Vibration. In UbiComp-ISWC ’20: Adjunct Proceedings of the 2020 ACM International Joint Conference on Pervasive and Ubiquitous Computing and Proceedings of the 2020 ACM International Symposium on Wearable Computers, Virtual Event, Mexico, 12–17 September 2020; Association for Computing Machinery: New York, NY, USA, 2020; pp. 164–167. [Google Scholar] [CrossRef]
  28. Yu, Y.; Waltereit, M.; Matkovic, V.; Hou, W.; Weis, T. Deep Learning-Based Vibration Signal Personnel Positioning System. IEEE Access 2020, 8, 226108–226118. [Google Scholar] [CrossRef]
  29. Clemente, J.; Valero, M.; Li, F.; Wang, C.; Song, W. Helena: Real-Time Contact-Free Monitoring of Sleep Activities and Events around the Bed. In Proceedings of the 2020 IEEE International Conference on Pervasive Computing and Communications (PerCom), Austin, TX, USA, 23–27 March 2020; pp. 1–10. [Google Scholar] [CrossRef]
  30. Valero, M.; Clemente, J.; Li, F.; Song, W. Health and Sleep Nursing Assistant for Real-Time, Contactless, and Non-Invasive Monitoring. Pervasive Mob. Comput. 2021, 75, 101422. [Google Scholar] [CrossRef]
  31. Kashimoto, Y.; Fujimoto, M.; Suwa, H.; Arakawa, Y.; Yasumoto, K. Floor Vibration Type Estimation with Piezo Sensor toward Indoor Positioning System. In Proceedings of the 2016 International Conference on Indoor Positioning and Indoor Navigation (IPIN), Alcala de Henares, Spain, 4–7 October 2016; pp. 1–6. [Google Scholar]
  32. Akiyama, S.; Yoshida, M.; Moriyama, Y.; Suwa, H.; Yasumoto, K. Estimation of Walking Direction with Vibration Sensor Based on Piezoelectric Device. In Proceedings of the 2020 IEEE International Conference on Pervasive Computing and Communications Workshops (PerCom Workshops), Austin, TX, USA, 23–27 March 2020; pp. 1–6. [Google Scholar] [CrossRef]
  33. Krohn, C.E. Geophone Ground Coupling. GEOPHYSICS 1984, 49, 722–731. [Google Scholar] [CrossRef]
  34. Team ([email protected]), r.e.G..C.K.I. EPZ-27MS44W—Piezoelement, 4,4 kHz, 200 Ohm, Bedrahtet. Available online: https://www.reichelt.de/piezoelement-4-4-khz-200-ohm-bedrahtet-epz-27ms44w-p145918.html (accessed on 20 January 2022).
  35. Hou, T.; Liu, H.; Zhu, J.; Liu, T.; Liu, L.; Li, Y.; Qian, C.; Xin, Y. Piezoelectric Geophone: A Review from Principle to Performance. Ferroelectrics 2020, 558, 27–35. [Google Scholar] [CrossRef]
  36. Liu, N.; Long, Y.; Zou, C.; Niu, Q.; Pan, L.; Wu, H. ADCrowdNet: An Attention-Injective Deformable Convolutional Network for Crowd Understanding. In Proceedings of the IEEE/CVF Conference on Computer Vision and Pattern Recognition, Long Beach, CA, USA, 15–20 June 2019; pp. 3225–3234. [Google Scholar]
  37. Hannun, A.Y.; Rajpurkar, P.; Haghpanahi, M.; Tison, G.H.; Bourn, C.; Turakhia, M.P.; Ng, A.Y. Cardiologist-Level Arrhythmia Detection and Classification in Ambulatory Electrocardiograms Using a Deep Neural Network. Nat. Med. 2019, 25, 65–69. [Google Scholar] [CrossRef] [PubMed]
  38. Clemente, J.; Li, F.; Valero, M.; Song, W. Smart Seismic Sensing for Indoor Fall Detection, Location, and Notification. IEEE J. Biomed. Health Inform. 2020, 24, 524–532. [Google Scholar] [CrossRef] [PubMed]
  39. LeCun, Y.; Boser, B.; Denker, J.S.; Henderson, D.; Howard, R.E.; Hubbard, W.; Jackel, L.D. Backpropagation Applied to Handwritten Zip Code Recognition. Neural Comput. 1989, 1, 541–551. [Google Scholar] [CrossRef]
  40. LeCun, Y.; Bengio, Y.; Hinton, G. Deep Learning. Nature 2015, 521, 436–444. [Google Scholar] [CrossRef] [PubMed]
  41. He, K.; Zhang, X.; Ren, S.; Sun, J. Deep Residual Learning for Image Recognition. In Proceedings of the IEEE Conference on Computer Vision and Pattern Recognition, Las Vegas, NV, USA, 27–30 June 2016; pp. 770–778. [Google Scholar]
  42. Bouvrie, J. Notes on Convolutional Neural Networks. 2006. Available online: http://cogprints.org/5869/ (accessed on 20 January 2022).
  43. Mirshekari, M.; Fagert, J.; Pan, S.; Zhang, P.; Noh, H.Y. Step-Level Occupant Detection across Different Structures through Footstep-Induced Floor Vibration Using Model Transfer. J. Eng. Mech. 2020, 146, 04019137. [Google Scholar] [CrossRef]
  44. James, G.; Witten, D.; Hastie, T.; Tibshirani, R. An Introduction to Statistical Learning; Springer: Berlin/Heidelberg, Germany, 2013; Volume 112. [Google Scholar]
  45. Russell, S.; Norvig, P. Artificial Intelligence: A Modern Approach; Prentice Hall: Hoboken, NJ, USA, 2002. [Google Scholar]
  46. Grandini, M.; Bagli, E.; Visani, G. Metrics for Multi-Class Classification: An Overview. arXiv 2020, arXiv:abs/2008.05756. [Google Scholar]
Figure 2. (ae) present the vibration signal in the time domain. The figures show samples of time-specific signal fragments from one of the sensors.
Applsci 12 01920 g002
Figure 3. (ad) are the results of the impulse load test experiment done in Pan et al.’s work [15]. This small ball hitting experiment treats ball hit impulse, an analogy to footstep event, as vibration source to study the predictive ability of each feature for pedestrian counting task. The x-axis represents the number of impulses. These figures only consider the 3 vibration source case, and can be interpreted in this way: the larger the difference among the height of the three bars, the more informative the corresponding feature. (a) Cross Correlation from Different Sensors. (b) Cross Correlation from The Same Trace. (c) Step Event Duration. (d) Step Event Signal Entropy.
Applsci 12 01920 g003
Figure 4. System architecture. The footstep event validation is as shown in Figure 5.
Applsci 12 01920 g004
Figure 5. The logic about making prediction for the system. If the system predicts that there is more than one person in the area due to a vibration event detected, it will further check that the signal/vibration event is caused by footsteps. If it is, the system outputs the results. Otherwise, the system outputs 0 person as a result.
Applsci 12 01920 g005
Figure 6. Data acquisition devices and experiment setup.
Applsci 12 01920 g006
Figure 7. An example of signal selection and event detection from the signal stream. The black solid lines denote the beginning of each input sample and red lines the end.
Applsci 12 01920 g007
Figure 8. Architecture of deep learning network.
Applsci 12 01920 g008
Figure 9. Diagram of K-fold cross-validation with K=5. We split the whole dataset into 5 non-overlapping subsets. For the i-th fold, the i-th subset is used as test set and the remaining subsets as training set.
Applsci 12 01920 g009
Figure 10. Confusion matrix normalized over the 5-fold cross-validation evaluation results.
Applsci 12 01920 g010
Table 1. Feature selection of previous work [15]. The features capture the information in vibration signals for footstep events from different perspectives.
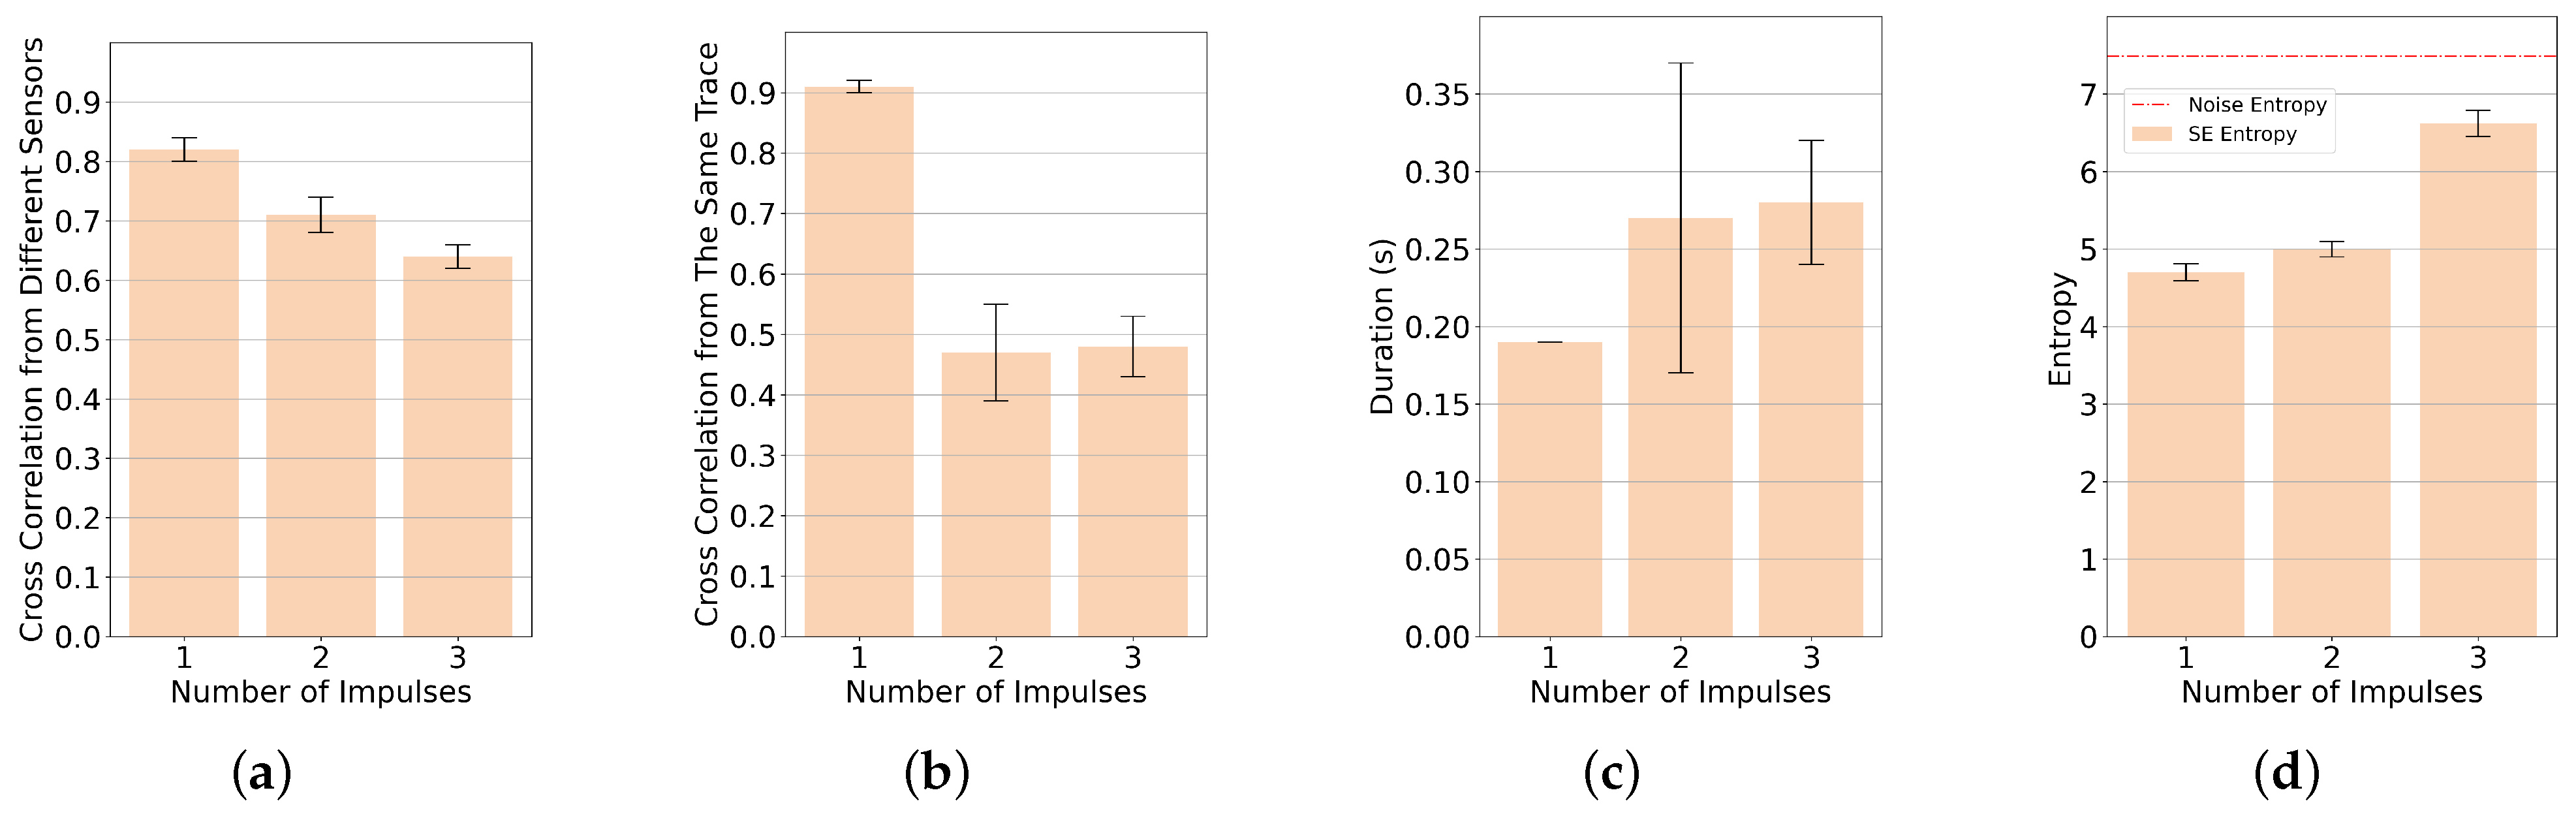
Features for Pedestrian Counting
(1)Space-differential: Cross-correlation between SoIs from different sensors for the same footsteps.
(2)Time-differential: Cross-correlation between SoIs for consecutive footsteps from the same sensor.
(3)SoI duration.
(4)Energy-specific: SoI signal entropy.
Table 2. Capabilities of different approaches.
ApproachesSupport Extreme EnvironmentSupport More than One Person in the Detected AreaSupport More than One Group of PeopleDevice-FreePrivacy ProtectionResilient to Destruction
Camera-based [21,36]---
Device-based [2,3,4]----
Li et al. [23]--
Pan et al. [14,25,26]--
Pan et al. [15,16]-
Our approach
Table 3. Statistics about the dataset.
P0P1P2P3P4
#Samples19543440475251815628
Table 4. Classification performance of the DNN. The average and standard deviation (stdev) for each metric are calculated using results from the 5-fold cross-validation.
PrecisionRecallF1-Score
0 Person 0.9508 ± 0.1042 0.9990 ± 0.0014 0.9717 ± 0.0589
1 Person 0.9988 ± 0.0019 0.9632 ± 0.0806 0.9793 ± 0.0440
2 Persons 0.9966 ± 0.0060 0.9977 ± 0.0018 0.9971 ± 0.0038
3 Persons 0.9900 ± 0.0178 0.9685 ± 0.0476 0.9785 ± 0.0247
4 Persons 0.9732 ± 0.0393 0.9898 ± 0.0175 0.9810 ± 0.0206
Accuracy 0.9827 ± 0.0253
Micro Average 0.9819 ± 0.0293 0.9836 ± 0.0256 0.9815 ± 0.0301
Macro Average 0.9847 ± 0.0212 0.9827 ± 0.0253 0.9828 ± 0.0252
Publisher’s Note: MDPI stays neutral with regard to jurisdictional claims in published maps and institutional affiliations.

