Abstract
The industry has widely accepted Frequency Response Analysis (FRA) as a reliable method to detect power transformers mechanical deformations. While the FRA technique has been recommended in recent literature as a potential diagnostic method to detect internal faults within rotating machines, detailed feasibility studies have not been fully addressed yet. This paper investigates the feasibility of using the FRA technique to detect several short circuit faults in the stator winding of three-phase induction motors (TPIMs). In this regard, FRA testing is conducted on two sets of induction motors with various short circuit faults. Investigated faults include short circuits between two phases, short circuit turns within the same phase, phase-to-ground, and phase-to-neutral short circuit. The measured FRA signatures are divided into three frequency ranges: low, medium, and high. Several statistical indicators are employed to quantify the variation between faulty and healthy signatures in each frequency range. Experimental results attest the feasibility of the FRA technique as a diagnostic tool to detect internal faults in rotating machines, such as induction motors.
1. Introduction
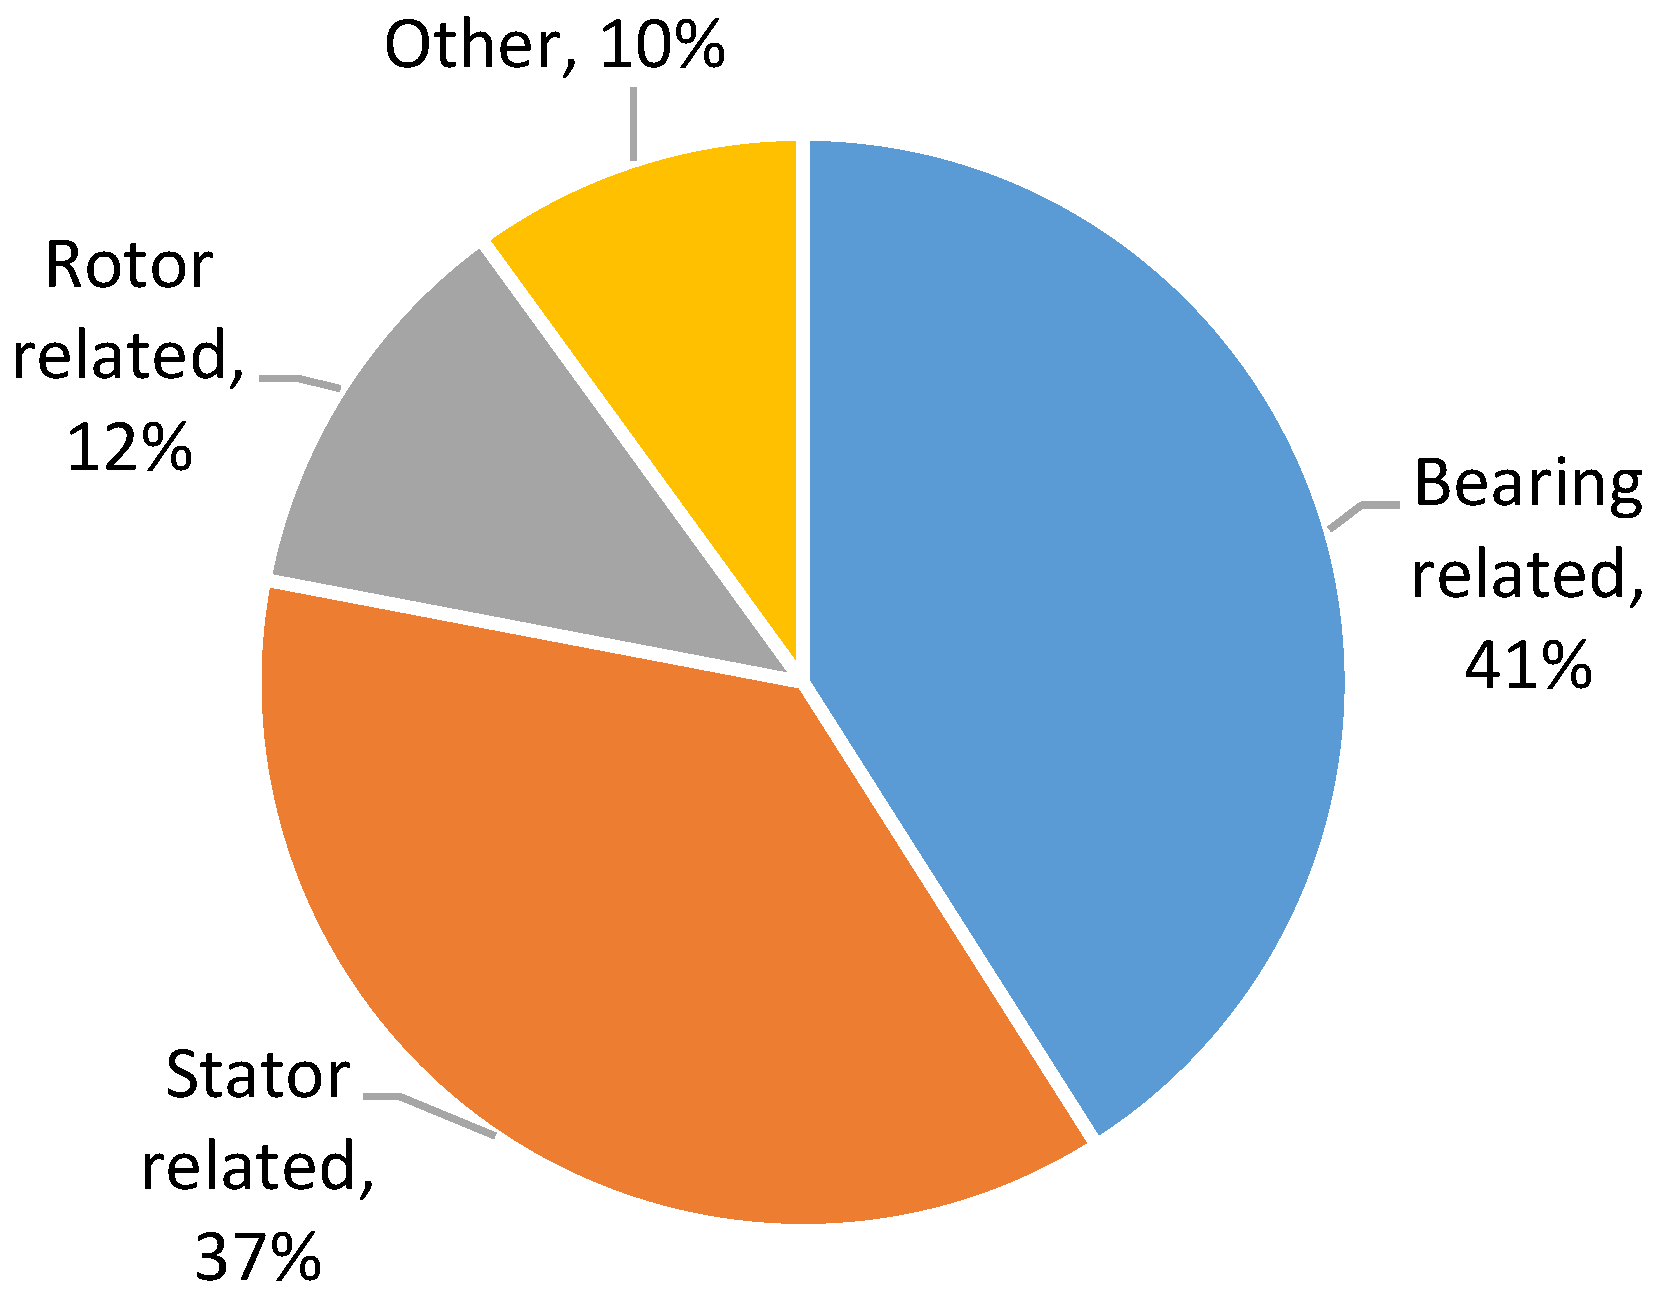
Rotating machinery such as three-phase induction motors (TPIMs) are commonly employed in a variety of industrial applications. Owing to the continuous severe mechanical stress, induction motors are prone to several failure modes, including mechanical and short circuit faults [1]. Other reasons that contribute to the likelihood of motor’s faults include manufacturing defects, inappropriate installation, and other operational factors such as overloading, thermal stress, unbalanced voltage supply, insulation damage, and deterioration of grounding connection [2]. According to an IEEE statistical survey conducted on motors of sizes larger than 200 HP, bearing faults contribute the highest percentage (41%), followed by stator winding faults, which represent 37% of the faults taking place in rotating machines, as shown in Figure 1 [3].

Figure 1.
Percentage of failures by rotating machine components.
While another survey conducted by the Electric Power Research Institute (EPRI) on the reliability of motors less than 200 HP shows slight statistical differences from the IEEE survey, the likelihood of faults within the stator winding is still substantial [4]. Consequently, it is required to adopt a reliable tool to detect motor degradation at early stages to avoid any potential consequences. Short circuit faults within the stator windings of rotating machines may occur due to insulation breakdown as a result of overloading, insulation aging, and mechanical vibration [5].
Several online and offline diagnostic methods have been adopted by the industry to evaluate the condition of rotating machines, as summarized in Table 1. Partial discharge (PD) measurements are used to assess the stator winding insulation condition. PD test has shown good reliability to detect PD activities within winding insulations [6]. In addition, dissipation factor (tan δ) testing is usually used to assess the motor insulation integrity [7]. Other techniques employ the motor current signature or measure the insulation resistance to investigate the insulation condition. Online vibration measurement was used to detect the mechanical integrity of the gearbox and drivetrain but encounters some drawbacks that limit its ability to detect short circuits and other internal mechanical faults within the machine [8]. Voltage withstands and insulation resistance testing methods can be used to investigate the stator winding condition, but they are limited to detecting poor connection and weak points [9,10]. The test is carried out at low voltage levels for in-service machines. On the other hand, pole drop testing, dielectric response analysis, along with the FRA test, can be used to assess the stator winding condition and detect short circuit faults within the induction motors [11,12]. Based on the application of FRA on power transformers, the FRA method can evaluate the mechanical integrity of the active winding within the machine [13,14]. In addition, the FRA method can be used to investigate the condition of the winding insulation, which is considered a non-mechanical fault [15]. Therefore, the FRA method can be used as a comprehensive tool to assess rotating machines such as TPIMs. The FRA test is conducted by injecting a low voltage of a wide frequency range at one end of the winding terminals while measuring the response at the other terminal of the winding. FRA advantages include high dynamic range (>145 dB), high accuracy, low energized voltage, and high sensitivity and safety [10].

Table 1.
Common diagnostic tests for induction motors.
The FRA method is recognized to identify the mechanical deformations within power transformers [13,14]. The test is conducted offline by injecting a low amplitude of AC voltage with a variable frequency in the range 20 Hz–2 MHz to scan each phase and detect any variations from the healthy FRA signature of this phase. While the measurement method for power transformers is well documented in several standards such as the Cigre Working Group A2.26 [16], IEC 60076-18 [17] and IEEE-Std-C57 [18], not much attention was given to extend the technique to detect faults within rotating machines. Due to the reported high sensitivity of the FRA method, it can detect changes occurring within the machine at early stages [19,20,21]. For power transformers, interpretation of the obtained FRA results can be conducted using: (1) time-based comparison, where the obtained FRA data are compared with previously saved reference data for the same unit; (2) type-based comparison in which the measured FRA data are compared with another unit of the same design; (3) phase-based comparison in which measured FRA signatures of the three phases of the same unit are compared. There are few published studies in the literature that investigate the application of the FRA method for TPIMs. In [22], the FRA method is employed to detect broken bars with a squirrel cage induction motor. It is found that the FRA signature shows a variation between 1 kHz and 300 kHz due to broken bars in the squirrel cage induction motor. However, the investigation in this paper is based on the rotor position, and there is no FRA interpretation methodology presented. The application of FRA to diagnose TPIMs has also been proposed in [23,24,25,26,27]. In [23,24], the FRA results were analyzed based on the assessment factor E12. The other studies did not propose an interpretation methodology [26]. There were other studies on reliable diagnostic methods for rotating machines [28,29,30]. Ref. [28] presented healthy and faulty models for the induction motor through simulation and experimental analyses. The studies presented in [29,30] investigated the application of the FRA method to detect failures in the stator winding of the induction motor. In [30], the online application of FRA was proposed. Results revealed the high accuracy of the FRA technique to detect winding SC faults of low levels. Regardless of these research efforts in the literature, there was still a lack of full understanding of the interpretation of the FRA signatures for rotating machines. This study takes a further step to investigate and employ various statistical indicators to understand the effect of SC faults on the FRA signature of three-phase induction motors.
Given the graphical comparison nature of the technique, several studies presented various statistical coefficients to quantify the difference between the measured FRA signatures [31,32]. A survey was conducted to assess the applicability of using statistical indicators to evaluate the variations among the measured FRA signatures [32]. Among them, correlation coefficient (CC), mean squared error (MSE), the absolute sum of logarithmic error (ASLE), and comparative standard deviation (CSD) as listed in Table 2 show high sensitivity to changes in the FRA signatures. The CC is recommended by the IEEE standard to calculate the variation between two FRA traces [18]. According to [33,34,35], ASLE is a highly sensitive statistical indicator for the changes in the frequency responses with reasonably accurate fault detection. In the detection of short circuit faults, the SD encounters an increase with the SC level. However, the ASLE showed a more obvious increase. The use of SD in the interpretation of the FRA signatures was highly suggested [31]. Other recommended statistical indicators were the mean square error (MSE), and root mean square error (RMSE). A summary of the used statistical indicators for the interpretation of the FRA signatures is presented in Table 2 [36,37,38,39]. In Table 2, the two data sets “x(i)” and “y(i)” represent the FRA data to be compared, N is the overall data set size. The main drawback of using statistical indicators is the lack of a widely approved benchmark to identify various faults with a reasonable degree of confidence. As such, further investigation is required to set a benchmark or threshold limits for such indicators.
Table 2.
Statistical indicators used in FRA.
Based on the above, the key contribution of this study can be listed as below:
- Investigating the feasibility of expanding the use of the FRA technique to detect various short circuit (SC) faults contained by rotating machines through experimental measurements.
- Understanding the influence of various TPIMs SC faults on each frequency range of the FRA signature.
- Taking one step forward to set threshold limits for statistical indicators such as CC, SD, ASLE, MSE, RMSE, DABS, Covariance, and MM to standardize the interpretation process.
2. Experimental Setup and Measurement
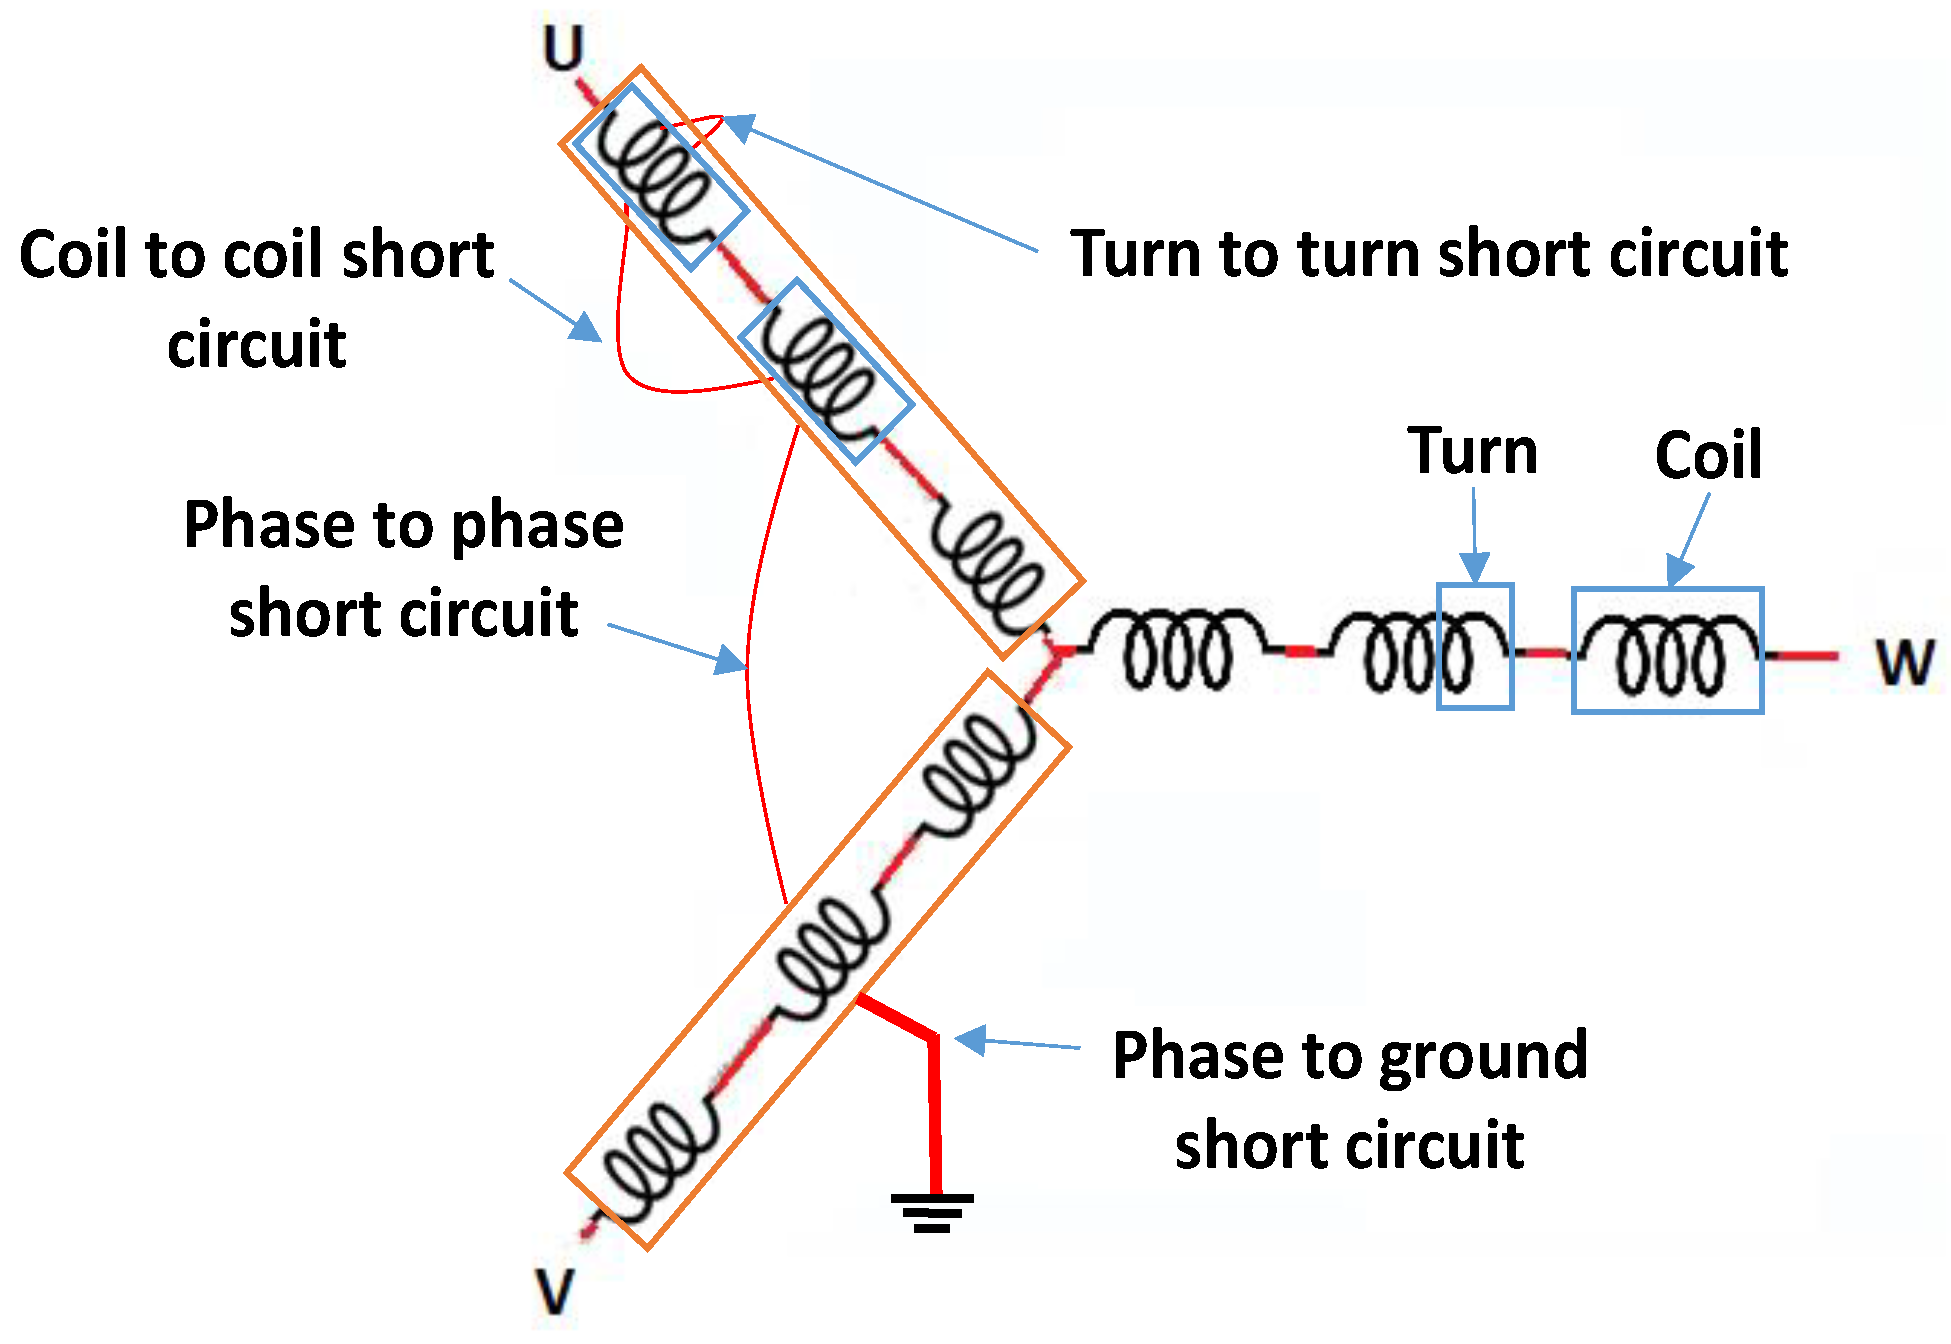
While emerging short circuit turns within the stator windings will not affect the performance of the rotating machine significantly, it can progress rapidly, causing severe damages to the machine. Thus, detecting and correcting such flaws at an early stage is critical. Various short circuit faults can take place within the stator winding, including the turn-turn, coil-coil, phase-neutral, and phase-to-ground, as shown in Figure 2 [40]. FRA measurements are conducted on two TPIMs of different ratings with normal and short-circuited stator windings, as shown in the experimental setup of Figure 3. The parameters of the investigated motors are listed 19 in Table 3.
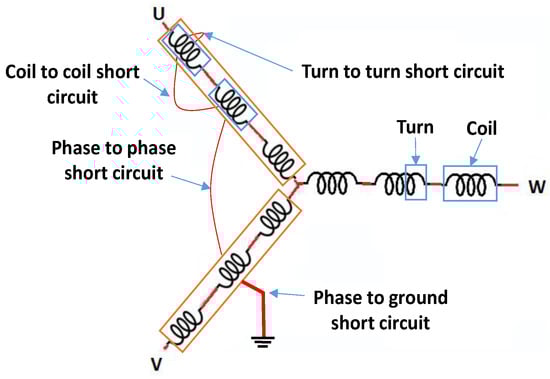
Figure 2.
Schematic diagram of different stator winding SC faults.

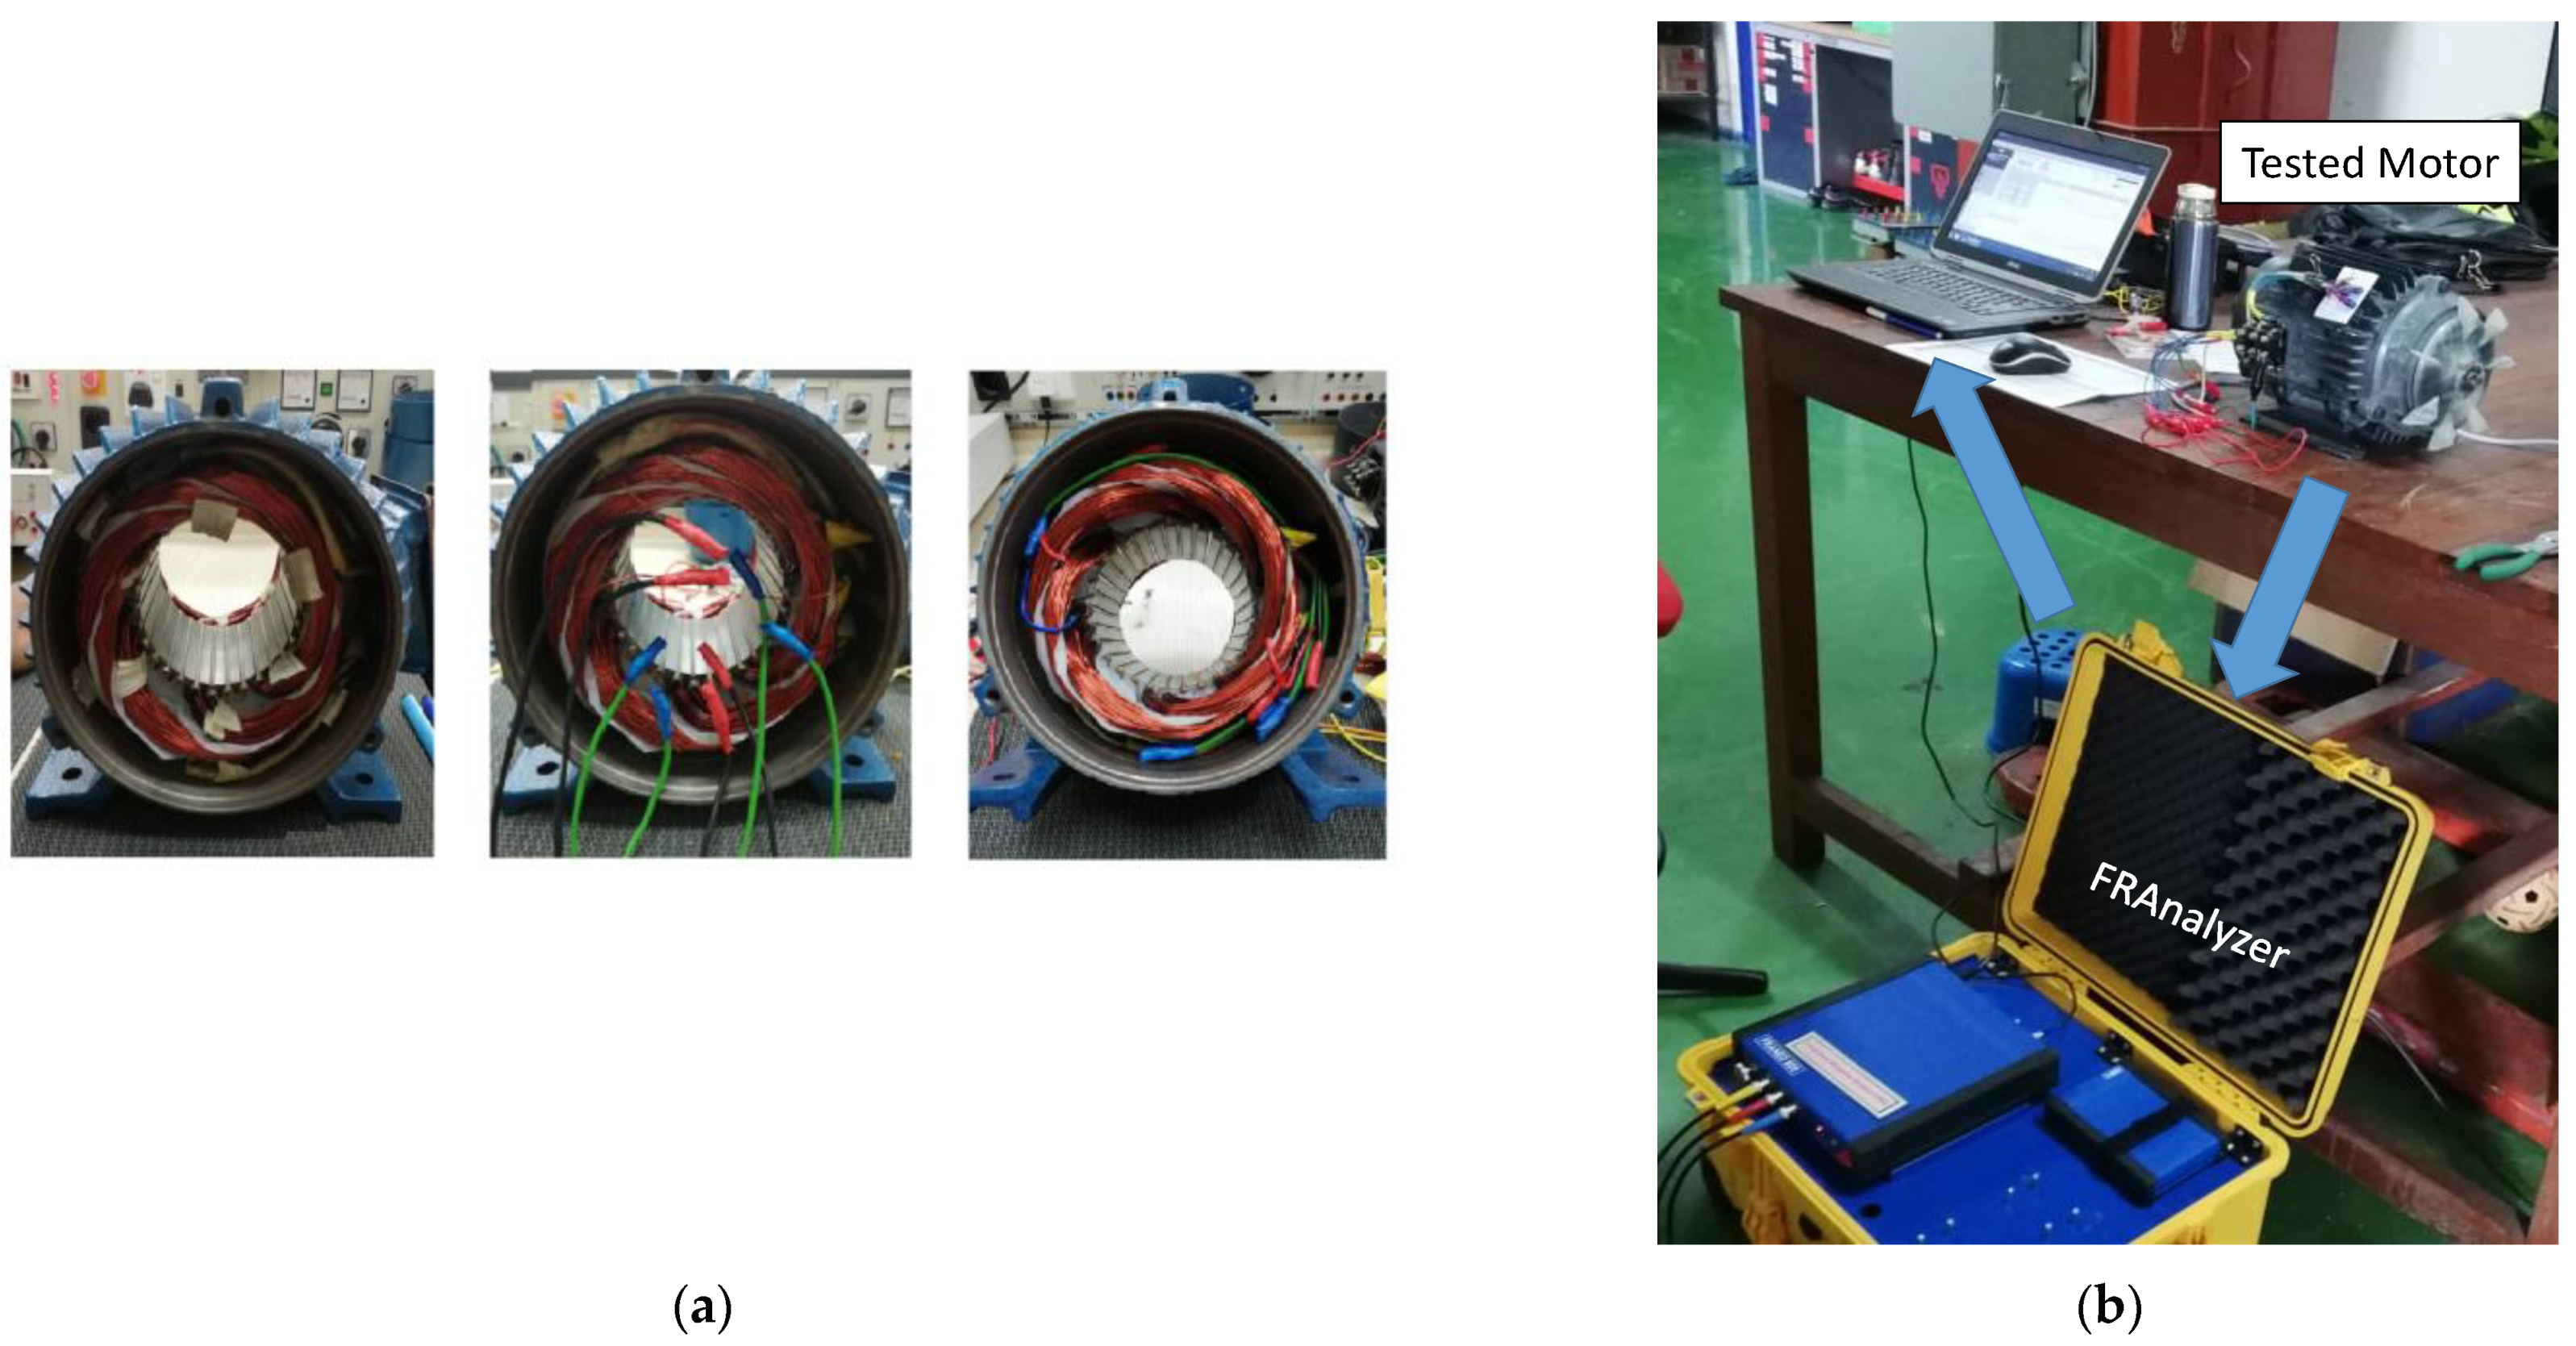
Figure 3.
Laboratory setup, and FRA measurement, (a) short-circuit fault implementation, (b) experimental view on one of the tested motors.
Table 3.
Specifications of the investigated 3-phase induction motors.
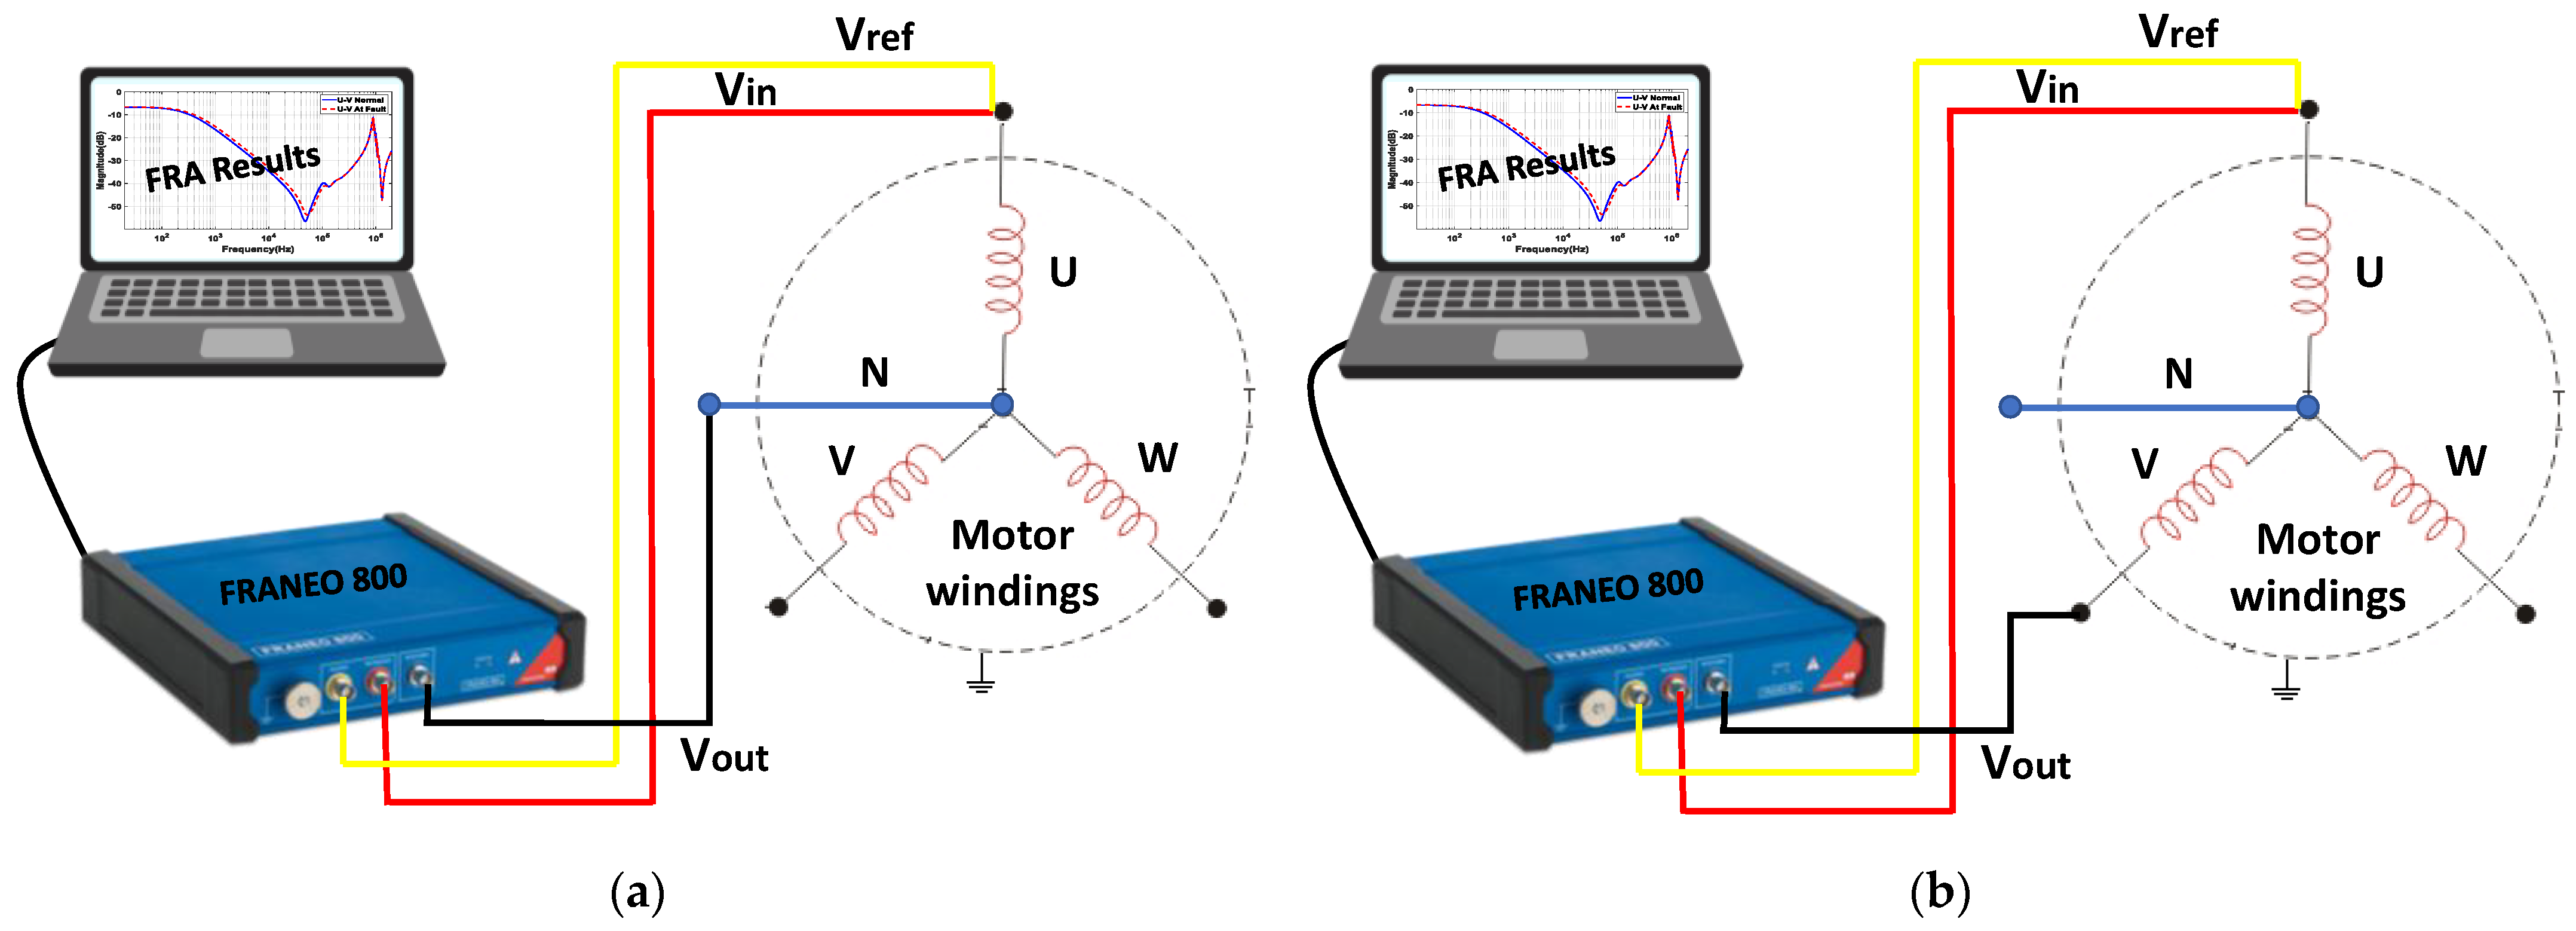
The FRA measurement of each phase of the stator windings is conducted as per the schematic of Figure 4. The FRA analyzer injects a low voltage (<20 V) AC input signal, Vin of wide frequency range at one winding terminal of each phase. The output voltage, Vout can be measured at the other winding terminal of the same phase or another phase terminal. The FRA signature is usually provided as the magnitude of the winding transfer function TFdB = 20 log10 |Vout/Vin| plotted against frequency.
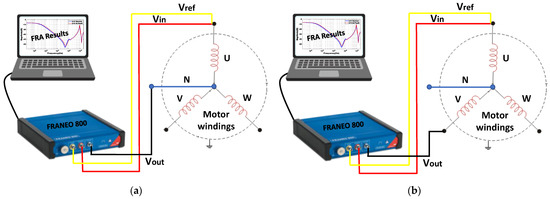
Figure 4.
Schematic diagram for FRA cables connections (a) signature for U–N phase (b) signature for U–V phases.
3. Results and Discussions
FRA measurements are conducted on the two motors listed in Table 3. The FRA signature is measured for a healthy stator winding and is used as a reference signature. Various SC faults, as presented in Figure 2, are staged on the stator winding, and the FRA signature is measured and compared with the reference signature as elaborated in the below two case studies.
3.1. Case Study-1, 3 HP Induction Motor
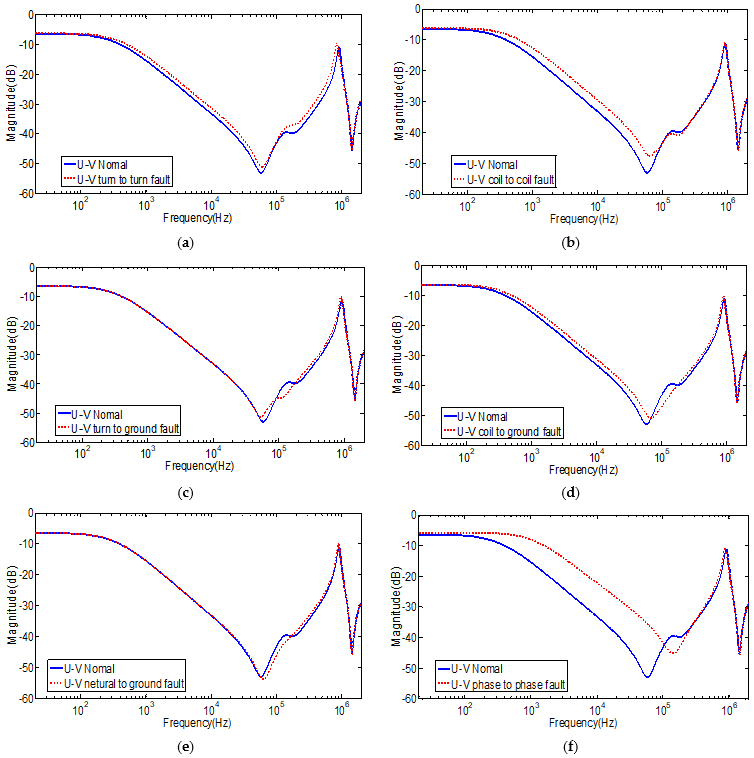
Figure 5 shows the FRA signatures measured for this motor for normal stator winding and when various SC faults are staged on the winding. Figure 5 reveals that the FRA signature is characterized by the main resonance frequency. At the high-frequency range, additional peaks and valleys can be observed due to the contribution of the motor’s capacitive components. Figure 5a shows that turn-to-turn SC fault slightly shifts the resonance frequencies at 50 kHz and 200 kHz to the left with a slight increase in the magnitude over the medium and the high-frequency range. The coil-to-coil SC as shown in Figure 5b affects the FRA signature in a similar way as the effect of turn-to-turn SC fault but is more obvious. The turn-to-ground and coil-to-ground faults effects on the FRA signature are shown in Figure 5c,d, respectively. It can be seen that turn-to-ground fault does not affect the magnitude of the FRA signature but slightly reduce the frequency of the main resonance point. On the other hand, the coil-to-ground fault shifts the main resonance frequency at 50 kHz towards the higher frequency range. The neutral-to-ground SC fault in Figure 5e shows a drop in the response’ magnitude within the frequency range of 50 kHz to 500 kHz. The phase-to-phase fault shows the largest variation in the FRA signature, as shown in Figure 5f, in which the FRA magnitude increases and shifts towards the high-frequency range.
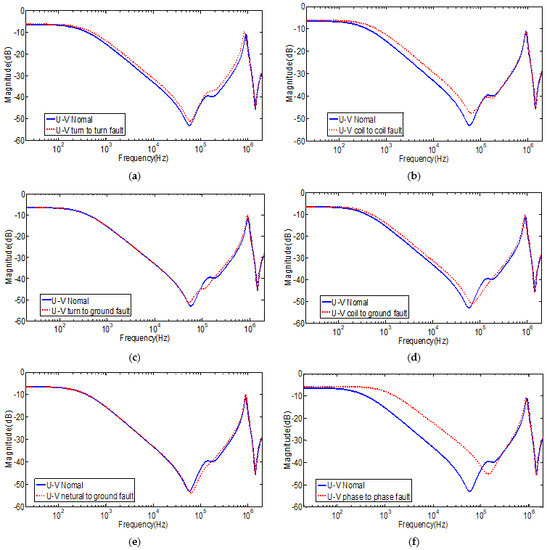
Figure 5.
U–V terminals FRA measured responses for the 3 HP induction motor (a) turn–to–turn SC (b) coil–to–coil SC (c) turn–to–ground SC (d) coil–to–ground SC (e) neutral–to–ground SC (f) phase–to–phase SC.
3.2. Case Study-2, 1 HP Induction Motor
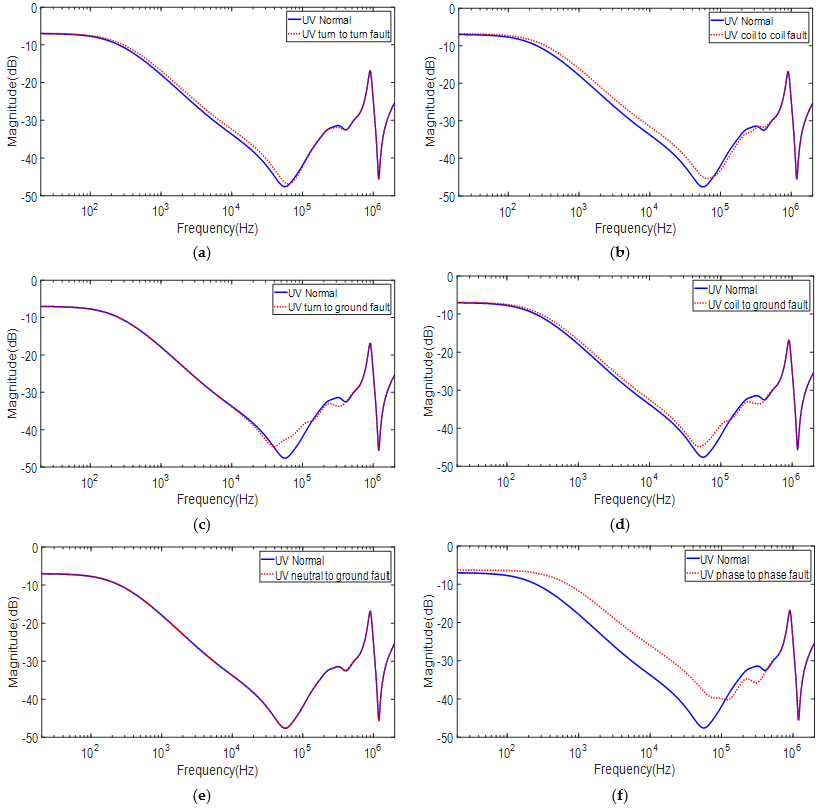
To test the FRA technique’s capability to detect SC faults of induction motors of various sizes, FRA measurements are conducted on a 1 HP induction motor with the same types of faults investigated above. The FRA measurements of this case study are shown in Figure 6. As can be seen in Figure 6, all faults affect the FRA signature in a similar trend to the previous case study. For instance, Figure 6a shows a slight increase in the magnitude in the low and mid-frequency ranges when a turn-to-turn SC fault is staged on the stator winding. Similarly, the coil-to-coil SC fault increases the magnitude of the FRA signature in the low and mid-frequency ranges, as shown in Figure 6b. The turn-to-ground and coil-to-ground faults, as, respectively, shown in Figure 6c,d generally have similar effects on the signature as in the previous case study. Unlike the neutral-to-ground SC fault in the 3 HP motor, the FRA signature of the 1 HP motor shown in Figure 5e does not reveal any impact of the neutral-to-ground fault on the IM FRA signature. The phase-to-phase SC fault shown in Figure 6f has a substantial influence on the FRA trace at the low and mid frequencies.
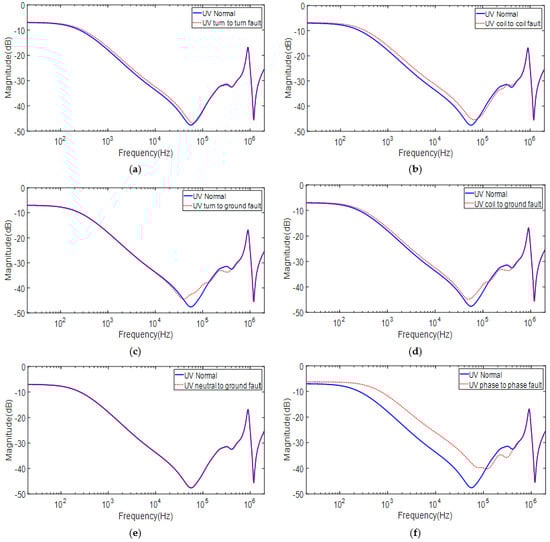
Figure 6.
U–V terminals FRA measured responses for the 1 HP induction motor at (a) turn–to–turn SC (b) coil–to–coil SC (c) turn–to–ground SC (d) coil-to-ground SC (e) neutral–to–ground SC (f) phase–to–phase SC.
4. Statistical Indicators Results
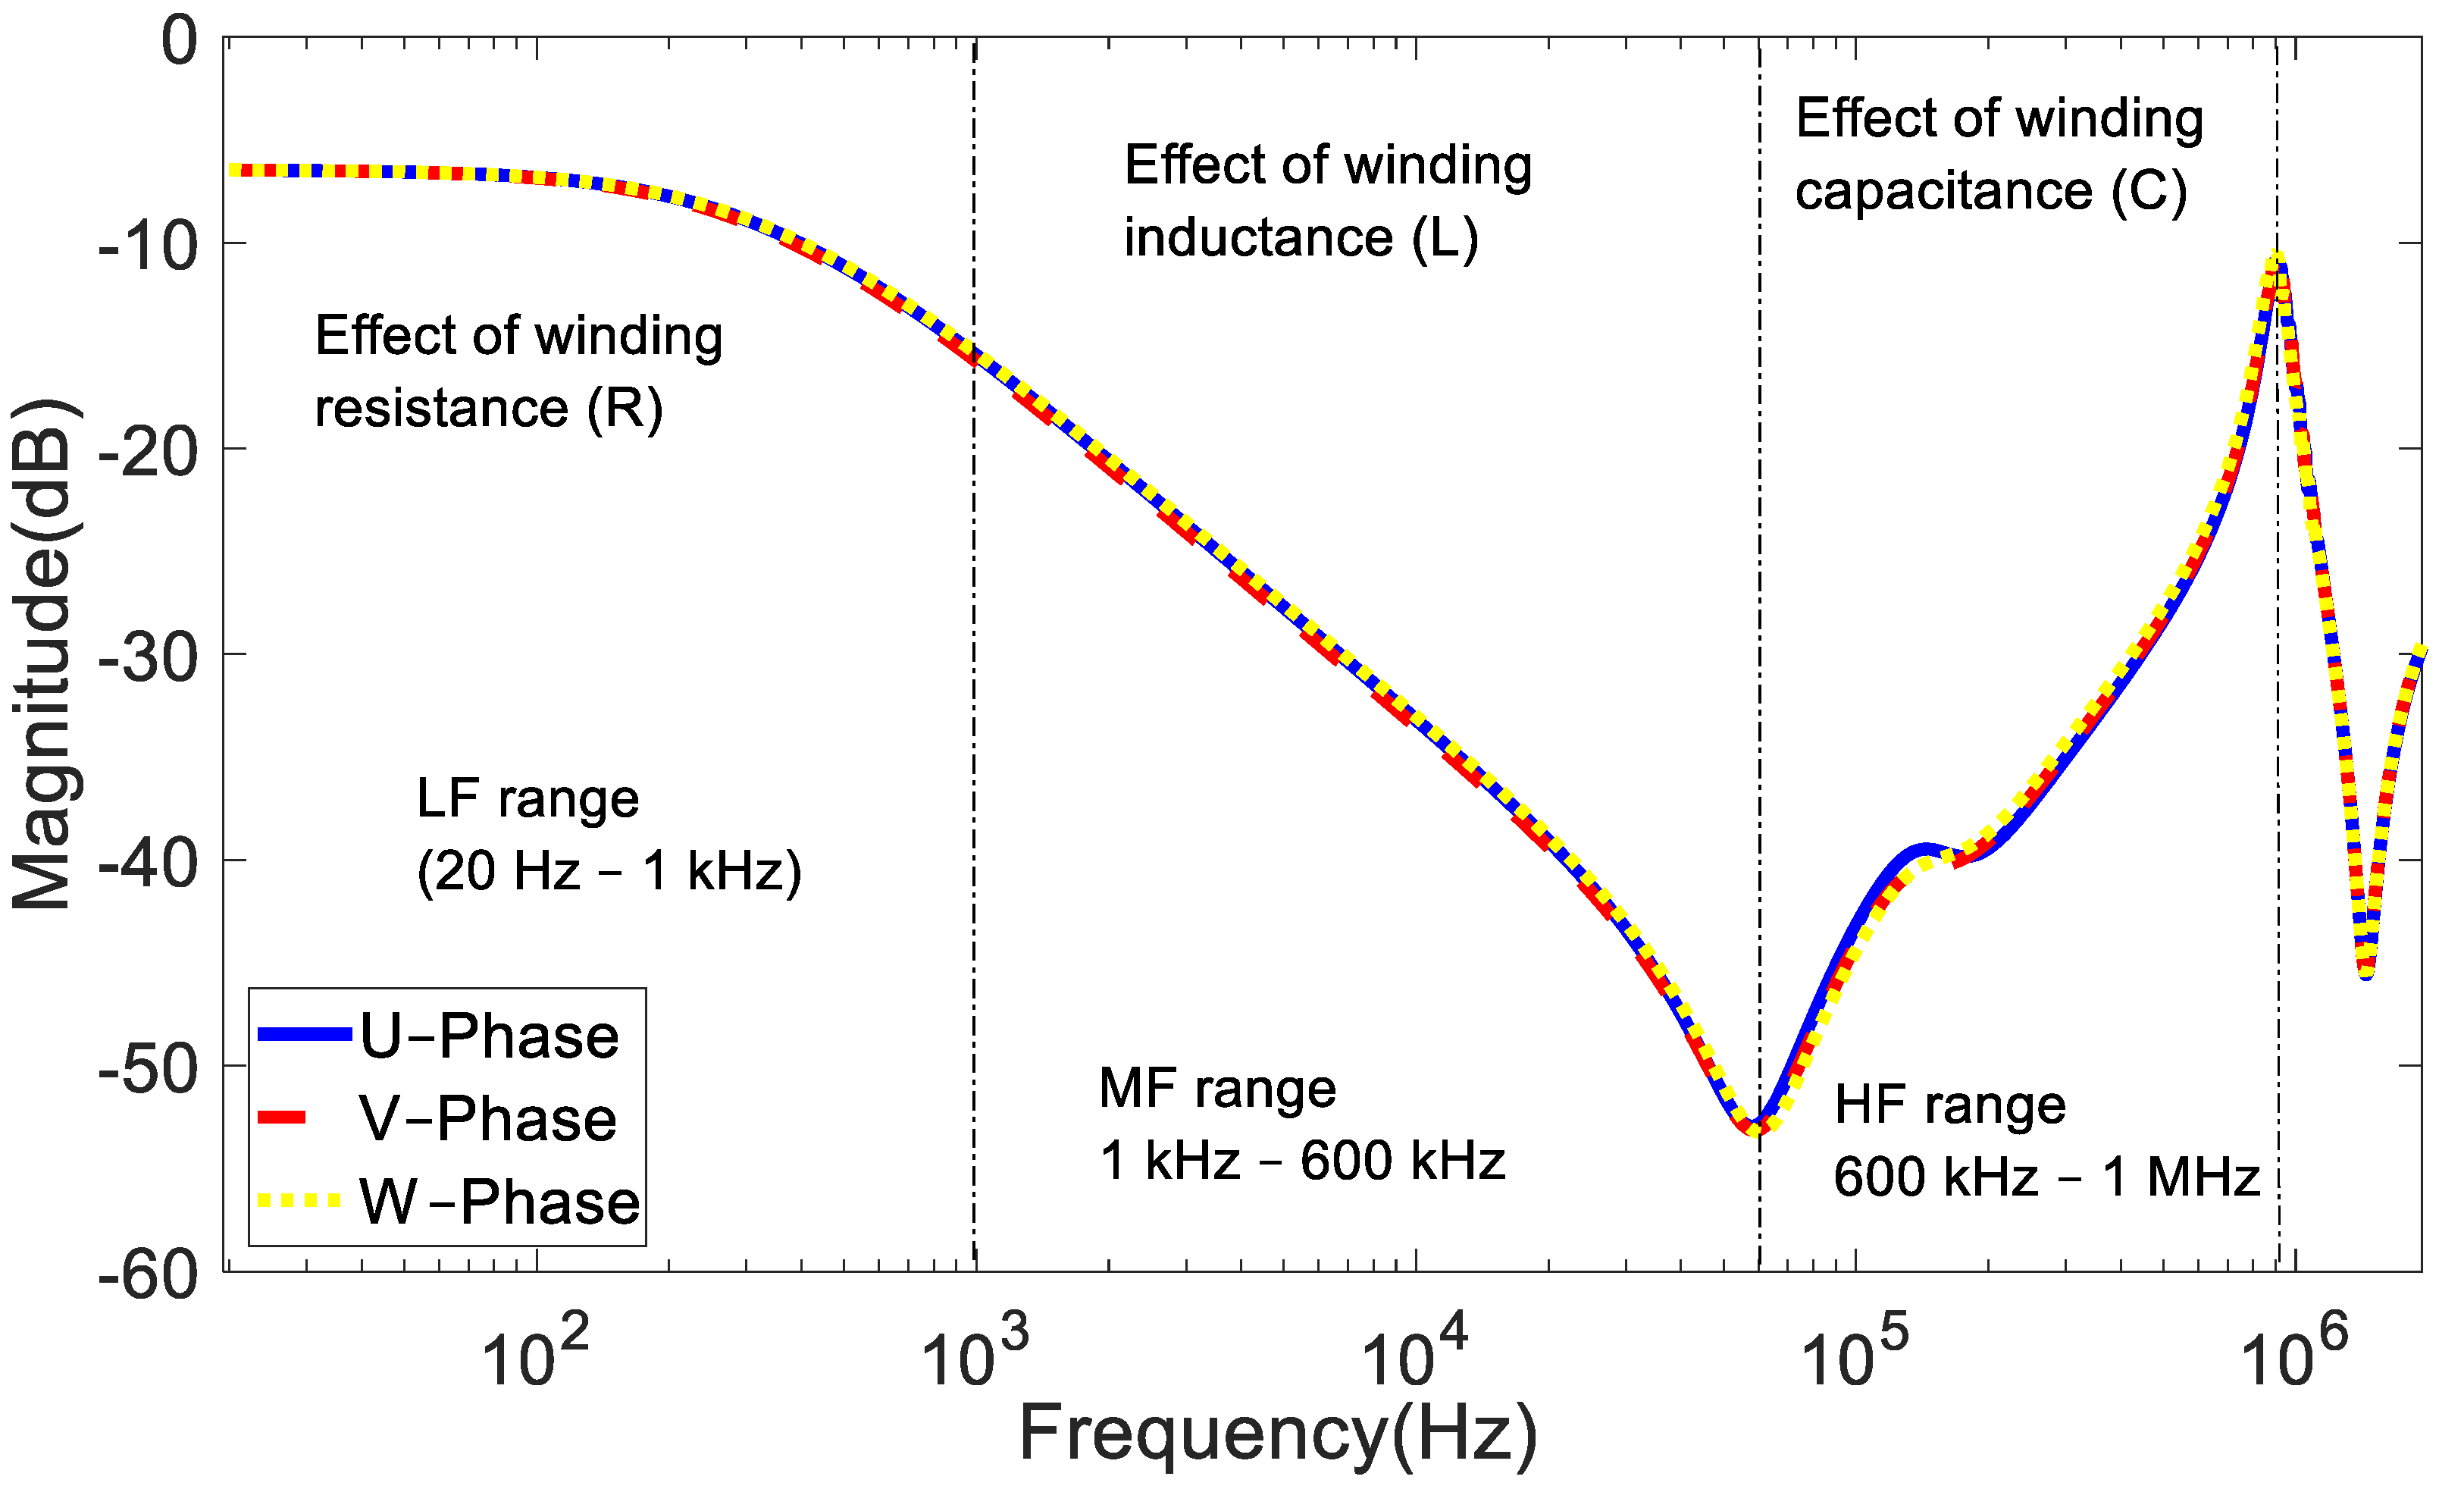
In this section, several statistical indicators are employed to help interpret the measured FRA signatures in the previous two case studies. To enhance the calculation accuracy, the FRA signature is divided into three frequency sub-bands; low-frequency (LF) range, mid-frequency (MF) range, and the high-frequency (HF) range, as shown in Figure 7. Each frequency range is dominated by a specific electric circuit component, e.g., LF range is affected by the winding resistance while the MF range is influenced by the winding inductance and the winding capacitance dominates the signature in the HF range.
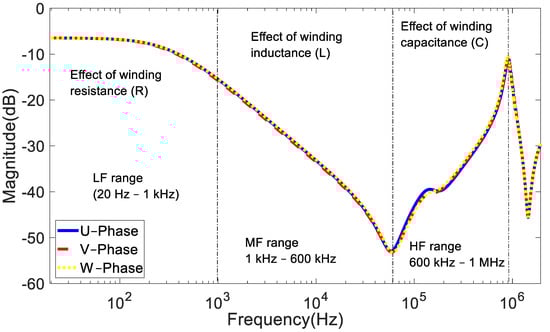
Figure 7.
The common used FRA ranges.
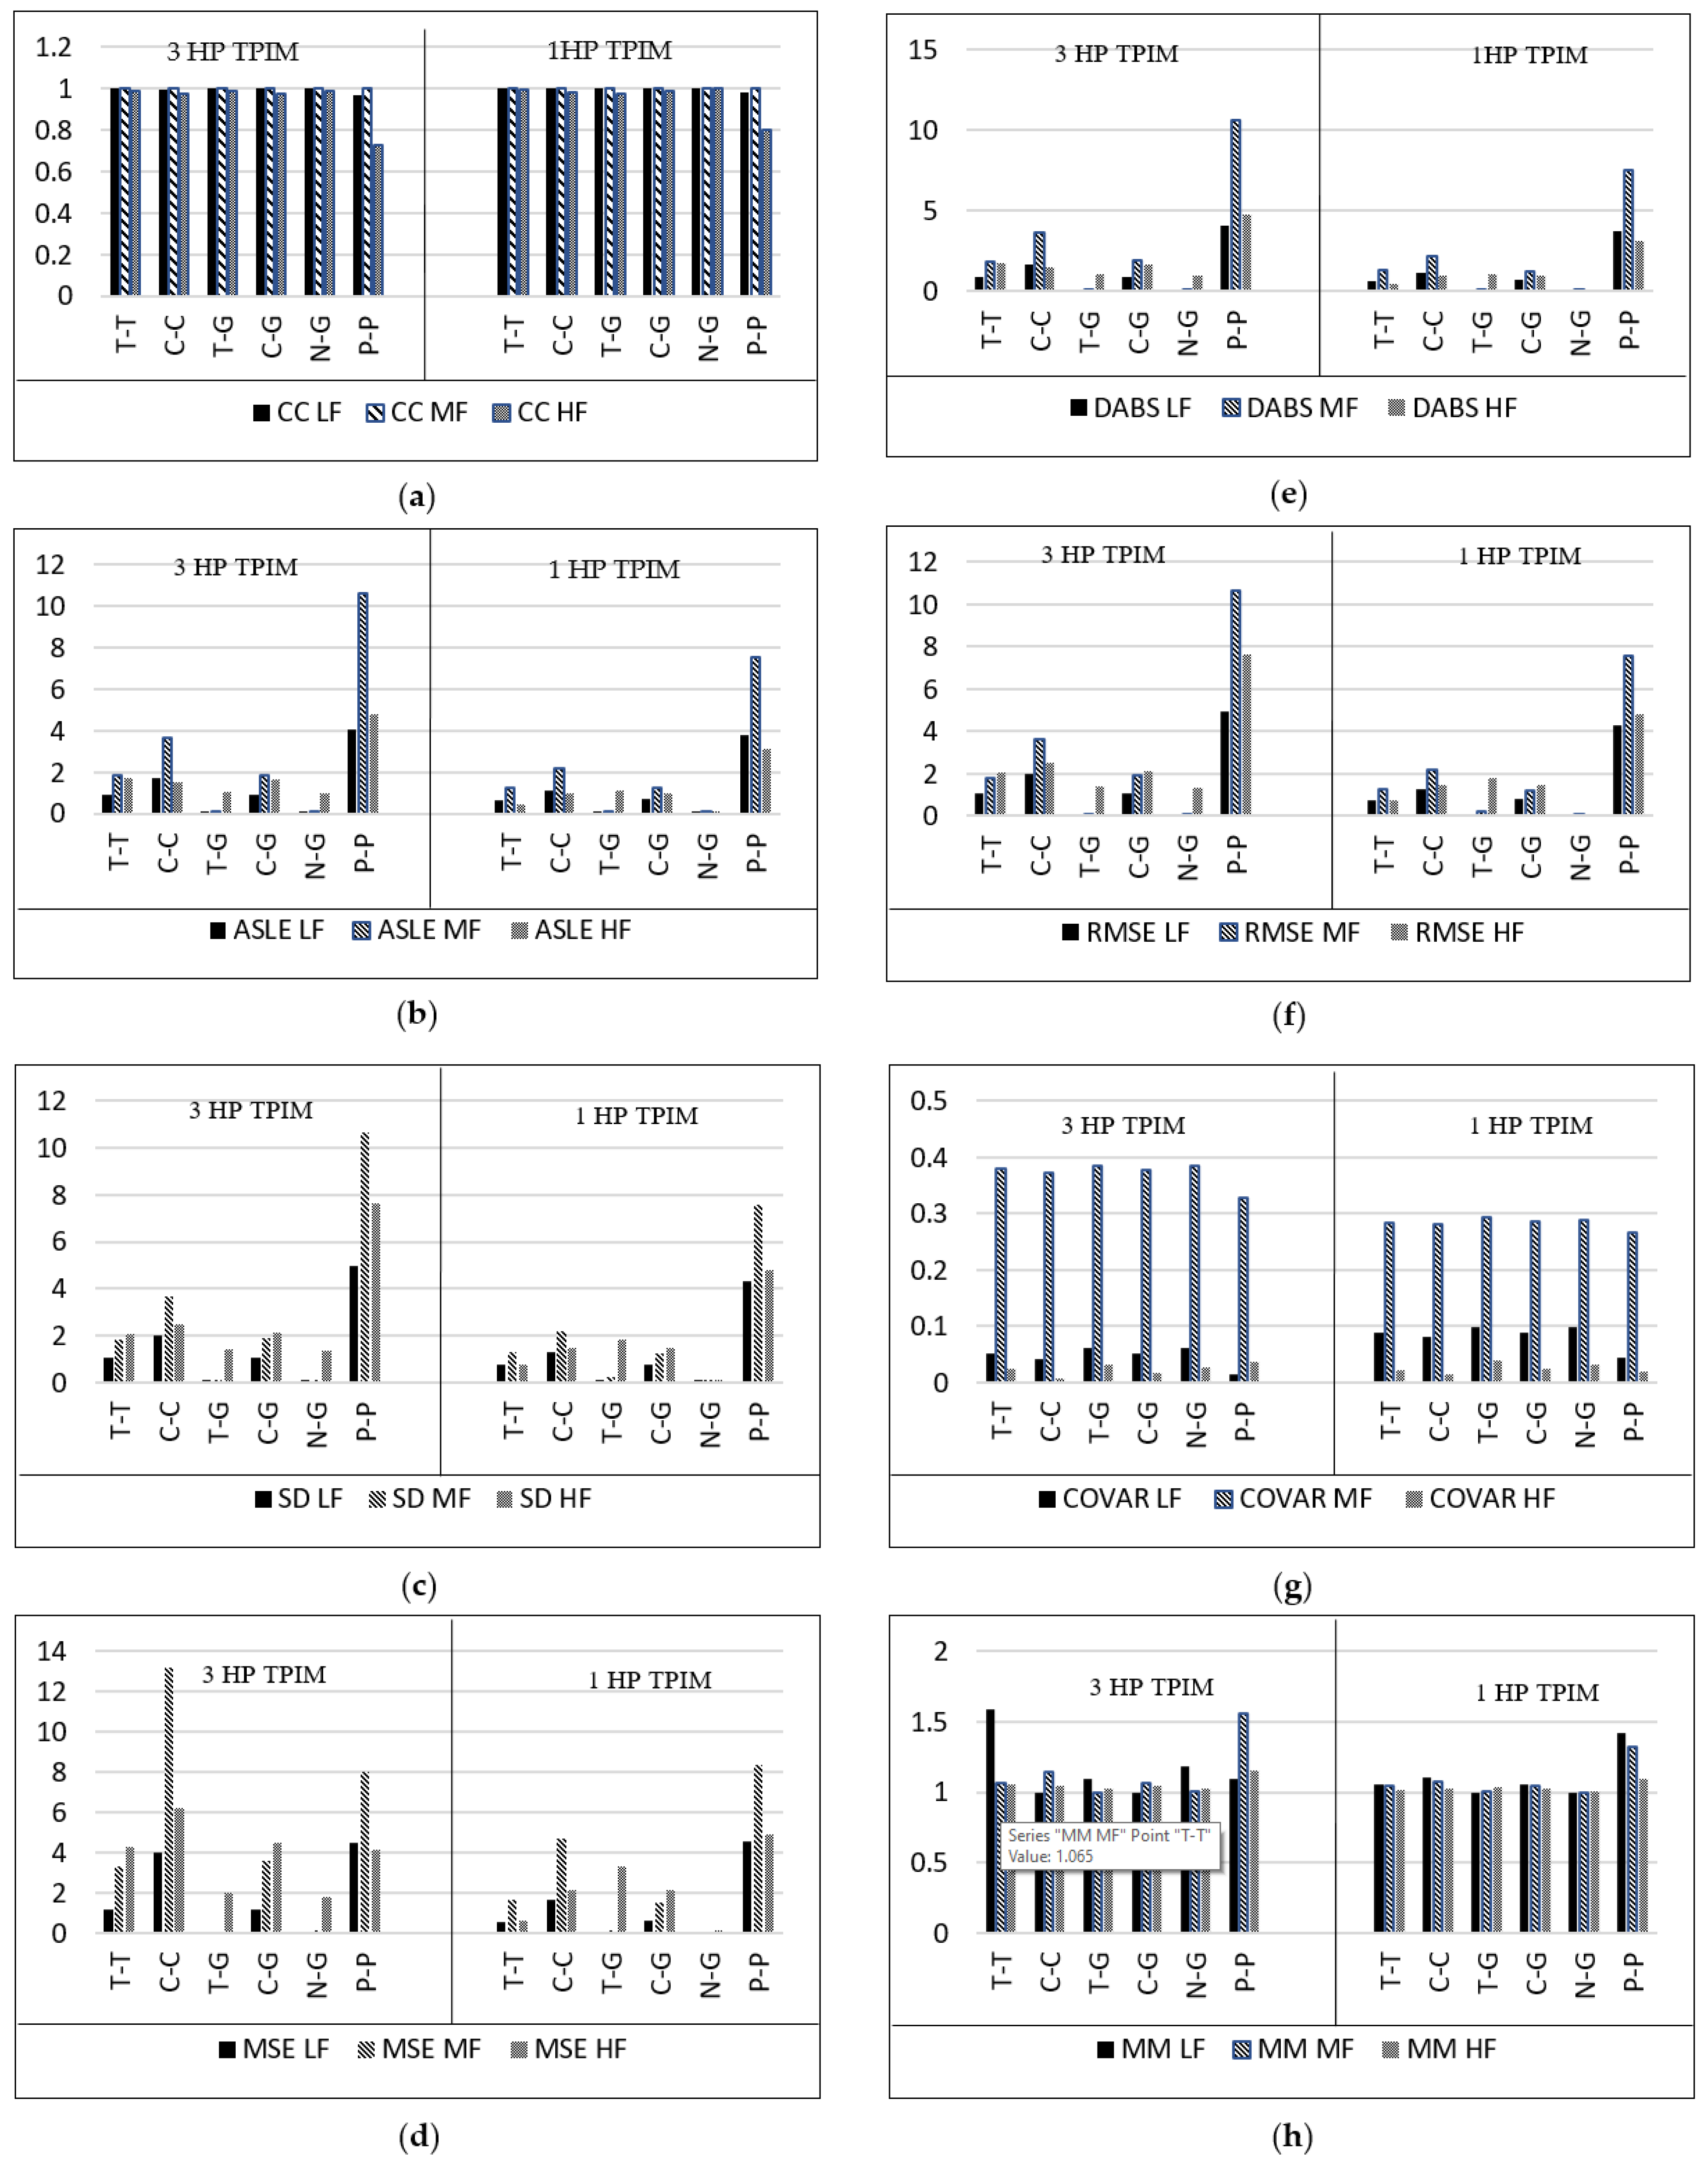
According to Table 4 and Table 5, the CC values indicate that there is an overlap between the normal case and SC turns, coil-to-coil, turn-to-ground, coil-to-ground, and neutral-to-ground at the LF and MF ranges. Within this range, all SC faults revealed a CC value greater than 0.999. However, the CC detects a huge variation between the responses at the HF range, especially for the turn-to-turn, phase-to-phase, coil-to-coil, and coil-to-ground SC. CC indicates substantial variation for phase-to-phase SC at the LF and HF regions. The CC value at the LF range was within 0.967 to 0.985 for the two case studies. The lowest value for the CC (0.731) was obtained in the HF range for phase-to-phase SC fault. On the other hand, the minimum value for the ASLE (0.001) was observed in the MF range of the neutral-to-ground SC fault, while the highest value (10.616) was obtained in the same frequency range but for phase-to-phase SC fault. According to these findings, ASLE was a highly sensitive statistical measure of the variance between two FRA signatures. ASLE values indicate variation within the entire frequency range for the coil-to-coil and phase-to-phase SC faults. The range of ASLE for the two case studies was between 0.803 and 10.616 for phase-to-phase SC fault. For other SC faults, the ASLE clearly indicates a variation in the MF range for the turn-to-turn SC and coil-to-ground fault and at the HF range for the neutral-to-ground fault. Similarly, the minimum value of the SD for the turn-to-ground fault was 0.003 at the LF range, while the highest value (10.637) was obtained at the MF range for the phase-to-phase SC fault. The MSE provides significant variations for phase-to-phase and coil-to-coil faults in the entire frequency range. The RMSE also reveals a substantial variation for the phase-to-phase SC fault. The highest value for the RMSE was 10.637 and was observed for phase-to-phase SC fault at MF phase-to-phase (Table 4). The DABS trend was almost similar to the trend of the RMSE. Results of the covariance show a small percentage in variation and all in the MF region. MM results show almost identical values for all fault types and are in the range of 1.001 to 1.423. The MM shows an obvious difference between the normal and SC faults at the HF region. Figure 8 shows the proposed statistical indicators threshold limits for each fault type based on the obtained values for the two case studies.
Table 4.
The calculated indices obtained from the FRA spectrum for the 3-HP induction motor.
Table 5.
The calculated indices obtained from the FRA spectrum for the 1-HP induction motor.
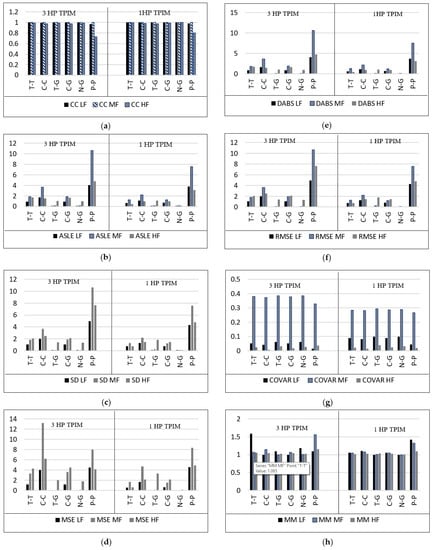
Figure 8.
The statistical indicators threshold limits for each fault for the 3-HP and 1-HP TPIM (a) CC threshold limits (b) ASLE threshold limits (c) SD threshold limits (d) MSE threshold limits (e) DABS threshold limits (f) RMSE threshold limits (g) COVAR threshold limits (h) threshold limits MM.
5. Discussion
The FRA has been used as a successful tool to investigate the mechanical integrity of power transformers and has shown a good potential to detect faults within rotating machines. This paper investigated the ability of FRA to detect various short circuit faults within three-phase induction motors. Results show that the amount of variation for the detected faults, from large to small, is as follows: phase-to-phase, coil-to-coil, turn-to-turn, coil-to-ground, turn-to-ground, and neutral-to-ground. Due to the overlapping of some statistical indicators, this study recommends the use of several indicators for reliable identification and quantification of the SC fault. The proposed threshold limits in Figure 8 are to determine the minimum indicator value for the SC fault to emerge. It is to be noted that while the statistical indicator can be employed to calculate the variation between two FRA signatures, its sensitivity to the variation is different from one statistical indicator to another. The lowest and most common statistical indicator value revealed from the two case studies at the LF, MF, and HF can be considered as an early alarm for emerging SC fault. Results show that ASLE, SD, and RMSE have a similar trend of sensitivity for SC faults, as shown in Figure 8b,c,f. Thus, the ASLE, SD, and RMSE can be ranked as high sensitivity classes. On the other hand, MSE and DABS in Figure 8d,e can also detect the variation between the FRA signatures of the normal and SC faults but can be categorized as a second class or middle sensitivity class compared to the aforementioned indicators. The lowest sensitivity class among the proposed indicators is for the CC, MM, and covariance shown in Figure 8a,h,g, respectively. Based on Table 2, the descriptions of the indicators show that the CC only measures the linear relationship. The MM allows comparing the similarity, and the covariance was based on the Chinese standard. These might affect the level of sensitivity of CC, MM, and covariance to the variation between the normal and SC fault responses.
6. Conclusions
This paper is aimed at investigating the feasibility of using the FRA technique to detect short circuit faults within induction motors through experimental measurements and statistical indicators. Various statistical coefficients are employed to quantify the comparison of the faulty and normal FRA signatures. Measurements conducted on two induction motors of different sizes reveal the feasibility of the FRA method to detect various short circuit faults within the stator winding. Results show that there is a minor variation in the measured frequency response due to turn-to-turn, turn-to-ground, and coil-to-ground SC faults. On the other hand, a substantial variation is observed due to coil-to-coil and phase-to-phase faults. To avoid misinterpretation of the FAR results, several statistical indicators including CC, SD, ASLE, MSE, RMSE, DABS, Covariance, and MM are recommended to be calculated for the measured FRA signatures. Unique threshold limits for some indicators can be set to ease and standardize the FRA interpretation process. A further feasibility study is recommended to explore the impact of other induction motors’ common faults on the FRA signature and statistical indicators. In addition, further research to enhance the robustness of results through providing statistical significance detailed analysis is recommended. The proposed indicators must also be tested on various induction motors of different sizes, models, and operating conditions.
Author Contributions
Conceptualization, S.M.A.-A. and M.F.M.Y.; methodology, S.M.A.-A., M.F.M.Y., M.S.K., and A.A.A.; software, S.M.A.-A., M.F.M.Y., and A.A.S.; validation, S.M.A.-A. and M.F.M.Y.; investigation, S.M.A.-A., M.F.M.Y., and M.S.K.; resources, S.M.A.-A. and M.F.M.Y.; writing—original draft preparation, S.M.A.-A. and M.F.M.Y.; writing review and editing, M.F.M.Y., M.S.K., A.A.S., A.A.-S., M.I.M., and A.A.A.; Project administration: M.F.M.Y. and M.S.K. All authors have read and agreed to the published version of the manuscript.
Funding
This research was funded by the Ministry of Higher Education Malaysia under the Fundamental Research Grant Scheme Vot No. FRGS/1/2018/TK10/UTHM/02/10 and partially sponsored by Universiti Tun Hussein Onn Malaysia Publisher’s Office via Publication Fund E15216 and The Islamic University, Najaf, Iraq.
Institutional Review Board Statement
Not applicable.
Informed Consent Statement
All involved in the content of the study.
Data Availability Statement
The data presented in this study are available in this article.
Acknowledgments
The authors gratefully acknowledge the Post-Doctoral Fellowship Scheme under the Professional Development Research University Grant (05E68) from Universiti Teknologi Malaysia (UTM). The authors would like to thank Mohd Aizam Talib from TNBR Malaysia for his assistance during the experiment. We would also like to thank all the subjects who volunteered to participate in this study.
Conflicts of Interest
The authors declare there are no conflict of interest.
References
- Hsiao, C.-H.; Liu, M.-K. Failure mode analysis of induction motor model. In Proceedings of the 2017 IEEE International Conference on Applied System Innovation, Sapporo, Japan, 13–17 May 2017; pp. 25–28. [Google Scholar] [CrossRef]
- Altaf, S.; Soomro, M.W.; Mehmood, M.S. Fault Diagnosis and Detection in Industrial Motor Network Environment Using Knowledge-Level Modelling Technique. Model. Simul. Eng. 2017, 2017, 1292190. [Google Scholar] [CrossRef] [Green Version]
- Cornell, P.F.E.P.; Owen, E.L.; Appiarius, J.C.; McCoy, R.M.; Albrecht, D.W.H. Improved Motors for Utility Applications. Final Report; General Electric Co.: Schenectady, NY, USA, 1982. [Google Scholar]
- IEEE Motor Reliability Working Group. Report of Large Motor Reliability Survey of Industrial and Commercial Installations, Part I. IEEE Trans. Ind. Appl. 1985, IA-21, 853–864. [Google Scholar] [CrossRef]
- Sadeghi, R.; Samet, H.; Ghanbari, T. Detection of Stator Short-Circuit Faults in Induction Motors Using the Concept of Instantaneous Frequency. IEEE Trans. Ind. Inform. 2018, 15, 4506–4515. [Google Scholar] [CrossRef]
- Florkowski, M.; Florkowska, B.; Zydron, P. Partial Discharges in Insulating Systems of Low Voltage Electric Motors Fed by Power Electronics—Twisted-Pair Samples Evaluation. Energies 2019, 12, 768. [Google Scholar] [CrossRef] [Green Version]
- Hossain, M.L.; Abu-Siada, A.; Muyeen, S.M. Methods for Advanced Wind Turbine Condition Monitoring and Early Diagnosis: A Literature Review. Energies 2018, 11, 1309. [Google Scholar] [CrossRef] [Green Version]
- Salem, A.; Abu-Siada, A.; Islam, S. Improved Condition Monitoring Technique for Wind Turbine Gearbox and Shaft Stress Detection. IET Sci. Meas. Technol. 2017, 11, 431–437. [Google Scholar] [CrossRef]
- Shulphqwdo, Q.Q.; Vlv, Q.D.O.; Ghsduwphqw, O.Q. Condition Monitering and fault Diagnosis of Induction motor–An Experimental Analysis. In Proceedings of the 7th International Conference on Electrical Energy Systems (ICEES), Chennai, India, 11–13 February 2021; pp. 433–438. [Google Scholar]
- OMICRON. Diagnostic Testing and Monitoring of Rotating Machines. 2019. Available online: https://www.omicronenergy.com/download/document/40CEA890-3E5B-447D-BEF5-51CBE544A6E0/ (accessed on 28 October 2021).
- Yousof, M.F.M.; Alawady, A.A.; Al-Ameri, S.M.; Azis, N.; Illias, H.A. FRA Indicator Limit for Faulty Winding Assessment in Rotating Machine. In Proceedings of the 2021 IEEE International Conference on the Properties and Applications of Dielectric Materials (ICPADM), Johor Bahru, Malaysia, 12–14 July 2021; Volume 2021, pp. 346–349. [Google Scholar] [CrossRef]
- Vilhekar, T.G.; Ballal, M.S.; Umre, B.S. Application of Sweep Frequency Response Analysis for the detection of winding faults in induction motor. In Proceedings of the IECON 2016—42nd Annual Conference of the IEEE Industrial Electronics Society, Florence, Italy, 23–26 October 2016; Volume 2016, pp. 1458–1463. [Google Scholar] [CrossRef]
- Abu-Siada, A.; Hashemnia, N.; Islam, S.; Masoum, M.A. Understanding power transformer frequency response analysis signatures. IEEE Electr. Insul. Mag. 2013, 29, 48–56. [Google Scholar] [CrossRef]
- Abu-Siada, A.; Mosaad, M.I.; Kim, D.W.; El-Naggar, M.F. Estimating Power Transformer High Frequency Model Parameters Using Frequency Response Analysis. IEEE Trans. Power Deliv. 2019, 35, 1267–1277. [Google Scholar] [CrossRef]
- Yousof, M.F.M.; Al-Ameri, S.; Ahmad, H.; Illias, H.A.; Arshad, S.N.M. A New Approach for Estimating Insulation Condition of Field Transformers Using FRA. Adv. Electr. Comput. Eng. 2020, 20, 35–42. [Google Scholar] [CrossRef]
- Picher, P. Mechanical Condition Assessment of Transformer Windings Using Frequency Response Analysis (Fra). CIGRE Eval. 2008, 26, 30–34. [Google Scholar]
- IEC 60076-18 Ed.1; Power Transformers—Part 18, Measurement of Frequency Response. IEC Standard: London, UK, 2012.
- C57.149-2012; IEEE Guide for the Application and Interpretation of Frequency Response Analysis for Oil-Immersed Transformers IEEE Power and Energy Society. IEEE: Piscataway, NJ, USA, 2013. [CrossRef]
- Al-Ameri, S.; Yousof, M.F.M.; Ahmad, H.; Alsubari, M.; Talib, M.A. Examining faulty transformer tap changer using frequency response analysis. In Proceedings of the 2017 International Symposium on Electrical Insulating Materials (ISEIM), Toyohashi, Japan, 11–15 September 2017; pp. 259–262. [Google Scholar] [CrossRef]
- Cheng, B.; Wang, Z.; Crossley, P. Using Lumped Element Equivalent Network Model to Derive Analytical Equations for Interpretation of Transformer Frequency Responses. IEEE Access 2020, 8, 179486–179496. [Google Scholar] [CrossRef]
- Al-Ameri, S.; Kamarudin, M.; Yousof, M.; Salem, A.; Siada, A.; Mosaad, M. Interpretation of Frequency Response Analysis for Fault Detection in Power Transformers. Appl. Sci. 2021, 11, 2923. [Google Scholar] [CrossRef]
- Uhrig, S.; Ottl, F.; Hinterholzer, R.; Augeneder, N. Reliable Diagnostics on Rotating Machines using FRA. In The International Symposium on High Voltage Engineering; Springer: Cham, Switzerland, 2019. [Google Scholar] [CrossRef]
- Alawady, A.A.; Yousof, M.F.M.; Azis, N.; Talib, M.A. Frequency response analysis technique for induction motor short circuit faults detection. Int. J. Power Electron. Drive Syst. 2020, 11, 1653–1659. [Google Scholar] [CrossRef]
- Alawady, A.A.; Yousof, M.F.M.; Azis, N.; Talib, M.A. Phase to phase fault detection of 3-phase induction motor using FRA technique. Int. J. Power Electron. Drive Syst. 2020, 11, 1241–1248. [Google Scholar] [CrossRef]
- Brandt, M.; Kascak, S. Failure identification of induction motor using SFRA method. In Proceedings of the ELEKTRO 2016—11th International Conference, Tatry-Štrbské Pleso, Slovakia, 16–18 May 2016; pp. 269–272. [Google Scholar] [CrossRef]
- Brandt, M.; Gutten, M.; Kascak, S. Diagnostic of induction motor using SFRA method. In Proceedings of the 2016 Conference on Diagnostics in Electrical Engineering, Pilsen, Czech, 6–8 September 2016. [Google Scholar] [CrossRef]
- Alawady, A.A.; Yousof, A.F.; Azis, M.N.; Talib, A.A. Internal Fault Detection of Induction Motor using Frequency Response Analysis Technique. Int. J. Adv. Trends Comput. Sci. Eng. 2020, 9, 90–95. [Google Scholar]
- Mabrek, A.; Hemsas, K.E.; Abdelhakim, M.; Eddine, H.K. Induction motor inter-turn fault modeling and simulation using SSFR test for diagnosis purpose. Automatika 2016, 57, 948–959. [Google Scholar] [CrossRef] [Green Version]
- Fan, F.; Zhao, Z.; Tu, P.; Jie, H.; See, K.Y. Impact of Motor Stator Winding Faults on Common-Mode Current. In Proceedings of the Asia-Pacific International Symposium on Electromagnetic Compatibility (APEMC), Bali, Indonesia, 6 October 2021; pp. 1–4. [Google Scholar] [CrossRef]
- Sant’Ana, W.C.; Lambert-Torres, G.; Bonaldi, E.L.; Gama, B.R.; Zacarias, T.G.; Areias, I.A.d.S.; Arantes, D.D.A.; Assuncao, F.D.O.; Campos, M.M.; Steiner, F.M. Online Frequency Response Analysis of Electric Machinery through an Active Coupling System Based on Power Electronics. Sensors 2021, 21, 8057. [Google Scholar] [CrossRef]
- Samimi, M.H.; Tenbohlen, S.; Akmal, A.A.S.; Mohseni, H. Evaluation of numerical indices for the assessment of transformer frequency response. IET Gener. Transm. Distrib. 2017, 11, 218–227. [Google Scholar] [CrossRef]
- Al-Ameri, S.M.A.N.; Kamarudin, M.S.; Yousof, M.F.M.; Salem, A.A.; Banakhr, F.A.; Mosaad, M.I.; Abu-Siada, A. Understanding the Influence of Power Transformer Faults on the Frequency Response Signature Using Simulation Analysis and Statistical Indicators. IEEE Access 2021, 9, 70935–70947. [Google Scholar] [CrossRef]
- Sant’Ana, W.C.; Salomon, C.P.; Lambert-Torres, G.; da Silva, L.E.B.; Bonaldi, E.L.; Oliveira, L.E.D.L.D.; da Silva, J.G.B. A survey on statistical indexes applied on frequency response analysis of electric machinery and a trend based approach for more reliable results. Electr. Power Syst. Res. 2016, 137, 26–33. [Google Scholar] [CrossRef]
- Miyazaki, S.; Tahir, M.; Tenbohlen, S. Detection and quantitative diagnosis of axial displacement of transformer winding byfrequency response analysis. IET Gener. Transm. Distrib. 2019, 13, 3493–3500. [Google Scholar] [CrossRef]
- Aljohani, O.; Abu-Siada, A. Application of DIP to Detect Power Transformers Axial Displacement and Disk Space Variation Using FRA Polar Plot Signature. IEEE Trans. Ind. Inform. 2016, 13, 1794–1805. [Google Scholar] [CrossRef] [Green Version]
- Badgujar, K.; Maoyafikuddin, M.; Kulkarni, S. Alternative statistical techniques for aiding SFRA diagnostics in transformers. IET Gener. Transm. Distrib. 2012, 6, 189–198. [Google Scholar] [CrossRef]
- Hashemnia, N.; Abu-Siada, A.; Masoum, M.A.S.; Islam, S.M. Characterization of transformer FRA signature under various winding faults. In Proceedings of the 2012 IEEE International Conference on Condition Monitoring and Diagnosis, Bali, Indonesia, 23–27 September 2012; pp. 446–449. [Google Scholar] [CrossRef] [Green Version]
- Abu-Siada, A.; Aljohani, O. Detecting incipient radial deformations of power transformer windings using polar plot and digital image processing. IET Sci. Meas. Technol. 2018, 12, 492–499. [Google Scholar] [CrossRef] [Green Version]
- Behjat, V.; Mahvi, M. Statistical approach for interpretation of power transformers frequency response analysis results. IET Sci. Meas. Technol. 2015, 9, 367–375. [Google Scholar] [CrossRef]
- Ukil, A.; Chen, S.; Andenna, A. Detection of stator short circuit faults in three-phase induction motors using motor current zero crossing instants. Electr. Power Syst. Res. 2011, 81, 1036–1044. [Google Scholar] [CrossRef]
Publisher’s Note: MDPI stays neutral with regard to jurisdictional claims in published maps and institutional affiliations. |
© 2022 by the authors. Licensee MDPI, Basel, Switzerland. This article is an open access article distributed under the terms and conditions of the Creative Commons Attribution (CC BY) license (https://creativecommons.org/licenses/by/4.0/).