1. Introduction
Approximately 125 million households, nearly 7.7 million business establishments, and 90,000 governmental units in the U.S. require efficient and reliable movement of freight [
1]. Freight transportation has become an indicator of economic growth and regional development, which makes freight analysis an increasingly important area. The main objective of freight analysis is to reduce freight transit time and transportation cost and improve the reliability of freight movement. In addition, it is beneficial in mitigating traffic congestion, better planning land use, and improving economic competitiveness [
2].
Conventional freight data collection occurs through questionnaires filled manually by carriers, shippers, or receivers regarding the commodity type, origin, and destination [
2]. However, survey-based methods have several apparent drawbacks, such as low response rates, unknown data reliability, and high time cost [
3]. Although trucking companies are likely to keep detailed records of their truck and commodity information, most of them are unwilling to make these records public due to possible competition. As a consequence of the above limitations, current freight data have limited reliability, completeness, and efficiency, thereby reducing its applicability in downstream analysis and processing.
The video-based sensing technique has achieved consistent improvements in supporting a cost-effective and accurate traffic system. This has led to increasingly popular vision-based solutions in transportation applications aiming to improve efficiency and reduce costs. However, it is known that applying these solutions to freight classification is still in its infancy due to the challenges of the absence of a public dataset, real-time requirements of identifying objects, and large variations in environmental conditions.
Among various transportation modes, truck-based transportation acts as the major mode of commodity shipments in the U.S., carrying
of the total commodity tonnages and
of the commodity values, according to [
4]. Truck-based freight transportation is expected to grow in the next decade according to ATA’s freight forecast. In response to this, the research community has developed various classification models for trucks and trailers, relying on the input data collected from traffic sensors such as weigh-in-motion (WIM), inductive loop detectors (ILD), and cameras [
5,
6,
7,
8]. However, the major limitation is that they fail to reveal the carried cargo from the limited cues identified from trucks.
Large-scale road-based freight data analysis is of great need to alleviate problems of traffic congestion, bottlenecks, and truck empty-mile wastage. In this paper, to the best of our knowledge, we present a fundamental video processing approach for freight analysis based on fine-grained visual information of truck images, e.g., logos and texts, collected in real-world environments. Logos provide important cues in identifying commodity types. Preliminary works [
9,
10] have shown effectiveness in detecting and recognizing license plates and predefined sets of vehicle brand logos. However, they cannot meet the requirement of freight analysis, where we are interested in reporting a broad range of logos carried by trucks with potential extensions in the future. In other words, the desired approach should be extensible, as it would be impractical to provide an exhaustive list of company logos, and new logos will likely show up. Therefore, an approach to bridging the gap between logo recognition and freight classification is desperately needed to supplement the existing data sources.
Prior work has successfully inferred the commodity type based on the trailer types, e.g., enclosed or tank, recognized from some truck images [
6]. However, it fails to handle the majority of trucks with enclosed trailers. Fortunately, we might still infer the commodity types by leveraging those company logos potentially on truck bodies, which remains as the non-trivial task of detecting and recognizing logos on trucks. The challenges mainly lie in several factors such as uncontrolled illumination, occlusions, and background clutter. To address all mentioned problems, we have made the following contributions (A preliminary version of this manuscript has been presented in a conference [
7], where we tackle the commodity classification by only utilizing text information of logos on trucks. In this paper, we leverage both text and image content information and develop an integrated approach to combine predictions from both text-based and image-based solutions):
A coarse-to-fine universal logo detector that can estimate the locations of previously unseen logos. Since the detector is class-agnostic and not limited to a certain set of logos, it applies to a wide range of logos;
An integrated approach to accurately link the detected logos to a company dataset customized for traffic scenarios. It proposes to leverage both text and image information from logos by a combination of texts generated from state-of-the-art solutions and logo types identified from our proposed logo matching method. The developed approach can be effectively extended to new logo classes and companies in which the traffic agency is highly interested;
A novel end-to-end road video processing system to provide real-time dynamic commodity information by deploying sensors and edge devices in locations of interest. This utilizes the NAICS (North American Industry Classification System) taxonomy with searches aimed at commodity type inference based on the name of the company.
In addition, we have developed a new benchmark on commodity classification using logos. To the best of our knowledge, this is the first attempt at doing so, which could be beneficial in helping traffic engineers and researchers better evaluate their developed models.
The rest of the paper is organized as follows.
Section 2 reviews previous studies that include relevant topics or techniques.
Section 3 describes the overall commodity classification pipeline and details of all developed logo detection and recognition approaches.
Section 4 describes the experimental settings and results of the different developed approaches. Finally,
Section 5 concludes with an overall summary (while discussing limitations) and presents opportunities for future work.
3. Methodology
In this section, we describe the developed approach in detail. Logos, serving as the outward expression of brands, often consist of letters or texts with large variations in colors, font styles, and graphical figures. Logos can appear anywhere on truck bodies, making it hard to leverage any prior knowledge of context and placement. It becomes more challenging when moving to truck images of low resolutions, poor light and weather conditions, and diverse view angles. The existing work on logo detection relies on large datasets of sufficient fine-grained annotations on logos such as bounding boxes and logo types, which, however, are often unavailable in real-world traffic scenarios. In this paper, we have developed techniques following broad approaches for text-based and image-based logos as follows:
For text-based logos, we employ state-of-the-art solutions for text detection [
25,
26] and recognition [
27,
28] to obtain raw text predictions with high accuracy. These predicted logo texts were matched to our built commodity database by comparing these texts with recorded company names via simple string matching algorithms;
To identify image-based logos that do not contain text information, we developed a novel two-stage image-based approach: a universal logo detection stage that outputs all potential logo positions within images, followed by a logo recognition stage designed to incorporate various advanced image representations. If the universal logo detector returned bounding boxes with high confidence scores, we cropped out the corresponding image regions to obtain logo candidate images. Each logo image was processed by our developed model to obtain the image features. These features were matched with pre-computed image features stored in a database containing ground truth logo images of interest. It is considered as a correct match if the matching score surpasses a certain threshold; otherwise, we ignore this logo candidate;
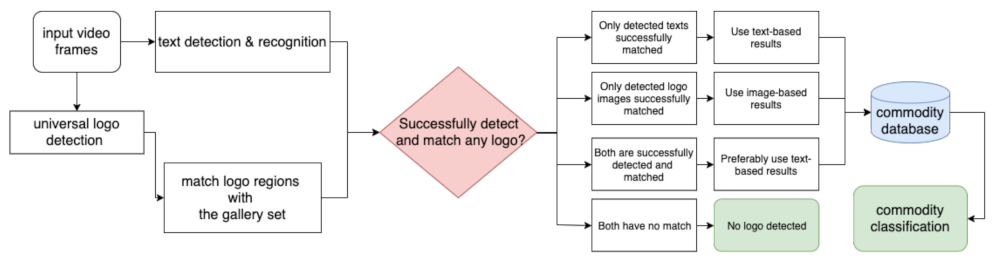
For an automated system, it is not known a prior whether a given truck contains text- or image-based logos (or neither). We integrated the text-based approach and image-based approach using the pipeline shown in
Figure 1. This pipeline naturally combines the advantages of both approaches in one integrated approach, and the later experiments in
Section 4 validate its effectiveness in improving the performance of commodity classification.
3.1. Text-Based Logo Detection and Recognition
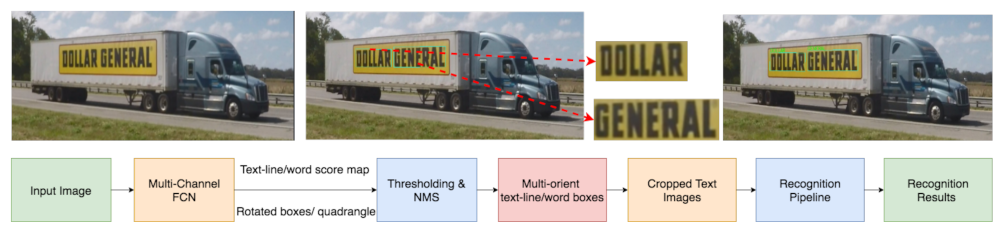
We implemented state-of-the-art scene-text solutions, extending the previous research work on EAST [
25] for text detection and CRNN [
28] for text recognition. The pipeline is shown in
Figure 2. It consists of the following steps:
For a truck image acquired from a roadside traffic camera, we generate the text line/word map based on the features extracted from the multichannel FCN (fully convolutional network) model in EAST, which helps identify text regions of interest;
To remove detected texts largely overlapping each other, we apply the standard post-processing technique called NMS (non-maximum suppression), which results in oriented bounding boxes to indicate text line/word locations;
We then crop out the image region within each oriented bounding box and feed it into the CRNN model to translate the text image to a pure text string;
Finally, we match the predicted text string to a predefined logo class via additional techniques for word prediction and string matching.
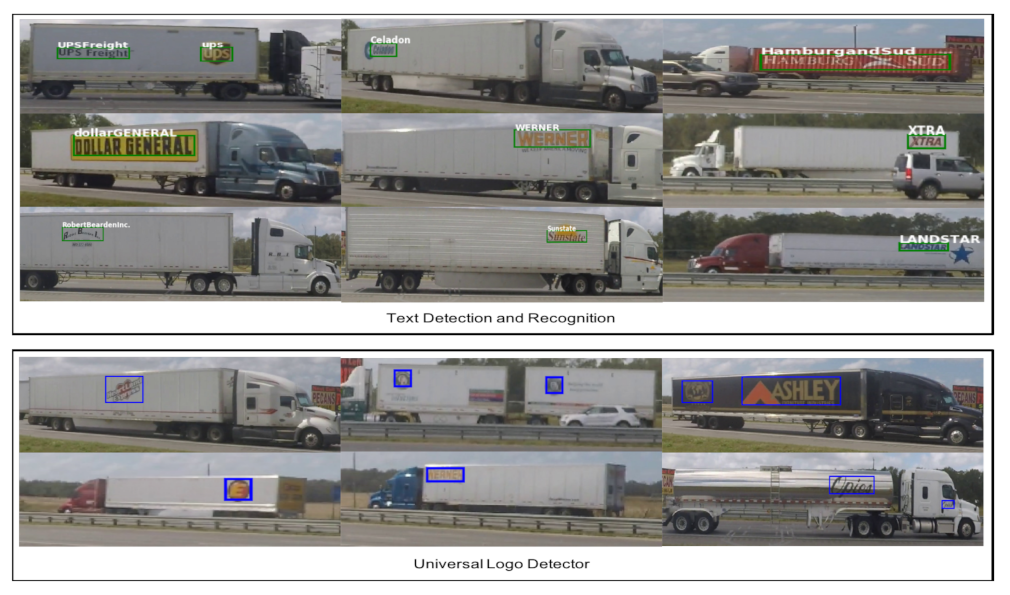
We have achieved a high recall and a competitive recognition accuracy following the developed algorithms. The figures below show sample outputs. Though the texts might not be perfectly predicted, e.g.,they might miss character prediction or wrongly recognize a few characters, this could be suitably fixed via the spelling correction methods that are publicly available, which we use to demonstrate in
Section 4 that this text-based logo solution is beneficial in improving the performance of the overall pipeline.
It is worth mentioning that text-based logo detection and recognition has its limitations when solving the commodity classification. For those logos not containing any text or being too complicated to be successfully identified as texts, the text-based solution is no longer suitable. Instead, we have to seek a fundamentally different approach based on the image content, which leads us to the image-based approach incorporating various advanced image representations for logo data described in the subsequent section.
3.2. Image-Based Logo Detection and Recognition
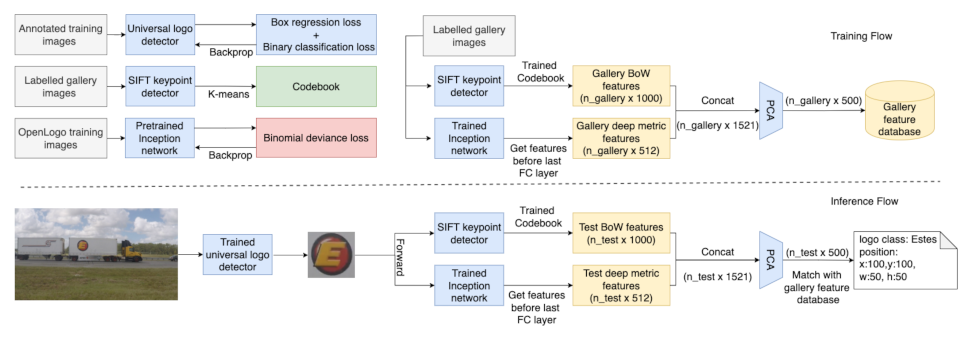
Our image-based logo approach is general and works for images (and complex-font texts) using the following image-based approach: (i) a universal logo detector and (ii) a feature-matching-based logo recognizer.
Figure 3 shows the training and inference pipeline of our staged approach.
3.2.1. Universal Logo Detector
State-of-the-art deep learning methods have been discussed in [
29] to train and evaluate object detectors on localizing and identifying logos in a closed set of classes. Logo detection is inherently a challenging task due to the presence of varying challenging factors in occlusions, uncontrolled illumination, and background clutter. Under these conditions, logo detectors tend to be susceptible to context changes. The authors presented a vivid example of a detector trained to localize a logo that only appears on shoes in all the training images. The detector fails to detect the same logo appearing on a coffee mug during the model inference.
In real traffic scenarios, we expect to encounter a large number of previously unseen logo classes. A logo detector trained with a fixed set of classes clearly cannot detect logos that are not in the fixed set. This requires retraining the logo detector and annotating more training data for new incoming logo classes, which makes it impractical because traffic agencies are interested in detecting all kinds of logo data to further identify the carried cargo within trucks. To overcome this limitation, a more promising direction is to develop a logo detector without fine-grained labeled training data for new logo classes. As shown in
Figure 3, we designed the universal logo detector to localize any potential logos in contrast to popular logo detectors that detect and identify a fixed set of logos. Our proposed model alleviates the problem of collecting and annotating new training logo data for any future logos to be detected.
One-stage universal logo detector. The training was based on a large number of data images with bounding box annotations of logos. The model is designed to learn an abstract representation of all kinds of logos in the training stage. Thus, it can work with arbitrary logo data in the inference stage. In particular, the model is trained in a class-agnostic way: all logo regions belong to one single category (the logo category). We consider other regions as the background category, thus creating a classifier in a binary fashion. By doing this, we intentionally remove specific logo class information and force the model to learn a generic representation of all logos. We refer to this model as the one-stage universal logo detector (one-stage ULD). We adapt the implementation of the popular Faster R-CNN [
30] with a VGG16 backbone [
31] for logo detection due to its simplicity and reasonably fast speed. The training follows the original papers [
30]. We did not explore other advanced backbones (e.g., ResNet [
32], DenseNet [
33]) and detection approaches (e.g., MaskRCNN [
34]) that could further improve the detection performance, as it is not the focus of our paper. We highlight the concept of universal logo detection for reporting the presence of any logo-like regions in this paper.
Coarse-to-fine universal logo detector. It is worth noting that logos on trucks (which are the vehicles of interest) usually appear on the truck bodies. To take advantage of this prior information, we further propose a coarse-to-fine universal logo detector by roughly estimating truck bounding boxes and conducting the universal logo detection only within each bounding box. The process takes raw images and determines the presence of truck objects within images by adopting the state-of-the-art detector called YOLO [
35]. This design significantly improved the localization precision as shown in the later experiment section. After we obtained logo locations, we cropped all logo regions from the image and forwarded them to the logo recognition model to infer the logo/brand classes. The bottom part of
Figure 4 shows sample outputs of our developed universal logo detector.
3.2.2. Reverse Image Search Logo Recognizer
In our preliminary experiments, we implemented a pipeline of logo detection and recognition using the developed universal logo detector and a commercial reverse image search. The reverse image search is a content-based image retrieval (CBIR) query approach [
36] in which we provide the system with a sample image (search query) to search for related concepts about this image. We utilized the popular Google “Search by Image”, which allows us to search for related images just by uploading an image or image URL. It analyzes the submitted picture by constructing a mathematical model, comparing it to a large number of images in Google databases, and returning similar images and their annotations. The obtained results from this pipeline are not satisfactory as it usually reports relatively random and noisy predictions. This pipeline is difficult to customize to the task of freight analysis.
3.2.3. Feature-Matching Logo Recognizer
In this approach, we treated logo recognition as an image retrieval problem with a few sample images for each class. We collected the gallery images from the Internet, which included roughly 30 images per logo class. The gallery images are used as the templates against which all logo predictions are matched. Two sets of features were extracted to represent logo images, namely deep metric features and the BoW (Bag of Visual Words) features. The deep metric features draw upon recent advances in deep metric learning and have the capability of extracting high-level discriminative semantic information for similarity measurements. The BoW features instead extract low-level image information such as textures, corners, and edges for logo matching. The BoW features are commonly used in image retrieval for research problems and industrial applications. After extracting these two types of image feature representations, we combined them to obtain the fused features.
Deep Metric Features. Inspired by [
14], we trained a DCNN (deep convolutional neural network) classifier on the QMUL-OpenLogo dataset and used the output features of the second-to-last layer as the feature representation for a given logo image. We did not train the classifier directly on the logo classes of interest, considering that new unseen logo classes might be added. Instead, we aim at projecting logo images into a feature space such that logos from different classes are separable. Therefore, we seek to increase the inter-class distances of logo features, bringing us to the popular deep metric learning (DML).
The core concept of DML is to find a good representation of images with a good metric for similarity measurement. To measure the similarity of two feature vectors, we simply choose to use the common cosine similarity because it is bounded and invariant to feature magnitude; its formula is shown as follows:
where
and
are the feature vectors extracted from image
i and
j using the DML model. If the score of cosine similarity is close to 1, it means these two feature vectors are likely to come from the same logo class, otherwise not. Formally, pairs are called positive pairs if they have the same label; otherwise, they are called negative pairs. To make logo features separable, we prefer a trained model that assigns higher similarity to positive pairs and lower similarity to negative pairs. We chose to use binomial deviance [
37] as the loss function with the formula:
where
and
denote the count of positive pairs and negative pairs related to
, respectively.
denotes the similarity of pair
.
,
, and
are hyperparameters, which are chosen based on the best heuristic setting of [
14]. The hyperparameters
and
were set to be 40 and 0, respectively. The hyperparameter
was set to be 0.5. The loss function lays more emphasis on hard samples where positive pairs get low scores or negative pairs get high scores, which enforces the model to find more discriminative features. The deep metric learning model was implemented in PyTorch. We used the Inception network [
38] as the backbone with a global pooling layer and a fully connected layer added on top of it. The network was trained in a pairwise way by gradient descent using the Adam optimizer [
39].
Bag-of-words Features. Deep learning models are good at extracting high-level semantic features, whereas, for logos, low-level features (such as textures, corners, and edges) can be useful for recognition. To incorporate low-level features, we make use of the bag-of-words (BoW) features, which are the most commonly used image representations in image retrieval literature [
40,
41]. In the training stage, local features were extracted using the scale-invariant feature transform (SIFT) descriptor [
42]. This resulted in a large number of features for each logo image. To further find a compact and fixed-length representation of each image, feature quantization is required. This was achieved by visual codebook learning, after which, each local feature can be assigned to a visual word in the codebook. In this way, an image could be discriminatively represented by a histogram of these visual words. The codebook was learned by clustering gallery local features using the k-means algorithm and regarding the centers of clusters as visual words. In the inference stage, local features were obtained by the same method following the training stage. For each feature, the nearest visual word in a trained codebook was found and assigned to the corresponding bin of histogram, which resulted in a fixed-length feature vector for each testing image.
Fused Features. Feature fusion has been proven to be effective when the classes of features to be fused are heterogeneous, which can result in better performance than the best single class of features. BoW features are essentially sparse histograms of low-level local features, and DML features are high-level semantic features with large receptive fields. Both of the extracted features are heterogeneous. Therefore, combining these two sets of features tends to give a better result, as they are complementary to each other. Following this intuition, we concatenated these two features and obtained 1,512-dimensional feature vectors. We then used principal component analysis (PCA) for dimensionality reduction [
43]. This resulted in 500-dimensional reduced feature vectors as the final representation. The experiment results demonstrated the effectiveness of our fusion approach.
3.3. Integrated Logo Model
The main advantage of the text-based approach is its robustness when the logo is mostly text. Though the model outputs incorrect or incomplete text predictions in some challenging traffic scenarios, it works well in most cases. The errors from the partially correct predictions can be corrected by finding the most similar company name using approximate string matching algorithms. This approach does not work when the logo consists essentially of non-text images.
The image-based approach has the potential to cover scenarios where the text information is not available on truck bodies or the text-based approach fails to detect any texts from trucks. Due to the high recall of the universal logo detector, we are likely to get a good subset from all potential logos. However, the accuracy of this approach may not be high as compared to a text-based approach when only logos that consist of text are present.
We now discuss potential approaches that combine both of these approaches. Let the set of detected bounding boxes from the text-based approach be denoted as , where denotes the number of detections from the text-based model. Each is associated with two confidence scores, namely the detection score (denoted as ), which measures how likely the detected region contains text, and the matching score (denoted as ), which measures the similarity between the detected text with the matched text in defined logo classes. Similarly, for the image-based approach, the set of detected bounding boxes is denoted as ; each is associated with one matching score (denoted as ), which measures the similarity between the detected region and the matched one in the collected logo gallery. There are two possible approaches for integrating these models:
Text-focused Approach: If both text-based and image-based models detect a logo in the same location, (i.e., ), we rely on the label from text-based model;
Combined Approach: We train a decision tree classifier with four output classes indicating whether to use the text-based model’s result, the image-based model’s result, neither or both (corresponding to 1, 2, 0, and 3). Ambiguity arises at the testing time when the image-based and text-based models give different predicted labels, while the classifier outputs 3. We resolve the issue by preferring the text-based model’s result in this case.
The later experimental evaluation shows that the first integration approach performs slightly better on our collected testing dataset. This is potentially because it consists of more text-based logos. The second approach has a better generalization ability since it can automatically learn the parameters that can combine the outputs of the two approaches. It can also be modified accordingly to adapt to a dataset with different text versus non-text distributions. A user can choose either one of the two approaches, based on the characteristics of the target dataset.
3.4. Commodity Classification with Logo Data
The linkage between logo recognition and the commodity classification is provided by a commodity database we built. We utilized the North American Industry Classification System (NAICS), a standard that classifies business establishments with the aim of collecting and analyzing business-related statistical data. It is a comprehensive and well-structured system that classifies economic activities hierarchically into levels of groups, such as sectors, subsectors, and industry groups.
We built our commodity database by searching the NAICS code for each logo class and stored its corresponding commodity description. Samples of NAICS code and commodity description correspondences are shown in
Table 1. With the database, the results from our logo detection and recognition pipeline are linked to their commodity description. This process completes our commodity classification solution. To the best of our knowledge, the proposed pipeline is the first attempt in this direction.
5. Summary and Conclusions
A vision-based freight classification approach has been proposed in the present paper. Our proposed solution consisting of text-based and image-based branches is able to capture most existing logos. Both our text-based and image-based solutions are general and can easily be extended to new logo classes. Our text-based approach using advanced scene-text solutions produces highly accurate predictions when the logo is mostly text. To extend it to new logo classes, only the text strings of the logos are needed. Our image-based approach serves as a complement and deals with logos with little or no text. It first detects all potential logos, and then performs feature matching with samples of different logo classes. For potential new logo classes, only around 30 samples need to be collected per class. Furthermore, we have developed a new freight classification benchmark based on logo data. To our best knowledge, ours is the first dataset collected to evaluate freight classification based on logo data. It can be useful in providing traffic engineers and researchers with a dataset to systematically evaluate their developed freight classification models.
We showed through experiments that our overall accuracy of 80% for 26 chosen logos is very promising. However, the logos we found from recorded highway videos (from the state of Florida) are not exhaustive, and the current study is limited by the size of the collected dataset. To further improve the accuracy and make our approach feasible in automatic commodity classification applications, we state that collective effort is needed to build a comprehensive on-truck logo database, a logo-to-commodity database, as well as popularization of commodity logos printed on trucks.


