Analysis of Trends in Mega-Sized Container Ships Using the K-Means Clustering Algorithm
Abstract
1. Introduction
2. Materials and Methods
2.1. Target Data
2.2. Data Preprocessing
2.3. Analysis Method and Coverage Rate Concept
2.4. K-Means Clustering
| Index by NbClust Package | Reference |
|---|---|
| KL | Krzanowski and Lai [33] |
| CH | Calinski and Harabasz [34] |
| Hartigan | Hartigan [35] |
| CCC | Sarle [36] |
| Scott | Scott and Symons [37] |
| Marriot | Marriot [38] |
| TrCovW | Milligan and Cooper [39] |
| TraceW | Milligan and Cooper [39] |
| Friedman | Friedman and Rubin [40] |
| Rubin | Friedman and Rubin [40] |
| C Index | Hubert and Levin [41] |
| DB | Davies and Bouldin [42] |
| Silhouette | Rousseeuw [43] |
| Duda | Duda et al. [44] |
| PseudoT2 | Duda et al. [44] |
| Beale | Beale [45] |
| Ratkowsky | Ratkowsky and Lance [46] |
| Ball | Ball and Hall [47] |
| PtBiserial | Milligan [48,49]; Kraemer [50] |
| Frey | Frey and Van Groenewoud [51] |
| McClain | McClain and Rao [52] |
| Dunn | Dunn [53] |
| Hubert 1 | Hubert and Arabie [54] |
| SD index | Halkidi et al. [55] |
| D index 1 | Lebart et al. [56] |
| SDbw | Halkidi and Vazirgiannis [57] |


3. Results
3.1. Result of K-Means Clustering
3.2. Design Criteria of Container Ships
3.3. Comparison with Previous Study
3.4. Prediction of Rrends for Mega-Sized Container Ship
4. Discussion
5. Conclusions
Author Contributions
Funding
Institutional Review Board Statement
Informed Consent Statement
Data Availability Statement
Conflicts of Interest
References
- MOF (Ministry of Oceans and Fisheries of Korea) Korea. 2030 Port Policy Direction and Implementation Strategy. Available online: https://www.mof.go.kr/jfile/readDownloadFile.do?fileId=MOF_ARTICLE_36220&fileSeq=1 (accessed on 23 November 2021).
- Korea Maritime Institute. The Report on Technology Development of Smart Green Container Terminal; Ministry of Land Transport and Maritime: Seoul, Korea, 2012; pp. 1–343.
- Cho, S.W.; Won, S.H.; Lee, J.H. The Evolution of Container Vessel Sizes and its Impact on the Vessel Specifications. JSL 2015, 31, 507–528. [Google Scholar] [CrossRef]
- Park, N.K.; Suh, S.C. Tendency toward Mega Containerships and the Constraints of Container Terminals. J. Mar. Sci. Eng. 2019, 7, 131. [Google Scholar] [CrossRef]
- Sánchez, R.J.; Perrotti, D.E.; Gomez Paz Fort, A. Looking into the future ten years later: Big full containerships and their arrival to south American ports. J. Shipp. Trade 2021, 6, 2. [Google Scholar] [CrossRef]
- Prokopowicz, A.K.; Berg-Andreassen, J. An evaluation of current trends in container shipping industry, very large container ships (VLCSs), and port capacities to accommodate TTIP increased trade. Transp. Res. Procedia 2016, 14, 2910–2919. [Google Scholar] [CrossRef]
- KR (Korean Register of Shipping). Specification of HMM ALGECIRAS. Available online: http://www.krs.co.kr/eng/ship_as_address/regist_read.aspx?s_code=0103040500&ClassNo=2000023 (accessed on 23 November 2021).
- MOF. Harbour and Fishery Design Criteria; Ministry of Oceans and Fisheries of Korea: Sejong, Korea, 2020.
- Takahashi, H.; Goto, A.; Abe, M. Study on Standards for Main Dimensions of the Design Ship; Technical Note of National Institute for Land and Infrastructure Management Ministry of Land; Infrastructure and Transport, No. 309; NILIM: Tsukuba, Japan, 2006; pp. 1–97.
- Katayama, T.; Furuhata, K.; Moto, K.; Hayafuji, H. Study on the Interrelations among the Several Dimensions of Ships; Technical Note of Port and Harbour Research Institute, No. 101; Port and Harbour Research Institute: Yokosuka, Japan, 1970; pp. 1–130.
- Terauchi, K.; Yoshida, Y. Analysis on the Interrelations among the Several Dimensions of Ships; Technical Note of Port and Harbour Research Institute, No. 348; Port and Harbour Research Institute: Yokosuka, Japan, 1980; pp. 1–115.
- Ajiki, K.; Negi, T.; Murata, T. Statistical Analysis on Staple Dimension of Ship; Technical Note of Port and Harbour Research Institute; No. 652; Port and Harbour Research Institute: Yokosuka, Japan, 1989; pp. 1–43.
- Akakura, Y.; Takahashi, H.; Nakamoto, T. Statistical Analysis of Ship Dimensions for Standard Size of Design Ship; Technical Note of Port and Harbour Research Institute, No. 910; Port and Harbour Research Institute: Yokosuka, Japan, 1998; pp. 1–23.
- Inoue, G.; Akakura, Y. Study on Ship Dimensions by Statistical Analysis; Technical Note of National Institute for Land and Infrastructure Management Ministry of Land; Infrastructure and Transport, No. 600; NILIM: Tsukuba, Japan, 2010; pp. 1–97.
- Iwasaki, K.; Yamagata, S. Study on Ship Dimensions by Statistical Analysis; Technical Note of National Institute for Land and Infrastructure Management Ministry of Land; Infrastructure and Transport, No. 991; NILIM: Tsukuba, Japan, 2017; pp. 1–152.
- MLIT. Technical Standards and Commentaries for Port and Harbour Facilities in Japan; National Institute for Land and Infrastructure Management: Tsukuba, Japan, 2020.
- Del Estado, P. Recommendations for the Design of the Maritime Configuration of Ports, Approach Channels and Harbor Basins; Ministerio de Fomento: Madrid, Spain, 2007.
- PIANC (The World Association for Waterborne Transport Infrastructure). MarCom Working Group 121: Harbour Approach Channels Design Guidelines; PIANC: Brussels, Belgium, 2014. [Google Scholar]
- PIANC (The World Association for Waterborne Transport Infrastructure). MarCom Working Group 184: Design Principles for Dry Bulk Marine Terminals; PIANC: Brussels, Belgium, 2019. [Google Scholar]
- García, S.; Luengo, J.; Herrera, F. Data Preprocessing in Data Mining (Vol. 72), 1st ed.; Springer International Publishing: Cham, Switzerland, 2015; pp. 1–320. [Google Scholar]
- Mirović, M.; Miličević, M.; Obradović, I. Big data in the maritime industry. Nase More 2018, 65, 56–62. [Google Scholar] [CrossRef]
- Lee, H.T. Analysis of Factors Influencing Berthing Velocity of Ship using Machine Learning Prediction Algorithm. Master’s Thesis, Korea Maritime and Ocean University, Busan, Korea, 2019. [Google Scholar]
- Son, W.J.; Lee, J.S.; Lee, H.T.; Cho, I.S. An investigation of the ship safety distance for bridges across waterways based on traffic distribution. J. Mar. Sci. Eng. 2020, 8, 331. [Google Scholar] [CrossRef]
- Lee, H.T.; Lee, J.S.; Yang, H.; Cho, I.S.; An, A.I.S. An AIS Data-driven approach to analyze the pattern of ship trajectories in ports using the DBSCAN algorithm. Appl. Sci. 2021, 11, 799. [Google Scholar] [CrossRef]
- Lee, J.S.; Son, W.J.; Lee, H.T.; Cho, I.S. Verification of Novel Maritime Route Extraction using Kernel Density Estimation Analysis with Automatic Identification System Data. J. Mar. Sci. Eng. 2020, 8, 375. [Google Scholar] [CrossRef]
- Lee, H.T.; Lee, S.W.; Cho, J.W.; Cho, I.S. Analysis of Feature Importance of Ship’s Berthing Velocity Using Classification Algorithms of Machine Learning. J. Korean Soc. Mar. Environ. Saf. 2020, 26, 139–148. [Google Scholar] [CrossRef]
- UNCTAD (United Nations Conference on Trade and Development). Review of Maritime Transport; United Nations: Geneva, Switzerland, 2021. [Google Scholar]
- Wang, G.C.S.; Jain, C.L. Regression Analysis: Modeling & Forecasting; Graceway Publishing Company: New York, NY, USA, 2003; pp. 1–293. [Google Scholar]
- Huang, Z. Extensions to the k-means algorithm for clustering large data sets with categorical values. Data Min. Knowl. Discov. 1998, 2, 283–304. [Google Scholar] [CrossRef]
- Lee, H.T.; Lee, J.S.; Cho, J.W.; Yang, H.; Cho, I.S. A Study on the Pattern of Pilot’s Maneuvering using K-means Clustering of Ship’s Berthing Velocity. J. CDP 2020, 7, 221–232. [Google Scholar] [CrossRef]
- Hastie, T.; Tibshirani, R.; Friedman, J. The Elements of Statistical Learning: Data Mining, Inference, and Prediction, 2nd ed.; Springer: Berlin/Heidelberg, Germany, 2009; p. 509. [Google Scholar]
- Charrad, M.; Ghazzali, N.; Boiteau, V.; Niknafs, A. NbClust: An R package for determining the relevant number of clusters in a data set. J. Stat. Softw. 2014, 61, 1–36. [Google Scholar] [CrossRef]
- Krzanowski, W.J.; Lai, Y.T. A Criterion for Determining the Number of Groups in a Data Set Using Sum-of-Squares Clustering. Biometrics 1988, 44, 23–34. [Google Scholar] [CrossRef]
- Calinski, T.; Harabasz, J. A Dendrite Method for Cluster Analysis. Commun. Stat.-Theory Methods 1974, 3, 1–27. [Google Scholar] [CrossRef]
- Hartigan, J.A. Clustering Algorithms; John Wiley & Sons, Inc.: New York, NY, USA, 1975; pp. 1–351. [Google Scholar]
- Sarle, W.S. SAS Technical Report A-108, Cubic Clustering Criterion; SAS Institute Inc.: Cary, NC, USA, 1983; pp. 1–51. [Google Scholar]
- Scott, A.J.; Symons, M.J. Clustering Methods Based on Likelihood Ratio Criteria. Biometrics 1971, 27, 387–397. [Google Scholar] [CrossRef]
- Marriot, F.H.C. Practical Problems in a Method of Cluster Analysis. Biometrics 1971, 27, 501–514. [Google Scholar] [CrossRef]
- Milligan, G.W.; Cooper, M.C. An Examination of Procedures for Determining the Number of Clusters in a Data Set. Psychometrika 1985, 50, 159–179. [Google Scholar] [CrossRef]
- Friedman, H.P.; Rubin, J. On Some Invariant Criteria for Grouping Data. J. Am. Stat. Assoc. 1967, 62, 1159–1178. [Google Scholar] [CrossRef]
- Hubert, L.J.; Levin, J.R. A General Statistical Framework for Assessing Categorical Clustering in Free Recall. Psychol. Bull. 1976, 83, 1072–1080. [Google Scholar] [CrossRef]
- Davies, D.L.; Bouldin, D.W. A Cluster Separation Measure. IEEE PAMI 1979, 1, 224–227. [Google Scholar] [CrossRef]
- Rousseeuw, P.J. Silhouettes: A Graphical Aid to the Interpretation and Validation of Cluster Analysis. J. Comput. Appl. Math. 1987, 20, 53–65. [Google Scholar] [CrossRef]
- Duda, R.O.; Hart, P.E.; Stork, D.G. Pattern Classification and Scene Analysis, 2nd ed.; John Wiley & Sons, Inc.: New York, NY, USA, 1995; pp. 1–69. [Google Scholar]
- Beale, E.M.L. Cluster Analysis; Scientific Control Systems Ltd.: London, UK, 1969. [Google Scholar]
- Ratkowsky, D.A.; Lance, G.N. A Criterion for Determining the Number of Groups in a Classification. Aust. Comput. J. 1978, 10, 115–117. Available online: http://hdl.handle.net/102.100.100/300266?index=1 (accessed on 21 November 2021).
- Ball, G.H.; Hall, D.J. ISODATA: A Novel Method of Data Analysis and Pattern Classification; Stanford Research Institute: Menlo Park, CA, USA, 1965; pp. 1–61. [Google Scholar]
- Milligan, G.W. An Examination of the Effect of Six Types of Error Perturbation on Fifteen Clustering Algorithms. Psychometrika 1980, 45, 325–342. [Google Scholar] [CrossRef]
- Milligan, G.W. A Monte Carlo Study of Thirty Internal Criterion Measures for Cluster Analysis. Psychometrika 1981, 46, 187–199. [Google Scholar] [CrossRef]
- Kraemer, H.C. Biserial Correlation; John Wiley & Sons, Inc.: New York, NY, USA, 2006; pp. 276–279. [Google Scholar]
- Frey, T.; Van Groenewoud, H. A Cluster Analysis of the D2 Matrix of White Spruce Stands in Saskatchewan Based on the Maximum-Minimum Principle. J. Ecol. 1972, 60, 873–886. [Google Scholar] [CrossRef]
- McClain, J.O.; Rao, V.R. CLUSTISZ: A Program to Test for The Quality of Clustering of a Set of Objects. J. Mark. Res. 1975, 12, 456–460. Available online: https://www.jstor.org/stable/3151097 (accessed on 2 December 2021).
- Dunn, J. Well Separated Clusters and Optimal Fuzzy Partitions. J. Cybern. 1974, 4, 95–104. [Google Scholar] [CrossRef]
- Hubert, L.J.; Arabie, P. Comparing Partitions. J. Classif. 1985, 2, 193–218. [Google Scholar] [CrossRef]
- Halkidi, M.; Vazirgiannis, M.; Batistakis, I. Quality Scheme Assessment in the Clustering Process. In Principles of Data Mining and Knowledge Discovery, Proceedings of the 4th European Conference, Lyon, France, 13–16 September 2000; Lecture Notes in Computer Science; Springer: Berlin/Heidelberg, Germany; Volume 1910, pp. 265–276.
- Lebart, L.; Morineau, A.; Piron, M. Statistique Exploratoire Multidimensionnelle; Dunod: Paris, France, 1995; pp. 1–439. [Google Scholar]
- Halkidi, M.; Vazirgiannis, M. Clustering Validity Assessment: Finding the Optimal Partitioning of a Data Set. In Proceedings of the 2001 IEEE International Conference on Data Mining, San Jose, CA, USA, 29 November–2 December 2001; pp. 187–194. [Google Scholar]
- Lee, Y.S.; Ahn, Y.J. A Study on the Standard Ship’s Length of Domestic Trade Port. J. Korean Soc. Mar. Environ. Saf. 2013, 19, 164–170. [Google Scholar] [CrossRef][Green Version]


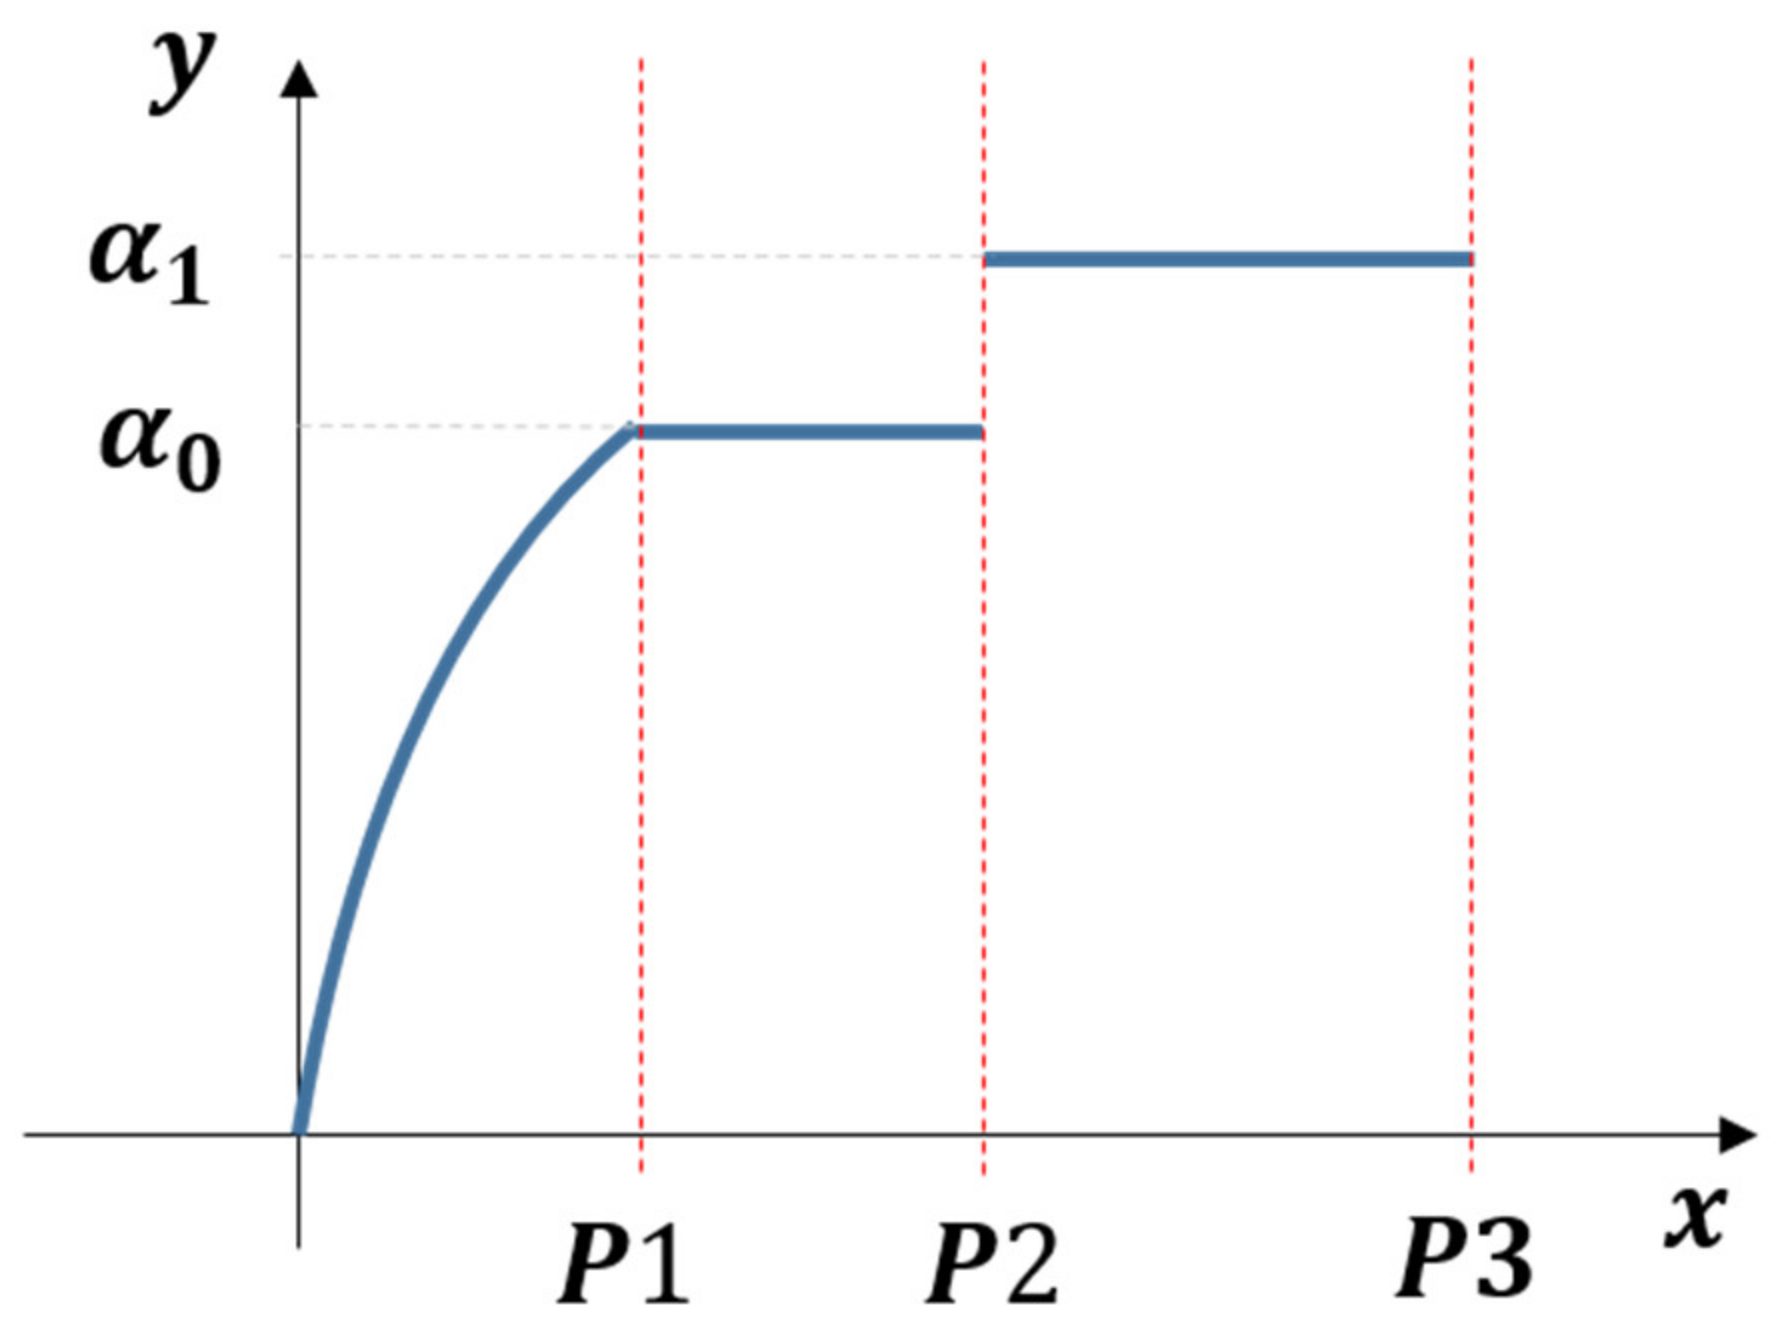
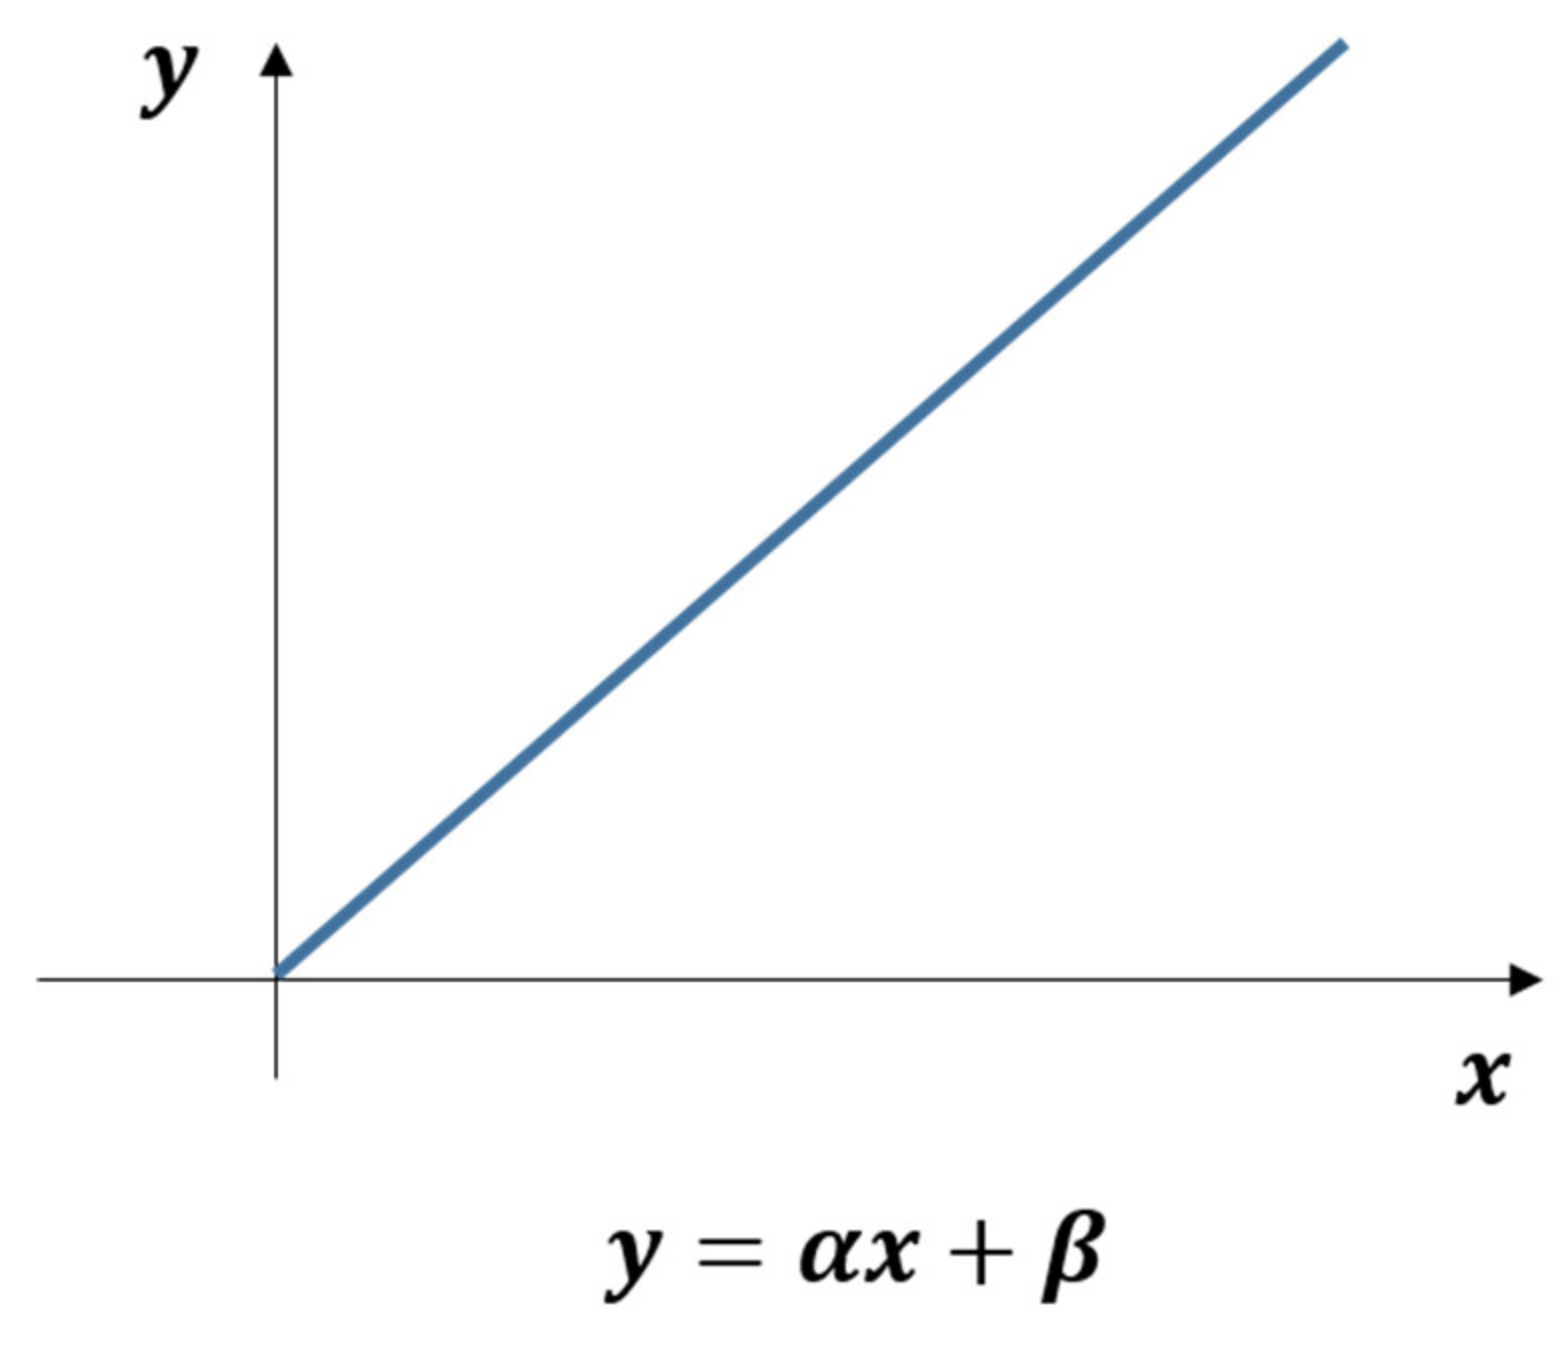
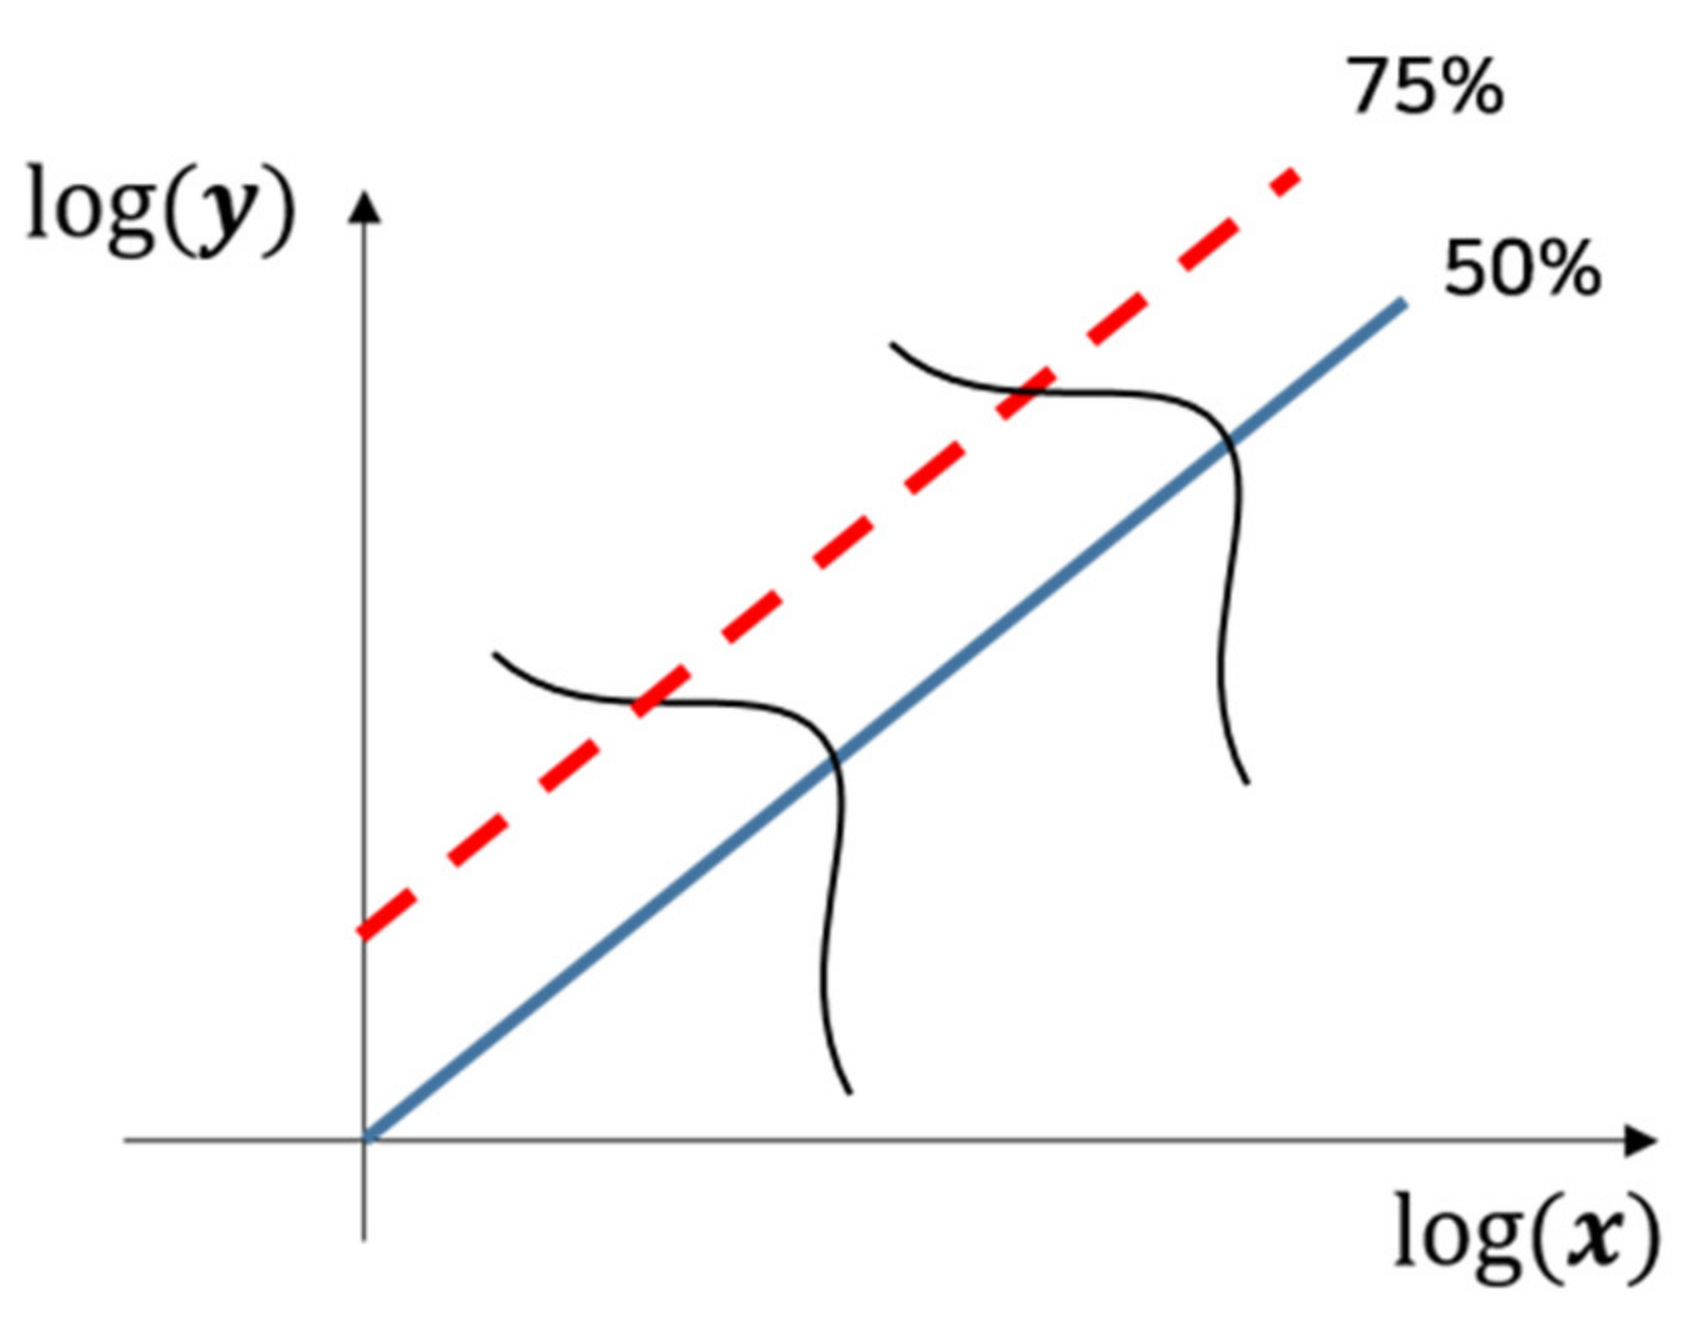
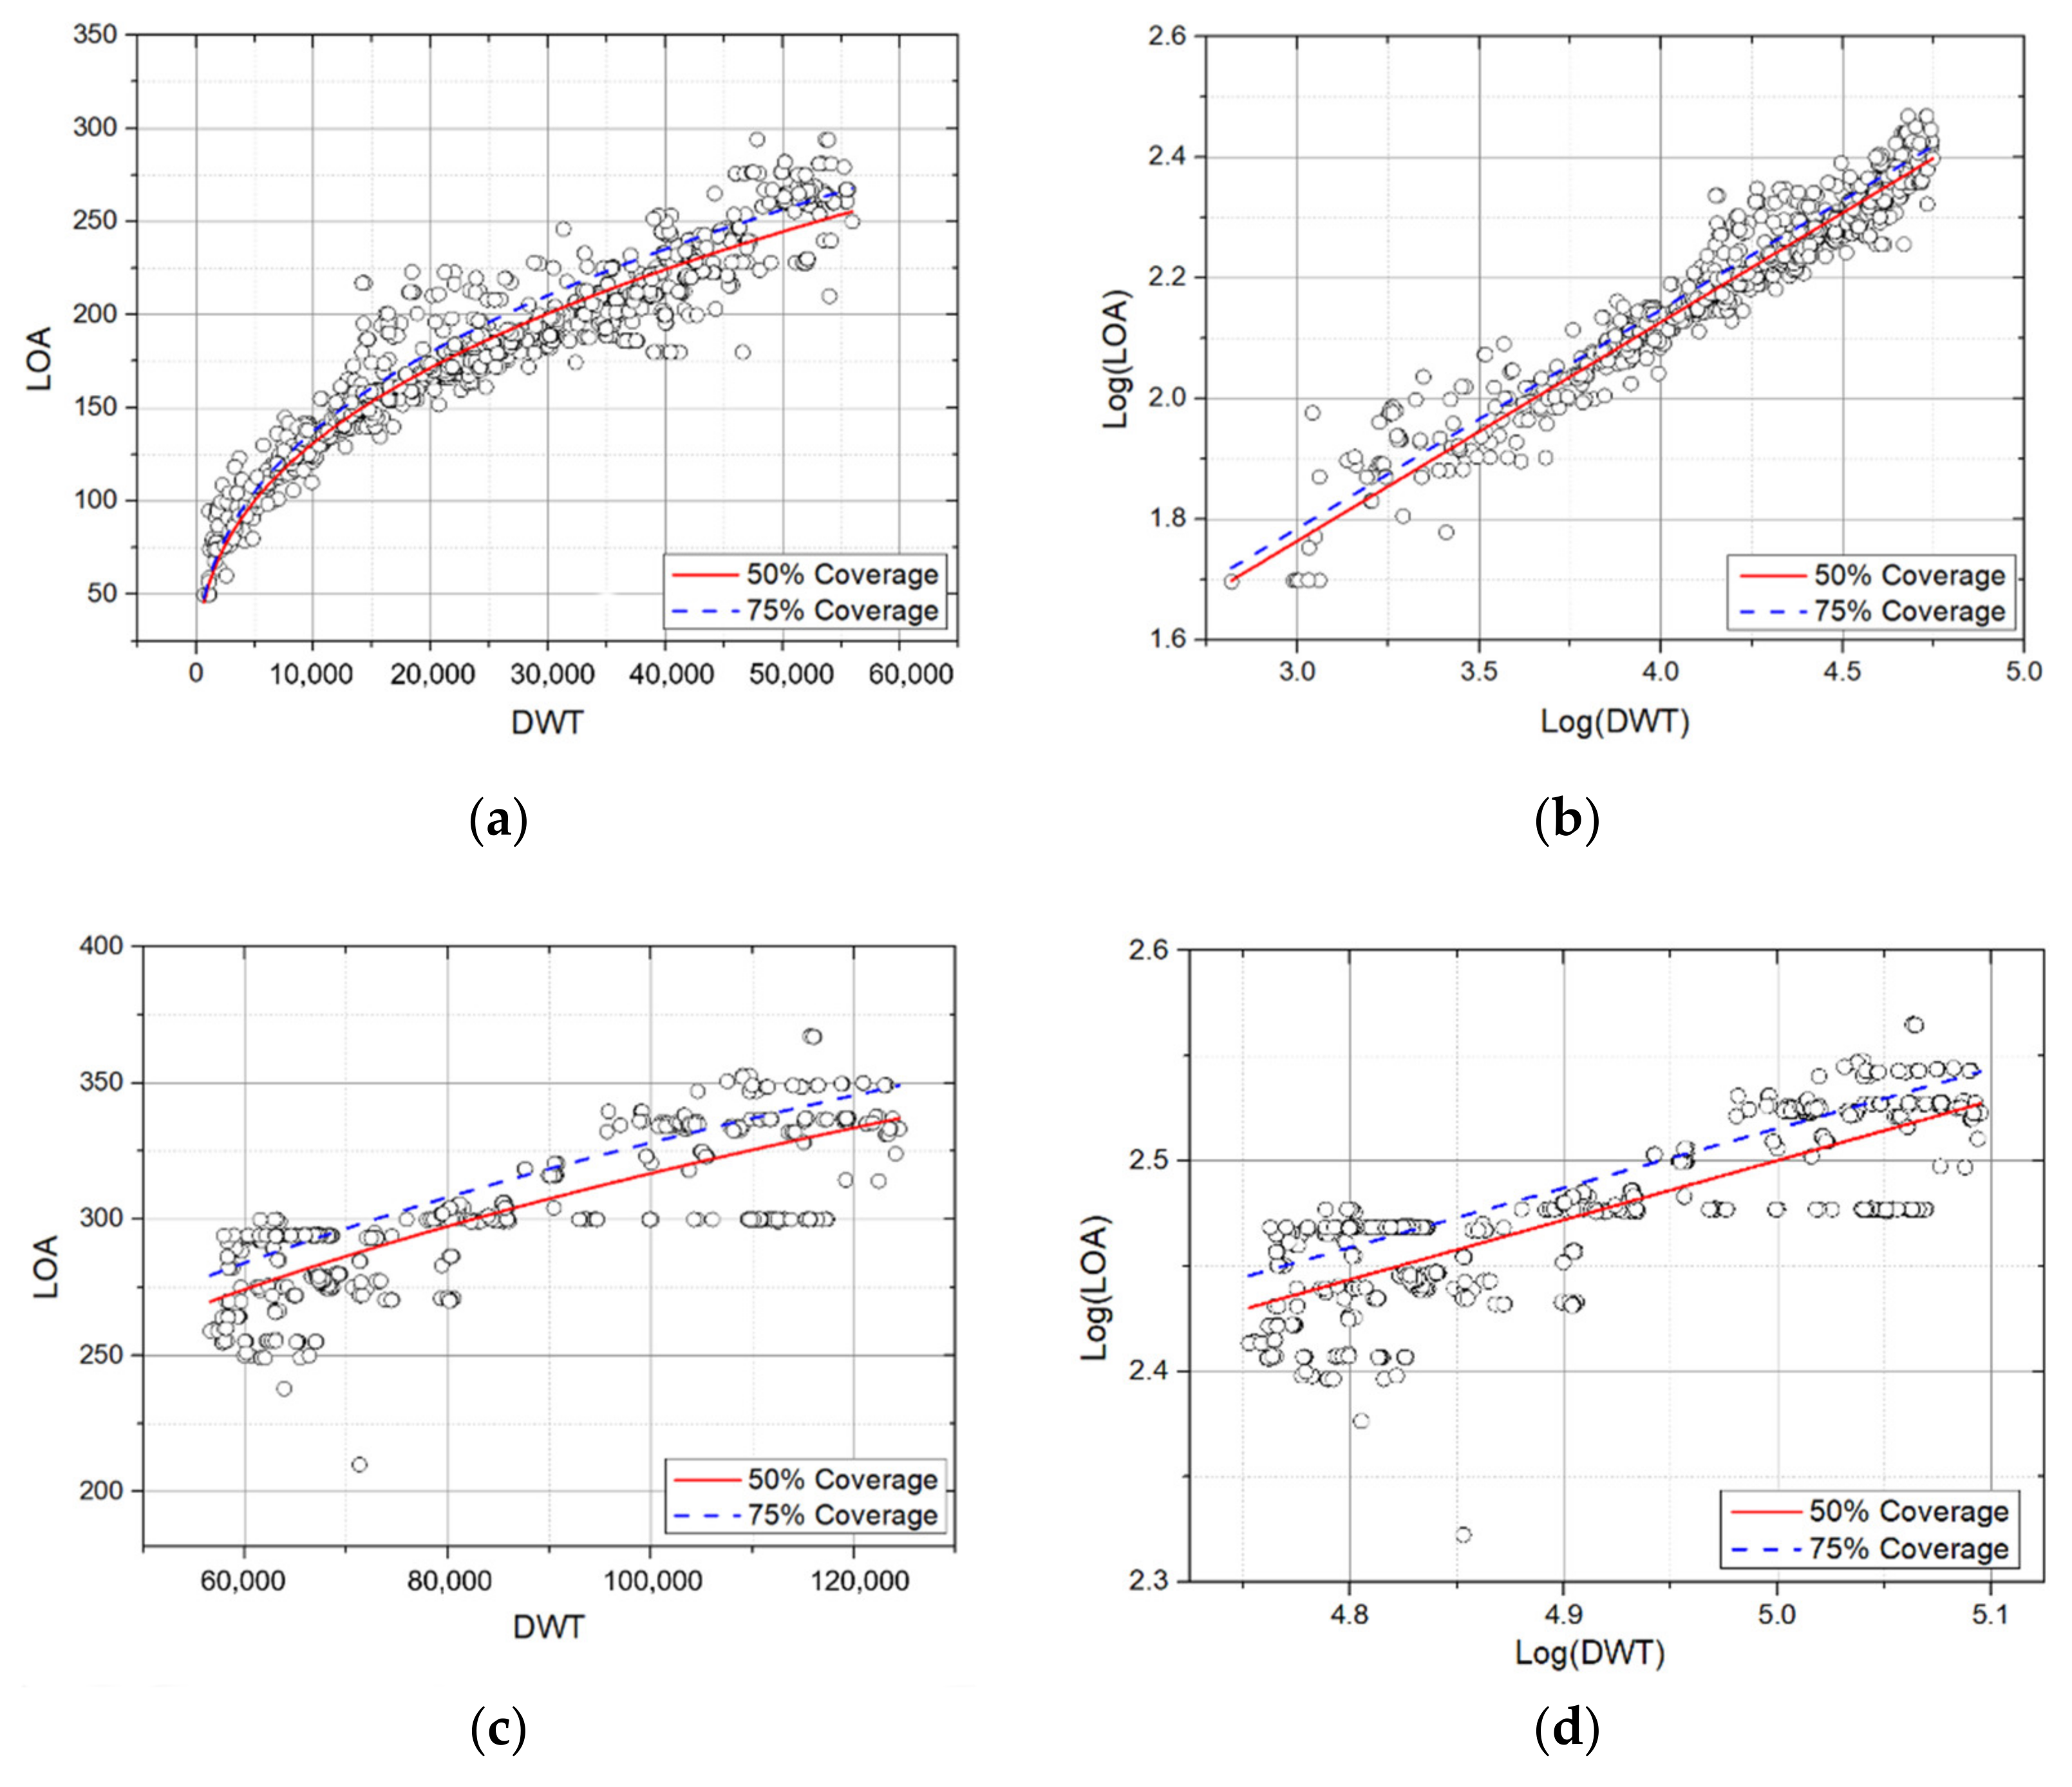

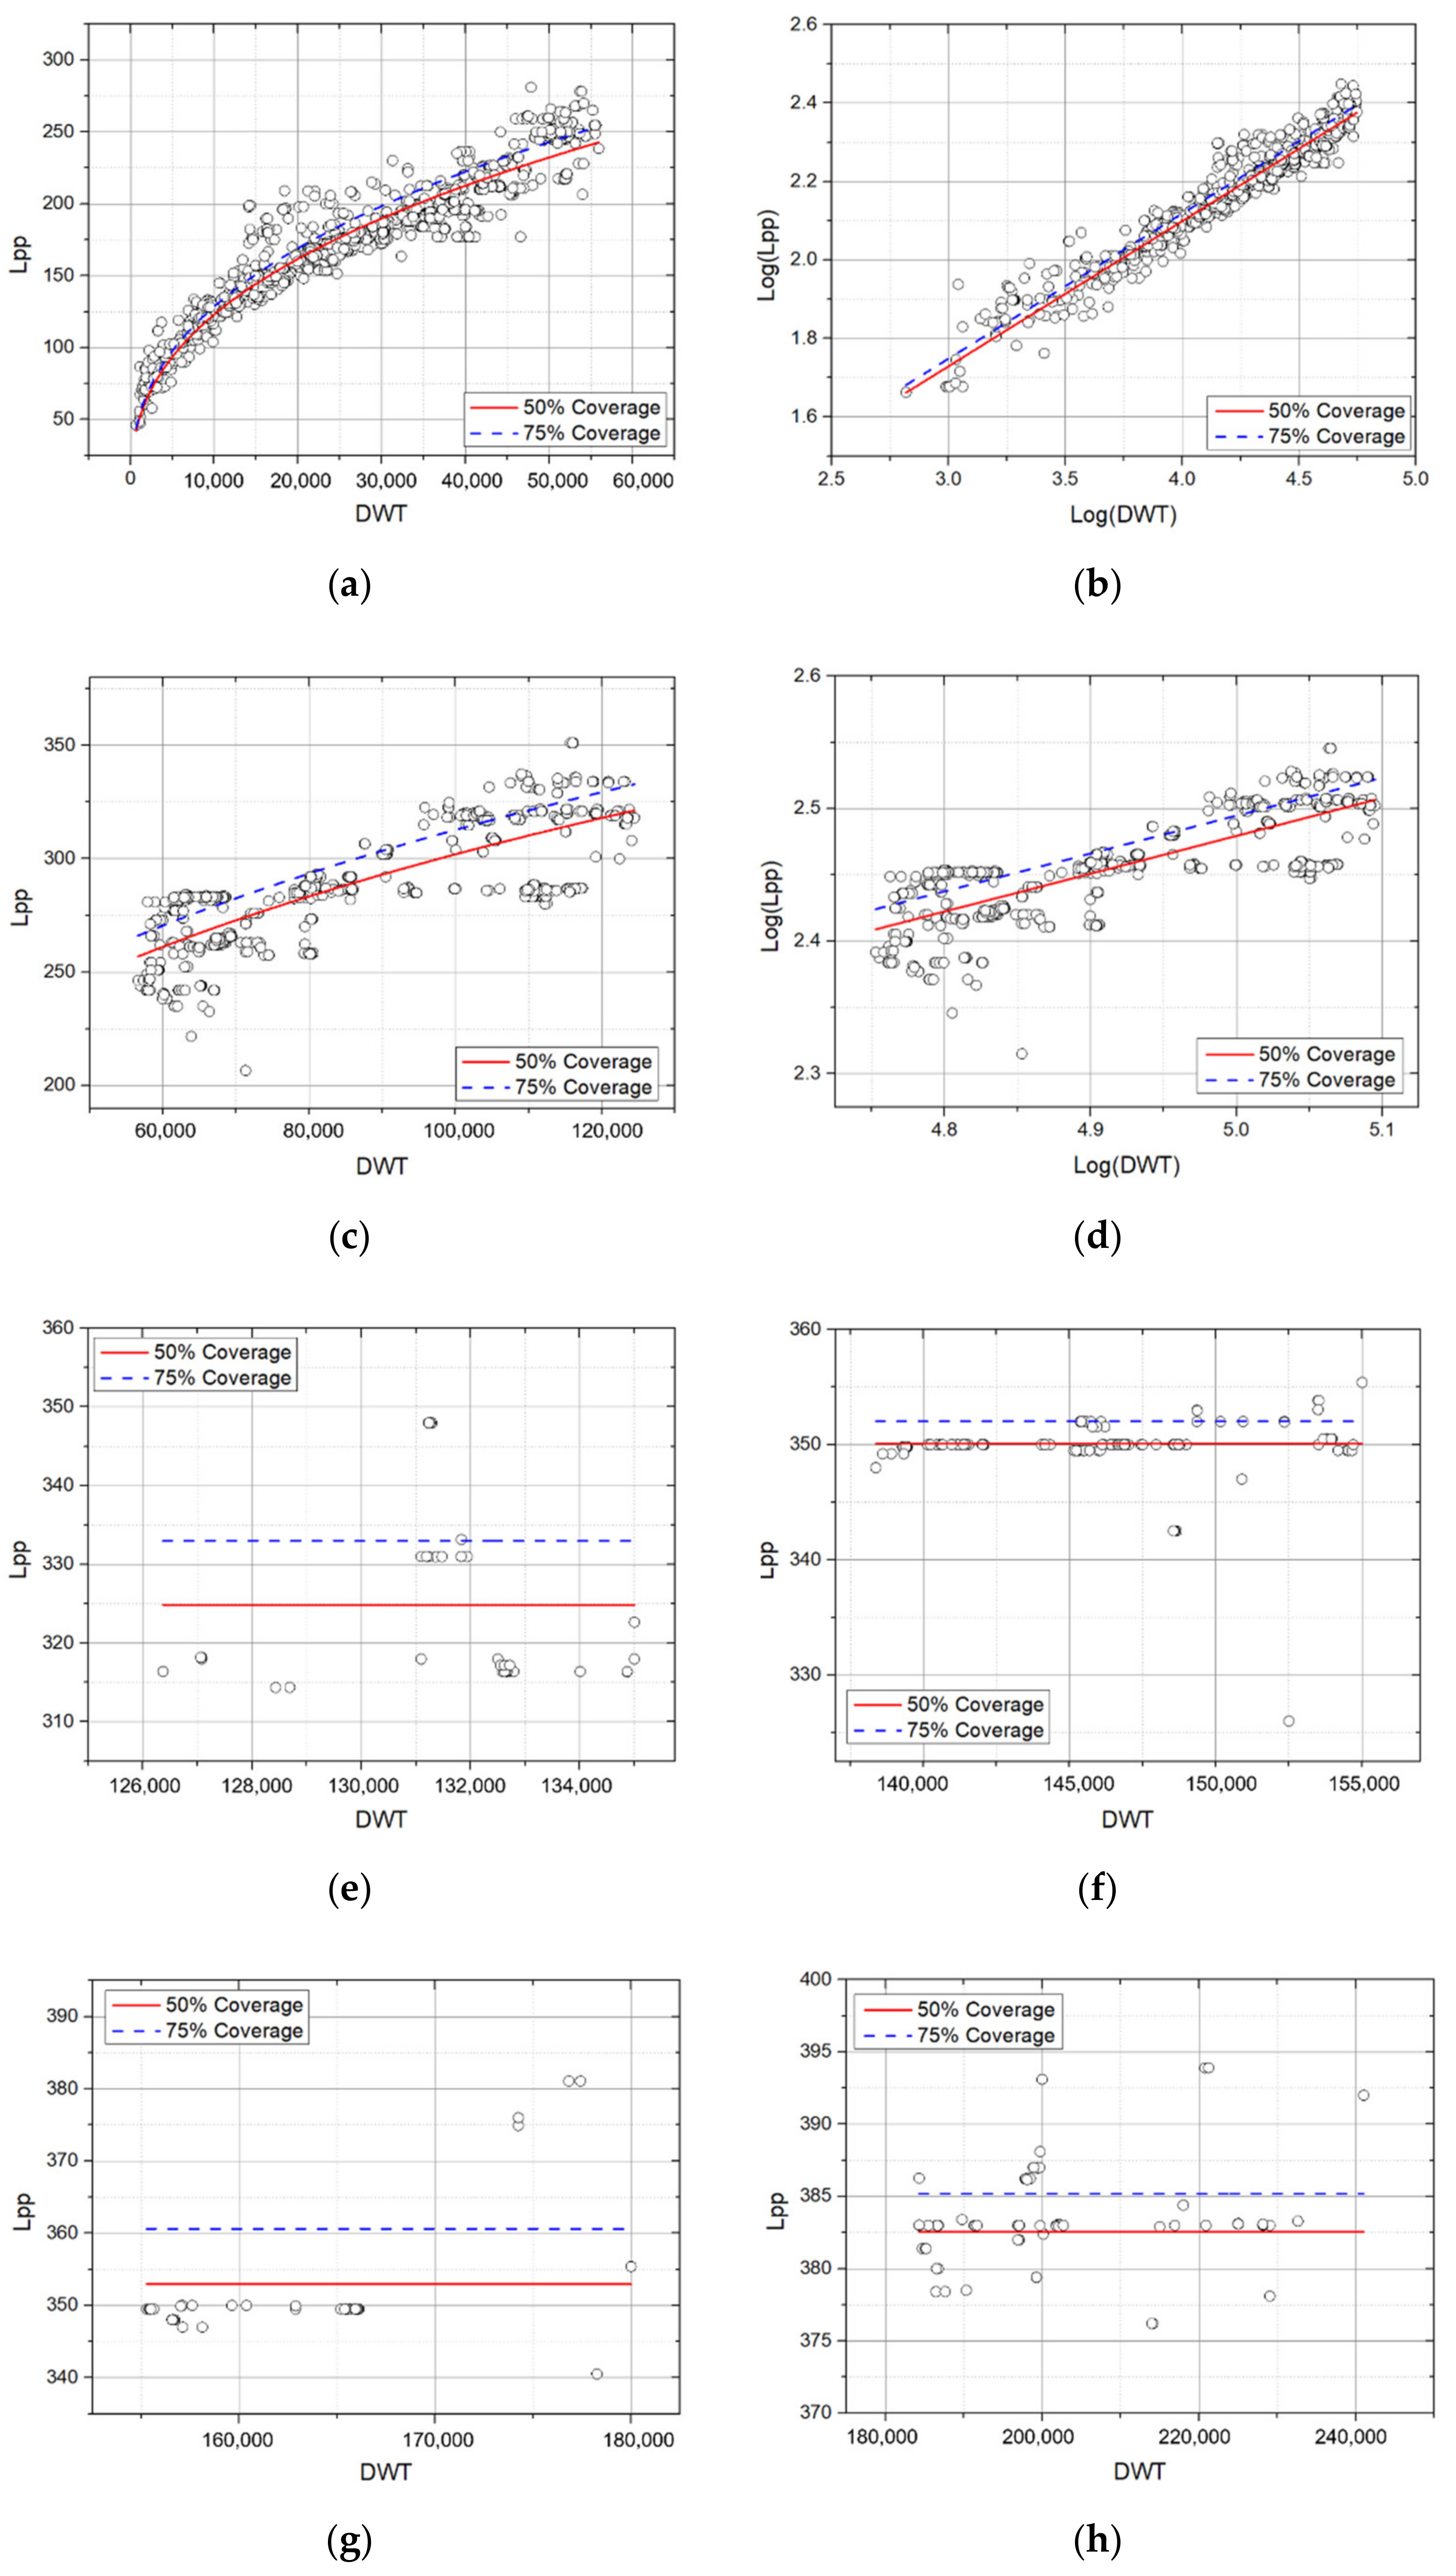

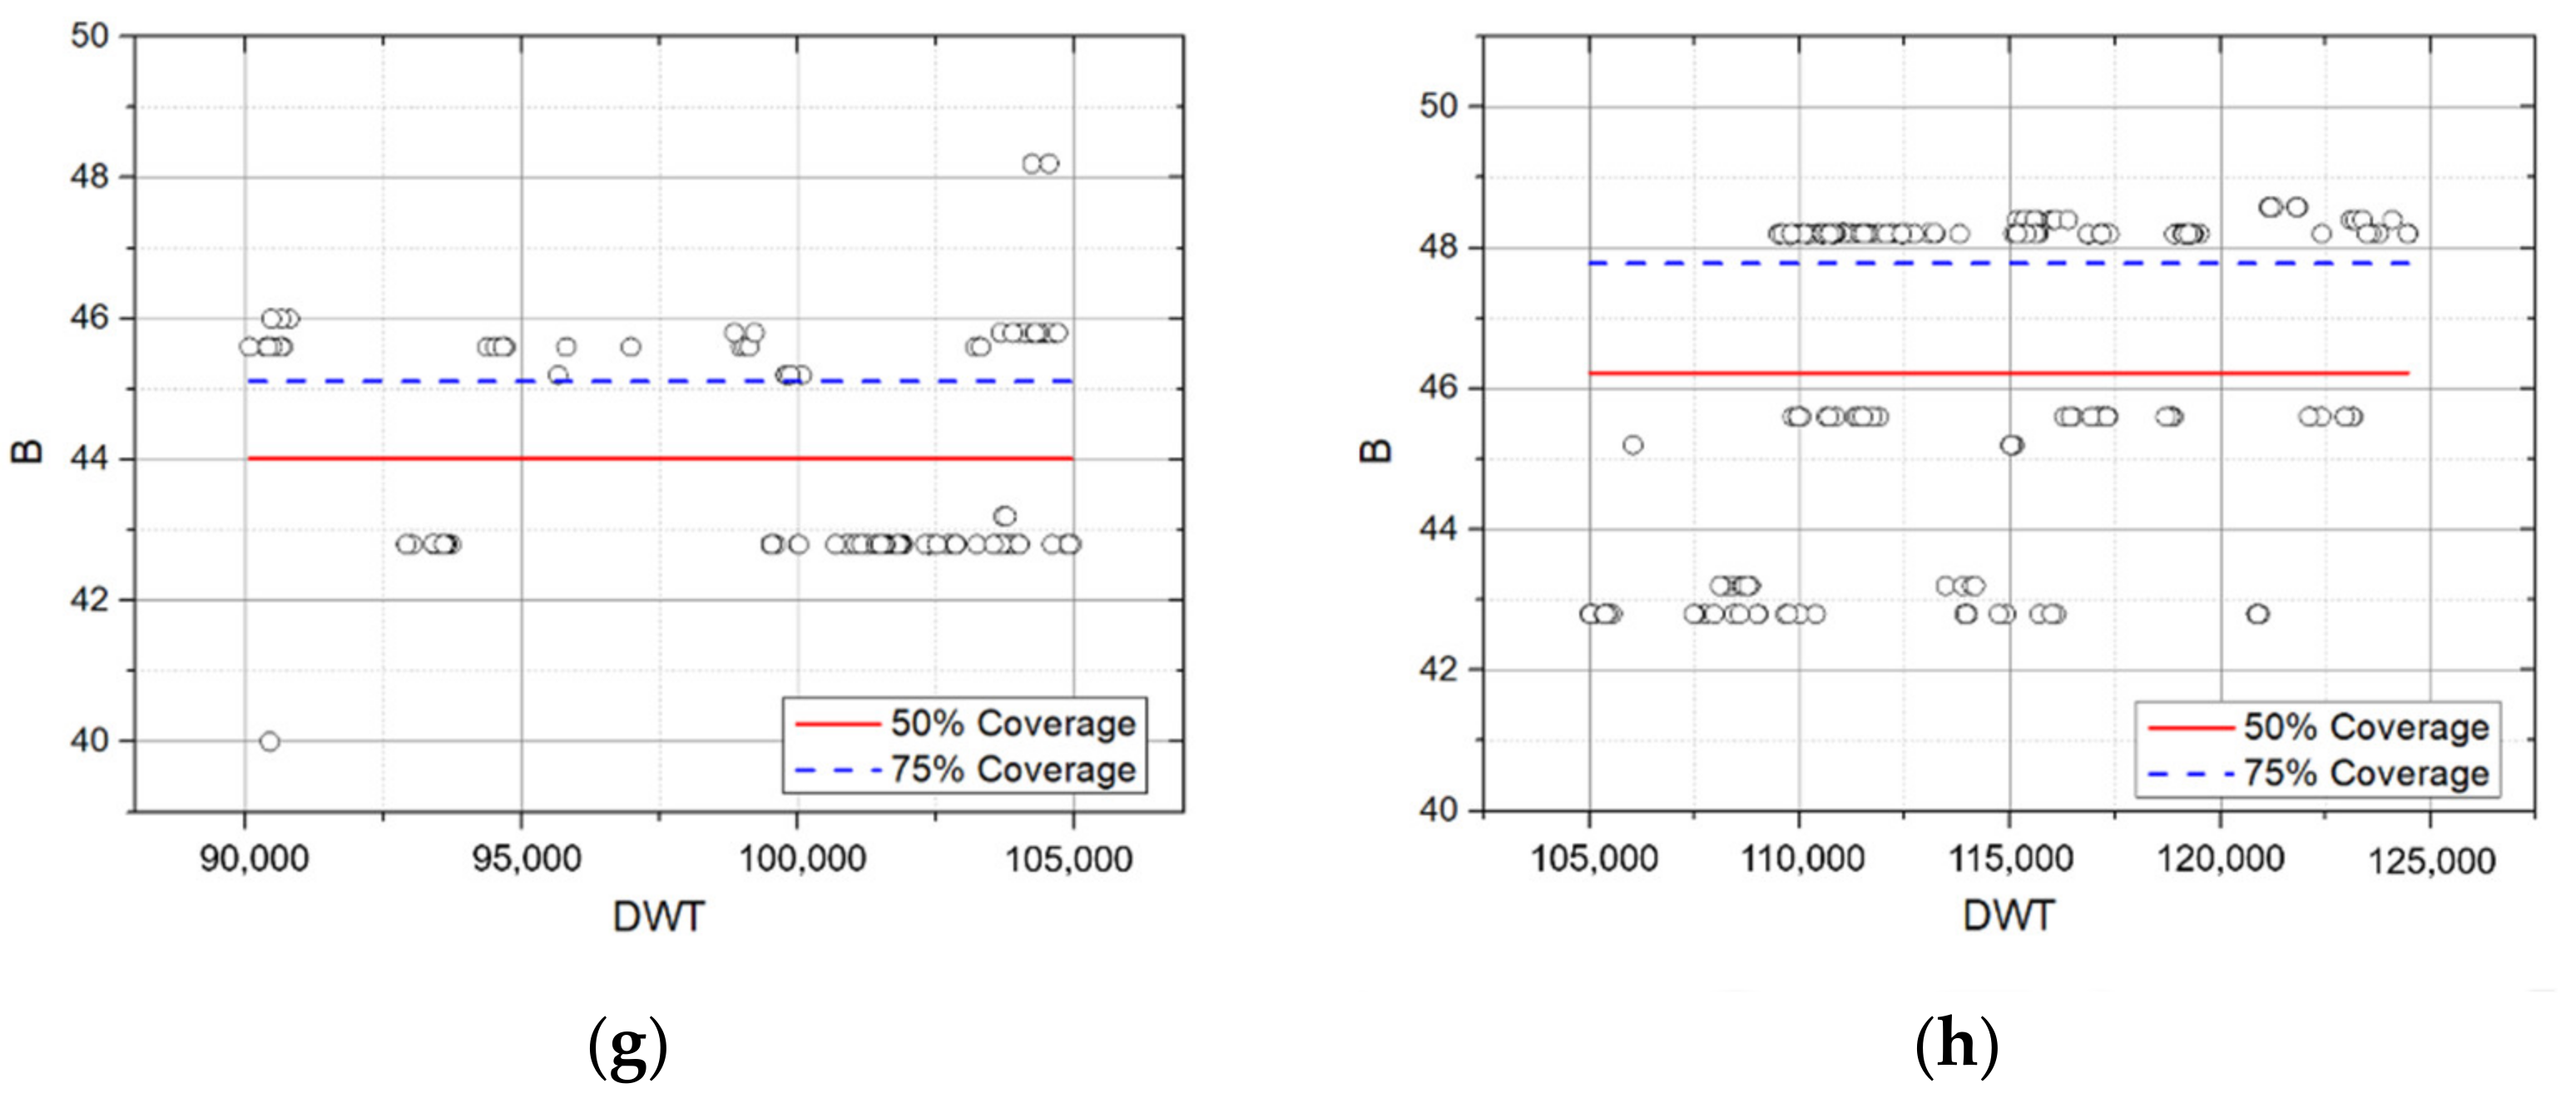
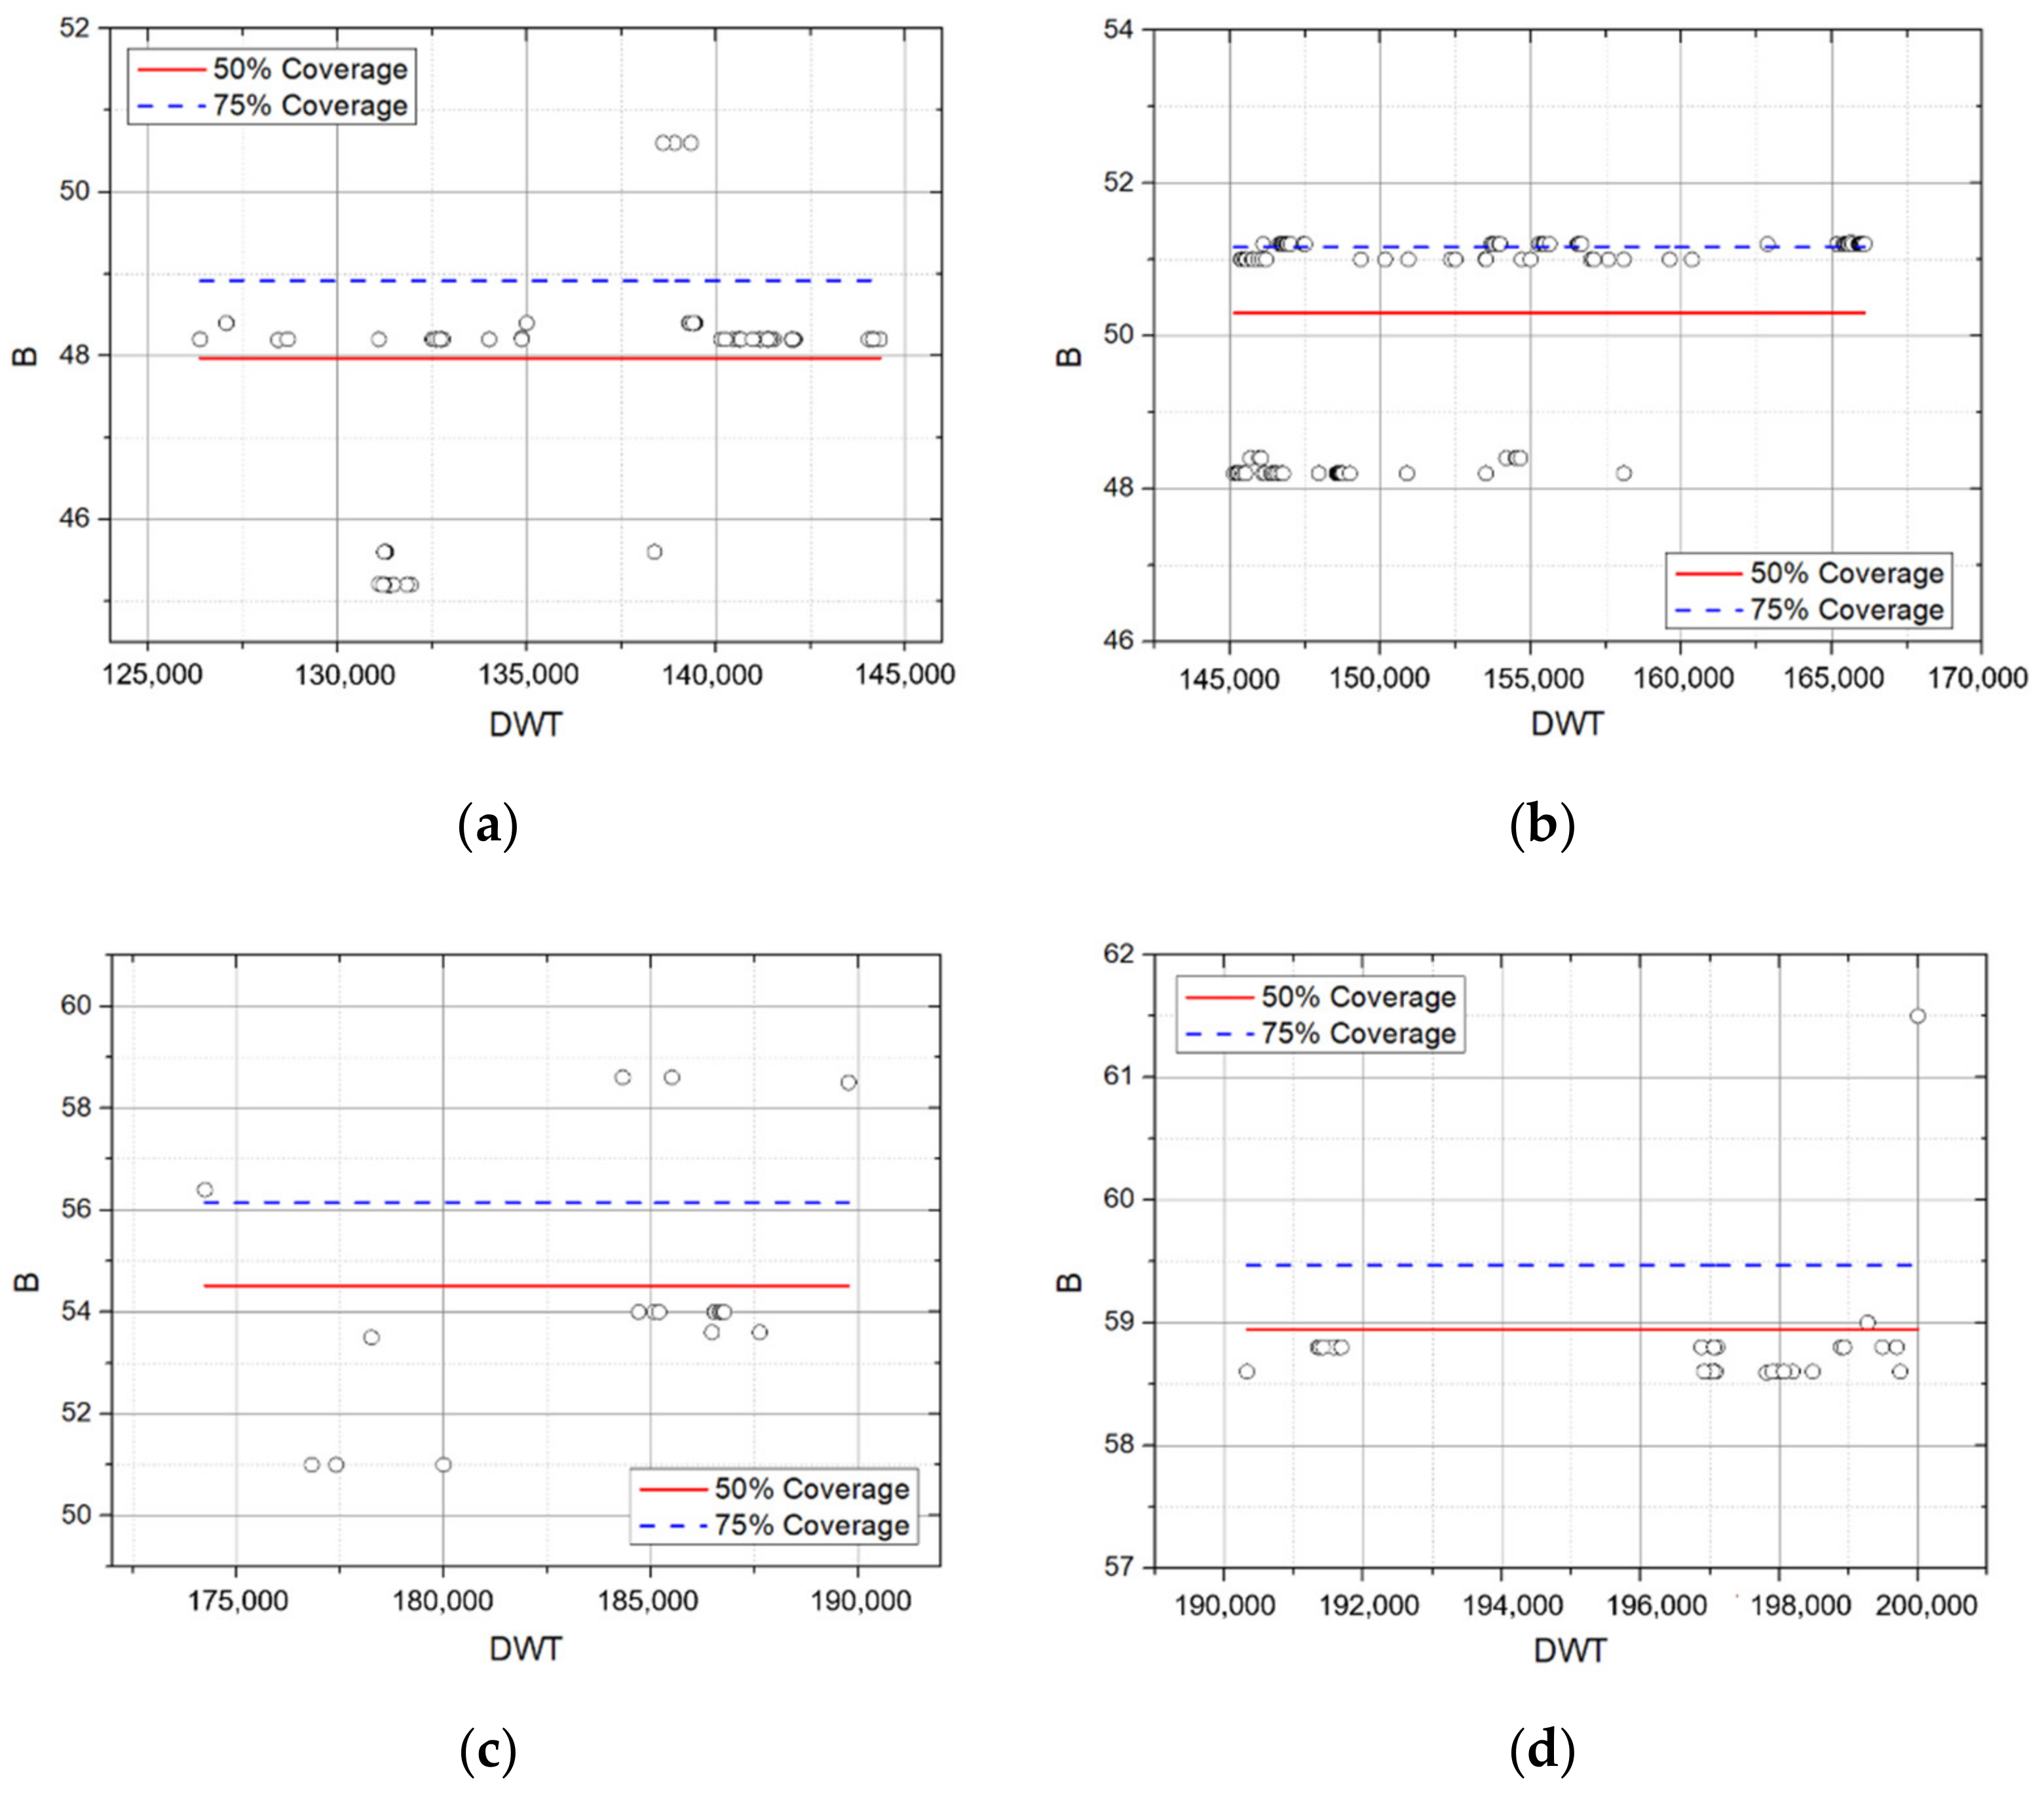
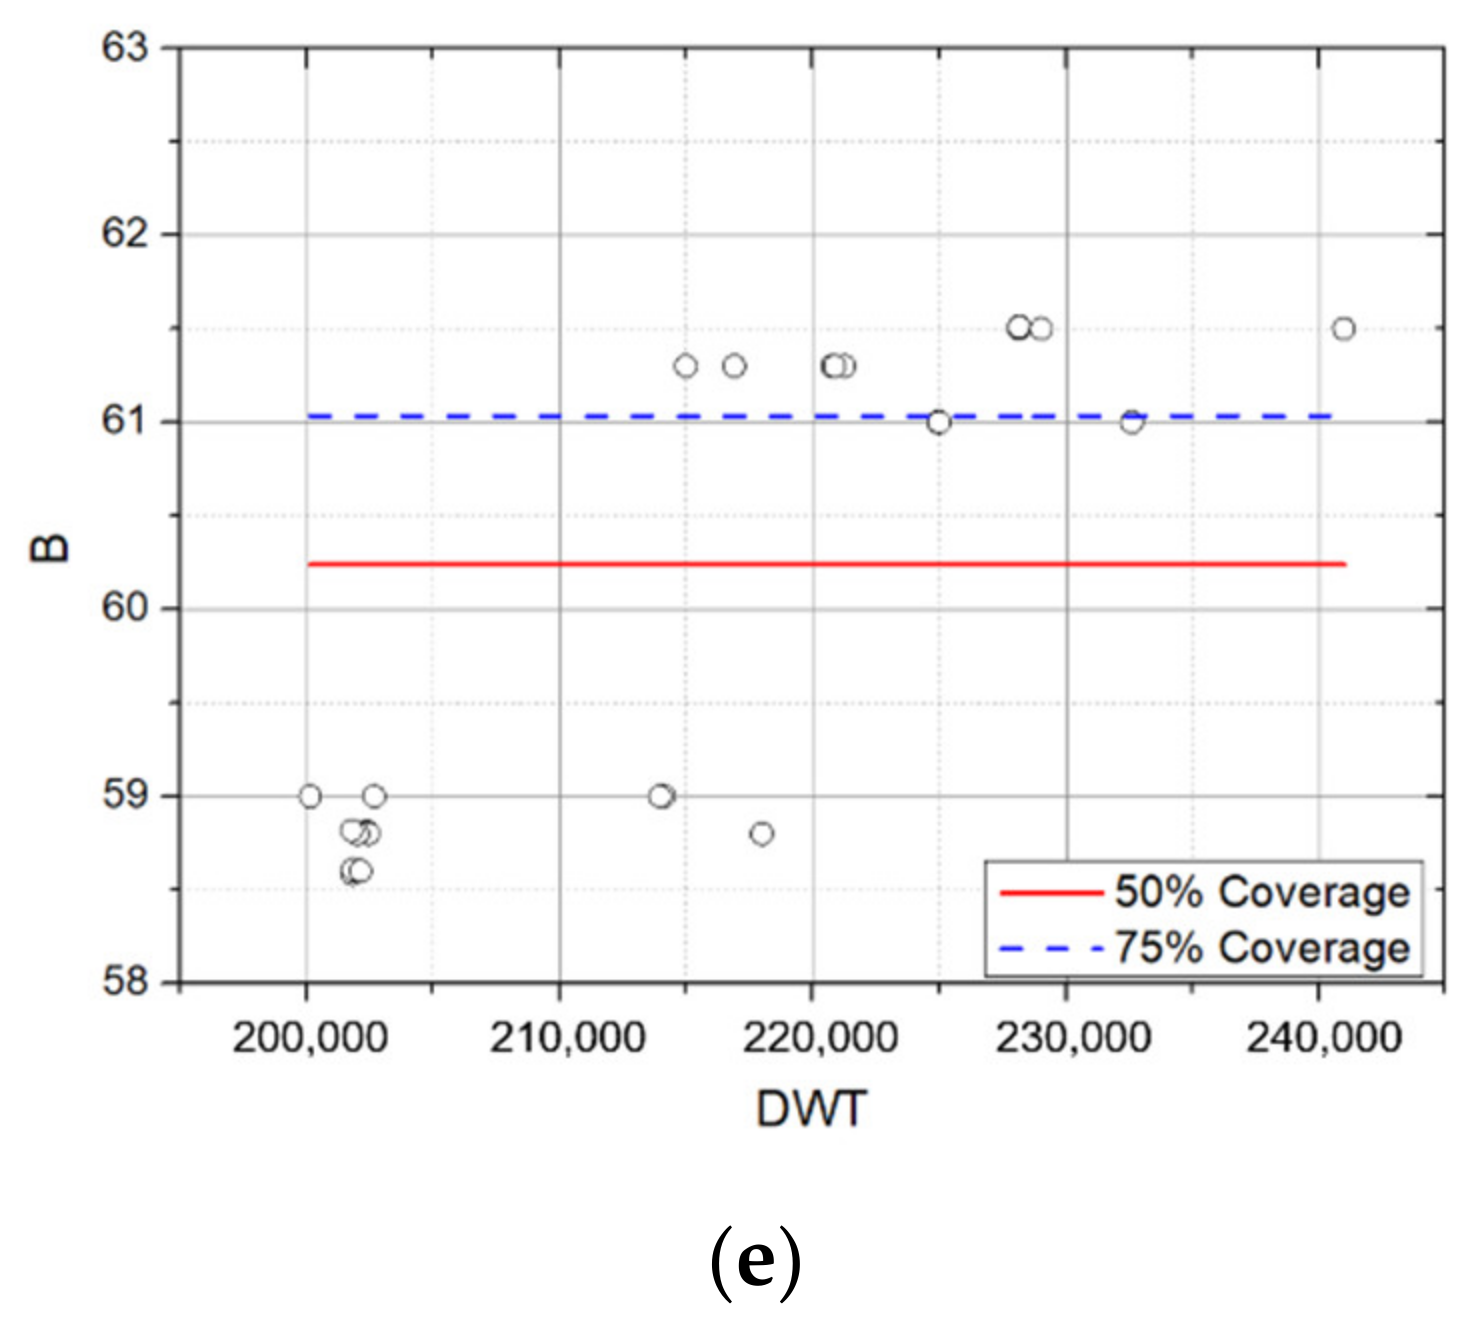

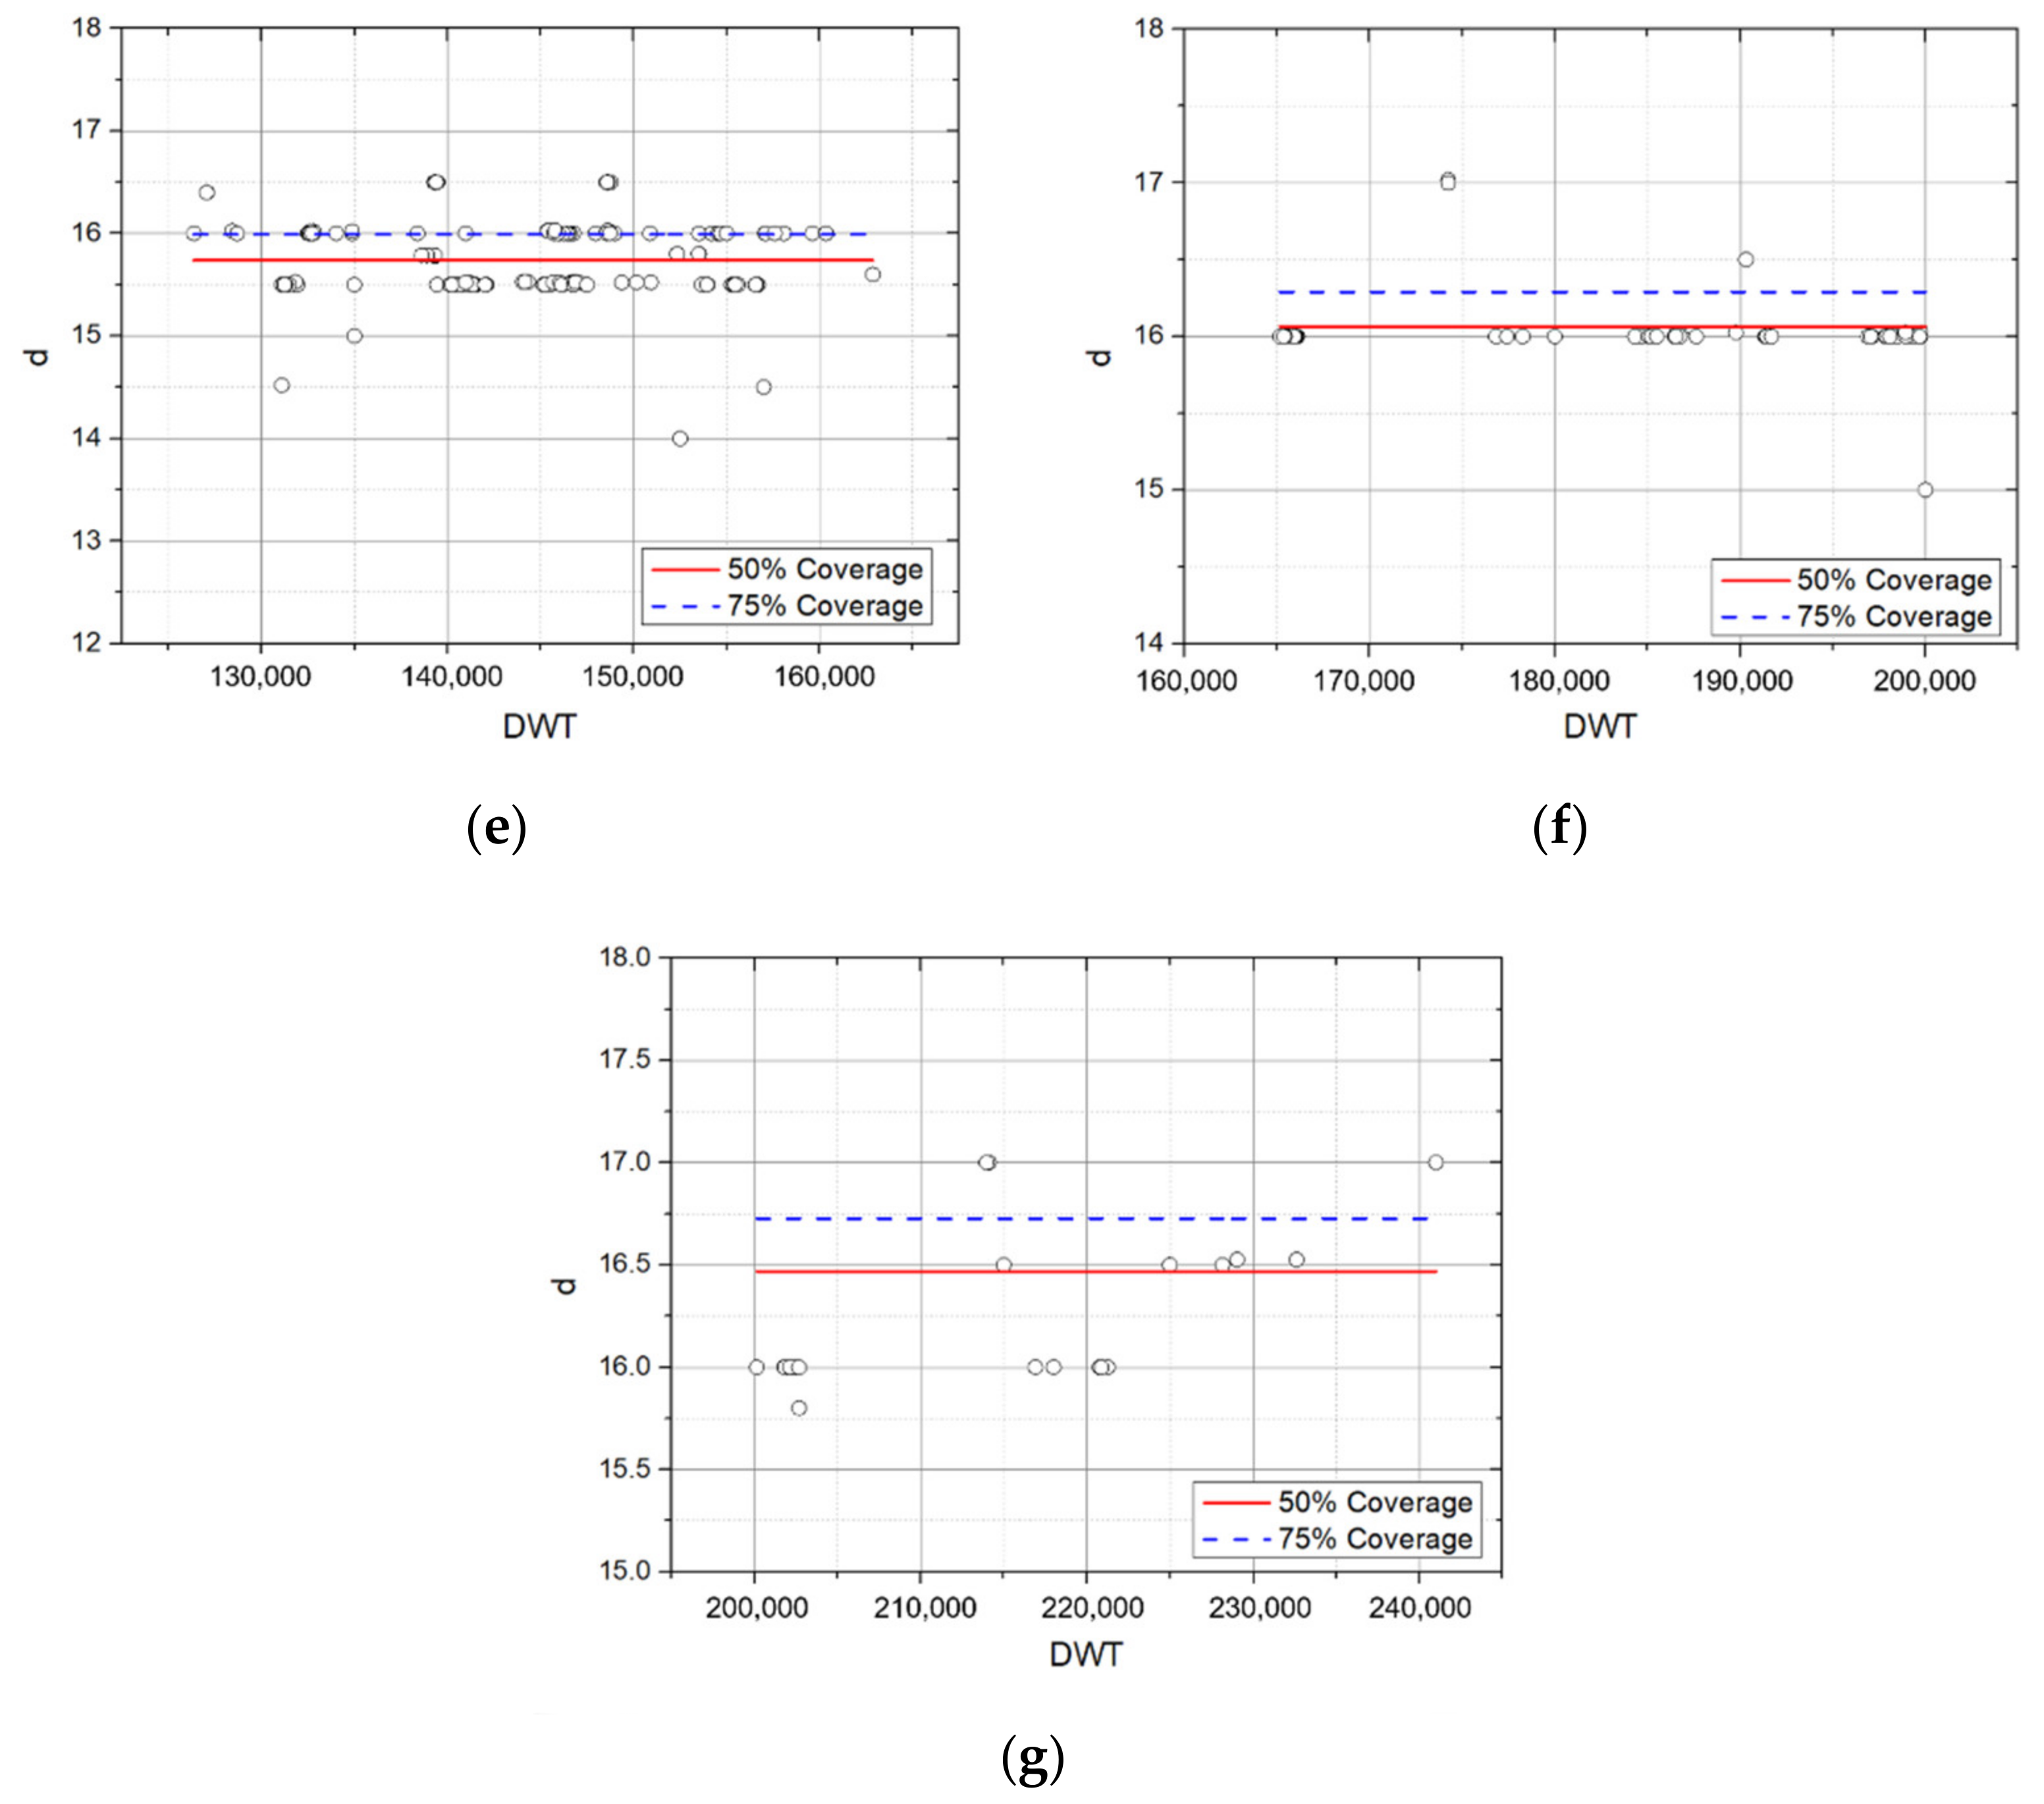
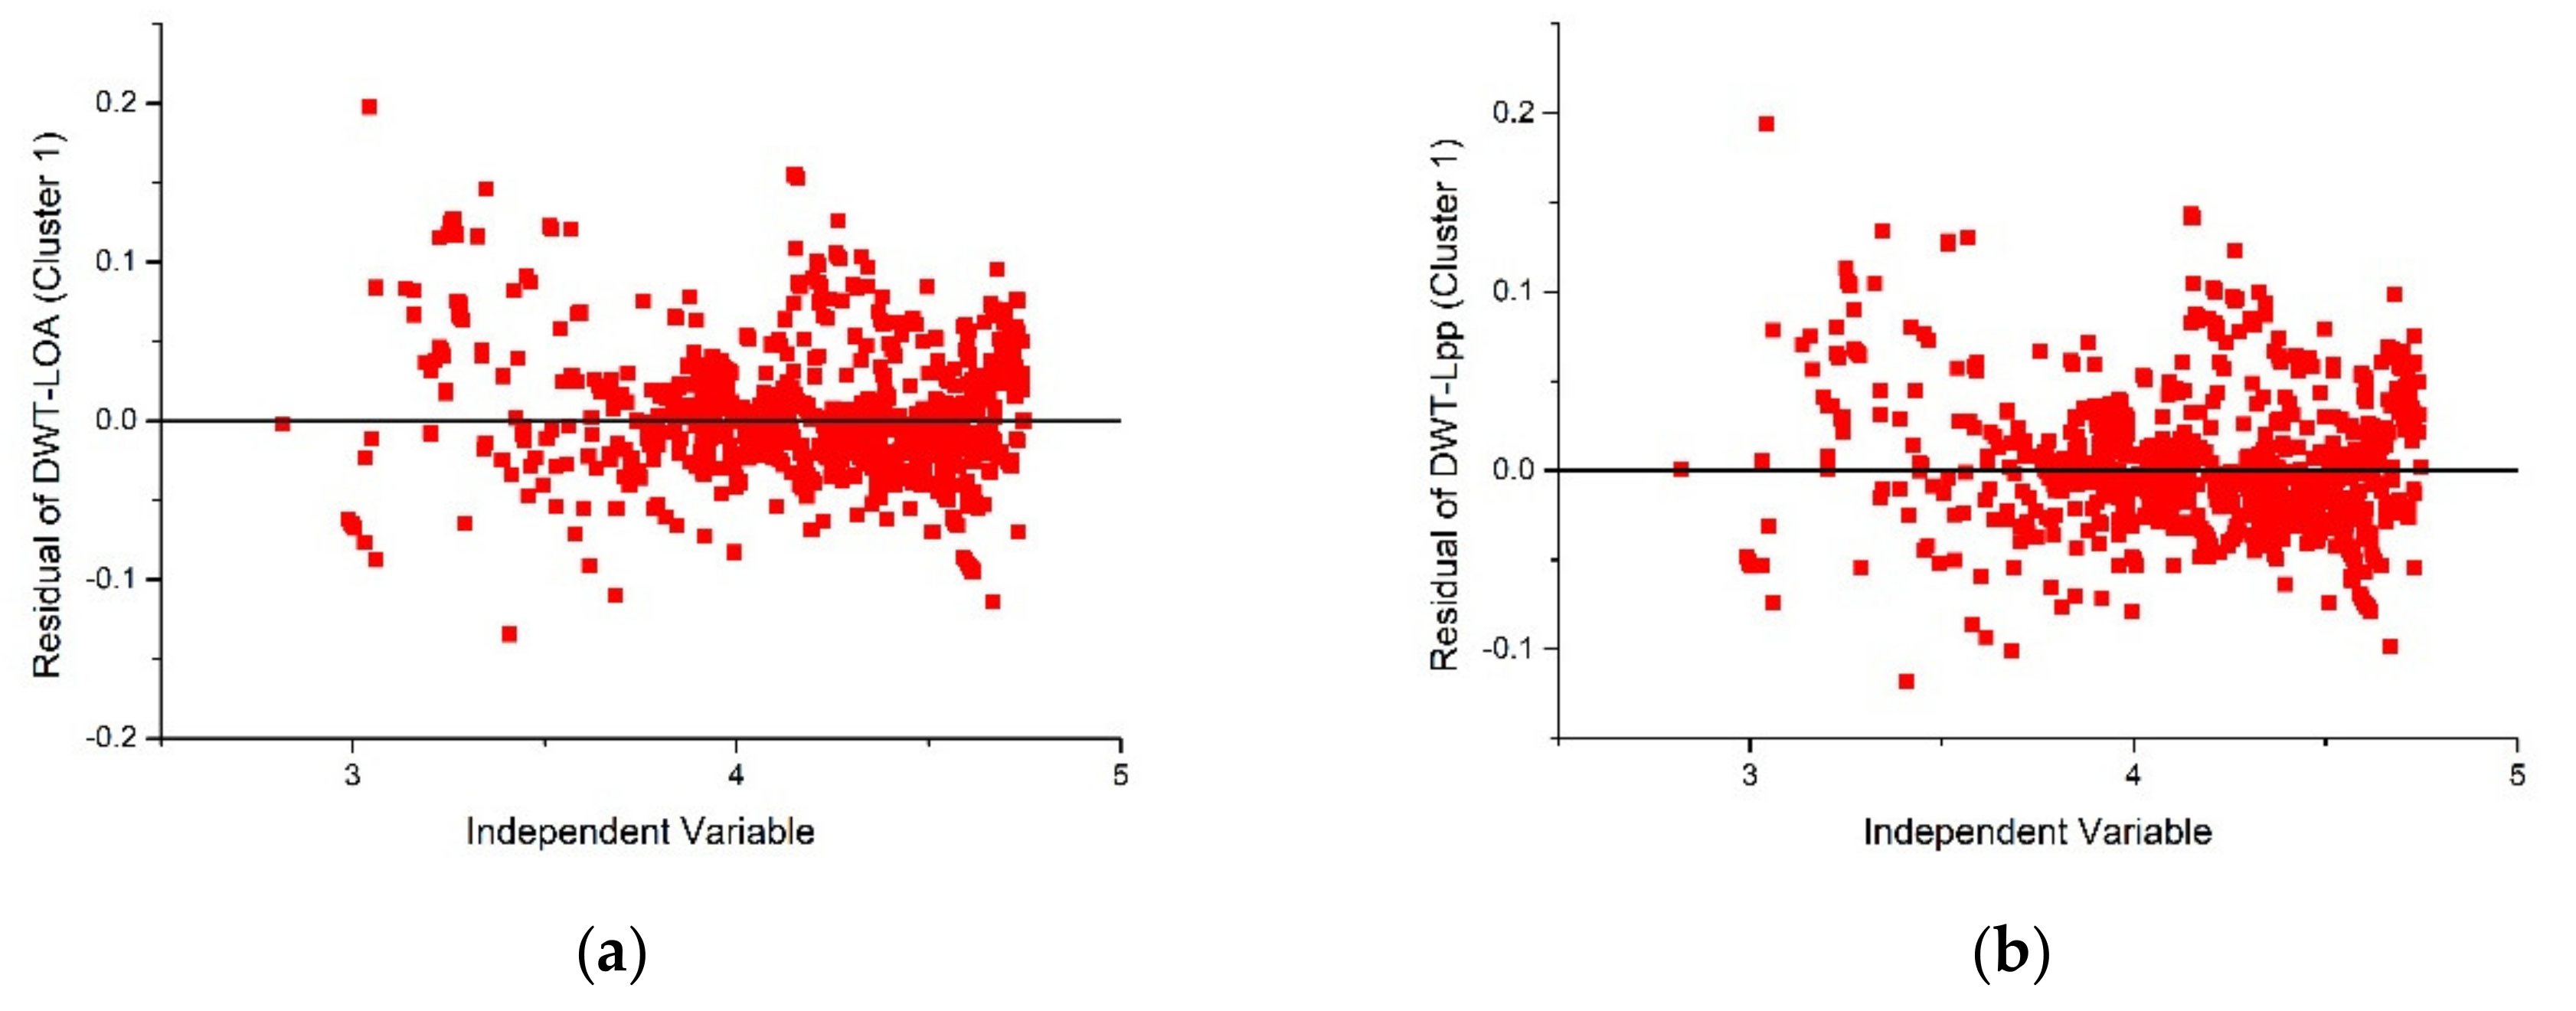
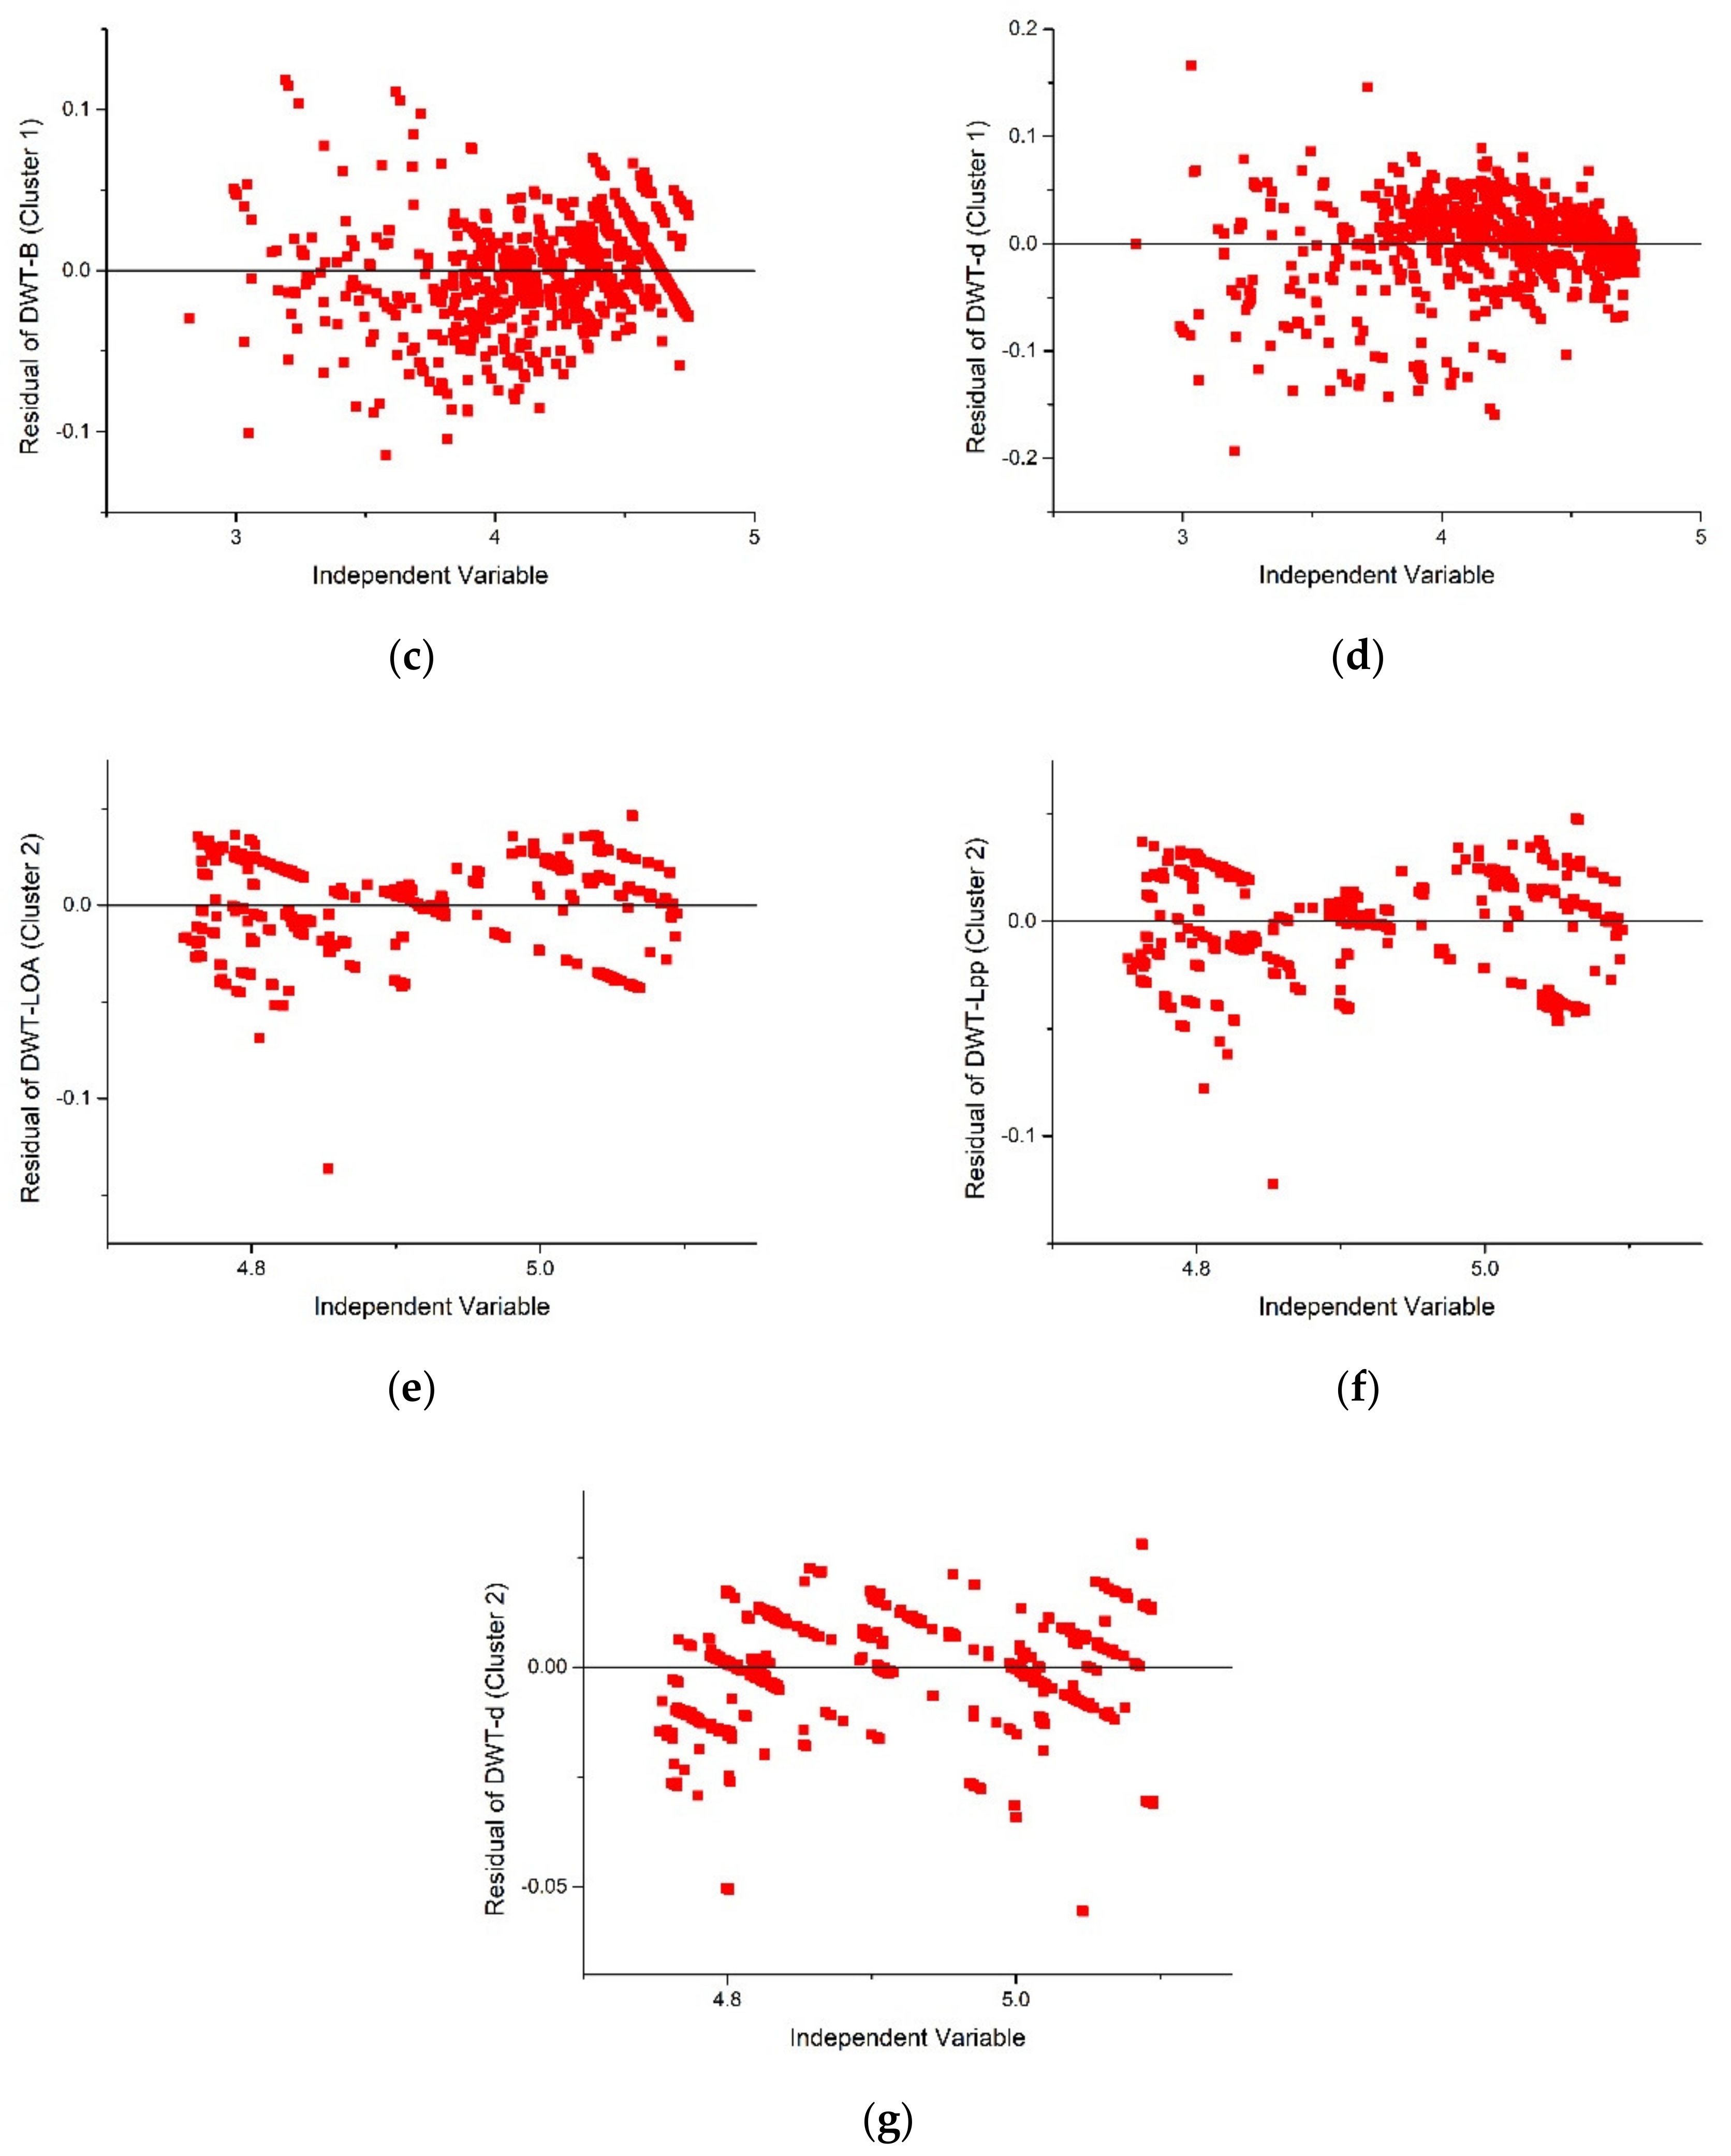
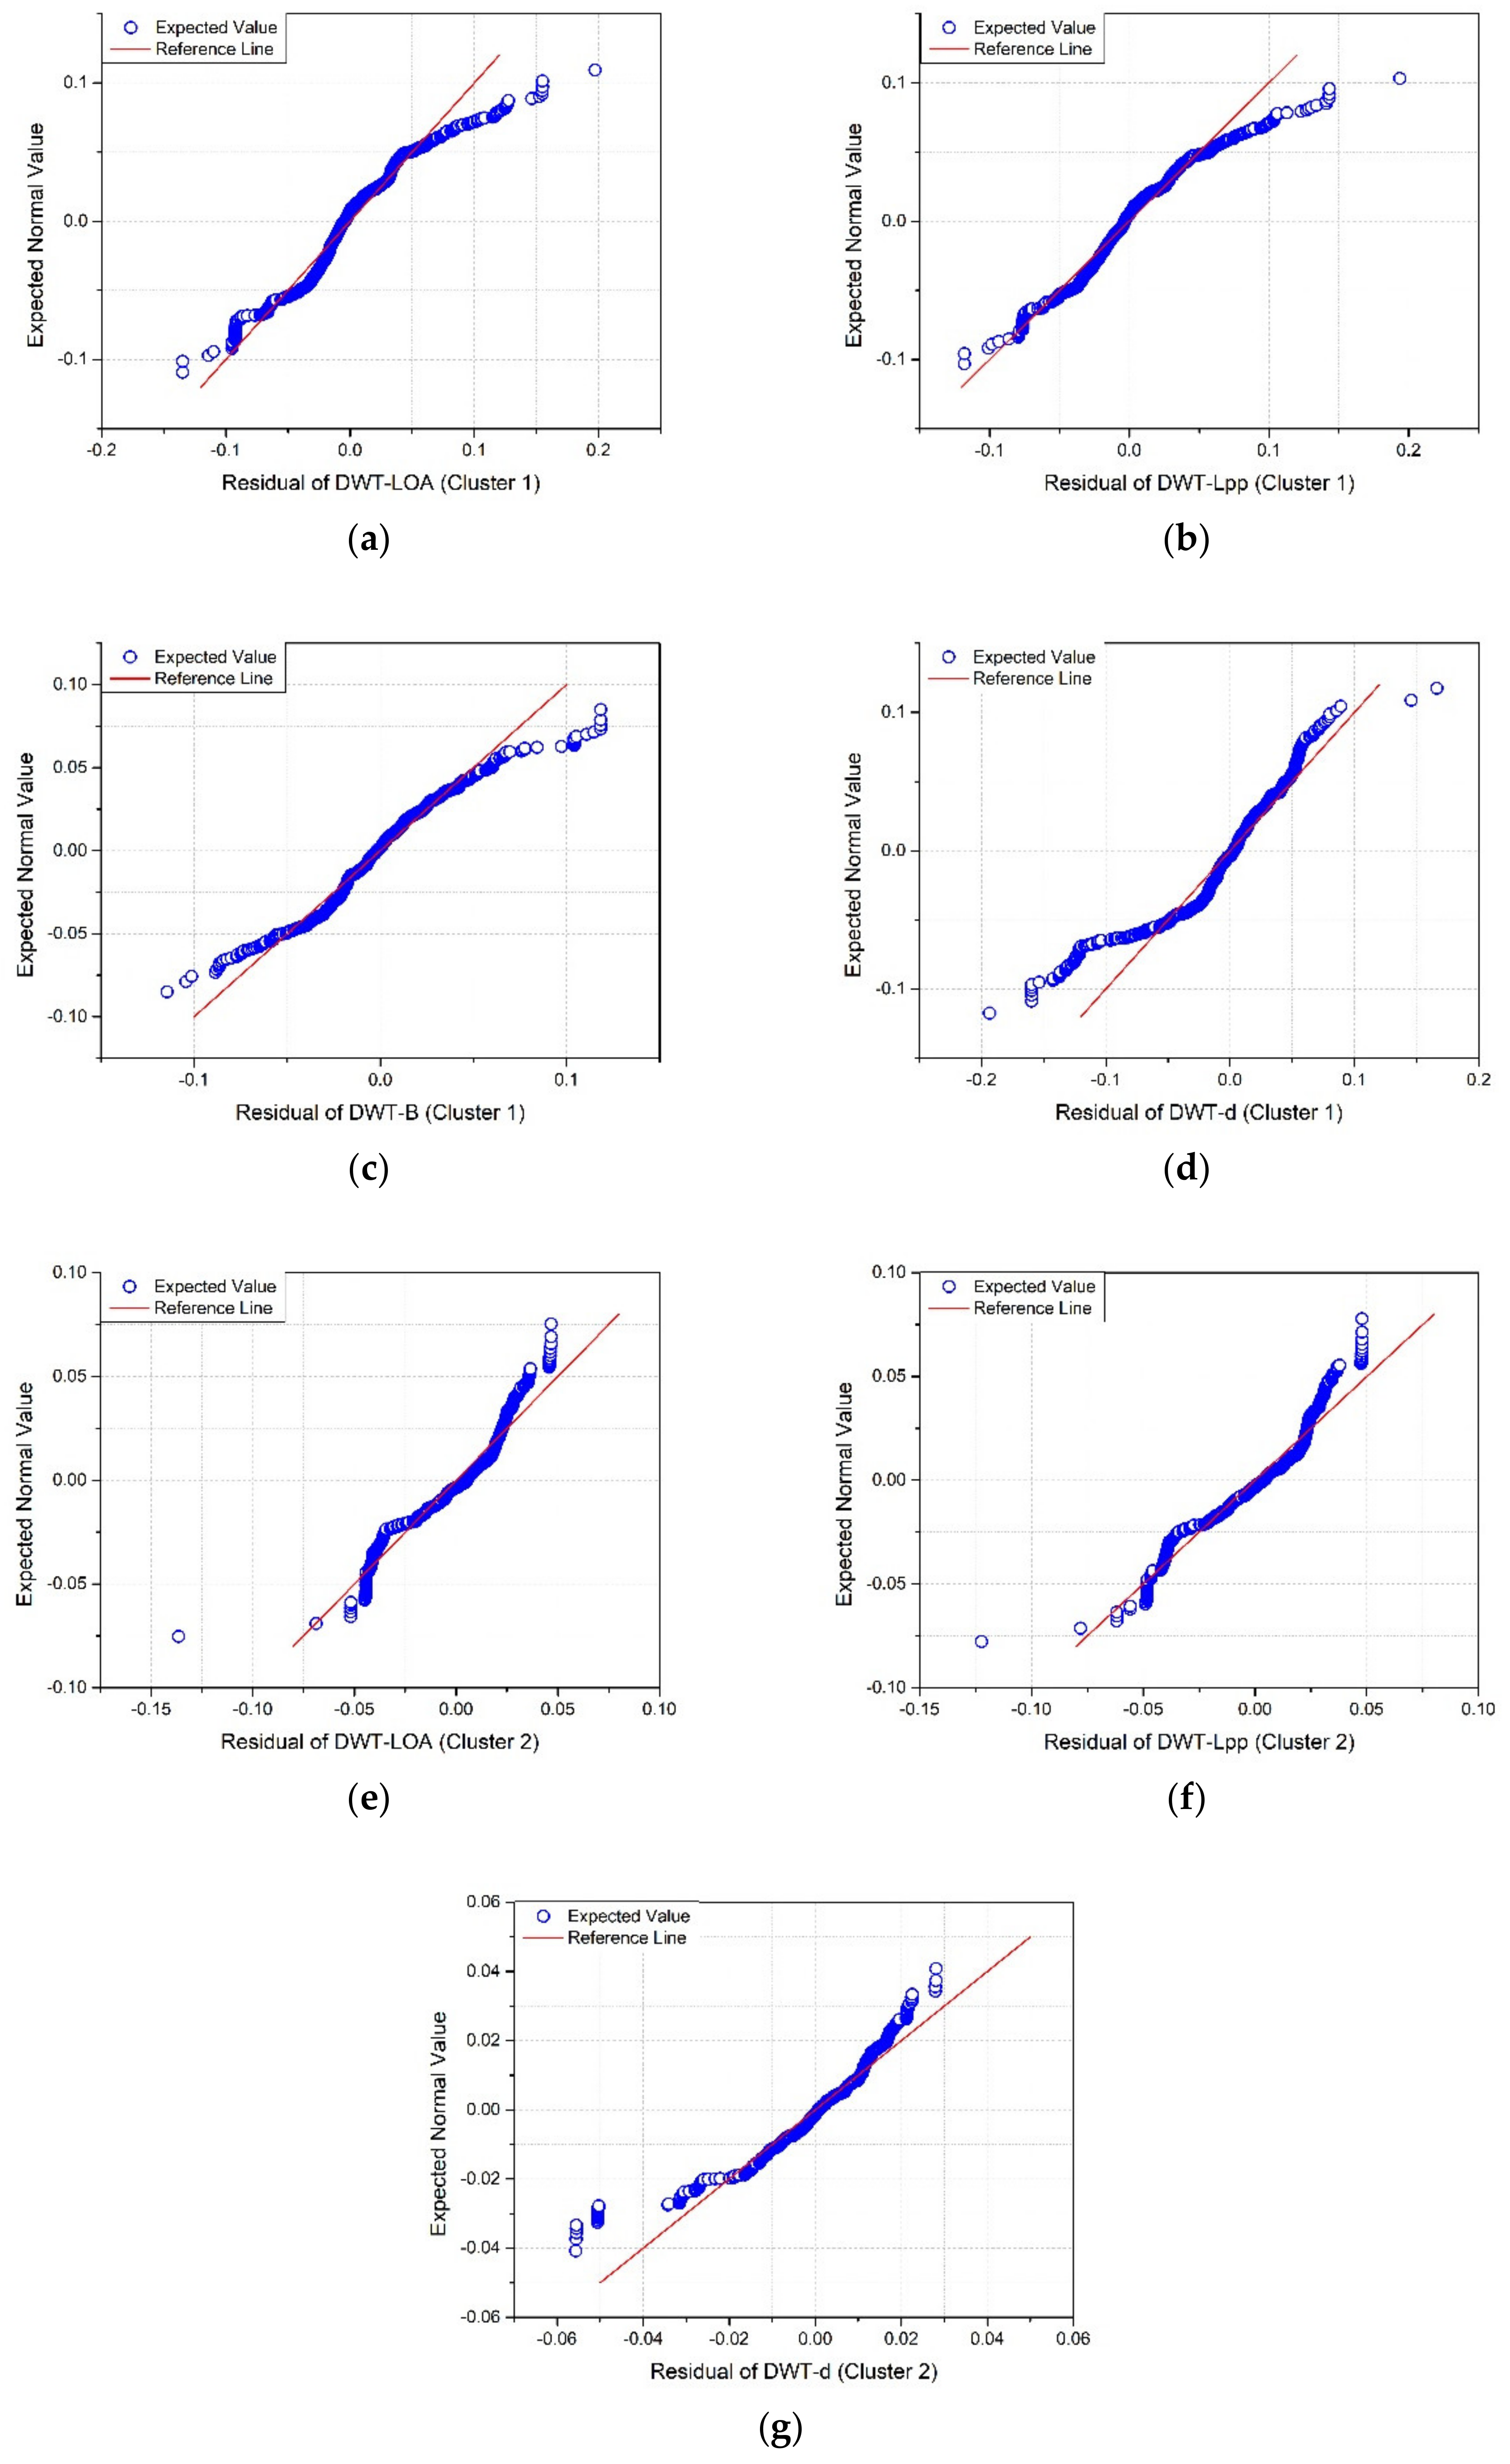
| Classification | Length Overall (m) | Molded Breadth (m) | Maximum Draft (m) | |
|---|---|---|---|---|
| Previous studies (25,000 TEU) | KMI [2] 1 | 462.3 | 60.7 | 17.0 |
| Cho er al. [3] | 474.0 | 61.0 | 18.3 | |
| Previous studies (30,000 TEU) | KMI [2] | 536.9 | 76.1 | 18.0 |
| Cho er al. [3] | 517.0 | 65.0 | 19.4 | |
| Park and Suh [4] | 453.0 | 67.0 | 17.3 | |
| Mega-sized container (15,000–24,000 TEU) | CMA CGM Marco Polo [6] | 396.0 | 54.0 | 16.0 |
| MAERSK E-Class [6] | 397.0 | 56.0 | 15.5 | |
| MAERSK Triple E-Class [6] | 400.0 | 59.0 | 15.5 | |
| HMM ALGECIRAS [7] | 399.9 | 61.0 | 16.5 | |
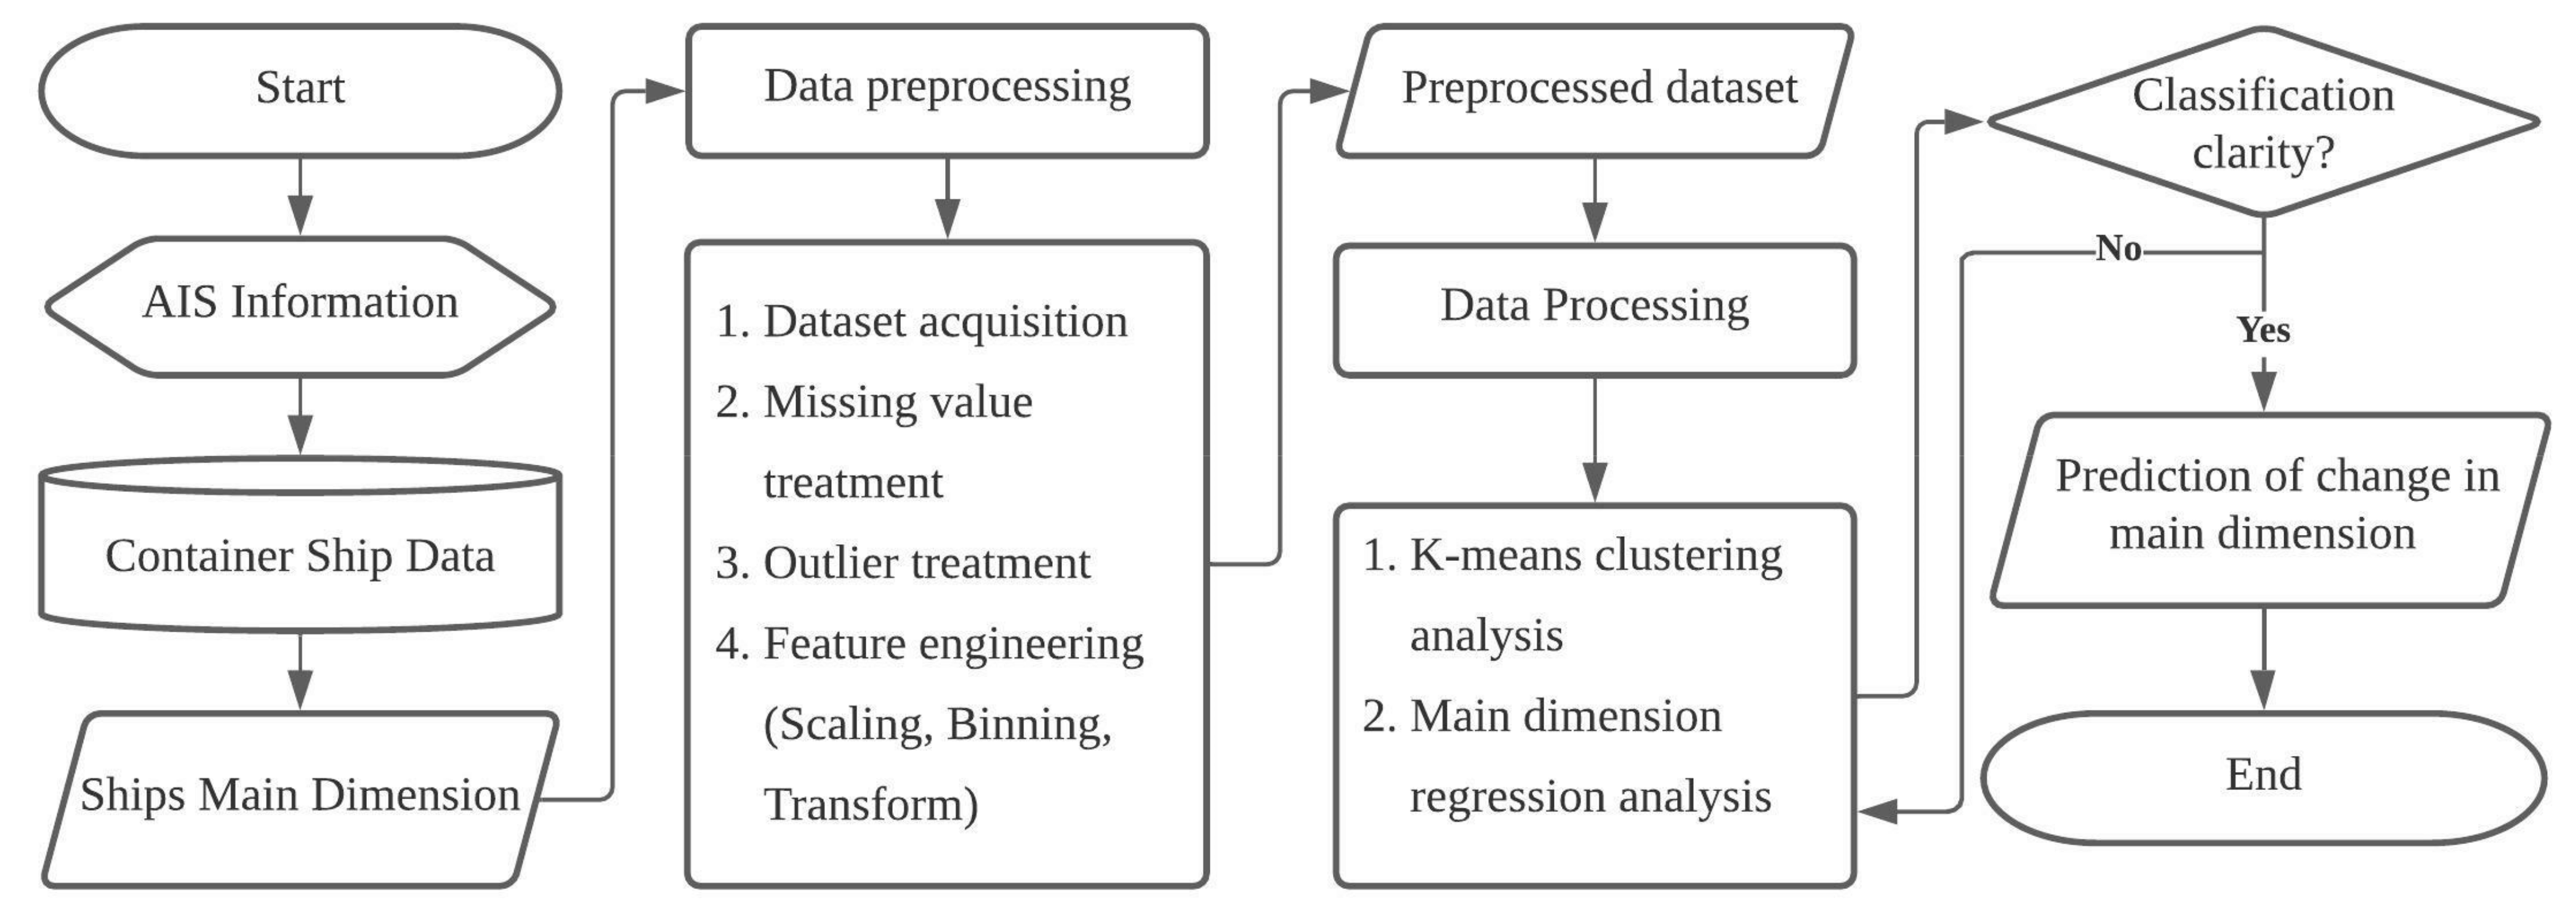
| Data Preprocessing | Raw Data | Acquired Data | Outlier & Missing Value Treatment |
|---|---|---|---|
| Count | 7791 | 7730 | 5497 |
| Classification | Length Overall | Length between Perpendiculars | Molded Breadth | Maximum Draft |
|---|---|---|---|---|
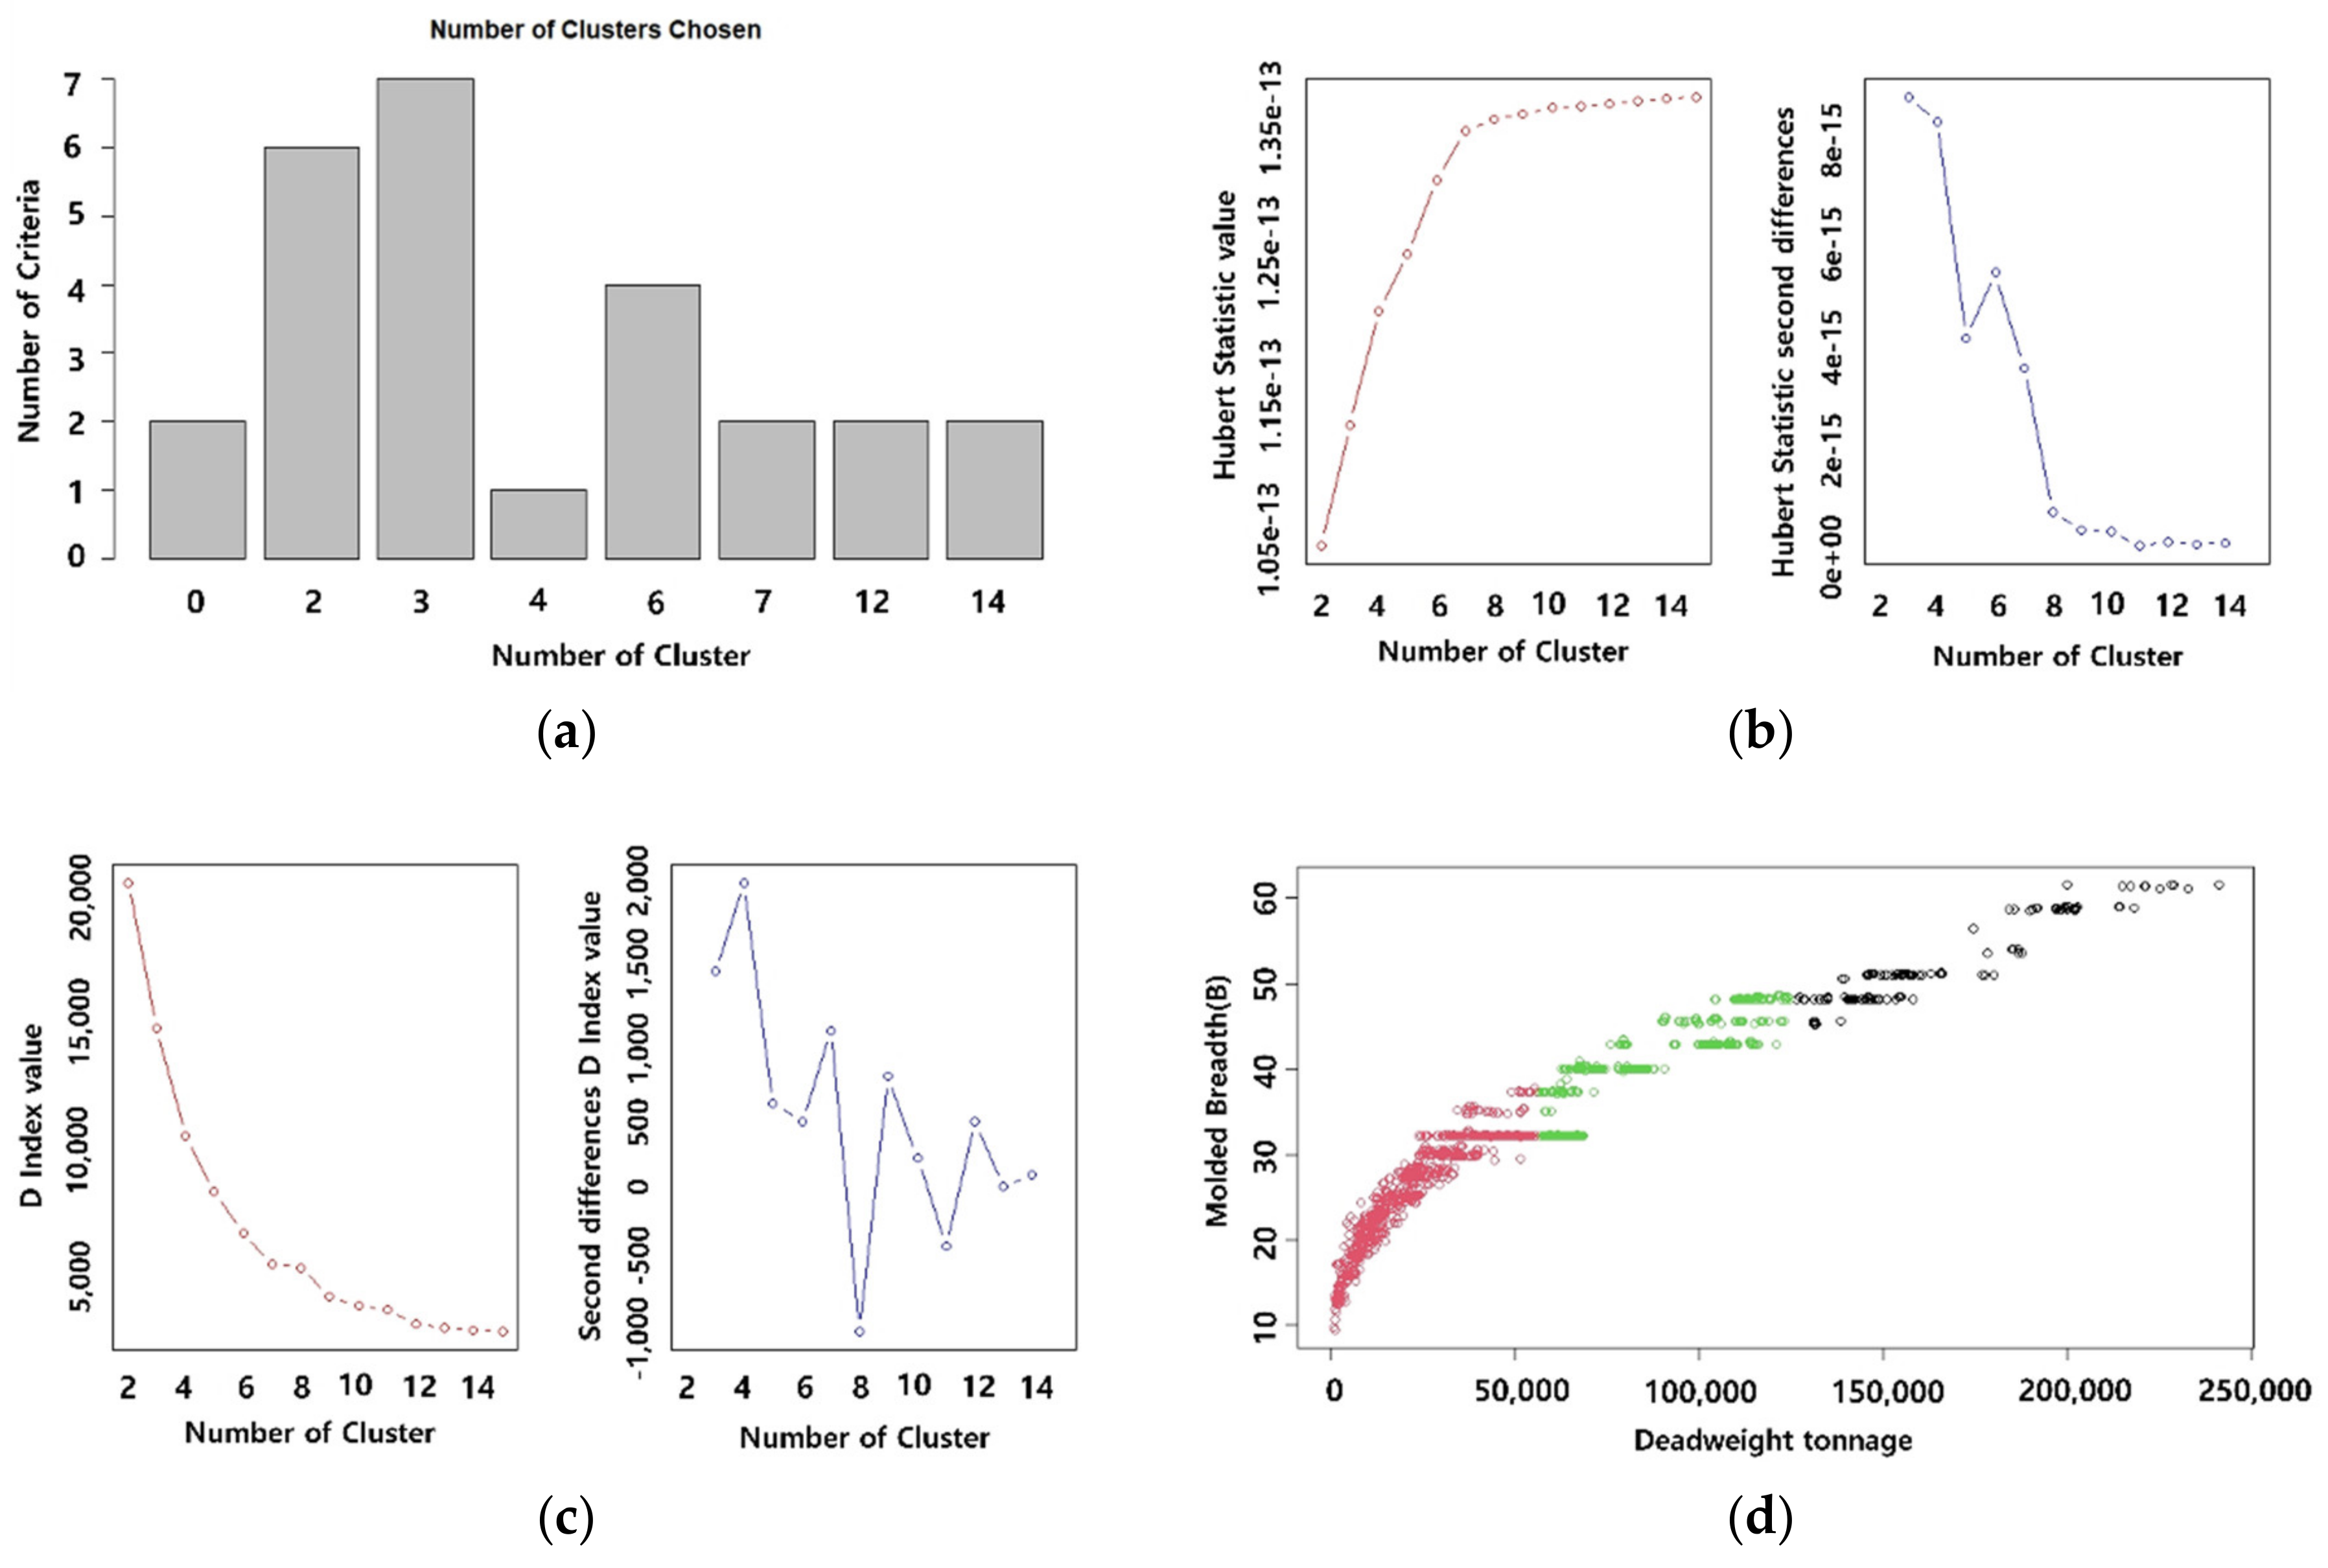
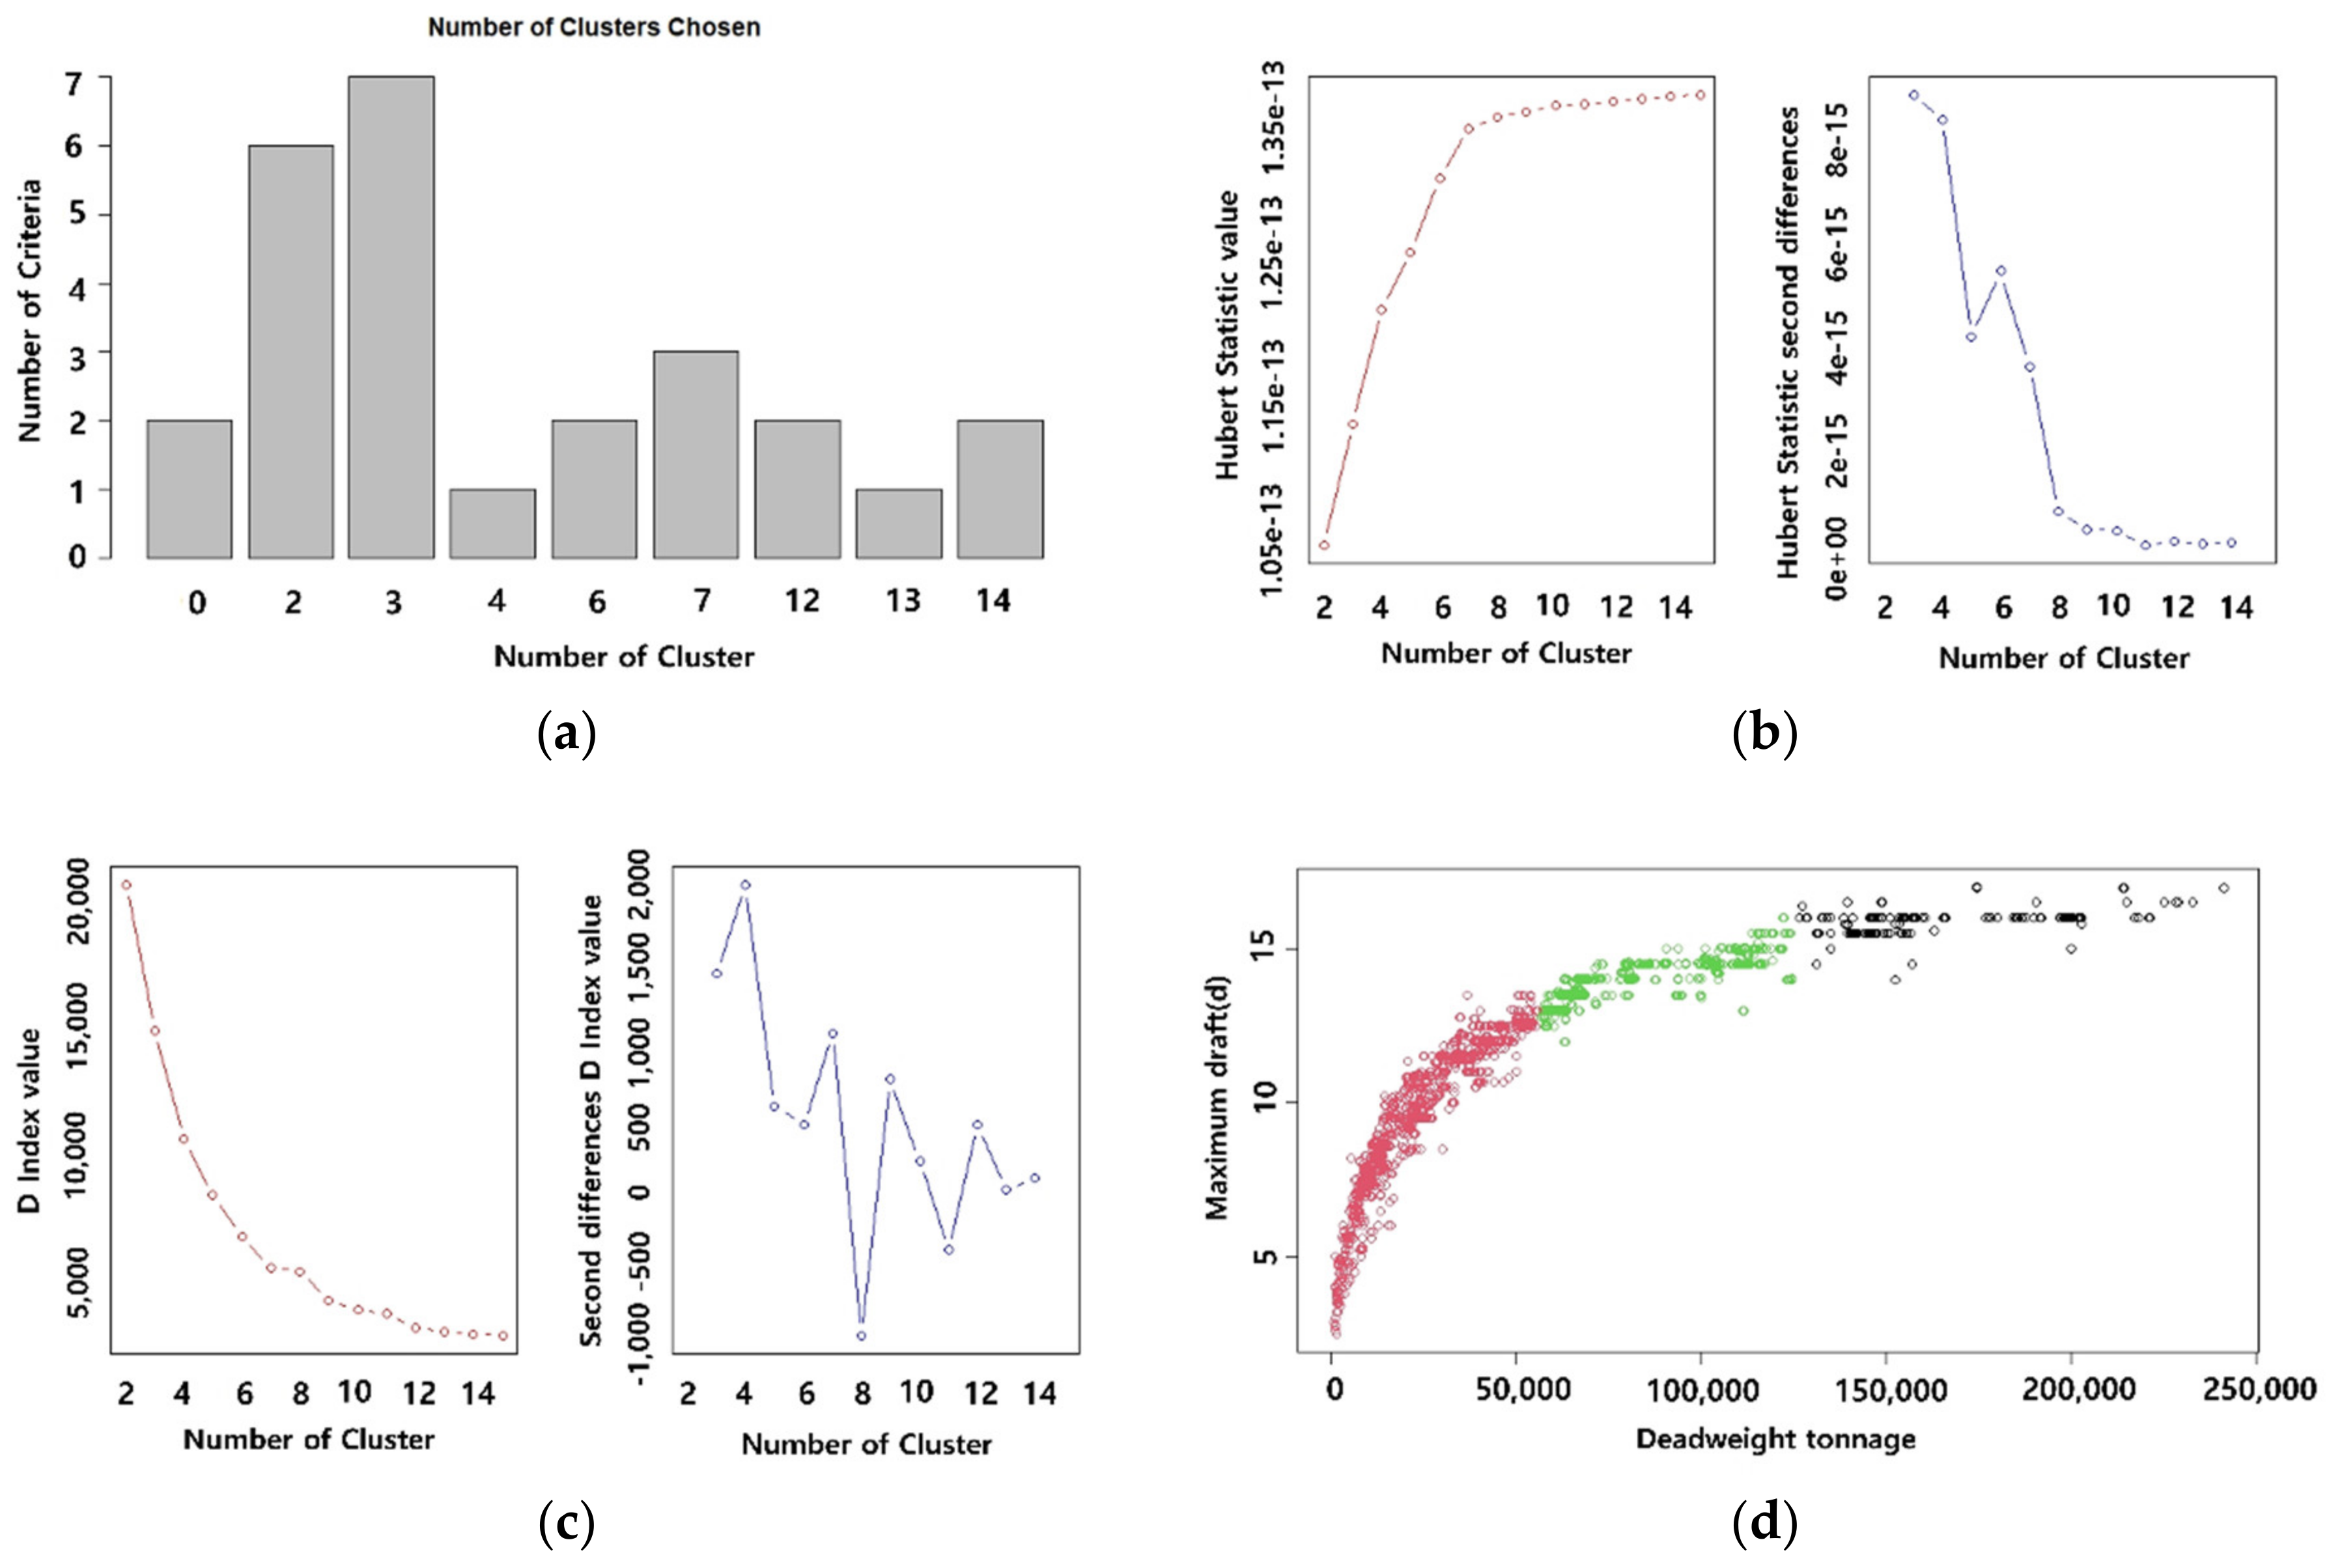
| KL | 7 | 7 | 7 | 7 |
| CH | 12 | 12 | 12 | 12 |
| Hartigan | 4 | 4 | 4 | 4 |
| CCC | 2 | 2 | 2 | 2 |
| Scott | 3 | 3 | 3 | 3 |
| Marriot | 3 | 3 | 6 | 3 |
| TrCovW | 3 | 3 | 3 | 3 |
| TraceW | 3 | 3 | 3 | 3 |
| Friedman | 6 | 6 | 6 | 6 |
| Rubin | 12 | 12 | 12 | 12 |
| C index | 14 | 14 | 14 | 14 |
| DB | 6 | 6 | 6 | 6 |
| Silhouette | 2 | 2 | 2 | 2 |
| Duda | 3 | 3 | 3 | 3 |
| PseudoT2 | 3 | 3 | 3 | 3 |
| Beale | 2 | 2 | 2 | 2 |
| Ratkowsky | 2 | 2 | 2 | 2 |
| Ball | 3 | 3 | 3 | 3 |
| PtBiserial | 2 | 2 | 2 | 2 |
| Frey | 7 | 7 | 7 | 7 |
| McClain | 2 | 2 | 2 | 2 |
| Dunn | 3 | 3 | 3 | 3 |
| Hubert | 5 | 5 | 5 | 5 |
| SD index | 6 | 6 | 6 | 6 |
| D index | 6 | 6 | 6 | 8 |
| SDbw | 14 | 14 | 14 | 14 |
| Result | 3 | 3 | 3 | 3 |
| Classification | Cargo Unit | ||
|---|---|---|---|
| Container ship | TEU | 0.1006 | 0.9723 |
| Classification | Length Overall | Length between Perpendiculars | Molded Breadth | Maximum Draft | |||||
|---|---|---|---|---|---|---|---|---|---|
| Cluster 1 | 3.90 | 0.39 | 3.39 | 0.39 | 1.62 | 0.29 | 0.43 | 0.32 | |
| 0.70 | 0.36 | 0.64 | 0.37 | 0.25 | 0.28 | −0.48 | 0.36 | ||
| Cluster 2 | 12.72 | 0.28 | 11.91 | 0.28 | - | - | 2.33 | 0.16 | |
| 1.10 | 0.28 | 1.07 | 0.29 | - | - | 0.36 | 0.16 | ||
| Classification | Residual Standard Deviation | |||||
|---|---|---|---|---|---|---|
| This Study | Previous Study [15] | This Study | Previous Study [15] | |||
| 0–55,000 DWT (Cluster 1) | Log(LOA) | 0.93 | 0.94–0.95 | 0.03 | 0.02 | |
| Log(Lpp) | 0.94 | 0.94–0.95 | 0.02 | 0.02 | ||
| Log(B) | 0.91 | 0.88–0.90 | 0.02 | 0.02 | ||
| Log(d) | 0.91 | 0.46–0.78 | 0.04 | 0.04 | ||
| LOA | - | - | - | 10.13–15.12 | ||
| Lpp | - | - | - | 9.59–14.75 | ||
| B | - | - | 1.45–1.76 | 1.00–1.65 | ||
| d | - | - | - | 0.71–0.73 | ||
| 55,000–125,000 DWT (Cluster 2) | Log(LOA) | 0.63 | - | 0.03 | - | |
| Log(Lpp) | 0.62 | - | 0.02 | - | ||
| Log(B) | - | - | - | - | ||
| Log(d) | 0.66 | - | 0.01 | - | ||
| LOA | - | - | - | 7.98–21.99 | ||
| Lpp | - | - | - | 7.83–15.97 | ||
| B | - | - | 1.63–3.48 | 1.59–3.62 | ||
| d | - | - | - | 0.59–0.99 | ||
| 125,000–241,000 DWT (Cluster 3) | LOA | - | - | 3.09–12.93 | 1.19–21.99 | |
| Lpp | - | - | 2.87–12.04 | 3.30–9.45 | ||
| B | - | - | 1.18–2.42 | 1.67–3.29 | ||
| d | - | - | 0.33–0.38 | 0.47–0.64 | ||
| Classification | DWT (ton) | TEU | LOA (m) | Lpp (m) | B (m) | d (m) |
|---|---|---|---|---|---|---|
| Small Feeder | 3000 | 302 | 86 | 80 | 15.9 | 5.4 |
| 5000 | 503 | 105 | 98 | 18.4 | 6.4 | |
| 10,000 | 1006 | 138 | 129 | 22.4 | 8.0 | |
| Large Feeder | 20,000 | 2012 | 180 | 169 | 27.3 | 10.0 |
| Panamax | 30,000 | 3018 | 211 | 198 | 30.6 | 11.3 |
| 40,000 | 4024 | 235 | 222 | 33.1 | 12.4 | |
| 50,000 | 5030 | 257 | 243 | 33.1 | 13.3 | |
| 55,000 | 5533 | 266 | 252 | 34.2 | 13.8 | |
| 60,000 | 6036 | 275 | 261 | 36.9 | 14.0 | |
| Post Panamax | 70,000 | 7042 | 297 | 283 | 40.7 | 14.0 |
| 85,000 | 8551 | 313 | 299 | 40.7 | 14.4 | |
| Super Post Panamax | 100,000 | 10,060 | 328 | 313 | 45.1 | 14.8 |
| 120,000 | 12,072 | 336 | 329 | 47.8 | 15.2 | |
| Very Large Container Ship | 130,000 | 13,078 | 348 | 333 | 48.9 | 16.0 |
| 140,000 | 14,084 | 368 | 352 | 48.9 | 16.0 | |
| 165,000 | 16,599 | 378 | 361 | 51.2 | 16.0 | |
| 180,000 | 18,108 | 378 | 361 | 56.1 | 16.3 | |
| Ultra Large Container Ship | 200,000 | 20,120 | 400 | 385 | 59.5 | 16.3 |
| 240,000 | 24,144 | 400 | 385 | 61.0 | 16.7 |
| Classification | Change in Length Overall per 10,000 DWT | Change in Breadth per 10,000 DWT | ||||
|---|---|---|---|---|---|---|
| Mean | Standard Deviation | Coefficient of Variation | Mean | Standard Deviation | Coefficient of Variation | |
| Cluster 1 | 29.29 | 7.21 | 0.25 | 2.91 | 1.23 | 0.42 |
| Cluster 2 | 9.13 | 3.02 | 0.33 | 1.71 | 1.76 | 1.03 |
| Cluster 3 | 4.73 | 8.19 | 1.73 | 1.10 | 1.65 | 1.50 |
| Terminal Name | Terminal Water Depth (m) | Time Windows of High Tide | MHHW (High Tide) (m) | Terminal Water Depth during High Tide (m) | Maximum Draft of 25,000-TEU Ship (m) | Required Water Depth (Maximum Draft × 1.3) |
|---|---|---|---|---|---|---|
| Rotterdam | 20.0 | 3:03 p.m. (CEST) | 1.88 | 21.88 | 16.9 | 21.97 |
| Hongkong | 15.5 | 7:11 p.m. (HKT) | 1.73 | 17.23 | 16.9 | 21.97 |
| Shanghai | 15.0 | 10:48 p.m. (CST) | 2.03 | 17.03 | 16.9 | 21.97 |
| Singapore | 20.0 | 10:11 p.m. (UTC+8) | 2.28 | 22.28 | 16.9 | 21.97 |
| Busan | 20.0 | 6:56 p.m. (KST) | 1.03 | 21.03 | 16.9 | 21.97 |
| TEU | LOA (m) | Lpp (m) | B (m) | D (m) | Maximum Bay Number 1 | Maximum Row Number |
|---|---|---|---|---|---|---|
| 27,000 | 414.2 | 399.2 | 63.2 | 17.0 | 98 | 25 |
| 28,000 | 414.2 | 399.2 | 65.4 | 17.0 | 98 | 26 |
| 29,000 | 428.4 | 413.4 | 65.4 | 17.0 | 102 | 26 |
| 30,000 | 428.4 | 413.4 | 67.6 | 17.0 | 102 | 27 |
Publisher’s Note: MDPI stays neutral with regard to jurisdictional claims in published maps and institutional affiliations. |
© 2022 by the authors. Licensee MDPI, Basel, Switzerland. This article is an open access article distributed under the terms and conditions of the Creative Commons Attribution (CC BY) license (https://creativecommons.org/licenses/by/4.0/).
Share and Cite
Son, W.-J.; Cho, I.-S. Analysis of Trends in Mega-Sized Container Ships Using the K-Means Clustering Algorithm. Appl. Sci. 2022, 12, 2115. https://doi.org/10.3390/app12042115
Son W-J, Cho I-S. Analysis of Trends in Mega-Sized Container Ships Using the K-Means Clustering Algorithm. Applied Sciences. 2022; 12(4):2115. https://doi.org/10.3390/app12042115
Chicago/Turabian StyleSon, Woo-Ju, and Ik-Soon Cho. 2022. "Analysis of Trends in Mega-Sized Container Ships Using the K-Means Clustering Algorithm" Applied Sciences 12, no. 4: 2115. https://doi.org/10.3390/app12042115
APA StyleSon, W.-J., & Cho, I.-S. (2022). Analysis of Trends in Mega-Sized Container Ships Using the K-Means Clustering Algorithm. Applied Sciences, 12(4), 2115. https://doi.org/10.3390/app12042115


