Article

Improving Human Activity Recognition for Sparse Radar Point Clouds: A Graph Neural Network Model with Pre-Trained 3D Human-Joint Coordinates

Department of Artificial Intelligence, Dongguk University Seoul, 30 Pildong-ro 1 Gil, Seoul 04620, Korea
*
Author to whom correspondence should be addressed.
Appl. Sci. 2022, 12(4), 2168; https://doi.org/10.3390/app12042168
Submission received: 24 January 2022 / Revised: 8 February 2022 / Accepted: 17 February 2022 / Published: 18 February 2022
(This article belongs to the Special Issue AI, Machine Learning and Deep Learning in Signal Processing)

Abstract

:
Many devices have been used to detect human action, including wearable devices, cameras, lidars, and radars. However, some people, such as the elderly and young children, may not know how to use wearable devices effectively. Cameras have the disadvantage of invading privacy, and lidar is rather expensive. In contrast, radar, which is widely used commercially, is easily accessible and relatively cheap. However, due to the limitations of radio waves, radar data are sparse and not easy to use for human activity recognition. In this study, we present a novel human activity recognition model that consists of a pre-trained model and graph neural networks (GNNs). First, we overcome the sparsity of the radar data. To achieve that, we use a model pre-trained with the 3D coordinates of radar data and Kinect data that represents the ground truth. With this pre-trained model, we extract reliable features as 3D human joint coordinate estimates from sparse radar data. Then, a GNN model is used to extract additional information in the spatio-temporal domain from these joint coordinate estimates. Our approach was evaluated using the MMActivity dataset, which includes five different human activities. Our system achieved an accuracy of 96%. The experimental result demonstrates that our algorithm is more effective than five other baseline models.

1. Introduction

Recently, human action detection has become increasingly important in a variety of industries, such as healthcare for elders. A wide variety of devices for human activity recognition have been proposed, including cameras, wearable devices, lidar, and radar.
Tufek et al. [1] recognized daily activities using wearable sensors, which were implemented with accelerometers, gyroscopes, and wireless radio frequency modules. A three-layer long short-term memory (LSTM) model with a data balancing algorithm was used on the UCI HAR benchmark dataset, and the ETEXWELD dataset was collected. Although the model achieved high accuracy rates, wearable devices must be worn on body parts, such as the chest, during data collection, which can be quite cumbersome during actual use.
Li et al. [2] proposed vision-based fall detection methods that worked on recorded videos or real-time video streams. Three algorithmic pipelines for multi-level tasks were designed, where the pipelines consisted of the frame-level algorithm pipeline (FLAP), the sequence-level algorithm pipeline (SLAP), and the video-level algorithm pipeline (VLAP), and each pipeline focused on a different feature representation. For example, for the sequence level fall detection (SLFD) task, the authors proposed a dynamic pose motion (DPM) representation to capture a flexible motion extraction module. However, such approaches that use cameras have the problem of privacy invasion.
Lidar and radar have often been compared in the study of human activity recognition. Luo et al. [3] proposed using a 2D lidar to recognize human activities by classifying people’s motion trajectories. They used spatial transformation and Gaussian noise for trajectory augmentation. Then, two neural networks, including an LSTM network and a temporal convolutional network (TCN), were used on trajectory samples collected from a kitchen. These two networks outperformed the hidden Markov model (HMM), dynamic time warping (DTW), and support vector machine (SVM) by a wide margin.
Radar has several advantages over lidar. First, it is not strongly affected by weather conditions. The radio waves used in radar have a small degree of absorption, so this technology can work well even under bad weather conditions, whereas lidar is vulnerable to weather, such as fog and snow. Second, miniaturization technology is also more highly developed for radar than for lidar. Therefore, radar has been widely used in the defense field, such as in fighter jets, which must operate even in bad weather.
One disadvantage of radar is that it produces rather sparse data, because the radio waves emitted by radar have weak straightness. In addition to wavelength problems, inherent noise is also a cause of the sparsity in radar data [4]. Accordingly, many studies have investigated ways to effectively combine radar with camera sensors to perform more accurate detection and object identification than is possible using radar alone. With the impressive growth of machine learning and deep learning techniques, new methods for processing sparse radar data have been proposed.
Singh et al. [5] selected voxelization to pre-process radar data and achieved greater than 90% accuracy with deep learning classifiers. Sengupta et al. [6] also adopted a voxelization method, and in order to predict skeletal key points, mmPose-NLP (Natural Language Processing) architecture, which employed extracted features from the voxelized data, was presented.
Excluding voxelization, artificial sampling and grouping methods for radar data have also been considered. An et al. [7] collected the following five radar data elements: the spatial coordinates of the point (x, y, z), Doppler velocity, and signal intensity. They transformed raw radar data into a 3D five-channel stacked feature map instead of using voxelization. These feature maps were fed to a simple convolution neural network (CNN) model called MARS to predict 19 human joints. The 2D form can also be used. Alujaim et al. [8] measured seven different human motions using a 2D planar phased array. The motions were processed using a deep convolutional neural network (DCNN) and achieved above 90% accuracy on both the training and validation datasets. Sun et al. [9] attempted to produce dense and smooth point clouds. They resampled the number of points in a frame to achieve a fixed number of points in each frame. The Agglomerative Hierarchical Clustering (AHC) was used for upsampling, while the K-means algorithm was used for downsampling. In the AHC algorithm, each cluster’s centroid was added to the point cloud as a new point until reaching a fixed number of points in an experiment. On the other hand, the K-means algorithm made the fixed number of points (K) per frame and selected the centroids of the clusters as the data points in the point cloud. However, in this method, there is a problem that duplicate values occur when the number of point clouds in the collected data is less than half of the fixed number of points.
In this paper, we introduce a new model to solve these challenges without using a combination of radar and other sensors or converting radar data into regular voxels.
First, we address the sparsity of radar data. Most previous studies have proposed voxelization-based approaches. However, the voxelization process involves high computational cost. Furthermore, to improve the generality of the proposed model, a new method that only requires the 3D coordinates of radar data and demands low computation is proposed. Other data, such as Doppler and intensity data, do not need to be pre-processed, and therefore do not incur a high computational cost. We develop a pre-trained model that represents 25 human body joints to map point clouds to Kinect data [7]. The pre-trained model is used to extract 3D human joint coordinate estimates from radar data. Second, considering each joint point as a vertex of a graph, and the line connecting the adjacent joints as an edge in the graph, we propose a classification model based on graph neural networks (GNNs) [10] using these estimates. The main contributions of this paper are as follows:
  • We propose a novel human activity recognition model that uses estimated 3D human joint coordinate data from sparse radar data with low computational cost, rather than other complex pre-processing methods, such as voxelization.
  • We design a spatial-temporal graph convolutional network (ST-GCN)-based model to predict human activities by optimized spatio-temporal feature extraction.
  • We demonstrate improved performance by our model on the task of human activity recognition. Our model achieves 96% accuracy, which is better than the accuracy of the existing baseline models [5].
This paper is organized as follows. Section 2 describes relevant previous work. Section 3 introduces the dataset used in this research and explains our proposed model. The performance results are discussed in Section 4. Finally, Section 5 provides the conclusions drawn from the presented approach and describes our future work.

2. Related Work

Many studies have been conducted using mmWave radar to detect human action. Most of these studies have focused on pre-processing data to improve the classification. Because the format of the data received by radar differs depending on the experimental setting [11,12] or the data collection tool used, the pre-processing method is not unified.
Singh et al. [5] used a TI IWR1443 mmWave radar and collected radar data using a robot operating system (ROS) package [13] as follows: the number of point clouds, spatial coordinates of the points (x, y, z), range, velocity, Doppler bin, bearing, and intensity. They selected voxelization to pre-process these data, and each sample had the dimensions 60 × 10 × 32 × 32 (depth = 10). These dimensions were decided empirically by testing the model performance. After voxelization, five classifiers were evaluated: SVM, multi-layer perceptron (MLP), LSTM, and CNN combined with LSTM. Overall, all proposed machine learning approaches showed a high performance of up to 90.47%. However, the dimensionality of each input sample (60 × 10 × 32 × 32 = 614,400) meant that the voxelization method resulted in significant increases in the memory requirements.
Sengupta et al. [6] also pre-processed radar data in a voxelized form. One difference from [5] is that Sengupta et al. regarded this process as equivalent to the tokenization of natural language processing (NLP). After extracting features from the voxelized data, skeletal key points were predicted using a proposed mmPose-NLP architecture. They compared these predictions with the ground truth obtained from Kinect. However, the problem of high computation cost remains, because the process takes two steps: voxelization of the radar point cloud data, and conversion back to real-world 3D coordinates using a voxel dictionary.
An et al. [7] used TI IWR1443 Boost mmWave radar and a MATLAB runtime implementation from TI [14] for data acquisition. The raw radar data were transformed, without voxelization, into a 3D five-channel stacked feature map by the pre-processing method proposed. The channels of the feature map consisted of the spatial coordinates (x, y, z), Doppler velocity, and signal intensity. Because the authors fixed the number of point clouds to 64 per frame, 64 rows were converted to an 8 × 8 square matrix in the row-major order. These feature maps were regarded as images commonly used in CNNs. They were then fed to a simple CNN model called MARS, which predicted 19 human joints. In contrast to previous studies, there was no complicated pre-processing [15,16,17] or large model that caused an increase in the number of parameters. Therefore, the computational cost was relatively low.
Instead of 3D, a 2D form also could be used. Human motion detection using a 2D planar array was proposed in [8]. Seven human motions, including bowing, kicking, punching, walking, running, sitting down, and standing, were measured using a 2D planar phased-array FMCW radar. A DCNN was used to process the array and capture the time-varying signatures of the point clouds. The training accuracy was 100%, and the validation accuracy was 80%.
This previous work shows that human activity recognition by radar must focus on obtaining reliable data from a radar. Most of the methods involved voxelization, but more simple methods without voxelization, as used in [7,8], have also been suggested.
As described in [6,7,18], once radar data are converted to a human joint position, there are many classification models that could be applied. Because each joint corresponds to a vertex of a graph, and the bone connecting adjacent joints corresponds to an edge, this human joint (or skeleton) form can be regarded as a graph structure. Thus, human activity recognition can be implemented using a GNN-based model [10].
Yan et al. [19] proposed the ST-GCN to recognize human activities through skeleton data. ST-GCN allowed the same human joints to be connected along the time axis, so that the graph structure included temporal information in addition to spatial information. Using this approach, the relationship between skeleton joints within one activity was automatically learned, which helped to classify human activity. To verify the necessity of features in the spatio-temporal domain, a basic GCN-based model [20] was tested, and the results are compared in Section 4.

3. Methodology

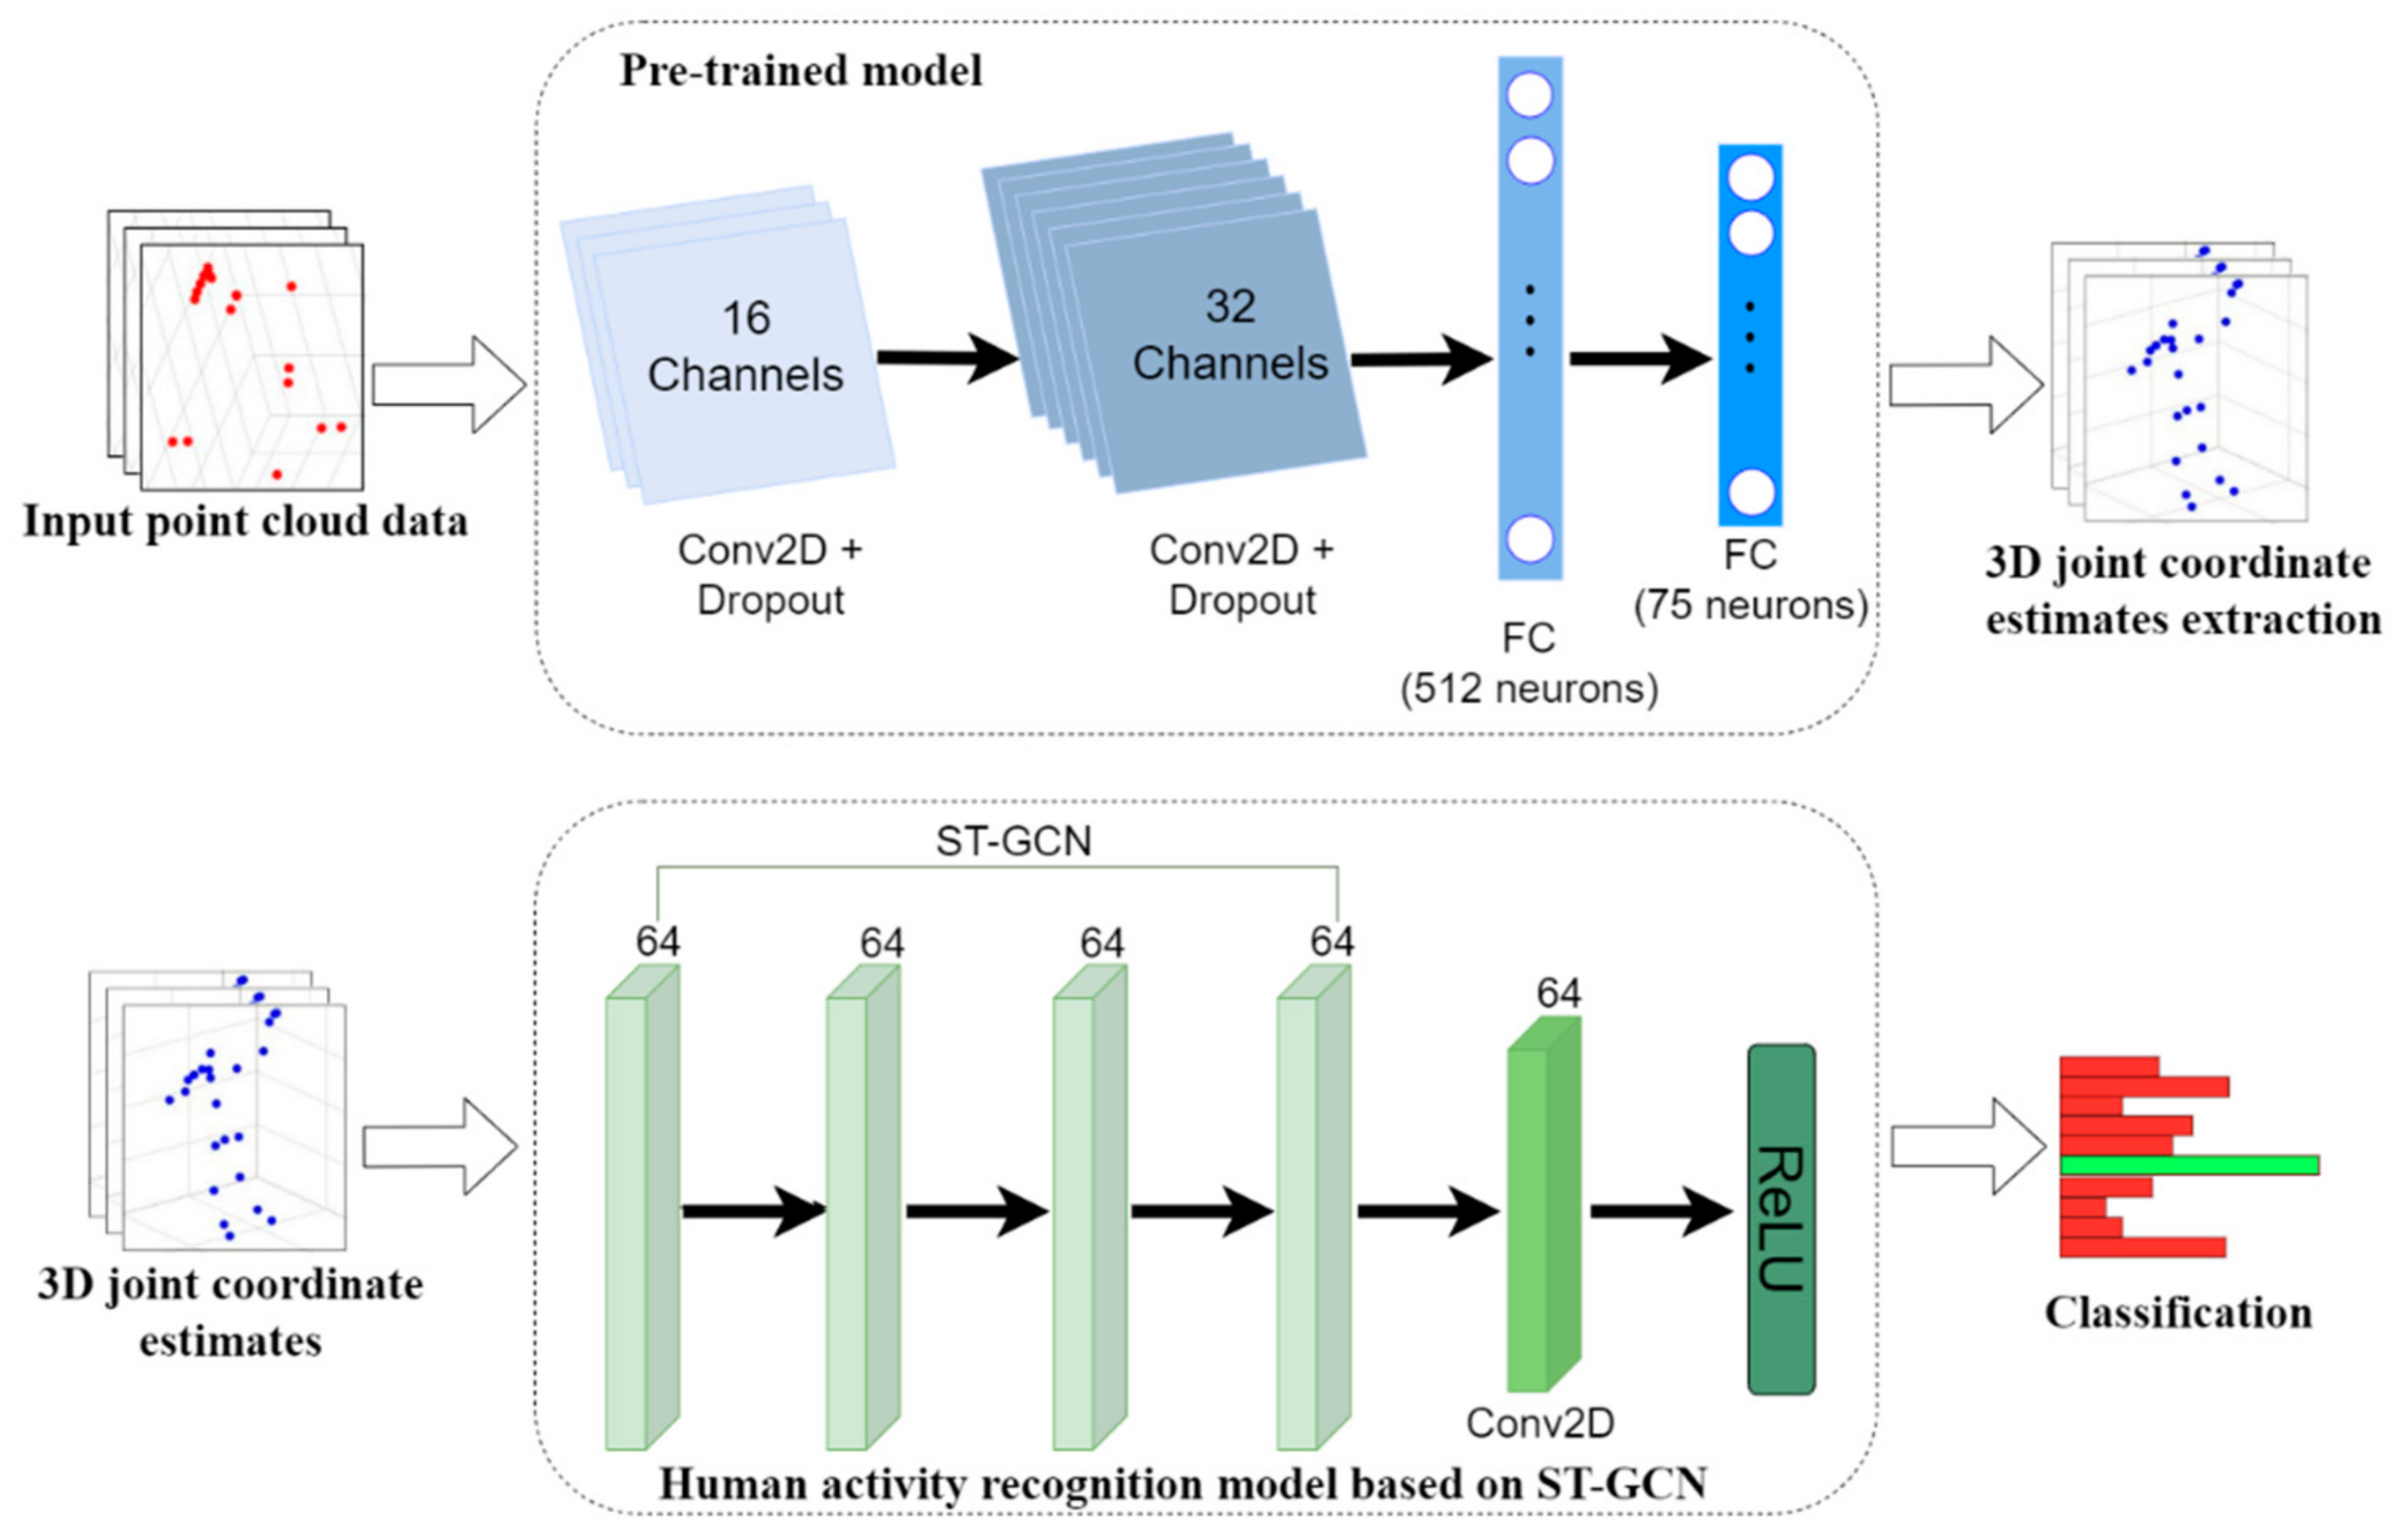
In this section, we introduce a human activity recognition model that used 3D human joint coordinate estimates from sparse radar data. First, we demonstrate how the sparsity of radar data was addressed. Due to the limitations of radio wavelength and inherent noise, radar data were sparse. We focus on this problem first.
Another problem authors consider is that data formats are related to the data collection tools used. Therefore, many prior studies designed a pre-processing method to fit each type of dataset.
Considering these two problems, we developed a more general method that used only the 3D coordinates of radar data, called point clouds, and so can be used for any dataset. Using this process, reliable features were extracted from sparse radar data. Second, we presented an ST-GCN-based model. To extract additional features in the spatio-temporal domain from joint coordinate estimates, we fed these joint estimates to an ST-GCN [19]. The entire architecture is illustrated in Figure 1.

3.1. Datasets

MARS. First of all, we selected the MARS dataset [7] (MARS is available at https://github.com/SizheAn/MARS, accessed on 25 October 2021). A MARS dataset was collected using both an IWR1443 Boost mmWave radar and a Kinect V2 sensor. Each participant engaged in one action listed in Table 1 for approximately two minutes. During that time, both Kinect and radar were placed on the same table. MATLAB Runtime from TI was used for the radar data acquisition. In the case of the Kinect V2 sensor, we used MATLAB to process the Kinect data as the 3D coordinates of human joints. The total number of participants was two, and the experimenters adjusted the sampling rate between the IWR1443 Boost mmWave radar and the Kinect V2 in order to map the radar data to the skeleton data by frame.
To the best of our knowledge, this is the first dataset that is provided in raw format without any other pre-processing, such as voxelization. In this work, the ground truth was the participant’s joint positions captured by the Kinect V2 sensor during the experiment.
MMActivity. MMActivity [5] provides only radar data collected from TI IWR1443 mmWave radar. Five different activities detected using MMActivity are described in Table 2. Two participants performed each activity in front of the radar for 20 s. In this experiment, the sampling rate was adjusted to obtain 30 frames of data per second. Data, including the 3D coordinates from the participants, range, Doppler bin, bearing, and intensity, were collected. In one frame, 20–30 data items were observed. Data were collected using a robot operating system (ROS) package [13] and it is available at https://github.com/nesl/RadHAR, accessed on 30 October 2019).

3.2. Pre-Training for 3D Human Joint Coordinate Estimates

As mentioned in Section 1, the radar emits radio waves. The radar radiates the transmission signal through the Tx antennas. This signal hits the object and returns back through the Rx antennas. The radar chip then calculates the object’s 3D coordinates, which are converted to a point cloud using a fast Fourier transform. Therefore, the 3D coordinates are necessarily stored. We decided to create a model that used these 3D coordinates to produce a more generally applicable model. We checked the raw 3D coordinates of the radar data. However, they were too sparse to be used to classify human activity. This sparsity problem can occur depending on the movements, because radar usually does not generate data for a static posture well. Thus, a new method that extracts more reliable features from radar data using a pre-trained model was developed.
First, we needed to pre-process the MARS dataset [7]. In the MARS dataset, the x, y, z, Doppler, and intensity were collected as radar data. Thus, we removed the Doppler and intensity and empirically fixed the number of point clouds to 25 per frame. If there were fewer than 25 points, the rest of the frame was padded with zeros. We then reshaped a 5 × 5 × 3 matrix as shown in Figure 2, in which three channels represent x, y, and z. This 5 × 5 × 3 matrix in one frame was paired with the Kinect data in the same frame.
The pre-trained model that the authors [7] used consisted of 2 consecutive convolution layers with 16 and 32 channels, and 2 consecutive fully connected layers with 512 neurons and 75 neurons, as shown in Figure 1. Originally, because the final output of the pre-trained model [7] contained 57 neurons, 19 human joint estimates were obtained. It was confirmed that 6 joints were dropped from given raw dataset in the training, validation, and test sets, even though the raw dataset included 25 joints. The differences between the 19 joints used in [7] and the 25 joints are illustrated in Figure 3. As shown in Figure 3, the removed joints were the six points as follows: left hand, right hand, a tip of the left hand, left thumb, a tip of the right hand, and right thumb. To investigate the effectiveness of the 25 joints, 2 consecutive frames are visualized in Figure 4. The activity was a left upper limb extension on the MARS dataset [7].
However, for the data shown in Figure 4, distinguishing between the left activity and the right activity was very difficult with 19 joints. In addition to this simple visual diagram, the ablation study showed that the 25 joints give a more suitable feature representation of human joints, so we decided to use the 25 joints to provide more detailed information relevant to activity classification. Therefore, the number of neurons in the last layer was modified to extract more features from the radar data. We identified the frame numbers that were randomly selected in [7] and created new training, validation, and test sets that included the 25 joints.
The model was pre-trained with this pre-processed data using a batch size of 64 for 110 epochs. The other parameters were the same as were used in [7], and Adam was used as the optimizer with an initial learning rate of 0.001. After pre-training, we tested the model’s performance using the point cloud data in MMActivity [5]. The x, y, and z data sorted in frame order were converted to 3D human joint coordinate estimates. The MMActivity [5] dataset did not collect reference data from the Kinect root-mean-squared error sensor. Hence, the loss function metrics for evaluation, such as the MAE and RMSE, could not be defined in this process. The reconstructed 25 joints in boxing, jack, jumping, squats, and walk activities of the MMActivity dataset [5] are shown in Figure 5. The left figure represents the point cloud generated by radar in each activity and the right figure represents the 25 human joint coordinate estimates from the pre-trained model. The successful reconstruction of 25 human joints from the point cloud was observed.

3.3. Proposed Human Activity Recognition Model

We propose a novel human activity recognition model that combines this pre-processing method with GNNs. Human activity recognition was conducted using these joint estimates as inputs to the GNNs. Two models were developed. One was a combination of 3D human joint estimates and a GCN, and the other was a combination of 3D human joint estimates and an ST-GCN.

3.3.1. Human Activity Recognition Model Based on GCN

Among the many models that work on graph data, the GCN is the most basic, powerful type of neural network. The inspiration behind the GCN was the CNN. CNNs have two important characteristics [21]. The first is weight sharing. In a CNN, learnable filters at each layer scan a certain receptive field of the image. As the filter moves through the image, the filter does not change, so every neighborhood of the image is processed by the same learnable filter. This process is known as weight sharing. Second, because of the weight sharing, the pixels of the activation map that is output by the convolutional layers are correlated. In the GCN, the features of the nodes determine the classification of the graph. Therefore, the node features are updated with the same weight (weight sharing), as shown in Equation (1):
H l + 1 = σ D ˜ 1 2 A ˜ D ˜ 1 2 H l W l
According to [20], A ˜ = A + I N is the adjacency matrix of the undirected graph with added self-connections. I N is the identity matrix, and the degree matrix D ˜ i i = j A ˜ i j .   W l is a layer-specific trainable weight matrix, and this same weight matrix is applied throughout the H l , where H l   N x D is the matrix of activations in the l t h layer.

3.3.2. Human Activity Recognition Model Based on ST-GCN

ST-GCN shows good performance in general, and it considers spatial and temporal dependencies. In the graph G = (V, E), V is the node set of joints, and E denotes both spatial edges connecting the body joints in one frame and temporal edges connecting each body joint over consecutive frames. We assume that the number of joints is N, the number of frames is T, and V = {vti| t = 1,…, T, i = 1,…, N}. Based on [22] and using a specific criterion, we group one root node and its neighbors into a partition set p . Then, a spatial-temporal block is expressed as follows:
H l + 1 = p = 0 p A ^ p H l W p l
where A ^ p = D p 1 2 A p D p 1 2 , and the rest of the notations are the same as in a GCN. A 2D-convolutional layer is also added.

4. Results

4.1. Results on MMActivity Dataset

Table 3 shows the total accuracy with baseline classifiers on the same dataset.
We included the baseline model accuracy provided in a related study [5]. In the baseline models, radar data were voxelized and fed into a set of classifiers, and each sample had to maintain consistent dimensions during this process. The time-distributed CNN + Bi-directional LSTM model, the best performer in the study [5], could capture spatio-temporal features because the architecture consisted of three time-distributed CNNs (convolution layer + convolution layer + maxpooling layer) followed by the Bi- directional LSTM layer and an output layer. Our proposed model achieved 96.55% accuracy, 6.08% higher than the accuracy from the time-distributed CNN + Bi-directional LSTM model. The result indicates that 3D human joint coordinate extraction as part of data augmentation can yield reliable features for sparse radar data. Then, ST-GCN model was applied. The results show that using the ST-GCN model is more appropriate than combining two deep learning classifiers to extract spatio-temporal features. This is because the time series classification problem, such as recognizing human activities, requires spatio-temporal features. Additionally, 3D human joint coordinates are more about complex graph structure, not a simple sequence structure. Hence, after extracting these joint coordinate estimates, ST-GCN model can automatically learn the edges suitable for recognizing human activities through these estimates.
The confusion matrix for the visualization of classification performance is shown in Figure 6. Note that boxing, jack, squats, and walking were classified 100% correctly. Jumping, however, was somewhat confused with squats. This is because similar movements are required for these two activities. For example, in the case of jumping, standing and jumping are repeated in one place, similar to sitting down and getting up in a squat. However, the other activities usually need to move around. As the confusion matrix reveals, the accuracy of human activity recognition based on mmWave radar may be difficult to capture for similar behavior, but generally shows good performance for distinguishing different activities.
Additional ablation studies were performed to demonstrate the necessity of each component in the proposed model and justify the design choice adopted by the proposed model. First, in Section 4.2, we compare 25 joints vs. 19 joints for distinguishing activity. An experiment to support this point is presented. Second, in Section 4.3, the necessity of patterns in the spatio-temporal domain is verified.

4.2. Ablation Study for Features from Sparse Radar Data

Ablation experiments were performed in order to evaluate the representations of the human body and explore the effect of joint numbers. Different 3D human joint coordinate estimates were generated by 19 and 25 joints, respectively. We trained both the ST-GCN and GCN models with differing numbers of 3D human joint coordinate estimates, while using the same hyperparameters and the training procedure described in Section 4.1. The accuracy results are shown in Table 4. The weighted F1 score was also calculated to take imbalanced data into account (boxing: 0.22, jack: 0.17, jumping: 0.19, squats: 0.17, walk: 0.24 in the test dataset). The F1 score is a weighted average of precision and recall, as shown in Equation (3):
F 1   score = 2 · Precision · Recall Precision   +   Recall  
where Precision is True Positive/(True Positive + False Positive), and Recall is True Positive/(True Positive + False Negative).
The ST-GCN and GCN models achieved similar performances for both 19 and 25 joints. Nevertheless, 25 joints led to a higher accuracy than did 19 joints. The confusion matrices of the models below are shown in Figure 7. First, the GCN model that used 19 joints had the worst performance except for walk, as described in Figure 7a. The ST-GCN model that used 19 joints as described in Figure 7b still confused jumping as squats and could not discriminate between boxing and walking. On the other hand, the GCN model that used 25 joints presented a more diverse distribution of the predicted labels, and its weighted F1 score was 0.109 higher than the GCN model that used 19 joints.

4.3. Ablation Study for Features from Spatio-Temporal Domain

Ablation experiments with and without spatio-temporal domain patterns were conducted. Table 5 describes the results, and the results also reveal the necessity of patterns in the spatio-temporal domain. For comparison with the model using raw data, the number of point cloud data points in each frame was reduced to 25, and if there were fewer than 25 points, the rest of the frame was padded with zeros.
Our proposed model achieved 96.55% accuracy, whereas an ST-GCN that used raw data achieved 62.07% accuracy. In the case of models based on GCNS, 46.55% accuracy was obtained using raw radar data. The GCN using joint coordinate estimates had an accuracy score of 48.27%, which was only around 1.72% higher than the GCN using raw data model. A notable point is that the classification produced by the GCN based model generally had lower accuracy than ST-GCN based model, indicating that both the spatial and temporal patterns from the data were critical to the classification process, as the temporal axis was well ordered in the dataset. The confusion matrices of the above models are also illustrated in Figure 7. The GCN model that used raw data (Figure 7d) showed the worst performance, and the predicted labels ranged from boxing to walking. The ST-GCN model that used raw data confused jack, jumping, and squats, but the weighted F1 score was 0.149 higher than the GCN using raw data model. These results also imply that both spatial and temporal patterns were critical even in the raw data.

5. Conclusions

This paper presents a human activity recognition model that uses point cloud data. Our model is very general in that it does not need other data to be pre-processed to overcome the sparsity of the radar data. Instead, our model uses 3D human joint coordinate estimates predicted by a pre-trained model. Only the 3D coordinates of radar data were used, and Kinect data was used as ground truth. With the model pre-trained using these data pairs, reliable features from the sparse point cloud data were obtained in the form of human joints. The first ablation study on both the 19 joints and 25 joints was conducted. From this ablation study, 25 joints were shown as proper feature representations for human activity representation. In addition, in the second ablation study, we compare the results with raw data and the ones with extracted 3D human joints, where we found that 3D human joint coordinates seemed to provide reliable features for sparse radar data. A GNN-based model, such as the GCN or ST-GCN, was designed because human joint data could be regarded as graph data having connectivity between bones. The second ablation study shows the effectiveness of the necessity of 3D human joint estimates and the patterns in the spatio-temporal domain from joint coordinate estimates. The entire schematic representation is shown in Figure 8. Even with this simple structure, we evaluated the performance of our method, and the classification accuracy was greater than 95%. Even with this simple structure, the classification accuracy of our method was greater than 95%. This paper proposes a classification model based on GNNs using 3D human joint coordinate estimates. Our experiments show that the proposed approach can extract reliable features from sparse radar data, and the GNN-based model can be used for classification. Although the model needs some improvement for distinguishing similar activities, such as jumping and squats, the proposed method presented in the paper can be used for tasks that are more sensitive to dynamic physical activities, such as elderly falls, and detecting emergency situations. In the next step, for suitable real-time detection, we plan to investigate additional data processing approaches to improve the model’s predictive ability.

Author Contributions

Conceptualization, G.L. and J.K.; methodology, G.L. and J.K.; experiment, G.L.; validation, G.L.; formal analysis, G.L.; Writing—original draft, G.L.; Writing—review & editing, G.L. and J.K.; visualization, G.L.; supervision, J.K.; project administration, J.K.; funding acquisition, J.K. All authors have read and agreed to the published version of the manuscript.

Funding

This research was supported by the MSIT (Ministry of Science and ICT), Korea, under the ITRC(Information Technology Research Center) support program(IITP-2022-2020-0-01789) supervised by the IITP(Institute for Information & Communications Technology Planning & Evaluation).

Institutional Review Board Statement

Not applicable.

Informed Consent Statement

Not applicable.

Data Availability Statement

Publicly available datasets were used in this study. The datasets can be found here: (1) MARS (https://github.com/SizheAn/MARS, accessed on 25 October 2021) and (2) MMActivity (https://github.com/nesl/RadHAR, accessed on 30 October 2019).

Conflicts of Interest

The authors declare no conflict of interest.

References

  1. Tufek, N.; Yalcin, M.; Altintas, M.; Kalaoglu, F.; Li, Y.; Bahadir, S.K. Human Action Recognition Using Deep Learning Methods on Limited Sensory Data. IEEE Sens. J. 2020, 20, 3101–3112. [Google Scholar] [CrossRef] [Green Version]
  2. Li, J.W.; Xia, S.T.; Ding, Q.G. Multi-level Recognition on Falls from Activities of Daily Living. In Proceedings of the 2020 International Conference on Multimedia Retrieval, Dublin, Ireland, 8–11 June 2020; pp. 464–471. [Google Scholar]
  3. Luo, F.; Poslad, S.; Bodanese, E. Temporal Convolutional Networks for Multiperson Activity Recognition Using a 2-D LIDAR. IEEE Internet Things J. 2020, 7, 7432–7442. [Google Scholar] [CrossRef]
  4. Palipana, S.; Salami, D.; Leiva, L.A.; Sigg, S. Pantomime: Mid-Air Gesture Recognition with Sparse Millimeter-Wave Radar Point Clouds. Proc. ACM Interact. Mob. Wearable Ubiquitous Technol. 2021, 5, 27:1–27:27. [Google Scholar] [CrossRef]
  5. Singh, A.D.; Sandha, S.S.; Garcia, L.; Srivastava, M. Radhar: Human activity recognition from point clouds generated through a millimeter-wave radar. In Proceedings of the 3rd ACM Workshop on Millimeter-Wave Networks and Sensing Systems, Los Cabos, Mexico, 25 October 2019; pp. 51–56. [Google Scholar]
  6. Sengupta, A.; Cao, S. mmPose-NLP: A Natural Language Processing Approach to Precise Skeletal Pose Estimation using mmWave Radars. arXiv 2021, arXiv:2107.10327. [Google Scholar]
  7. An, S.; Ogras, U.Y. MARS: mmWave-based Assistive Rehabilitation System for Smart Healthcare. ACM Trans. Embed. Comput. Syst. 2021, 20, 1–22. [Google Scholar] [CrossRef]
  8. Alujaim, I.; Park, I.; Kim, Y. Human motion detection using planar array FMCW Radar through 3D point clouds. In Proceedings of the 2020 14th European Conference on Antennas and Propagation (EuCAP), Copenhagen, Denmark, 15–20 March 2020; pp. 1–3. [Google Scholar]
  9. Sun, Y.; Huang, Z.; Zhang, H.; Cao, Z.; Xu, D. 3DRIMR: 3D Reconstruction and Imaging via MmWave Radar Based on Deep Learning. arXiv 2021, arXiv:2108.02858. [Google Scholar]
  10. Xu, K.; Hu, W.; Leskovec, J.; Jegelka, S. How powerful are graph neural networks? arXiv 2018, arXiv:1810.00826. [Google Scholar]
  11. Shah, S.A.; Fioranelli, F. Human Activity Recognition: Preliminary Results for Dataset Portability using FMCW Radar. In Proceedings of the 2019 International Radar Conference (RADAR), Toulon, France, 23–27 September 2019; pp. 1–4. [Google Scholar]
  12. Takabatake, W.; Yamamoto, K.; Toyoda, K.; Ohtsuki, T.; Shibata, Y.; Nagate, A. FMCW Radar-Based Anomaly Detection in Toilet by Supervised Machine Learning Classifier. In Proceedings of the 2019 IEEE Global Communications Conference (GLOBECOM), Waikoloa, HI, USA, 9–13 December 2019; pp. 1–6. [Google Scholar]
  13. Zhang, R.; Cao, S. Real-time human motion behavior detection via CNN using mmWave radar. IEEE Sens. Lett. 2019, 3, 1–4. [Google Scholar] [CrossRef]
  14. Texas Instruments. Zone Occupancy. 2018. Available online: https://www.ti.com/lit/pdf/tiduea7 (accessed on 8 April 2021).
  15. Wang, Y.; Xiao, Y.; Xiong, F.; Jiang, W.; Cao, Z.; Zhou, J.T.; Yuan, J. 3dv: 3d dynamic voxel for action recognition in depth video. In Proceedings of the IEEE/CVF Conference on Computer Vision and Pattern Recognition, Nashville, TN, USA, 20–25 June 2021; pp. 511–520. [Google Scholar]
  16. Wang, K.; Wang, Q.; Xue, F.; Chen, W. 3D-skeleton estimation based on commodity millimeter wave radar. In Proceedings of the IEEE 6th International Conference on Computer and Communications (ICCC), Chengdu, China, 11–14 December 2020; pp. 1339–1343. [Google Scholar]
  17. Nobis, F.; Geisslinger, M.; Weber, M.; Betz, J.; Lienkamp, M. A Deep Learning-based Radar and Camera Sensor Fusion Architecture for Object Detection. In Proceedings of the 2019 Sensor Data Fusion: Trends, Solutions, Applications (SDF2019), Bonn, Germany, 15–17 October 2019; pp. 1–7. [Google Scholar]
  18. Sengupta, A.; Jin, F.; Zhang, R.; Cao, S. mm-Pose: Real-Time Human Skeletal Posture Estimation Using mmWave Radars and CNNs. IEEE Sens. J. 2020, 20, 10032–10044. [Google Scholar] [CrossRef]
  19. Yan, S.; Xiong, Y.; Lin, D. Spatial Temporal Graph Convolutional Networks for Skeleton-Based Action Recognition. arXiv 2018, arXiv:1801.07455. [Google Scholar]
  20. Kipf, T.N.; Welling, M. Semi-supervised classification with graph convolutional networks. In Proceedings of the 5th International Conference on Learning Representations, Toulon, France, 24–26 April 2017. [Google Scholar]
  21. Ren, S.; He, K.; Girshick, R.; Sun, J. Faster R-CNN: Towards Real-Time Object Detection with Region Proposal Networks. In Proceedings of the Advances in Neural Information Processing Systems 28 (NIPS 2015), Montreal, QC, Canada, 7–12 December 2015. [Google Scholar]
  22. Li, M.; Chen, S.; Chen, X.; Zhang, Y.; Wang, Y.; Tian, Q. Actional-Structural Graph Convolutional Networks for Skeleton-based Action Recognition. arXiv 2019, arXiv:1904.12659. [Google Scholar]
Figure 1. Our proposed model consists of a pre-trained model and ST-GCN. The pre-trained model, which is based on two consecutive convolution layers and two consecutive fully connected layers, extracts reliable features from the sparse point cloud data. These reliable features are obtained in the form of 25 human joints. The ST-GCN based model extracts additional features in the spatio-temporal domain from joint coordinate estimates and classifies human activities.
Applsci 12 02168 g001
Figure 2. Pre-processing of the MARS radar dataset. We empirically decided the dimension of the input to be 25 × 3. Then, 25 rows were reshaped into a 5 × 5 × 3 matrix.
Applsci 12 02168 g002
Figure 3. Visualization of the differences between the 19 joints used in [7] and the 25 joints. (a) 19 human joints; (b) 25 human joints.
Applsci 12 02168 g003
Figure 4. Examples of human joint graphs during left upper limb extension on the MARS dataset [7].
Applsci 12 02168 g004
Figure 5. Human joints created from point cloud data. On the left is raw point cloud data, and on the right is output from the pre-trained model.
Applsci 12 02168 g005aApplsci 12 02168 g005b
Figure 6. Confusion matrix of ST-GCN using 3D joint coordinate estimates.
Applsci 12 02168 g006
Figure 7. Confusion matrix of models used in the ablation study. (a) Confusion matrix of GCN using 19 joints. (b) Confusion matrix of ST-GCN using 25 joints. (c) Confusion matrix of GCN using 25 joints. (d) Confusion matrix of GCN using raw data. (e) Confusion matrix of ST-GCN using raw data.
Applsci 12 02168 g007
Figure 8. Schematic representation of the proposed model.
Applsci 12 02168 g008
Table 1. The 10 activity types of the MARS dataset [7].
NumberActivity
1Left upper limb extension
2Right upper limb extension
3Both upper limbs extension
4Left front lunge
5Right front lunge
6Squat
7Left side lunge
8Right side lunge
9Left limb extension
10Right limb extension
Table 2. The 5 activity types of the MMActivity dataset [5].
NumberActivity
1Boxing
2Jack
3Jumping
4Squats
5Walk
Table 3. Test accuracy on the MMActivity dataset [5].
Accuracy
SVM63.74
MLP80.34
Bi-directional LSTM88.42
Time-distributed CNN + Bi-directional LSTM90.47
ST-GCN using 3D joint coordinate estimates (ours)96.55
Table 4. Comparison of 3D human joint coordinate estimates on the MMActivity dataset [5].
AccuracyWeighted F1 Score
GCN using 3D joint coordinate estimates (19 joints)44.820.372
ST-GCN using 3D joint coordinate estimates (19 joints)81.030.800
GCN using 3D joint coordinate estimates (25 joints)48.270.481
ST-GCN using 3D joint coordinate estimates (25 joints)96.550.965
Table 5. Performance comparison with different features on the MMActivity dataset [5].
AccuracyWeighted F1 Score
GCN using raw data46.550.471
ST-GCN using raw data62.070.620
GCN using 3D joint coordinate estimates (25 joints)48.270.481
ST-GCN using 3D joint coordinate estimates (ours)96.550.965
Publisher’s Note: MDPI stays neutral with regard to jurisdictional claims in published maps and institutional affiliations.

